Article

Peonidin-3-O-glucoside and Resveratrol Increase the Viability of Cultured Human hFOB Osteoblasts and Alter the Expression of Genes Associated with Apoptosis, Osteoblast Differentiation and Osteoclastogenesis

by
Keila C. Ostos Mendoza
1,2,†,
Karen D. Garay Buenrostro
1,2,†,
Pinal N. Kanabar
3,
Mark Maienschein-Cline
3,
Nina S. Los
4,
Zarema Arbieva
4,
Nishikant A. Raut
5,6,
Temitope O. Lawal
5,7,
Alice M. López
2,8,
Paulina Cabada-Aguirre
2,8,
Diego A. Luna-Vital
9 and
Gail B. Mahady
2,*
1
School of Medicine and Health Sciences, Tecnológico de Monterrey, Av. Ignacio Morones Prieto 3000, Sertoma, Monterrey 64710, N.L., Mexico
2
Clinical Pharmacognosy Laboratory, Department of Pharmacy Practice, College of Pharmacy, PAHO/WHO Collaborating Centre for Traditional Medicine, University of Illinois at Chicago, Chicago, IL 60612, USA
3
Research Informatics Core, Research Resources Center, University of Illinois at Chicago, Chicago, IL 60612, USA
4
Core Genomics Facility, Research Resource Center, University of Illinois at Chicago, Chicago, IL 60612, USA
5
Department of Pharmacy Practice, University of Illinois at Chicago, Chicago, IL 60612, USA
6
Department of Pharmaceutical Sciences, Rashtrasant Tukadoji Maharaj Nagpur University, Nagpur 440033, India
7
Department of Pharmaceutical Microbiology, University of Ibadan, Ibadan 200132, Nigeria
8
Department of Chemistry and Nanotechnology, Tecnológico de Monterrey, Ave Eugenio Garza Sada 2501, Monterrey 64710, N.L., Mexico
9
Institute for Obesity Research, Tecnologico de Monterrey, Monterrey 64710, N.L., Mexico
*
Author to whom correspondence should be addressed.
These authors contributed equally to this work.
Nutrients 2023, 15(14), 3233; https://doi.org/10.3390/nu15143233
Submission received: 8 June 2023 / Revised: 10 July 2023 / Accepted: 11 July 2023 / Published: 21 July 2023
(This article belongs to the Special Issue Bone Metabolism and Plant-Derived Pharmaceuticals)

Abstract

:
High-throughput RNA-sequencing can determine the impact of nutrients and their combinations on gene transcription levels in osteocytes, and clarify the biological pathways associated with their impact on bone tissues. Previously, we reported that resveratrol (RES) and peonidin-3-O-glucoside (POG) increased osteoblastogenesis, as well as reduced osteoclastogenesis in transgenic teleost fish models. Here, we perform whole-genome transcriptomic profiling of osteoblasts treated with POG or RES to provide a comprehensive understanding of alterations in gene expression and the molecular mechanisms involved. Cultured human fetal osteoblastic hFOB 1.19 cells were treated with the test compounds, and then RNA was used to prepare RNA-seq libraries, that were sequenced using a NovaSeq 6000. Treatment with POG or RES increased osteoblast proliferation and reduced apoptosis. Transcriptomic profiling showed that of the 29,762 genes investigated, 3177 were differentially expressed (1481 upregulated, 1696 downregulated, FDR ≤ 0.05) in POG-treated osteoblasts. In the RES-treated osteoblasts, 2288 genes were differentially expressed (DGEs, 1068 upregulated, 1220 downregulated, FDR ≤ 0.05). Ingenuity® Pathway Analysis (IPA) of DGEs from RES or POG-treated osteoblasts revealed significant downregulation of the apoptosis, osteoarthritis and HIF1α canonical pathways, and a significant reduction in Rankl mRNA expression. The data suggest that RES and POG have both anabolic and anticlastogenic effects.

1. Introduction

Despite recent advances in treatment, osteoporosis continues to be a serious global health problem, impacting more than 200 million people worldwide and is associated with increased osteoporotic fractures and mortality rates [1,2]. Over the next 20 years, the risk of osteoporosis will continue to increase due to global aging, poor nutrition and a lack of weight-bearing exercise [1,2]. Thus, new integrative and nutritional approaches for the management of osteoporosis, and other metabolic bone disorders are urgently needed. These treatment strategies should focus on new agents that both reduce bone loss and increase bone mass. Despite significant developments of new antiresorptive agents, novel bone-anabolic agents are urgently needed, and should be used in conjunction with prophylactic measures such as optimal nutrition, functional foods, dietary supplements, weight training and fall prevention strategies.
The maintenance of bone homeostasis is highly organized and controlled by the activities of osteoblasts, osteoclasts and osteocytes, and is regulated by molecular signaling pathways that result in no net loss of bone [3,4,5]. The entire process is essential for maintaining bone mineral density and strength [3,4,5]. When these cells are functioning properly, bone homeostasis is maintained, and net bone mass remains intact. However, during aging and osteoporosis, there is increased osteoblast apoptosis, and the activities of osteoclasts are increased, thereby increasing bone resorption [6]. While new therapies for osteoporosis have primarily concentrated on inhibiting bone resorption, very few drugs have focused on decreasing osteoblast apoptosis to enhance the ability to build bone, in addition to reducing osteoclastogenesis and bone loss.
For more than a decade, research has shown that the ingestion of specific foods containing natural compounds, such as resveratrol and anthocyanins, improves bone mineral density and reduces bone loss [7,8,9,10,11,12,13]. Previously, we reported that anthocyanin-containing extracts of blackcurrants (BCE) and açaí increased osteoblastogenesis and decreased apoptosis in cultured human osteoblasts, and in Sp7/osterix:mCherry medaka (Oryzias latipes) by increasing Sp7/osterix and Runx2 expression [10,13]. Furthermore, specific natural compounds from BCE, namely peonidin-3-O-glucoside (POG) and cyanidin, significantly increased osteoblastogenesis and reduced osteoclastogenesis in transgenic medaka, while delphinidin-3-O-glucoside inhibited Rankl-stimulated osteoclastogenesis in col10a1:nlGFP/rankl:HSE:CFP medaka [11,12]. Both POG and RES increased Runx2 and Sp7/osterix expression in osteoblasts in double transgenic Sp7/osterix:mCherry medaka [11]. In col10a1:nlGFP/rankl:HSE:CFP medaka, both POG and RES suppressed Rankl-stimulated osteoclastogenesis and bone loss by reducing Rankl expression, suggesting that these compounds may not only reduce bone loss but also increase bone mass, and therefore may be useful for the management of metabolic bone disorders, including osteoporosis [11,12].
For this investigation, we have performed mRNA-seq using RNA isolated from cultured serum-starved osteoblasts treated with 10% FBS, POG or RES to analyze the effects of these compounds on the transcriptome. Using Ingenuity® Pathway Analyses (IPA), we have correlated differential gene expression induced by these treatments with associated canonical signaling pathways and networks in the osteoblast transcriptome that are involved with their mechanisms of action. Both POG and RES significantly altered differential gene expression (DGE), which overlapped with multiple canonical pathways in cultured hFOB human osteoblasts, including apoptosis, osteoarthritis and hypoxia-inducible factor signaling.

2. Materials and Methods

2.1. Culture and Treatment of hFOB Osteoblasts

The human fetal immortalized osteoblast line (hFOB 1.19) was obtained from the American Type Cell Culture (Manassas, VA, USA) and grown and maintained in a 1:1 mixture of Ham’s F12 Medium and Dulbecco’s Modified Eagle’s Medium, as we have described [10]. To serum starve the osteoblasts, they were subcultured in a medium that did not contain fetal bovine serum (FBS) for 24 h before treatment. The CellTiter-Glo® Luminescent cell viability assay and Caspase-Glo® 3/7 and Caspase-Glo® 8 apoptosis assays were used, as we have previously described, according to the manufacturer’s protocols [11]. For apoptosis, hFOB cells (serum-starved) and positive controls (grown with 10% FBS) were separately seeded in triplicate in 100 µL/well in opaque-walled 96-well plates at a density of 5 × 10⁴ cells and incubated overnight. POG and RES (1 g/mL) were added to a portion of the wells. Caspase-Glo® 3/7 and 8 reagents (Promega Corporation, Madison, WI, USA) were added and mixed and luminescence was determined using a Synergy HT Plate reader (Biotek, Winooski, VT, USA) and Gen5 1.11 software.
Purified peonidin-3-O-glucoside (POG) and resveratrol (RES) (purity > 95%; Polyphenols, Sandes, Norway) were analyzed as we have described [11]. For treatment, hFOB osteoblasts were plated in opaque-walled 96-well plates (5 × 10⁴ osteoblasts/well) in media containing FBS (10%) or media without FBS and incubated for 24 h. After incubation, RES or POG (1 µg/mL in triplicate) was added per well to serum-starved osteoblasts grown in media without FBS. Positive controls were osteoblasts grown in media containing 10% FBS plus vehicle solvent (0.01% DMSO), while negative controls were cells grown in media without FBS plus 0.01% DMSO. RNA was isolated from harvested osteoblasts using Trizol (ThermoFisher Scientific, Waltham, MA, USA) and used for RNA-Seq. Total RNA was quantified using a NanoDrop™ One Spectrophotometer, and the RNA quality was assessed on an Agilent 4200 TapeStation and RNA Screen Tape as we have previously described [14,15]. Remaining DNA concentrations were <10%.

2.2. mRNAseq Library Preparation, Validation, Quantification and qPCR

A Universal Plus mRNASeq kit was used to generate the mRNA-seq library (Tecan, Männedorf, Switzerland, PN: 0520B-A01) with 250 ng of the purified RNA and 15 PCR cycles, as we have described [14,15]. An Agencourt RNAClean XP system was used to clean up the amplified libraries (Beckman Coulter, Brea, CA, USA). Electrophoresis was performed using a 2200 TapeStation system and D1000 ScreenTape (Agilent, Santa Clara, CA, USA) to verify the library fragment size distribution, which was determined to be between 264 and 294 nt. The final library concentrations were determined by PCR analysis. A NovaSeq 6000 was used for sequencing using methods we have previously described [14,15]. For confirmation of gene expression, qPCR was performed as we have described using primers (Origene, Rockville, MD, USA) as listed in Supplemental Figure S3. Briefly, a Power SYBR Green RNA-to-CT 1-step kit (Applied Biosystems, Foster City, CA, USA) was used to reverse transcribe and amplify the total RNA according to the manufacturer’s instructions on a Step One Plus Real-Time PCR System (Applied Biosystem, Foster City, CA, USA).

2.3. Bioinformatics, Statistics and Database Annotation

Bioinformatics, statistics and raw data analysis were performed by the Research Informatics Core at the University of Illinois at Chicago (UIC-CRI). FastQC was used to generate the quality-control metrics for the RNA-seq data. Alignment of raw reads with the Human Reference Genome hg38 was performed using STAR and BWA MEM [14,16,17]. The ENSEMBL database (www.ensembl.org, accessed on 7 June 2023) was used to analyze differential gene expression (DGEs). Quantification of ENSEMBL genes was performed with FeatureCounts [18,19]. The exactTest in EdgeR was employed to determine differential expression statistics on raw expression counts [20,21]. Using the correction of Benjamini and Hochberg, p-values were corrected for multiple testing with the false discovery rate (FDR; q value) [22]. Categorization of differential gene expression (DGEs) into functional clusters was performed in EdgeR using the gene ontology (GO) function.

2.4. Ingenuity® Pathway Analysis (IPA)

Canonical signaling pathways and other biological networks that overlapped with differential gene expression were analyzed using the predicted protein function of ENSEMBL using the Ingenuity® Pathway Analysis software 01-22-01 (Qiagen, Germantown, MD, USA), as we have described [14,15,23]. Alteration of gene expression was filtered by FC of ≤−1 and ≥1 and an FDR ≤ 0.05 to determine overlapping canonical pathways in IPA’s databases [23].

2.5. Data Availability and Gene Expression Omnibus (GEO) Deposition

Data from the mRNA-seq were deposited into the NCBI’s Gene Expression Omnibus (GEO) [24,25] and are publicly available in GEO, series accession number GSE200684 (https://www.ncbi.nlm.nih.gov/geo/query/acc.cgi?acc=GSE200684, accessed on 7 June 2023).

3. Results

3.1. Serum Starvation Reduces Growth and Induces Apoptosis in Cultured hFOB Osteoblasts

The growth of human hFOB osteoblasts subcultured onto media containing no FBS + 0.01% DMSO (serum starvation, negative controls) for 24 h was significantly reduced by >50% (p < 0.01) as compared with positive control osteoblasts (media containing 10% FBS + 0.01% DMSO; Figure 1A,B). ATP levels in the negative controls (serum-starved osteoblasts) were also reduced by ~50% and caspase 3/7 activity was increased by 5-fold, indicating apoptosis. Similar to the positive controls (osteoblasts grown in FBS + 0.01% DMSO), treatment with 1 μg/mL of POG or RES increased viability, proliferation and reduced apoptosis in serum-starved osteoblasts as compared with negative controls (Figure 1C–F). Apoptosis was measured by a reduction in caspase 3/7 activities and gene expression in the apoptosis canonical pathway. The ATP concentrations were also increased in serum-starved cells by treatment with RES and POG as compared with negative controls (Supplemental Figure S1).

3.2. Transcriptomic and IPA Analysis of Osteoblast Apoptosis

Whole genome transcriptomic profiling showed that of the 29,762 genes that were investigated, positive controls (osteoblasts grown in media containing FBS + 0.01% DMSO) had 5285 differentially expressed genes, with 2861 upregulated and 2424 downregulated (FDR < 0.05) as compared with negative control osteoblasts grown without FBS + 0.01% DMSO. Transcriptomic and IPA analyses of negative control osteoblasts showed that, as compared with the positive controls, negative control osteoblasts had a significantly higher expression of genes involved in apoptosis. They also exhibited a significant downregulation of the antiapoptotic genes, Bcl-2, Bcl-XL and CCND1 (Figure 1B). While BIM (Bcl2L11 gene), BAD and caspases 3, 6, 7 and 9 were all significantly upregulated (Figure 1B), indicating induction of apoptosis, and decreased cell cycle progression and survival of osteoblasts grown in media without FBS. In addition, the expression of the tumor suppressors p63 and p53 mRNAs was downregulated in the positive control osteoblasts as compared with the negative control treated osteoblasts.
Analyses of DGEs in IPA showed that, as compared with the serum-starved negative controls, osteoblasts grown in media containing POG (1 μg/mL) or RES (1 μg/mL) exhibited a significantly higher expression of Bcl-2 genes (Figure 1D,F). For POG-treated osteoblasts, Bcl-2, Bcl-2A1 and Bcl-XL were significantly upregulated (FDR < 0.05), while antiapoptosis genes such as BIM (Bcl2L11 gene) were significantly downregulated (FDR < 0.05), favoring a reduction in apoptosis and the survival of osteoblasts (Figure 1D,F). In addition, the tumor suppressor p63 was significantly downregulated (−4 fold, FDR < 0.001). In RES-treated serum-starved osteoblasts, Bcl-2, Bcl-XL and Bcl-2A1 were significantly (FDR < 0.05) upregulated, while BIM (the Bcl2L11 gene), Bax, Bad and caspases 3 and 9 were significantly (FDR < 0.05) downregulated, favoring a reduction in apoptosis and the survival of osteoblasts (Figure 1F).

3.3. Transcriptomic Analysis of Treated Human hFOB Osteoblasts

The data from mRNA-seq was used to perform principal component analysis (PCA; Figure 2A). Distinct variations were noted between the positive control osteoblasts as compared with the negative control, as well as the treated (POG or RES, -FBS) hFOB osteoblasts (Figure 2A). The positive and negative controls, and the RES and POG treatment groups, were distinctly clustered and separated from each other in the same PCA plot, validating the different gene expression between positive and negative controls and negative control versus POG or RES treatment groups. An Analysis of 29,762 genes was performed. As compared with negative controls, POG treatment of serum-starved osteoblasts differentially altered the expression of 3177 genes (1481 upregulated and 1696 downregulated, FDR ≤ 0.05). RES treatment of serum-starved osteoblasts showed significant alteration of 2288 genes (1068 upregulated and 1220 downregulated, FDR ≤ 0.05). When compared with negative control osteoblasts, POG and RES had an overlap of only 18 DGEs with a Log FC of <−1 to >1 (Figure 2B).
Ingenuity® Pathway Analysis (IPA) was used to assess the overlap in DGE after treatment and determine the canonical pathways and molecular networks impacted by treatments. The ratio of DGEs from the mRNA-seq data was correlated with the total number of reference genes in the IPA canonical pathways, using the Fisher’s exact test (p < 0.05) to measure significance. The ENSEMBL database was used to determine DEG enrichment in a particular canonical pathway.
IPA analysis revealed that, as compared with negative controls, differential gene expression in POG-treated osteoblasts overlapped with 125 canonical pathways, while DGE in RES-treated osteoblasts overlapped with 53 canonical pathways (Log FC of <−1 to >1, FDR < 0.05; Figure 3A,B). The top 12 canonical pathways (Z-score > 2.5) are shown in Figure 3C,D. The osteoarthritis canonical pathway was the most significantly downregulated pathway (Z-score > 2.5, q < 0.05). A bubble plot with connected canonical pathways impacted by RES treatments of serum-starved hFOB human osteoblasts is presented in Figure 3A. The bubble plot shows the canonical pathway name (Y axis) and correlated Z score (X axis), with red bubbles indicating upregulation of the pathway and blue bubbles representing downregulation of the pathway. The bubble size is indicative of the number of genes that overlap the pathway. Figure 3B shows the top 12 canonical pathways in RES-treated osteoblasts, with the genes impacted, and their p-values, adjusted by the correction of Benjamini and Hochberg for multiple testing (B-H-p values). Supplemental Figure S3C is a bubble plot of the interconnected canonical pathways impacted after POG treatment of serum-starved hFOB human osteoblasts. Figure 3D shows the top 12 canonical pathways associated with RES treatment of serum-starved osteoblasts, including the number of genes, and p-values, adjusted using the correction of Benjamini and Hochberg for multiple testing (FDR).
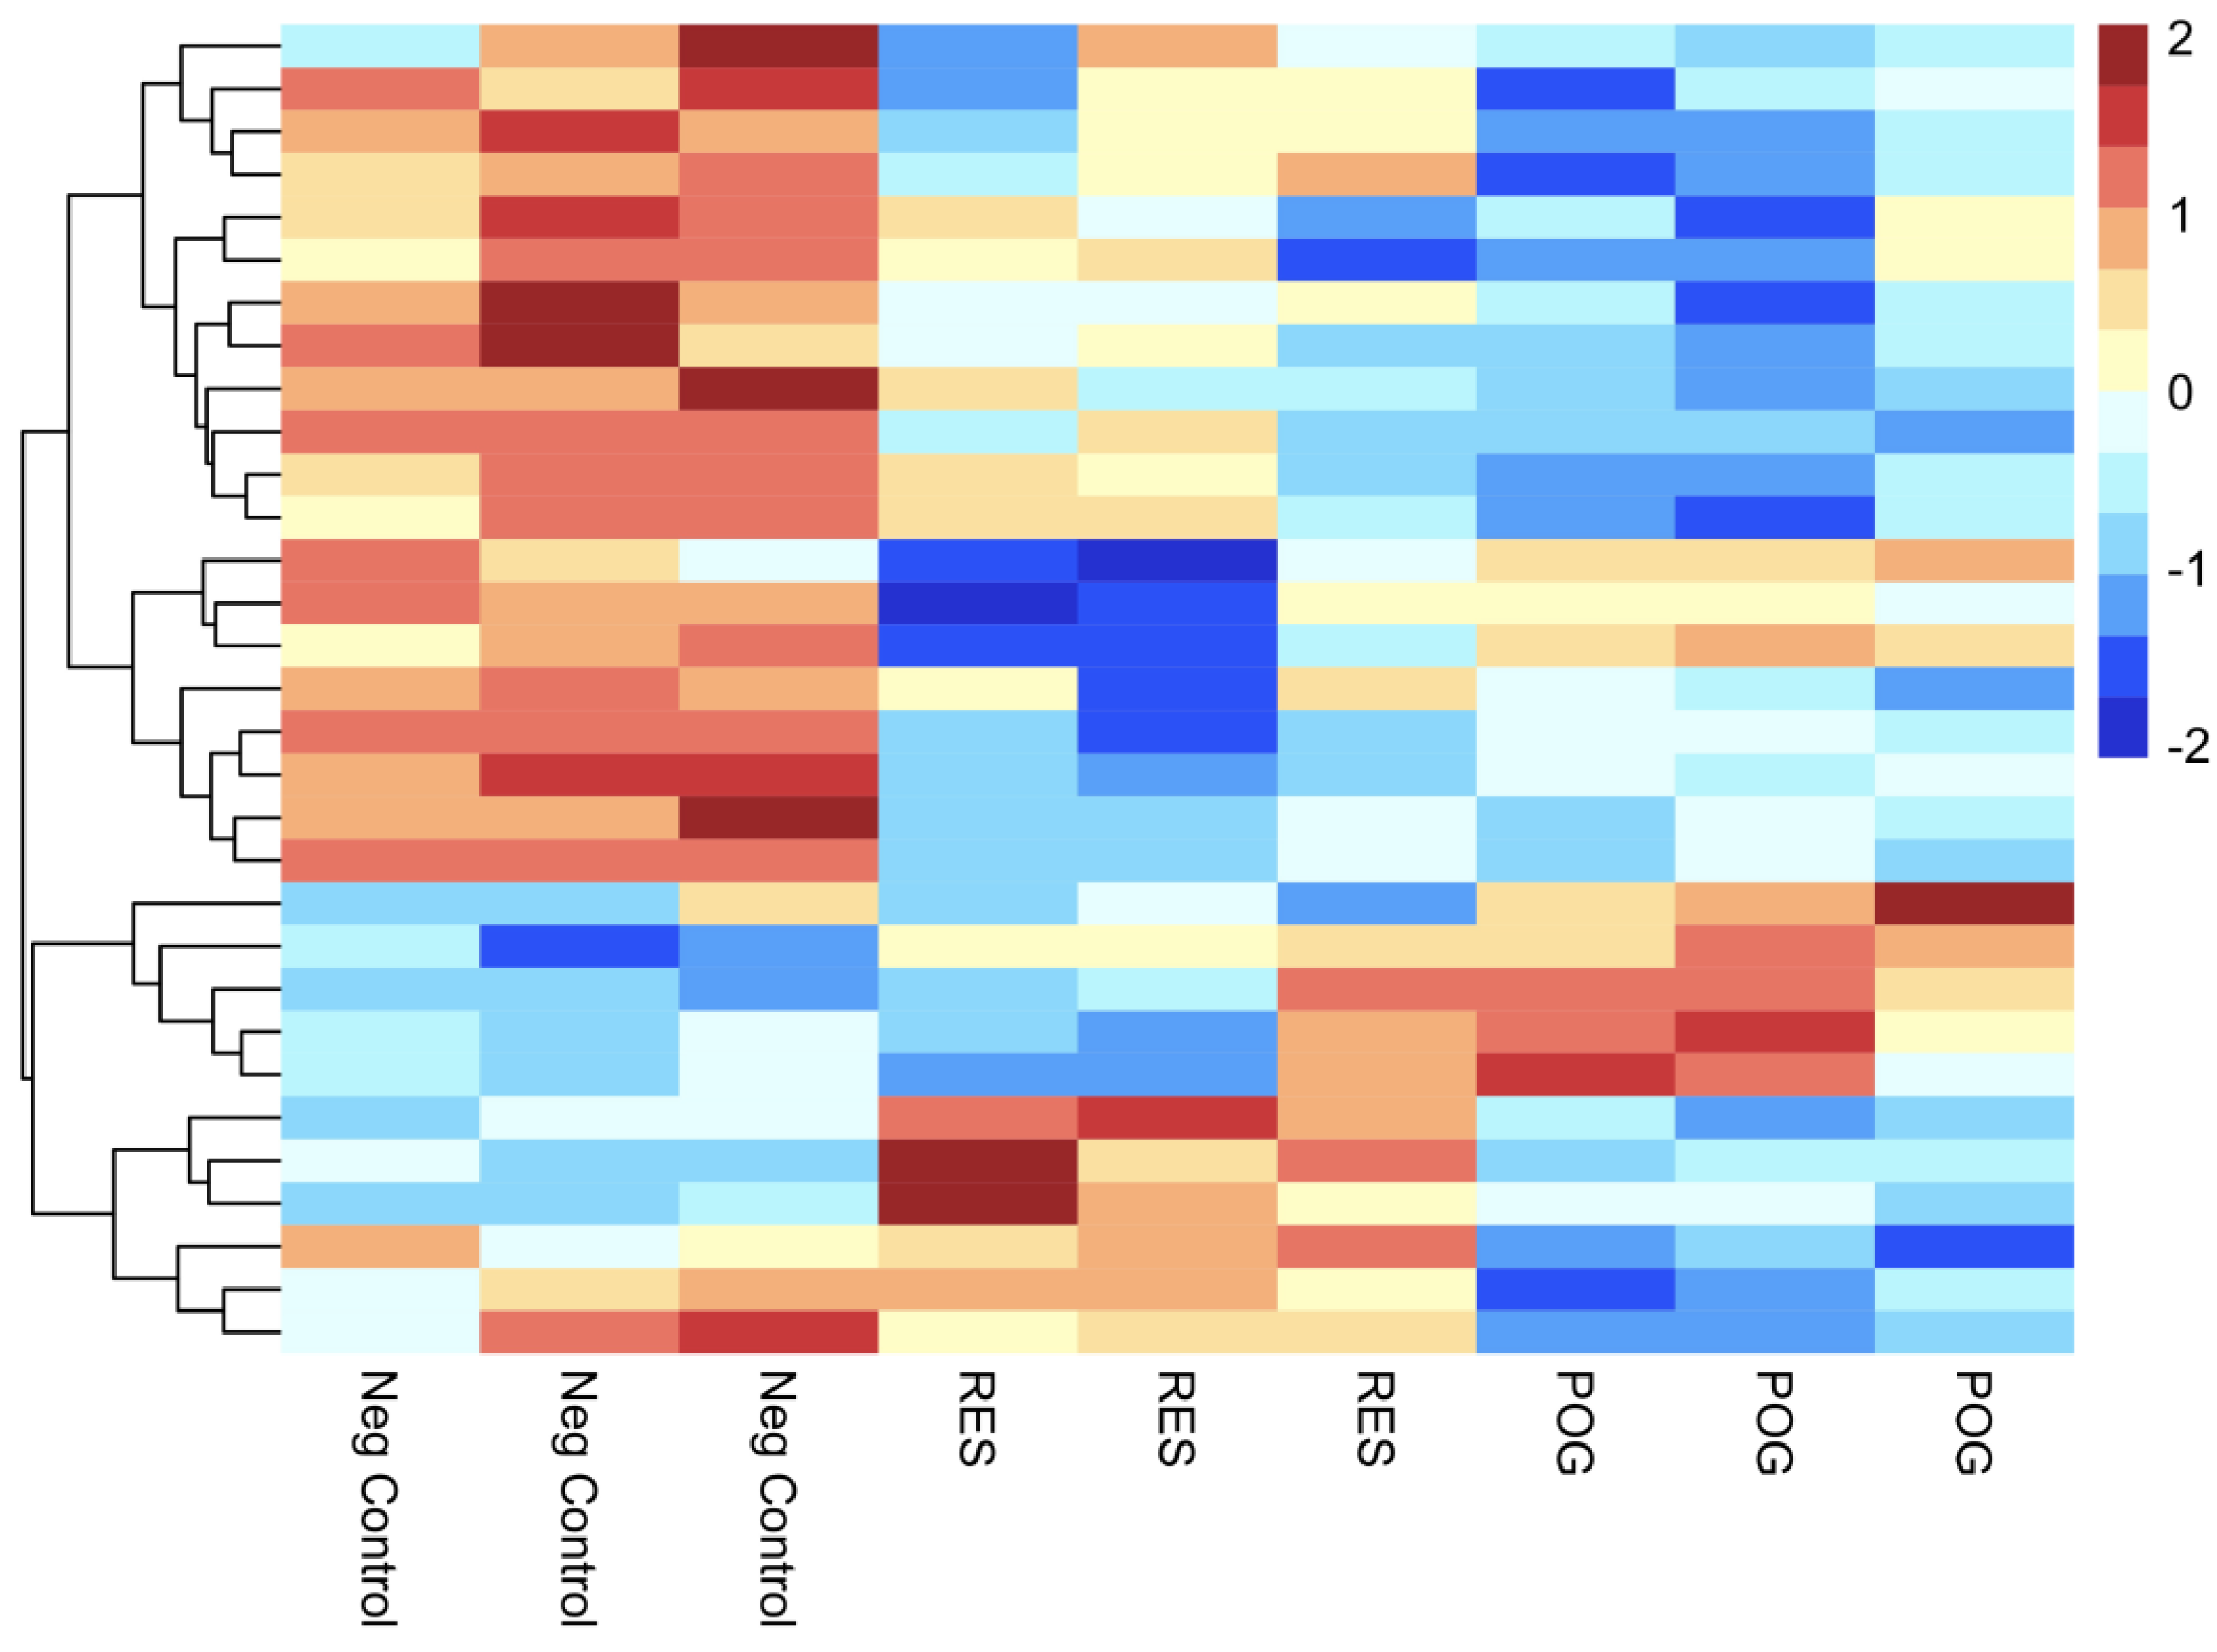
Figure 4 represents a heatmap of the top 30 DGEs, including hierarchical clustering of DGEs for cultured hFOB osteoblasts treated with POG or RES, as compared with negative control osteoblasts (-FBS + 0.01% DMSO), using a false discovery rate of ≤0.05 and FC of ≤−1 or ≥ 1. Dissimilar gene expression was observed between negative controls and RES- or POG-treated osteoblasts in the heatmap, showing changes in gene expression after treatments and the reliability of the DEGs. The top 10 DGEs are shown in Table 1 for POG-treated and RES-treated serum-starved osteoblasts, respectively.

3.4. Analysis of Osteoblastogenesis, Rankl and HIF Signaling Networks

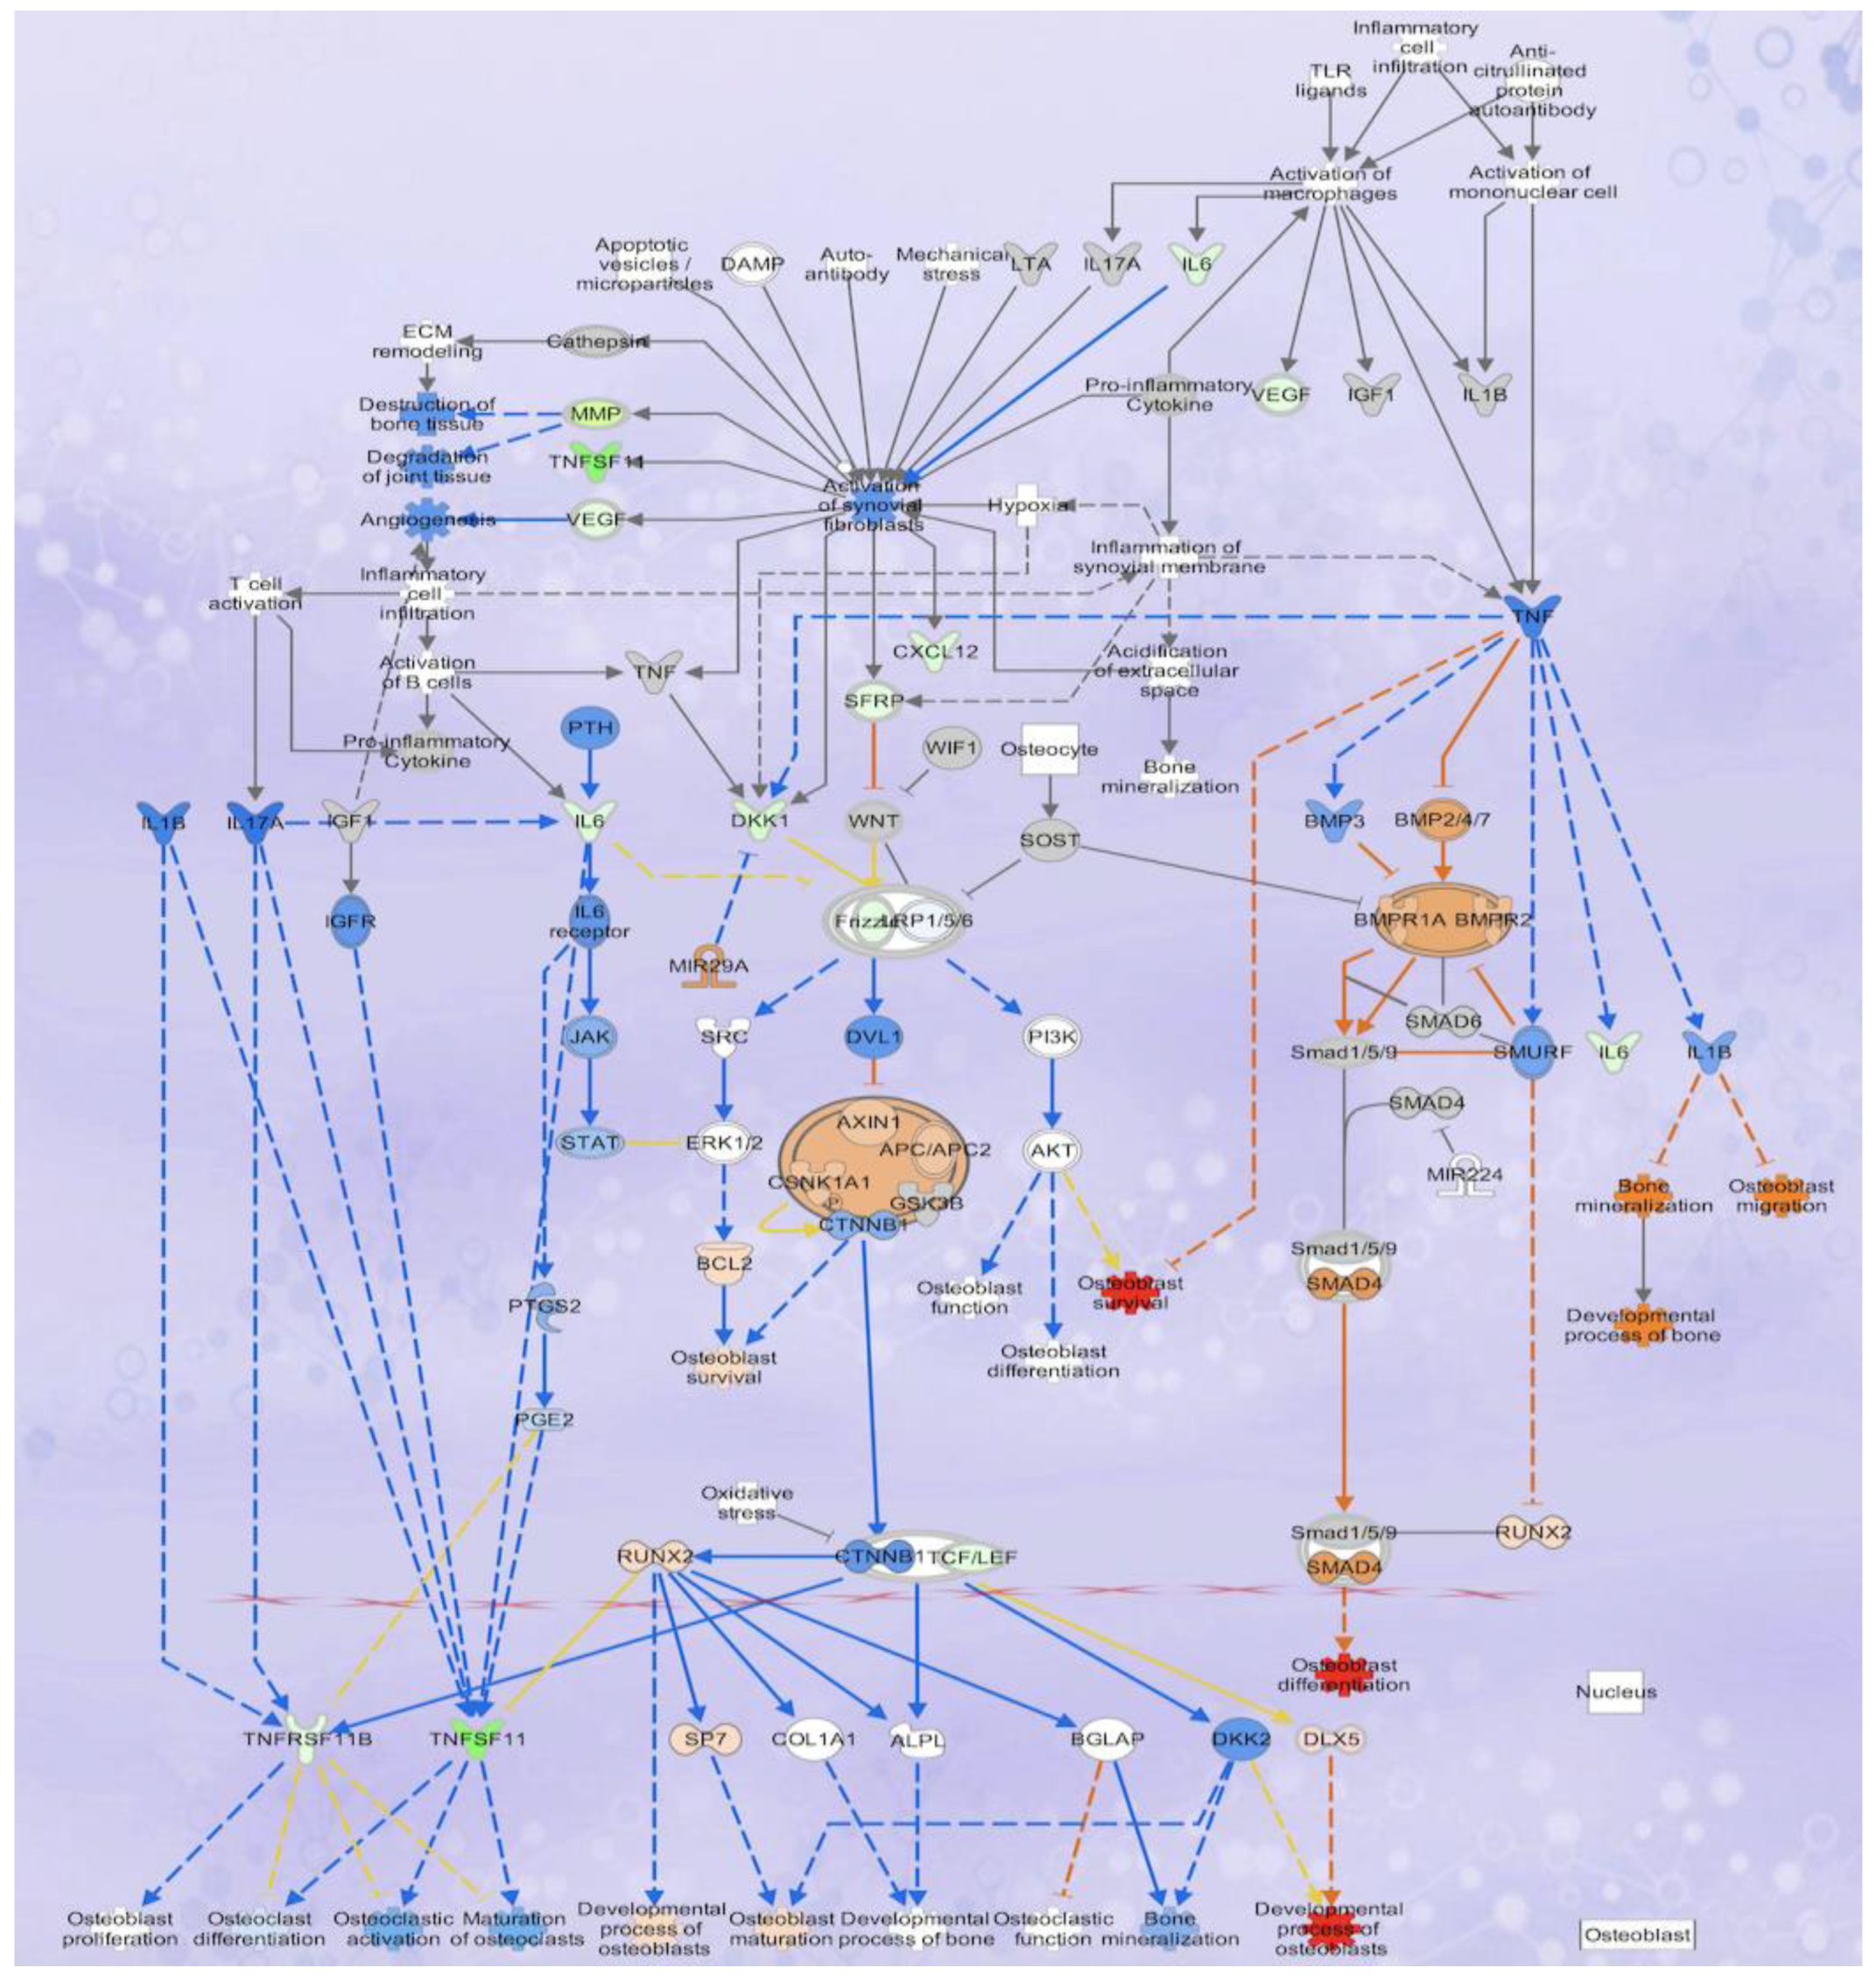
The overlap of DGEs in POG and RES-treated osteoblasts with specific canonical pathways and biological networks in the IPA database was analyzed. The primary canonical pathway downregulated was the osteoarthritis signaling pathway (Figure 3C,D) for both POG and RES treatments. In this canonical pathway, POG treatment of serum-starved osteoblasts significantly increased gene expression of Runx2, Sp7/osterix and DLX5 (5-fold, FDR < 0.05, Figure 5) as compared with negative controls (Figure 5), while RES-treated osteoblasts showed only a significant upregulation of IL18 mRNA expression (3-fold, FDR < 0.001). Both positive controls (10% FBS) and POG-treated serum-starved osteoblasts exhibited a significant downregulation of IL6 mRNA (FDR < 0.01, Figure 5). Both RES- and POG-treated serum-starved osteoblasts exhibited a significant reduction in Rankl (TNFSF11 gene, ~6 fold, FDR < 0.05, Figure 6A,B), as well as MMP1, MMP3 and ADAM12 mRNA expression (~2–3-fold reduction, FDR < 0.05). qPCR confirmed the mRNA-seq data for POG upregulation of Dlx5, Sp7/osterix and Runx2 (Supplemental Figure S3A–C). qPCR analysis of RES- and POG-treated osteoblasts confirmed downregulation of Rankl mRNA in treated osteoblasts (Supplemental Figure S3D,E).
Interestingly, POG treatment of serum-starved osteoblasts also led to a reduction in hypoxia induction factor 1α (HIF1α, ~1.5-fold FDR < 0.05, Figure 6A) mRNA expression and canonical pathway signaling. RES or POG treatment of osteoblasts with RES or POG led to a significant downregulation of the long noncoding RNA (lncRNA) HIF1α-AS2 gene expression (6-fold, FDR < 0.001 for both). In addition, both POG and RES treatments induced a significant increase in HIF1AN (an HIF1α inhibitor, FDR < 0.01) mRNA expression, a known HIF1α inhibitor. Hypoxic environments have been shown to reduce osteoblast viability and differentiation [26]. For example, osteoblast activity is lowered in environments with reduced oxygen, and osteoblasts grown in 2% oxygen reduced bone formation ~10 fold [26]. In vivo, osteoblast differentiation was reduced in hypoxic rats [27]. These results suggest that similar positive controls, both POG and RES, may improve osteoblast viability and activity by reducing the hypoxia-inducible response signaling canonical pathway.

4. Discussion

Experimental and clinical studies have shown that nutritional and dietary compounds, including anthocyanins, flavonoids, sulforaphane, and resveratrol, reduce bone loss and enhance bone formation [7,8,9,10,11,12,13,28,29,30,31,32,33]. For example, resveratrol treatments enhanced osteoblast viability and suppressed bone loss by altering BMP2, Runx2 and SIRT1 mRNA expression and reducing RANKL-stimulated bone loss [11,34,35,36]. Fruit extracts containing high levels of anthocyanins, as well as purified anthocyanins, decreased bone loss in animal models and increased osteoblast viability, suggesting that they have both antiresorptive and anabolic effects on bone tissues; however, the mechanisms have not been completely elucidated [7,8,9,10,11,12,13,37,38]. Previously, we reported that RES and POG treatment of Sp7/osterix:mCherry double-transgenic medaka enhanced osteoblastogenesis, and decreased Rankl-stimulated osteoclast formation and bone loss in col10a1:nlGFP/rankl:HSE:CFP triple transgenic medaka, suggesting that these two natural compounds have both anabolic and antiresorptive effects on bone [11]. Since our previous data suggested multiple mechanisms of action for these compounds, we established a global transcriptomic profile for cultured hFOB human osteoblasts treated with POG and RES to more fully understand the molecular and biological mechanisms of action.
In view of the fact that mRNA and proteins are the primary molecules responsible for cell viability and function, the use of deep RNA sequencing and proteomics can significantly increase our understanding of the biological and molecular changes occurring in cells treated with small molecules. In our investigation, whole transcriptome profiling using mRNA-seq revealed that of 29,762 genes in cultured serum-starved hFOB osteoblasts treated with POG, exhibited 3177 DGEs (1481 upregulated and 1696 downregulated, FDR < 0.05), while treatment with RES resulted in 2288 DGEs (1068 upregulated and 1220 downregulated). As compared with negative controls, POG and RES had an overlap of only 18 DEGs (Log FC of <−1 to >1, FDR < 0.05), suggesting the potential for different mechanisms of action. In addition, IPA analysis revealed that POG altered gene expression in osteoblasts that overlapped with 125 canonical pathways, while RES altered genes in only 53 canonical pathways, indicating that POG has a more significant impact on cellular genomics.
Removal of FBS from the medium (serum starvation, negative controls) reduced the proliferation of osteoblasts and induced apoptosis as compared with positive controls. Transcriptomic analysis of these osteoblasts revealed that, as compared with the positive controls, the negative controls exhibited significantly higher expression of genes that favored apoptosis. Of interest were the significant downregulation of Bcl-2A1 (−2.5, FDR < 0.0001) and upregulation of BIM (FDR < 0.0001, Bcl2L11 gene) Bad and Bax in negative control serum-starved osteoblasts. These genes encode for the B-cell lymphoma 2 (Bcl-2) proteins that regulate apoptosis and induce mitochondrial cytochrome c release, thereby stimulating apoptosome formation and caspase 9 activation, initiating intrinsic apoptosis [39,40]. Bcl-2A1 has been reported to bind to BIM, Bak and Bax, three proapoptotic genes, and downregulate their expression [40,41]. As expected, BIM, Bak and Bax gene expression were upregulated in negative controls, indicative of apoptosis and supporting previous observations [40,41]. BIM expression activates Bax/Bak, thereby inducing apoptosis by mitochondrial release of cytochrome c and caspase (aspartate-specific cysteine protease activation) [41,42]. Confirming our previous work, removal of FBS from the media of hFOB osteoblasts induced apoptosis by altering gene expression for the Bcl-2 family of proteins to favor apoptosis [11]. Interestingly, RES or POG treatment (in low concentrations) of serum-starved osteoblasts led to improved viability and growth, as well as the downregulation of the canonical apoptosis pathway, similar to the positive controls. Whole-genome transcriptomic profiling of the same cells showed alterations in gene expression in the apoptosis canonical pathway, indicating that RES or POG treatments reduced apoptosis in serum-starved osteoblasts. As compared with negative controls, RES- and POG-treated serum-starved human osteoblasts exhibited a significant upregulation of Bcl-2, Bcl-XL and Bcl-2A1 mRNA (FDR < 0.05), while BIM (Bcl2L11 gene) and caspase 9 mRNA were significantly downregulated (FDR < 0.05). He et al. [43] previously reported that resveratrol reduced apoptosis in cultured mouse osteoblasts by increasing the expression of Bcl-2 proteins. However, alteration of Bcl-2A1 mRNA expression by RES in osteoblasts has not been previously reported. Transcriptomic analysis also showed that RES significantly downregulated BIM mRNA expression, as well as caspases 3 and 9. These results support those of Tang et al. [44], who showed that BIM expression was downregulated in rat osteoblasts grown in a high-glucose medium and treated with RES.
POG treatment of osteoblasts also improved cell growth and reduced apoptosis. Transcriptional analysis showed significant upregulation of Bcl-2, Bcl-2A1 and Bcl-XL (FDR < 0.05), and significant downregulation of mRNA expression of BIM (FDR < 0.05). We have previously reported that POG treatment increased the Bax/Bcl-2 ratio in osteoblasts as determined by qPCR and reduce cell apoptosis [10,13], however, alterations in BIM, Bcl-XL and Bcl2A1 gene expression have not been previously reported. Thus, both RES and POG in low concentrations appear to improve the cell culture milieu, similar to the addition of 10% FBS to the media, thereby improving osteoblast viability and transcriptionally altering gene expression associated with intrinsic apoptosis.
In addition to an increase in osteoblast viability, markers of osteoblast differentiation were also upregulated by RES and POG treatments. Osteoblast differentiation is a highly organized process and is regulated by the transcription factors, Runx2, Dlx5 and Sp7/osterix [45,46,47,48]. POG treatments of serum-starved osteoblasts significantly upregulated the expression of all of these transcription factors (FDR < 0.05) as compared with negative controls. Shakibaei et al. [49] reported that RES pretreatment of cultured, nicotinamide-treated mesenchymal stem cells significantly increased osteoblast differentiation by increasing the expression of Runx2 and decreasing the expression of PPAR-γ [49]. In our previous work, we reported that both POG and RES treatment of Sp7/osterix:mCherry Japanese medaka enhanced osteoblast differentiation, as well as upregulated the expression of Sp7/osterix, a zinc finger transcription factor [11]. Thus, the data presented in this work corroborates these previous investigations, and further supports the hypothesis that POG induces osteoblast differentiation by altering the expression of these critical transcription factors. Interestingly, POG, but not RES, significantly increased the expression of Dlx5 (Distal-Less Homeobox 5, 5-fold, FDR < 0.05) mRNA in serum-starved osteoblasts. In mammalian bone, there are six Dlx transcription factors (Dlx1-6) that are important for osteogenesis [46,47,48]. Dlx5 is expressed in early bone development and controls the expression of many bone-related genes, thus playing a central role in osteogenesis [46,47,48]. Coimmunoprecipitation studies have reported a link between Dlx5 and Runx2 and have further shown that Sp7/osterix is a direct target of both Dlx5 and Runx2 [46]. Thus, our data indicate that POG likely exerts an anabolic effect by increasing Dlx5, which then targets Runx2 and Sp7/osterix, resulting in osteoblast differentiation.
Osteoblasts are pivotal not only for bone-forming activities, but they are critical for maintaining bone homeostasis by altering the expression of molecules needed for osteoclast differentiation and function, including the receptor activator of NF-κβ ligand (Rankl) and osteoprotegerin (OPG) [50,51,52]. Rankl is expressed in osteoblasts and is released to bind to its receptor Rank on the osteoclast cell surface, which leads to the activation of osteoclastogenesis [50]. OPG is the receptor decoy for Rankl, and serves to prevent Rankl from binding to Rank, thereby inactivating osteoclasts [50]. Compounds that reduce the Rankl:OPG ratio can reduce osteoclastogenesis. Rankl, a transmembrane protein, is produced by osteoblasts and is cleaved to make the active soluble form by matrix metalloproteases (MMP3/7) and ADAM [50,51,52]. Interestingly, both estrogen and parathyroid hormone are known to reduce Rankl expression and increase OPG in osteoblasts, thereby increasing bone formation [51,52]. In this work, transcriptional analysis of RES- and POG-treated osteoblasts also showed a significant downregulation of TNFSF11 (Rankl) but little effect on OPG (TNFRSF11B). qPCR analysis of RES- and POG-treated osteoblasts confirmed downregulation of Rankl mRNA expression. However, reduced Rankl expression alone would lead to a reduction in the Rankl:OPG ratio, ultimately reducing osteoclast differentiation and bone resorption. In RES-treated osteoblasts, both MMP3 and ADAM were also significantly downregulated. Shakibaei et al. showed that high-density bone cultures treated with Rankl exhibited increased NF-κB activation, leading to the formation of tartrate-resistant acid phosphatase-positive multinucleated cells that resembled osteoclasts [53]. Pretreatment of this cell line with RES reduced the effects of Rankl by suppressing the activity of the enzyme IκBα kinase [53]. Ameen et al. reported that male rats treated with RES had reduced Rankl expression, and reduced age-dependent bone loss [54]. Furthermore, previously we reported that both POG and RES reduced Rankl-stimulated bone loss and osteoclast differentiation in triple transgenic medaka [11]. Thus, this work supports these previous investigations and further suggests that both MMP3 and ADAM may be involved in the mechanism by which RES reduces Rankl expression.
Of note, downregulation of Rankl expression in POG-treated serum-starved osteoblasts was associated with downregulation of the hypoxia-inducible factor (HIF-1α) canonical pathway. Hypoxia, a reduction in blood oxygen levels, leads to reduced ATP production in the mitochondria by oxidative phosphorylation, and increased oxidative stress and toxic reactive oxygen species accumulation, which are correlated with bone resorption [55,56,57]. Signaling in this pathway is mediated by hypoxia-inducible factors (HIFs), whose expression remains low under normal oxygen levels but is increased during hypoxia [58,59]. Hypoxia and HIF-1α have been associated with numerous metabolic bone disorders, including osteoporosis, osteonecrosis and disorders that impact osteoclast differentiation [58,59,60,61]. Hypoxic conditions have been reported to reduce osteoblast activity and differentiation through reduced Runx2 expression [62]. In addition, increased HIF-1α/RANKL/Notch1 signaling stimulated macrophage differentiation into osteoclasts [63]. Thus, hypoxia reduces the activities of osteoblasts, and increases the activities of osteoclasts, which results in dysregulated bone homeostasis, reduced BMD and microarchitecture, thereby increasing bone fracture risk [55,56,57,58]. In this work, POG significantly downregulated the hypoxia canonical pathway, including the expression of HIF-1α, HIF-3α and HIF-1α-AS2 (FDR < 0.05), while HIF1AN (a HIF1α inhibitor) was significantly upregulated (FDR < 0.05), indicating that this compound affects several signaling molecules within the HIF pathway. In addition, both POG and RES increased ATP levels in cultured serum-starved osteoblasts (Supplemental Figure S1). Downregulation of HIF-1α/Rankl/Notch1 signaling in serum-starved osteoblasts provides further insight into the multiple canonical pathways that are associated with the anabolic activities of POG, as well as its antiresorptive effects.
Finally, numerous cytokines and networks have been identified and reported to impact osteoblast and osteoclast function, as well as the formation and resorption of bone [64,65]. Significant changes in specific cytokine levels appear to play a critical role in metabolic bone disorders, including osteoporosis [65]. The interleukins (IL)-6, IL-17, IL-18, and other proinflammatory cytokines have been reported to enhance Rankl-induced osteoclast differentiation [64,65]. Interestingly, RES-treated serum-starved osteoblasts showed a significant (FDR < 0.05) upregulation of interleukin-18 mRNA and signaling (IL-18, Supplemental Figure S2). Interleukin-18 is primarily synthesized in osteoblasts, macrophages, and Kupffer cells. While its role in osteoclastogenesis is controversial, IL-18 has been reported to increase the activities of TNF-α and Fas/FasL and osteoclast apoptosis [66,67]. Interleukin-18 expression was reported to be upregulated in rat osteoblasts treated with parathyroid hormone [67]. Its role in osteoclastogenesis is thought to be similar to that of IL-1 and TNF-α; however, there are reports that contradict this hypothesis [68]. While POG treatments of osteoblasts did not affect IL-18, POG treatment reduced IL-6 mRNA expression (−3-fold, p < 0.05). Interleukin-6 has been shown to increase the RANKL:OPG ratio by increasing Rankl levels and reducing OPG, leading to excessive osteoclast activation and bone loss [69]. However, again, this is speculative, as there appears to be some controversy concerning IL-6 and its role in osteoclastogenesis [69].

5. Conclusions

Treatment of serum-starved hFOB human osteoblasts with low concentrations of POG or RES led to improved osteoblast viability and reduced apoptosis. Whole-genome transcriptomic profiling of the osteoblasts showed that both treatments altered DGE that overlapped with the apoptosis canonical pathway, favoring cell growth, further supporting these observations. POG treatment increased DLX5 mRNA expression, a transcription factor associated with osteoblast differentiation and upregulated Sp7/osterix and Runx2 mRNA expression. Both RES and POG significantly downregulated Rankl mRNA expression, likely leading to a reduction in the Rankl:OPA ratio that would suppress osteoclastogenesis, supporting the results of our previously published in vivo studies in transgenic medaka. Interestingly, POG-treatment of serum-starved osteoblasts also reduced HIF1α canonical pathway signaling, and both POG and RES altered the expression of proinflammatory interleukins, which are thought to be involved in osteoclastogenesis. These data suggest that these naturally occurring compounds have both anabolic effects (improved osteoblast viability and function), and anti-resorptive activities by significantly downregulating Rankl expression, as well as altering signaling in multiple canonical pathways and biological networks. These data support their possible use for the treatment of metabolic bone diseases, including osteoporosis.

Supplementary Materials

The following supporting information can be downloaded at: https://www.mdpi.com/article/10.3390/nu15143233/s1, Figure S1: ATP levels in resveratrol and peonidin-3-O-glucoside treated osteoblasts; Figure S2: Impact of resveratrol on IL-18 expression and signaling in osteoblasts. Figure S3A–E. qPCR analysis of Rankl, Dlx5, Sp7/osterix, and Runx2 mRNA expression in resveratrol and peonidin-3-O-glucoside treated osteoblasts.

Author Contributions

Conceptualization, G.B.M. and D.A.L.-V.; cell culture: T.O.L., N.A.R., A.M.L. and P.C.-A.; RNA isolation and quality controls: T.O.L. and N.S.L.; mRNA seq: N.S.L. and Z.A.; Bioinformatics analysis: P.N.K. and M.M.-C.; edgeR: K.C.O.M. and K.D.G.B.; Manuscript Draft Preparation, G.B.M.; D.A.L.-V., K.C.O.M. and K.D.G.B.; Funding Acquisition, G.B.M., D.A.L.-V., T.O.L. and N.A.R. All authors have read and agreed to the published version of the manuscript.

Funding

This work was funded in part by the UIC-TEC Seed Fund International Research Collaboration for GBM and DLV, a Schlumberger Foundation Fellowship award for TOL, and a Raman Post-Doctoral Fellowship by the University Grants Commission, Govt. of India, for NAR. PK and MMC were supported partly by the University of Illinois at Chicago (UIC) Center for Clinical and Translational Science (CCTS) and the National Center for Advancing Translational Sciences (NCATS), National Institutes of Health, through the grant award number UL1TR002003. PCA, ALL, KOM, and KGB participated as part of a Research Internship Program at the University of Illinois at Chicago, Chicago, Illinois, in collaboration with Tecnologico de Monterrey, Monterrey, Mexico. The contents are solely the responsibility of the authors and do not necessarily represent the official views of the NIH or other funding agencies. The funding agency had no role in the design of the study, the collection, analysis, or in the interpretation of data and in writing the manuscript.

Institutional Review Board Statement

Not applicable.

Informed Consent Statement

Not applicable.

Data Availability Statement

The mRNA-seq data presented in this manuscript are publicly available, have been deposited in NCBI’s Gene Expression Omnibus [24,25], and are accessible through GEO series accession number GSE200684, (https://www.ncbi.nlm.nih.gov/geo/query/acc.cgi?acc=GSE200684 accessed on 15 June 2023).

Conflicts of Interest

The authors declare no conflict of interest.

References

  1. Nazrun, A.S.; Tzar, M.N.; Mokhtar, S.A.; Mohamed, I.N. A systematic review of the outcomes of osteoporotic fracture patients after hospital discharge: Morbidity, subsequent fractures, and mortality. Ther. Clin. Risk Manag. 2014, 10, 937–948. [Google Scholar] [CrossRef] [Green Version]
  2. Salari, N.; Ghasemi, H.; Mohammadi, L.; Behzadi, M.H.; Rabieenia, E.; Shohaimi, S.; Mohammadi, M. The global prevalence of osteoporosis in the world: A comprehensive systematic review and meta-analysis. J. Orthop. Surg. Res. 2021, 16, 609. [Google Scholar] [CrossRef]
  3. Hadjidakis, D.J.; Androulakis, I.I. Bone remodeling. Ann. N. Y. Acad. Sci. 2006, 1092, 385–396. [Google Scholar] [CrossRef]
  4. Florencio-Silva, R.; Sasso, G.R.; Sasso-Cerri, E.; Simões, M.J.; Cerri, P.S. Biology of bone tissue: Structure, function, and factors that influence bone cells. Biomed. Res. Int. 2015, 2015, 421746. [Google Scholar] [CrossRef] [Green Version]
  5. Bolamperti, S.; Villa, I.; Rubinacci, A. Bone remodeling: An operational process ensuring survival and bone mechanical competence. Bone Res. 2022, 10, 48. [Google Scholar] [CrossRef] [PubMed]
  6. Liang, B.; Burley, G.; Lin, S.; Shi, Y.C. Osteoporosis pathogenesis and treatment: Existing and emerging avenues. Cell. Mol. Biol. Lett. 2022, 27, 72. [Google Scholar] [CrossRef] [PubMed]
  7. An, J.; Yang, H.; Zhang, Q.; Liu, C.; Zhao, J.; Zhang, L.; Chen, B. Natural products for treatment of osteoporosis: The effects and mechanisms on promoting osteoblast mediated bone formation. Life Sci. 2016, 147, 46–58. [Google Scholar] [CrossRef]
  8. Che, C.T.; Wong, M.; Lam, C. Natural products from Chinese medicines with potential benefits to bone health. Molecules 2016, 21, 239. [Google Scholar] [CrossRef] [PubMed] [Green Version]
  9. Baur, J.A.; Sinclair, D.A. Therapeutic potential of resveratrol: The in vivo evidence. Nat. Rev. Drug Discov. 2006, 542, 493–506. [Google Scholar] [CrossRef] [PubMed]
  10. Raut, N.; Lawal, T.O.; Wicks, S.M.; Patel, S.; Mahady, G.B. Epigenetic regulation of osteoblastogenesis by blackcurrant fruit extracts in vitro and in vivo. FASEB J. 2019, 33, 471. [Google Scholar] [CrossRef]
  11. Ren, Z.; Raut, N.A.; Lawal, T.O.; Patel, S.R.; Lee, S.M.; Mahady, G.B. Peonidin-3-O-glucoside and cyanidin increase osteoblast differentiation and reduce RANKL-induced bone resorption in transgenic medaka. Phytother. Res. 2021, 35, 6255–6269. [Google Scholar] [CrossRef] [PubMed]
  12. Imangali, N.; Phan, Q.T.; Mahady, G.B.; Winkler, C. The dietary anthocyanin delphinidin prevents bone resorption by inhibiting Rankl-induced differentiation of osteoclasts in a medaka (Oryzias latipes) model of osteoporosis. J. Fish Biol. 2020, 98, 1018–1030. [Google Scholar] [CrossRef]
  13. Raut, N.A.; Lawal, T.O.; Wicks, S.M.; Patel, S.; Mahady, G.B. Acai fruit extracts and anthocyanins alter osteoblast proliferation and the expression of HDAC1 and osterix/Sp7 in vitro and in vivo. FASEB J. 2019, 33, 515. [Google Scholar] [CrossRef]
  14. Kanabar, P.; Los, N.; Abrevia, Z.; Cline, M.; Patel, S.; Lawal, T.O.; Mahady, G.B. Transcriptomic analysis reveals that combinations of vitamins A, D2 and D3 have synergistic effects in HCT-116 colon cancer cells by altering the expression of genes involved in multiple canonical pathways including apoptosis, regulation of the epithelial mesenchymal transition and immunity. Funct. Foods Health Dis. 2021, 11, 154–178. [Google Scholar] [CrossRef]
  15. Kanabar, P.; Los, N.; Patel, S.; Lawal, T.O.; Raut, N.; Abrevia, Z.; Cline, M.; Mahady, G.B. Combinations of vitamin A and D are synergistic in breast cancer cells and alter gene expression in the endoplasmic reticulum stress, unfolded protein and estrogen signaling canonical pathways. Funct. Foods Health Dis. 2023, 13, 135–155. [Google Scholar] [CrossRef]
  16. Dobin, A.; Gingeras, T.R. Mapping RNA-seq Reads with STAR. Curr. Protoc. Bioinform. 2015, 51, 11–14. [Google Scholar] [CrossRef] [Green Version]
  17. Dobin, A.; Davis, C.A.; Schlesinger, F.; Drenkow, J.; Zaleski, C.; Jha, S.; Gingeras, T.R. STAR: Ultrafast universal RNA-seq aligner. Bioinformatics 2013, 29, 15–21. [Google Scholar] [CrossRef]
  18. Liao, Y.; Smyth, G.K.; Shi, W. Feature Counts: An efficient, general-purpose program for assigning sequence reads to genomic features. Bioinformatics 2014, 30, 923–930. [Google Scholar] [CrossRef] [Green Version]
  19. McCarthy, D.J.; Chen, Y.; Smyth, G.K. Differential expression analysis of multifactor RNA-Seq experiments with respect to biological variation. Nucleic Acids Res. 2012, 40, 4288–4297. [Google Scholar] [CrossRef] [Green Version]
  20. Fu, X.; Fu, N.; Guo, S.; Yan, Z.; Xu, Y.; Hu, H.; Menzel, C.; Chen, W.; Li, Y.; Zeng, R. Estimating the accuracy of RNA-Seq and microarrays with proteomics. BMC Genom. 2009, 10, 161. [Google Scholar] [CrossRef] [Green Version]
  21. Bradford, J.R.; Hey, Y.; Yates, T.; Li, Y.; Pepper, S.D.; Miller, C.J. A comparison of massively parallel nucleotide sequencing with oligonucleotide microarrays for global transcription profiling. BMC Genom. 2010, 11, 282. [Google Scholar] [CrossRef] [Green Version]
  22. Benjamini, Y.; Hochberg, Y. Controlling the false discovery rate: A practical and powerful approach to multiple testing. J. R. Stat. Soc. Ser. B Methodol. 1995, 57, 289–300. [Google Scholar] [CrossRef]
  23. Kramer, A.; Green, J.; Pollard, J.; Tugendrich, S. Causal analysis approaches in Ingenuity Pathway Analysis. Bioinformatics 2014, 30, 523–530. [Google Scholar] [CrossRef] [PubMed] [Green Version]
  24. Edgar, R.; Domrachev, M.; Lash, A.E. Gene Expression Omnibus: NCBI gene expression and hybridization array data repository. Nucleic Acids Res. 2002, 30, 207–210. [Google Scholar] [CrossRef] [PubMed] [Green Version]
  25. Barrett, T.; Wilhite, S.E.; Ledoux, P.; Evangelista, C.; Kim, I.F.; Tomashevsky, M.; Marshall, K.A.; Phillippy, K.H.; Sherman, P.M.; Holko, M.; et al. NCBI GEO: Archive for functional genomics data sets—Update. Nucleic Acids Res. 2013, 41, D991–D995. [Google Scholar] [CrossRef] [Green Version]
  26. Utting, J.C.; Robins, S.P.; Brandao-Burch, A.; Orriss, I.R.; Behar, J.; Arnett, T.R. Hypoxia inhibits the growth, differentiation, and bone-forming capacity of rat osteoblasts. Exp. Cell Res. 2006, 312, 1693–1702. [Google Scholar] [CrossRef]
  27. Wang, G.; Wang, J.; Sun, D.; Xin, J.; Wang, L.; Huang, D.; Wu, W.; Xian, C.J. Short-term hypoxia accelerates bone loss in ovariectomized rats by suppressing osteoblastogenesis but enhances osteoclastogenesis. Med. Sci. Monit. 2016, 22, 2962–2971. [Google Scholar] [CrossRef] [Green Version]
  28. Ahmad Hairi, H.; Jayusman, P.A.; Shuid, A.N. Revisiting resveratrol as an osteoprotective agent: Molecular evidence from in vivo and in vitro studies. Biomedicines 2023, 11, 1453. [Google Scholar] [CrossRef]
  29. Wallace, T.C. Dried plums, prunes and bone health: A comprehensive review. Nutrients 2017, 9, 401–415. [Google Scholar] [CrossRef] [Green Version]
  30. Bo, S.; Gambino, R.; Ponzo, V.; Cioffi, I.; Goitre, I.; Evangelista, A.; Ciccone, G.; Cassader, M.; Procopio, M. Effects of resveratrol on bone health in type 2 diabetic patients. A double-blind randomized-controlled trial. Nutr. Diabetes 2018, 8, 51. [Google Scholar] [CrossRef] [Green Version]
  31. Ornstrup, J.M.; Harsløf, T.; Kjær, T.N.; Langdahl, B.L.; Pedersen, S.B. Resveratrol increases bone mineral density and bone alkaline phosphatase in obese men: A randomized placebo-controlled trial. J. Clin. Endocrinol. Metab. 2014, 99, 4720–4729. [Google Scholar] [CrossRef] [PubMed] [Green Version]
  32. Welch, A.; MacGregor, A.; Jennings, A.; Fairweather-Tait, S.; Spector, T.; Cassidy, A. Habitual flavonoid intakes are positively associated with bone mineral density in women. J. Bone Miner. Res. 2012, 27, 1872–1878. [Google Scholar] [CrossRef]
  33. Wong, R.H.; Thaung Zaw, J.J.; Xian, C.J.; Howe, P.R. Regular supplementation with resveratrol improves bone mineral density in postmenopausal women: A randomized, placebo-controlled trial. J. Bone Miner. Res. 2020, 35, 2121–2131. [Google Scholar] [CrossRef] [PubMed]
  34. Raut, N.; Wicks, S.M.; Lawal, T.O.; Mahady, G.B. Epigenetic regulation of bone remodelling by natural compounds. Pharmacol. Res. 2019, 147, 104350. [Google Scholar] [CrossRef]
  35. Tseng, P.C.; Hou, S.M.; Chen, R.J.; Peng, H.W.; Hsieh, C.F.; Kuo, M.L.; Yen, M.L. Resveratrol promotes osteogenesis of human mesenchymal stem cells by upregulating RUNX2 gene expression via the SIRT1/FOXO3A axis. J. Bone Miner. Res. 2011, 26, 2552–2563. [Google Scholar] [CrossRef] [PubMed]
  36. Mizutani, K.; Ikeda, K.; Kawai, Y.; Yamori, Y. Resveratrol stimulates the proliferation and differentiation of osteoblastic MC3T3-E1 cells. Biochem. Biophys. Res. Commun. 1998, 253, 859–863. [Google Scholar] [CrossRef]
  37. Moriwaki, S.; Suzuki, K.; Muramatsu, M.; Nomura, A.; Inoue, F. Delphinidin, one of the major anthocyanidins, prevents bone loss through the inhibition of excessive osteoclastogenesis in osteoporosis model mice. PLoS ONE 2014, 9, 97177. [Google Scholar] [CrossRef]
  38. Park, K.H.; Gu, D.R.; So, H.S.; Kim, K.; Lee, S.H. Dual Role of cyanidin-3-glucoside on the differentiation of bone cells. J. Dent. Res. 2015, 94, 1676–1683. [Google Scholar] [CrossRef]
  39. Beroukhim, R.; Mermel, C.H.; Porter, D.; Wei, G.; Raychaudhuri, S.; Donovan, J.; Barretina, J.; Boehm, J.S.; Dobson, J.; Urashima, M.; et al. The landscape of somatic copy-number alteration across human cancers. Nature 2010, 463, 899–905. [Google Scholar] [CrossRef] [Green Version]
  40. Vogler, M. BCL2A1: The underdog in the BCL2 family. Cell Death Differ. 2012, 19, 67–74. [Google Scholar] [CrossRef] [Green Version]
  41. Sionov, R.V.; Vlahopoulos, S.A.; Granot, Z. Regulation of Bim in health and disease. Oncotarget 2015, 6, 23058–23134. [Google Scholar] [CrossRef] [PubMed] [Green Version]
  42. Deng, J.; Shimamura, T.; Perera, S.; Carlson, N.E.; Cai, D.; Shapiro, G.I.; Wong, K.K.; Letai, A. Proapoptotic BH3-Only BCL-2 family protein BIM connects death signaling from epidermal growth factor receptor inhibition to the mitochondrion. Cancer Res. 2007, 67, 11867–11875. [Google Scholar] [CrossRef] [Green Version]
  43. He, N.; Zhu, X.W.; He, W.; Zhao, S.W.; Zhao, W.Y.; Zhu, C.L. Resveratrol inhibits the hydrogen dioxide-induced apoptosis via Sirt 1 activation in osteoblast cells. Biosci. Biotechnol. Biochem. 2015, 79, 1779–1786. [Google Scholar] [CrossRef] [Green Version]
  44. Tang, X.Y.; Zhu, H.; Cao, C. Effects of resveratrol on proliferation and differentiation of osteoblasts induced by high glucose through SIRT1/FOXO1 pathway. J. Oral Sci. Res. 2020, 36, 79–84. [Google Scholar] [CrossRef]
  45. Nakashima, K.; Zhou, X.; Kunkel, G.; Zhang, Z.; Deng, J.M.; Behringer, R.R.; de Crombrugghe, B. The novel zinc finger-containing transcription factor osterix is required for osteoblast differentiation and bone formation. Cell 2002, 108, 17–29. [Google Scholar] [CrossRef] [PubMed] [Green Version]
  46. Kawane, T.; Komori, H.; Liu, W.; Moriishi, T.; Miyazaki, T.; Mori, M.; Matsuo, Y.; Takada, Y.; Izumi, S.; Jiang, Q.; et al. Dlx5 and mef2 regulate a novel runx2 enhancer for osteoblast-specific expression. J. Bone Miner. Res. 2014, 29, 1960–1969. [Google Scholar] [CrossRef]
  47. Heo, J.S.; Lee, S.G.; Kim, H.O. Distal-less homeobox 5 is a master regulator of the osteogenesis of human mesenchymal stem cells. Int. J. Mol. Med. 2017, 40, 1486–1494. [Google Scholar] [CrossRef] [Green Version]
  48. Samee, N.; Geoffroy, V.; Marty, C.; Schiltz, C.; Vieux-Rochas, M.; Levi, G.; de Vernejoul, M.C. Dlx5, a positive regulator of osteoblastogenesis, is essential for osteoblast-osteoclast coupling. Am. J. Pathol. 2008, 173, 773–780. [Google Scholar] [CrossRef] [Green Version]
  49. Shakibaei, M.; Shayan, P.; Busch, F.; Aldinger, C.; Buhrmann, C.; Lueders, C.; Mobasheri, A. Resveratrol mediated modulation of Sirt-1/Runx2 promotes osteogenic differentiation of mesenchymal stem cells: Potential role of Runx2 deacetylation. PLoS ONE 2012, 7, e35712. [Google Scholar] [CrossRef] [PubMed] [Green Version]
  50. Eriksen, E.F. Cellular mechanisms of bone remodeling. Rev. Endocr. Metab. Disord. 2010, 11, 219–227. [Google Scholar] [CrossRef] [Green Version]
  51. Hikita, A.; Yana, I.; Wakeyama, H. Negative regulation of osteoclastogenesis by ectodomain shedding of receptor activator of NF-kappaB ligand. J. Biol. Chem. 2006, 281, 36846–36855. [Google Scholar] [CrossRef] [Green Version]
  52. Tobeiha, M.; Moghadasian, M.H.; Amin, N.; Jafarnejad, S. RANKL/RANK/OPG Pathway: A mechanism involved in exercise-induced bone remodeling. Biomed. Res. Int. 2020, 2020, 6910312. [Google Scholar] [CrossRef] [Green Version]
  53. Shakibaei, M.; Buhrmann, C.; Mobasheri, A. Resveratrol-mediated SIRT-1 interactions with p300 modulate receptor activator of NF-kappaB ligand (RANKL) activation of NF-kappaB signaling and inhibit osteoclastogenesis in bone-derived cells. J. Biol. Chem. 2011, 286, 11492–11505. [Google Scholar] [CrossRef] [Green Version]
  54. Ameen, O.; Yassien, R.I.; Naguib, Y.M. Activation of FoxO1/SIRT1/RANKL/OPG pathway may underlie the therapeutic effects of resveratrol on aging-dependent male osteoporosis. BMC Musculoskelet. Disord. 2020, 21, 375. [Google Scholar] [CrossRef]
  55. Basu, S.; Michaelsson, K.; Olofsson, H.; Johansson, S.; Melhus, H. Association between oxidative stress and bone mineral density. Biochem. Biophys. Res. Commun. 2001, 288, 275–279. [Google Scholar] [CrossRef] [PubMed]
  56. Jagger, C.J.; Lean, J.M.; Davies, J.T.; Chambers, T.J. Tumor necrosis factor-a mediates osteopenia caused by depletion of antioxidants. Endocrinology 2004, 146, 113–118. [Google Scholar] [CrossRef] [PubMed] [Green Version]
  57. Altindag, O.; Erel, O.; Soran, N.; Celik, H.; Selek, S. Total oxidative/anti-oxidative status and relation to bone mineral density in osteoporosis. Rheumatol. Int. 2008, 28, 317–321. [Google Scholar] [CrossRef] [PubMed]
  58. Usategui-Martín, R.; Rigual, R.; Ruiz-Mambrilla, M.; Fernández-Gómez, J.-M.; Dueñas, A.; Pérez-Castrillón, J.L. Molecular mechanisms involved in hypoxia-induced alterations in bone remodeling. Int. J. Mol. Sci. 2022, 23, 3233. [Google Scholar] [CrossRef]
  59. Corrado, C.; Fontana, S. Hypoxia and HIF Signaling: One Axis with Divergent Effects. Int. J. Mol. Sci. 2020, 21, 5611. [Google Scholar] [CrossRef]
  60. Komori, T. Regulation of proliferation, differentiation and functions of osteoblasts by Runx2. Int. J. Mol. Sci. 2019, 20, 1694. [Google Scholar] [CrossRef] [Green Version]
  61. Ontiveros, C.; Irwin, R.; Wiseman, R.W.; McCabe, L.R. Hypoxia suppresses runx2 independent of modeled microgravity. J. Cell. Physiol. 2004, 200, 169–176. [Google Scholar] [CrossRef]
  62. Xu, Q.; Liu, Z.; Guo, L.; Liu, R.; Li, R.; Chu, X.; Yang, J.; Luo, J.; Chen, F.; Deng, M. Hypoxia mediates Runt-related transcription factor 2 expression via induction of vascular endothelial growth factor in periodontal ligament stem cells. Mol. Cells 2019, 42, 763–772. [Google Scholar] [CrossRef] [PubMed]
  63. Chen, W.; Wu, P.; Yu, F.; Luo, G.; Qing, L.; Tang, J. HIF-1α Regulates bone homeostasis and angiogenesis, participating in the occurrence of bone metabolic diseases. Cells 2022, 11, 3552. [Google Scholar] [CrossRef] [PubMed]
  64. Horwood, N.J.; Elliott, J.; Martin, T.J.; Gillespie, M.T. IL-12 alone and in synergy with IL-18 inhibits osteoclast formation in vitro. J. Immunol. 2001, 166, 4915–4921. [Google Scholar] [CrossRef] [Green Version]
  65. Amarasekara, D.S.; Yun, H.; Kim, S.; Lee, N.; Kim, H.; Rho, J. Regulation of osteoclast differentiation by cytokine networks. Immune Netw. 2018, 18, e8. [Google Scholar] [CrossRef]
  66. Kitaura, H.; Tatamiya, M.; Nagata, N.; Fujimura, Y.; Eguchi, T.; Yoshida, N.; Nakayama, K. IL-18 induces apoptosis of adherent bone marrow cells in TNF-α mediated osteoclast formation in synergy with IL-12. Immunol. Lett. 2006, 107, 22–31. [Google Scholar] [CrossRef]
  67. Raggatt, L.J.; Qin, L.; Tamasi, J.; Bevelock, L.; Feyen, J.H.; Partridge, N.C. Interleukin-18 is regulated by parathyroid hormone and is required for its bone anabolic actions. J. Biol. Chem. 2008, 283, 6790–6798. [Google Scholar] [CrossRef] [PubMed] [Green Version]
  68. Dai, S.M.; Nishioka, K.; Yudoh, K. Interleukin (IL) 18 stimulates osteoclast formation through synovial T cells in rheumatoid arthritis: Comparison with IL1 beta and tumour necrosis factor alpha. Ann. Rheum. Dis. 2004, 63, 1379–1386. [Google Scholar] [CrossRef]
  69. Lorenzo, J.A. The role of Interleukin-6 in bone. J. Endocr. Soc. 2020, 4, bvaa112. [Google Scholar] [CrossRef] [PubMed]
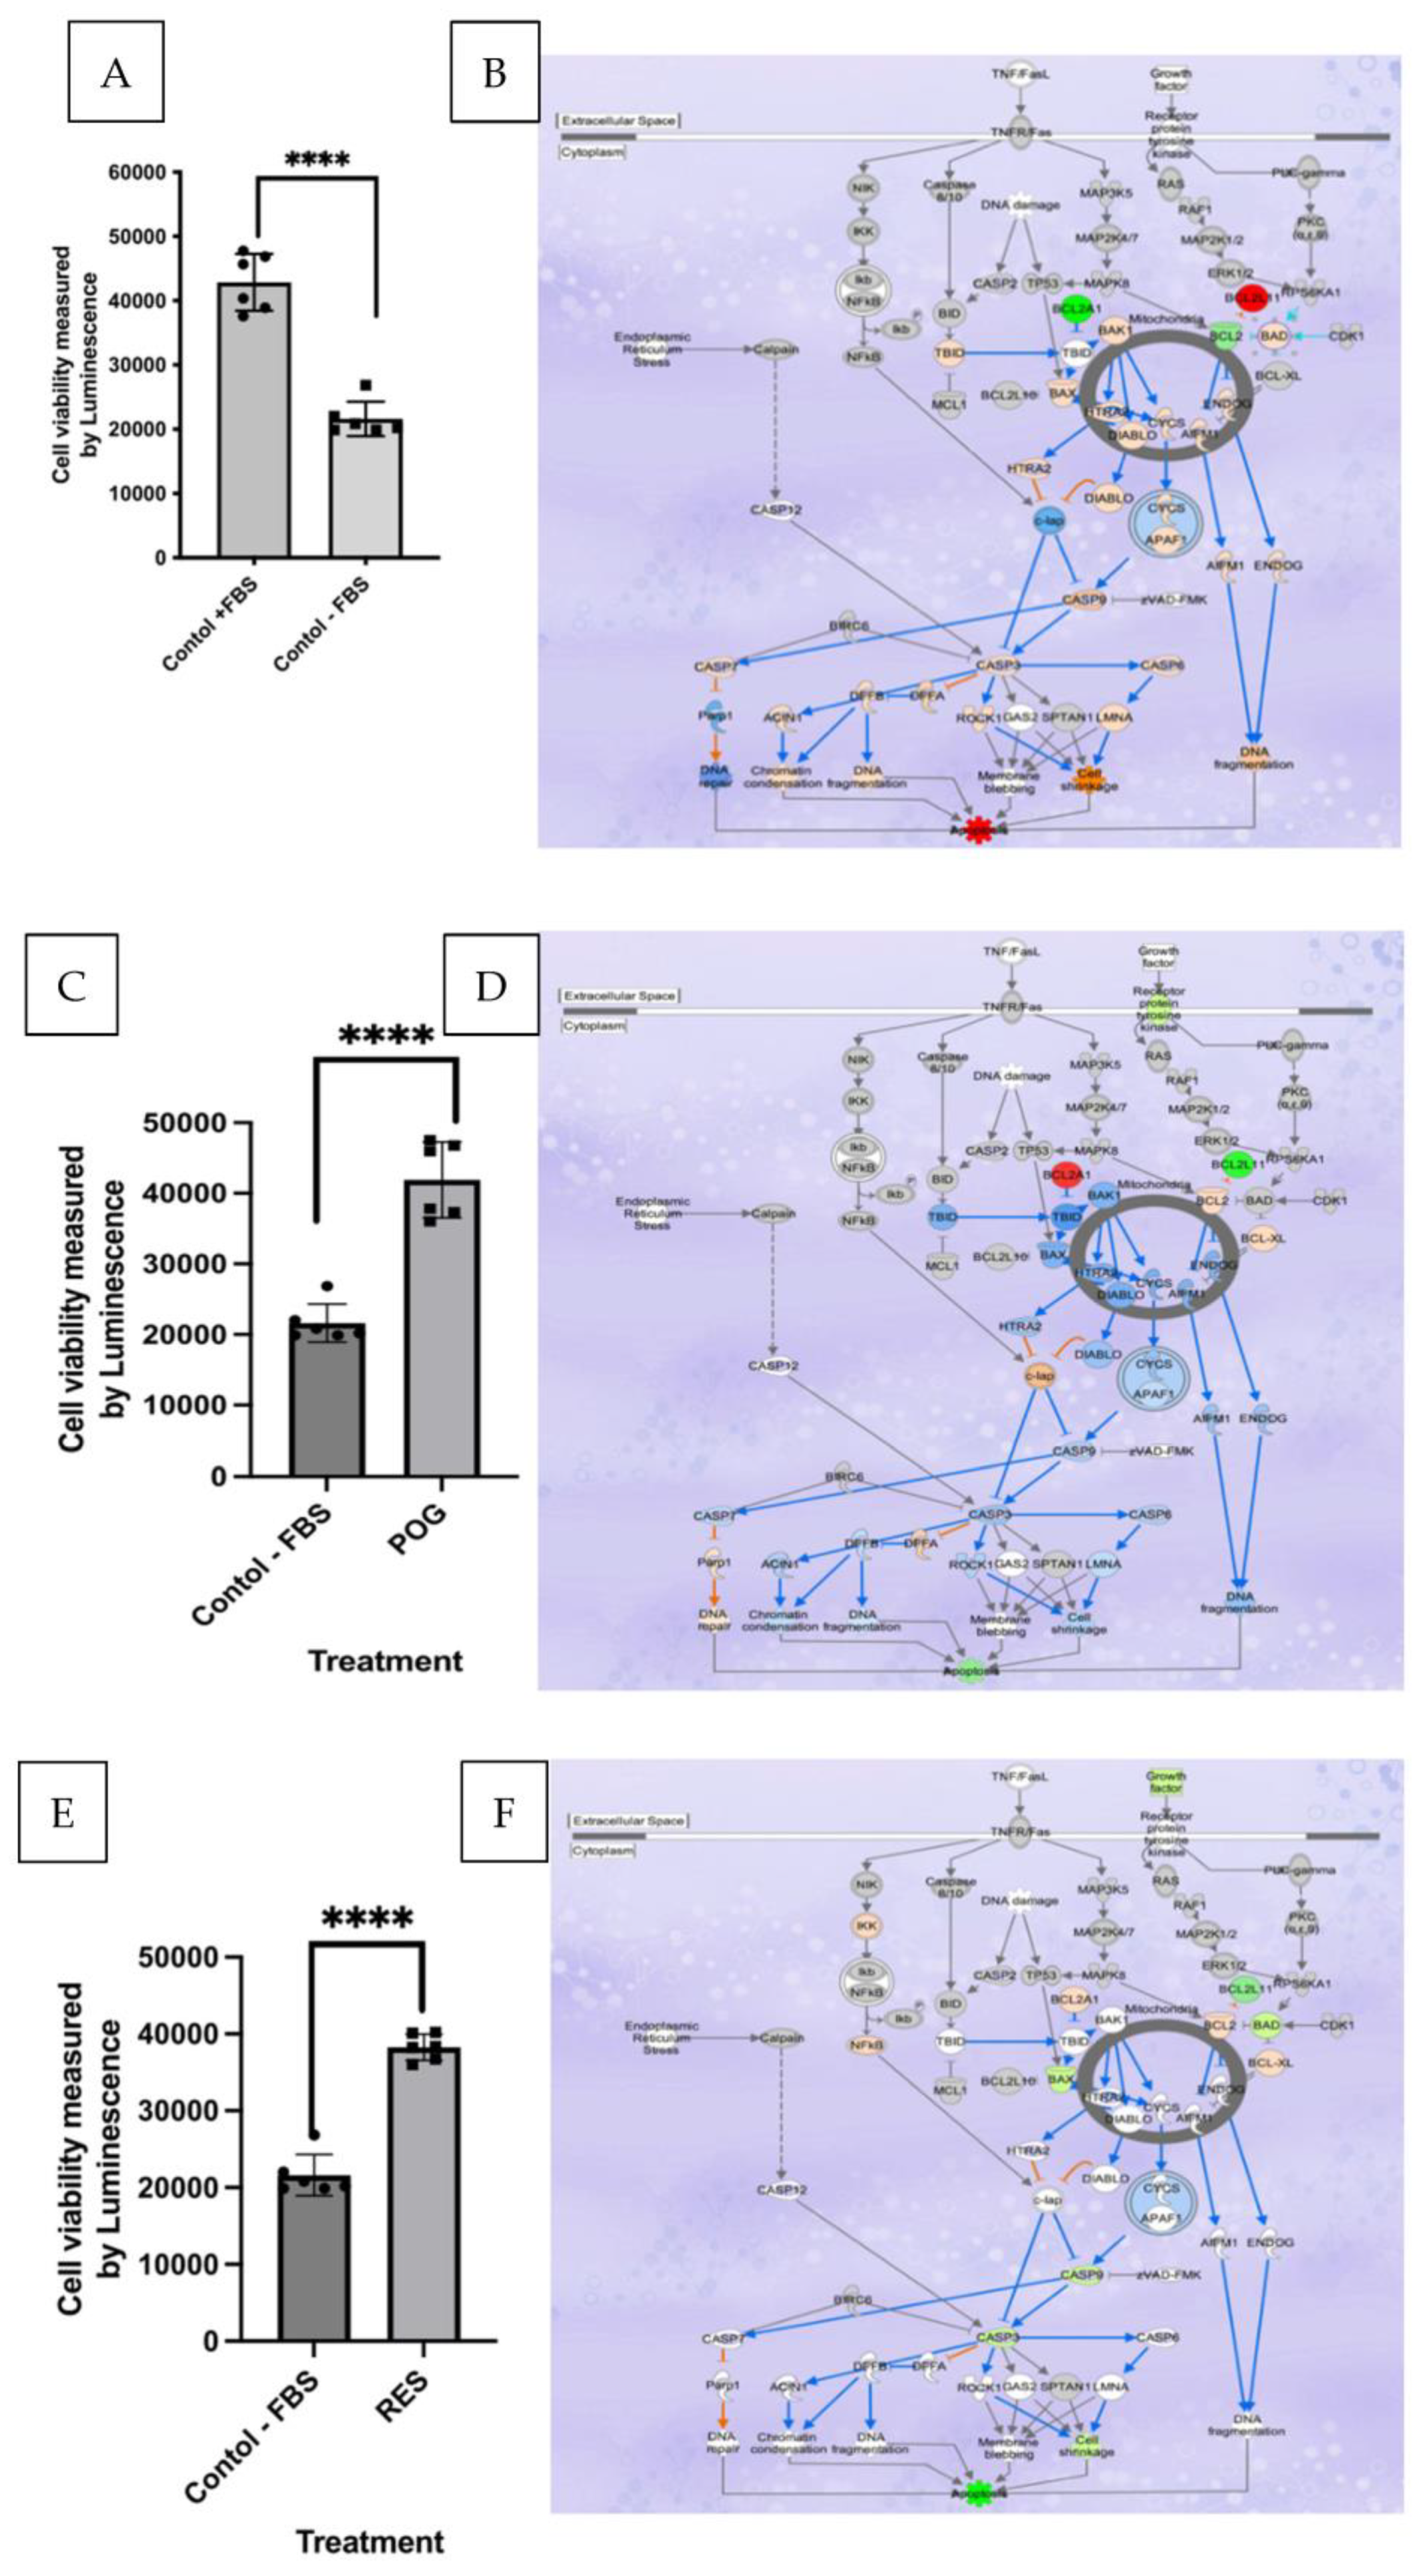
Figure 1. (A). Fetal bovine serum starvation of human hFOC osteoblasts (negative control, grown in media without FBS) significantly (p < 0.01) reduced osteoblast viability as compared with hFOB osteoblasts grown in media containing 10% FBS (positive control, grown in media containing 10% FBS); n = 6, squares and circles represent data points. (B). IPA analysis of the effects of serum starvation (negative controls) as compared with positive control osteoblasts on differential gene expression (DGE) in the apoptosis canonical pathways. (C). POG (1 μg/mL) treatment of negative control osteoblasts increased cell viability, measured using the CellTiter-Glo 2.0 assay. (D). IPA analysis of DGE showed reduced apoptosis canonical pathway signaling after treatment with POG. (E). RES (1 μg/mL) treatment of negative control osteoblasts increased cell viability and reduced apoptosis. (F). IPA analysis of the effects of serum starvation (negative controls) versus osteoblasts grown in media containing RES on DGE in the apoptosis canonical pathway. DGE data were analyzed by Ingenuity® Pathways Analysis (IPA), with analysis criteria of FC of <−1 and >1 and FDR < 0.05, using Fisher’s exact test (p < 0.05) to determine a significant correlation of canonical pathways with DGEs. Red/pink colors represent significant gene upregulation, and blue/green colors represent significant downregulation of genes. The ENSEMBL database was used to determine DGE enrichment in specific canonical pathways. Osteoblast viability was measured using the CellTiter-Glo® assay, and apoptosis activity was measured using the ApoTox-Glo™ triplex assay. Statistical analysis was performed using GraphPad/Prism 10.0 using the student T-test, **** p < 0.0001.
Nutrients 15 03233 g001
Figure 2. (A). Principal component analysis (PCA) of the mRNA-seq results showed differentially expressed genes from serum-starved human hFOB osteoblasts: positive control (+FBS, 0.01% DMSO); negative control (−FBS, 0.01% DMSO) as compared with osteoblasts grown without FBS (−FBS) and treated with RES or POG (1.0 μg/mL). Negative control (red dots; −FBS) samples and positive control (green dots; +FBS); RES-treated samples (blue dots); and POG-treated osteoblasts (purple dots). Differential gene expression was significant for q-values of ≤0.05 (FDR). (B). The number of differentially expressed and overlapping genes in RES and POG-treated osteoblasts (FDR < 0.01).
Nutrients 15 03233 g002
Figure 3. (A) Bubble plot of the interconnected canonical pathways associated with differential gene expression in RES-treated serum-starved osteoblasts. Canonical pathway names (Y axis) and correlated Z scores (X axis), with red bubbles indicating upregulation of the pathway and blue bubbles representing downregulation of the pathway. The bubble size is indicative of the number of genes that overlap the pathway. (B) Bubble plot of the overlapping canonical pathways associated with differential gene expression in serum-starved osteoblasts treated with POG. The red/orange colors represent upregulated canonical pathways based on Z-scores, while blue colors represent downregulated pathways. The gray shades are pathways with neutral Z-scores. (C,D) The most significantly impacted canonical pathways in hFOB osteoblasts treated with RES (C) or POG (D), p-values, % overlap of DGEs and the number of genes (red = upregulated, green = downregulated, Z score > 2.5). Fisher’s exact test (p ≤ 0.05) was used to assess the canonical pathways correlated with the DGEs.
Nutrients 15 03233 g003aNutrients 15 03233 g003b
Figure 4. Heatmap visualization of the 30 most significant up- and downregulated DGEs, including gene ontology. Three replicates for negative control hFOB osteoblasts, three for RES treatment and three for POG-treated osteoblasts. The red/pink colors are upregulated genes, and the blue/dark blue colors represent downregulated genes using a Z-scored Log2 CPM. A gene ontology enrichment analysis is displayed to show functional distribution.
Nutrients 15 03233 g004
Figure 5. Effects of POG treatment of serum-starved osteoblasts on differential gene expression show upregulation of genes correlated with osteoblast viability and activity, and predicted downregulation of osteoclast differentiation and function. POG treatment significantly (FDR < 0.05) reduced Rankl (THFSF11) and IL6 mRNA expression and upregulated the expression of DLX5, Runx2 and Sp7/osterix, indicating the potential mechanisms by which POG increases osteoblastogensis and reduces osteoclastogenesis. Genes/functions in red/pink depict significant upregulation, while genes in green/light green depict significant downregulation. Genes highlighted in blue represent predicted downregulations of gene expression or function. Genes highlighted in orange show predicted upregulation of gene expression or function.
Nutrients 15 03233 g005
Figure 6. (A). Rankl (TNFSF11) signaling network effects of POG treatment of serum-starved osteoblasts on differential gene expression. (B). Rankl (TNFSF11) signaling network effects of RES treatment of serum-starved osteoblasts on differential gene expression. Genes depicted in red/pink show significant upregulation and genes depicted in green/light green show significant downregulation. Genes highlighted in blue represent predicted downregulation of gene expression or function. Genes highlighted in orange represent predicted upregulation of gene expression or function.
Nutrients 15 03233 g006
Table 1. (A) The top 10 upregulated DGEs are presented for POG-treated serum-starved osteoblasts. (B) The top 10 downregulated DGEs are presented for POG-treated serum-starved osteoblasts. (C) The top 10 upregulated DGEs are presented for RES-treated serum-starved osteoblasts. (D) The top 10 downregulated DGEs are presented for RES-treated serum-starved osteoblasts. Tables were generated using a q < 0.05 and FC of <−1 or >1.
AB
GeneidGene nameGeneidGene name
ENSG00000120915EPHX2ENSG00000282608ADORA3
ENSG00000267677RP11-27G24.1ENSG00000213761MT1P1
ENSG00000273313RBAKDNENSG00000283045RP11-764D10.2
ENSG00000259215RP11-253M7.4ENSG00000227517LINC01483
ENSG00000251600RP11-673E1.1ENSG00000169442CD52
ENSG00000268750CTD-2583A14.10ENSG00000274421RP11-386J22.3
ENSG00000159496RGL4ENSG00000280639LINC02204
ENSG00000110328GALNT18ENSG00000267938EIF1P6
ENSG00000260331RP11-111J6.2ENSG00000198844ARHGEF15
ENSG00000233087WTH3DIENSG00000261783RP11-252K23.2
CD
GeneidGene nameGeneidGene name
ENSG00000196415PRTN3ENSG00000159239C2orf81
ENSG00000120915EPHX2ENSG00000118017A4GNT
ENSG00000227076RP11-4C20.4ENSG00000241112RPL29P14
ENSG00000183484GPR132ENSG00000109424UCP1
ENSG00000173930SLCO4C1ENSG00000261832RP11-435I10.4
ENSG00000260947RP11-384P7.7ENSG00000144868TMEM108
ENSG00000149633KIAA1755ENSG00000236670KRT18P5
ENSG00000137843PAK6ENSG00000235651AC064850.4
ENSG00000144488ESPNLENSG00000205502C2CD4B
ENSG00000183807FAM162BENSG00000198535C2CD4A
Disclaimer/Publisher’s Note: The statements, opinions and data contained in all publications are solely those of the individual author(s) and contributor(s) and not of MDPI and/or the editor(s). MDPI and/or the editor(s) disclaim responsibility for any injury to people or property resulting from any ideas, methods, instructions or products referred to in the content.