
Temporal Trends in Food Insecurity (Hunger) among School-Going Adolescents from 31 Countries from Africa, Asia, and the Americas

 ,
,  ,
,  , ,
, ,  , ,
, ,  and
and
Abstract
1. Introduction
2. Methods
2.1. Food Insecurity (Hunger)
2.2. Statistical Analysis
3. Results
4. Discussion
4.1. Main Findings
4.2. Interpretation of the Findings
4.3. Policy Implications
4.4. Strengths and Limitations
5. Conclusions
Author Contributions
Funding
Institutional Review Board Statement
Informed Consent Statement
Data Availability Statement
Acknowledgments
Conflicts of Interest
Appendix A

| Region | Country | Country Income | Year | Response Rate (%) | N a |
|---|---|---|---|---|---|
| AFR | Benin | L | 2009 | 90 | 1170 |
| L | 2016 | 78 | 717 | ||
| Mauritius | UM | 2011 | 82 | 2074 | |
| UM | 2017 | 84 | 1955 | ||
| Seychelles | UM | 2007 | 82 | 1154 | |
| H | 2015 | 82 | 2061 | ||
| Swaziland | LM | 2003 | 96 | 6866 | |
| LM | 2013 | 97 | 1318 | ||
| AMR | Anguilla | NA | 2009 | 84 | 701 |
| NA | 2016 | 88 | 564 | ||
| Argentina | UM | 2007 | 77 | 1537 | |
| UM | 2012 | 71 | 21,528 | ||
| Guatemala | LM | 2009 | 81 | 4495 | |
| LM | 2015 | 82 | 3611 | ||
| Guyana | LM | 2004 | 80 | 1070 | |
| LM | 2010 | 76 | 1973 | ||
| Jamaica | UM | 2010 | 72 | 1204 | |
| UM | 2017 | 60 | 1061 | ||
| Suriname | UM | 2009 | 89 | 1046 | |
| UM | 2016 | 83 | 1453 | ||
| Trinidad & Tobago | H | 2007 | 78 | 2450 | |
| H | 2011 | 90 | 2363 | ||
| H | 2017 | 89 | 2763 | ||
| Uruguay | UM | 2006 | 71 | 2882 | |
| H | 2012 | 77 | 2869 | ||
| EMR | Egypt | LM | 2006 | 87 | 4981 |
| LM | 2011 | 85 | 2364 | ||
| Jordan | LM | 2004 | 95 | 1848 | |
| LM | 2007 | 99.8 | 1648 | ||
| Kuwait | H | 2011 | 85 | 2298 | |
| H | 2015 | 78 | 2034 | ||
| Lebanon | UM | 2005 | 88 | 4524 | |
| UM | 2011 | 87 | 1982 | ||
| UM | 2017 | 82 | 3347 | ||
| Morocco | LM | 2006 | 84 | 1986 | |
| LM | 2010 | 92 | 2405 | ||
| LM | 2016 | 91 | 3975 | ||
| Oman | UM | 2005 | 97 | 2426 | |
| H | 2010 | 89 | 1000 | ||
| H | 2015 | 92 | 1669 | ||
| United Arab Emirates | H | 2005 | 89 | 12,819 | |
| H | 2010 | 91 | 2302 | ||
| H | 2016 | 80 | 3471 | ||
| Yemen | L | 2008 | 82 | 905 | |
| LM | 2014 | 75 | 1553 | ||
| SEAR | Indonesia | LM | 2007 | 93 | 3022 |
| LM | 2015 | 94 | 8806 | ||
| Maldives | LM | 2009 | 80 | 1981 | |
| UM | 2014 | 60 | 1781 | ||
| Myanmar | L | 2007 | 95 | 2227 | |
| LM | 2016 | 86 | 2237 | ||
| Sri Lanka | LM | 2008 | 89 | 2504 | |
| LM | 2016 | 89 | 2254 | ||
| Thailand | LM | 2008 | 93 | 2675 | |
| UM | 2015 | 89 | 4132 | ||
| WPR | Cook Islands | NA | 2011 | 84 | 849 |
| NA | 2015 | 65 | 366 | ||
| Fiji | LM | 2010 | 90 | 1495 | |
| UM | 2016 | 79 | 1537 | ||
| Philippines | LM | 2003 | 84 | 4198 | |
| LM | 2007 | 81 | 3484 | ||
| LM | 2011 | 82 | 3845 | ||
| LM | 2015 | 79 | 6162 | ||
| Samoa | LM | 2011 | 79 | 2200 | |
| LM | 2017 | 59 | 1058 | ||
| Tonga | LM | 2010 | 80 | 1946 | |
| UM | 2017 | 90 | 2067 | ||
| Vanuatu | LM | 2011 | 72 | 852 | |
| LM | 2016 | 57 | 1288 |
References
- Bickel, G.; Nord, M.; Price, C.; Hamilton, W.; Cook, J. Guide to Measuring Household Food Security; United States Department of Agriculture: Washington, DC, USA, 2000. [Google Scholar]
- World Health Organization. UN Report: Global Hunger Numbers Rose to as Many as 828 Million in 2021. Available online: https://www.who.int/news/item/06-07-2022-un-report--global-hunger-numbers-rose-to-as-many-as-828-million-in-2021 (accessed on 20 June 2023).
- World Health Organization. The State of Food Security and Nutrition in the World 2019: Safeguarding against Economic Slowdowns and Downturns; Food & Agriculture Organization of the United Nations: Roma, Italy, 2019; Volume 2019. [Google Scholar]
- United Nations. The 17 Goals. Available online: https://sdgs.un.org/goals (accessed on 20 June 2023).
- Fares, K.; Barada, D.; Hoteit, M.; Abou Haidar, M. Prevalence and Correlates of Food Insecurity among Lebanese University Students of Hadath Campus. Atena J. Public Health 2020, 2, 5. [Google Scholar]
- Baer, T.E.; Scherer, E.A.; Fleegler, E.W.; Hassan, A. Food Insecurity and the Burden of Health-Related Social Problems in an Urban Youth Population. J. Adolesc. Health 2015, 57, 601–607. [Google Scholar] [CrossRef] [PubMed]
- Kotchick, B.A.; Whitsett, D.; Sherman, M.F. Food Insecurity and Adolescent Psychosocial Adjustment: Indirect Pathways through Caregiver Adjustment and Caregiver–Adolescent Relationship Quality. J. Youth Adolesc. 2021, 50, 89–102. [Google Scholar] [CrossRef] [PubMed]
- Pourmotabbed, A.; Moosavian, S.P.; Hadi, A.; Mohammadi, H.; Dadfarma, A.; Rezaei, S.; Babaei, A.; Moradi, S.; Mirzaei, K. The Relationship between Food Insecurity and Risk of Overweight or Obesity in under 18 Years Individuals: A Systematic Review and Meta-Analysis. Int. J. Prev. Med. 2020, 11, 158. [Google Scholar] [PubMed]
- Sánchez García, C.; Zauder, R.; López Sánchez, G.F. Analysis of Body Composition and Physical Fitness of Futsal Players at School Age According to Their Level of Physical Activity, Diet and Body Image. Atena J. Sport. Sci. 2019, 1, 4. [Google Scholar]
- Smith, L.; Ward, P.B.; Vancampfort, D.; López-Sánchez, G.F.; Yang, L.; Grabovac, I.; Jacob, L.; Pizzol, D.; Veronese, N.; Shin, J.I.; et al. Food Insecurity with Hunger and Sexual Behavior among Adolescents from 53 Countries. Int. J. Sex. Health 2021, 33, 88–98. [Google Scholar] [CrossRef]
- Oh, H.; Smith, L.; Jacob, L.; Du, J.; Shin, J.I.; Zhou, S.; Koyanagi, A. Food Insecurity and Substance Use among Young Adult College Students in the United States. J. Addict. Med. 2022, 17, 163–168. [Google Scholar] [CrossRef] [PubMed]
- Félix-Beltrán, L.; Seixas, B.V. Childhood Hunger Experiences and Chronic Health Conditions Later in Life among Brazilian Older Adults. Rev. Panam. Salud Pública 2021, 45, e39. [Google Scholar] [CrossRef] [PubMed]
- López Sánchez, G.F.; Vigueras Hernández, M.R.; Lucas Casas, P.; Zauder, R.; Jastrzębska, J.; Skalska, M.; RadzimiNski, L.; Jastrzebski, Z.; Pardhan, S. Impact of Physical Activity, BMI and Sociodemographic and Lifestyle Factors on the Risk of Diabetes in 9511 Ghanaian Adults. SPORT TK-Rev. EuroAmericana Cienc. Deporte 2022, 11, 15. [Google Scholar] [CrossRef]
- Fram, M.S.; Nguyen, H.T.; Frongillo, E.A. Food Insecurity among Adolescent Students from 95 Countries Is Associated with Diet, Behavior, and Health, and Associations Differ by Student Age and Sex. Curr. Dev. Nutr. 2022, 6, nzac024. [Google Scholar] [CrossRef] [PubMed]
- Gundersen, C.; Ziliak, J.P. Childhood Food Insecurity in the US: Trends, Causes, and Policy Options. Futur. Child. 2014, 1–19. Available online: https://www.jstor.org/stable/26304695 (accessed on 20 June 2023). [CrossRef]
- Smith, M.D.; Meade, B. Who Are the World’s Food Insecure? Identifying the Risk Factors of Food Insecurity Around the World. Amber Waves Econ. Food Farming Nat. Resour. Rural Am. 2019. Available online: https://ageconsearch.umn.edu/record/302721/ (accessed on 20 June 2023).
- McKinnon, B.; Gariépy, G.; Sentenac, M.; Elgar, F.J. Adolescent Suicidal Behaviours in 32 Low-and Middle-Income Countries. Bull. World Health Organ. 2016, 94, 340. [Google Scholar] [CrossRef] [PubMed]
- McIntyre, L.; Williams, J.V.A.; Lavorato, D.H.; Patten, S. Depression and Suicide Ideation in Late Adolescence and Early Adulthood Are an Outcome of Child Hunger. J. Affect. Disord. 2013, 150, 123–129. [Google Scholar] [CrossRef] [PubMed]
- World Food Programme Country Programme Benin 200721 (2015–2018). Available online: https://docs.wfp.org/api/documents/71faac146a864ad2855f2d6ad2ddd22b/download/ (accessed on 20 June 2023).
- Dookhee, A. New Threats to Food Security Ahead for Mauritius—What Are the Emerging Solutions? Available online: https://www.undp.org/mauritius-seychelles/blog/new-threats-food-security-ahead-mauritius-what-are-emerging-solutions (accessed on 20 June 2023).
- Assouad, L. Lebanon’s Political Economy: From Predatory to Self-Devouring; Carnegie Middle East Center: Beirut, Lebanon, 2021. [Google Scholar]
- United Nations. Goal 2: Zero Hunger. Available online: https://www.un.org/sustainabledevelopment/hunger/ (accessed on 20 June 2023).
- Baker, W. Food Banks in Schools and the ‘Cost of Living’ Crisis; British Educational Research Association: London, UK, 2022. [Google Scholar]


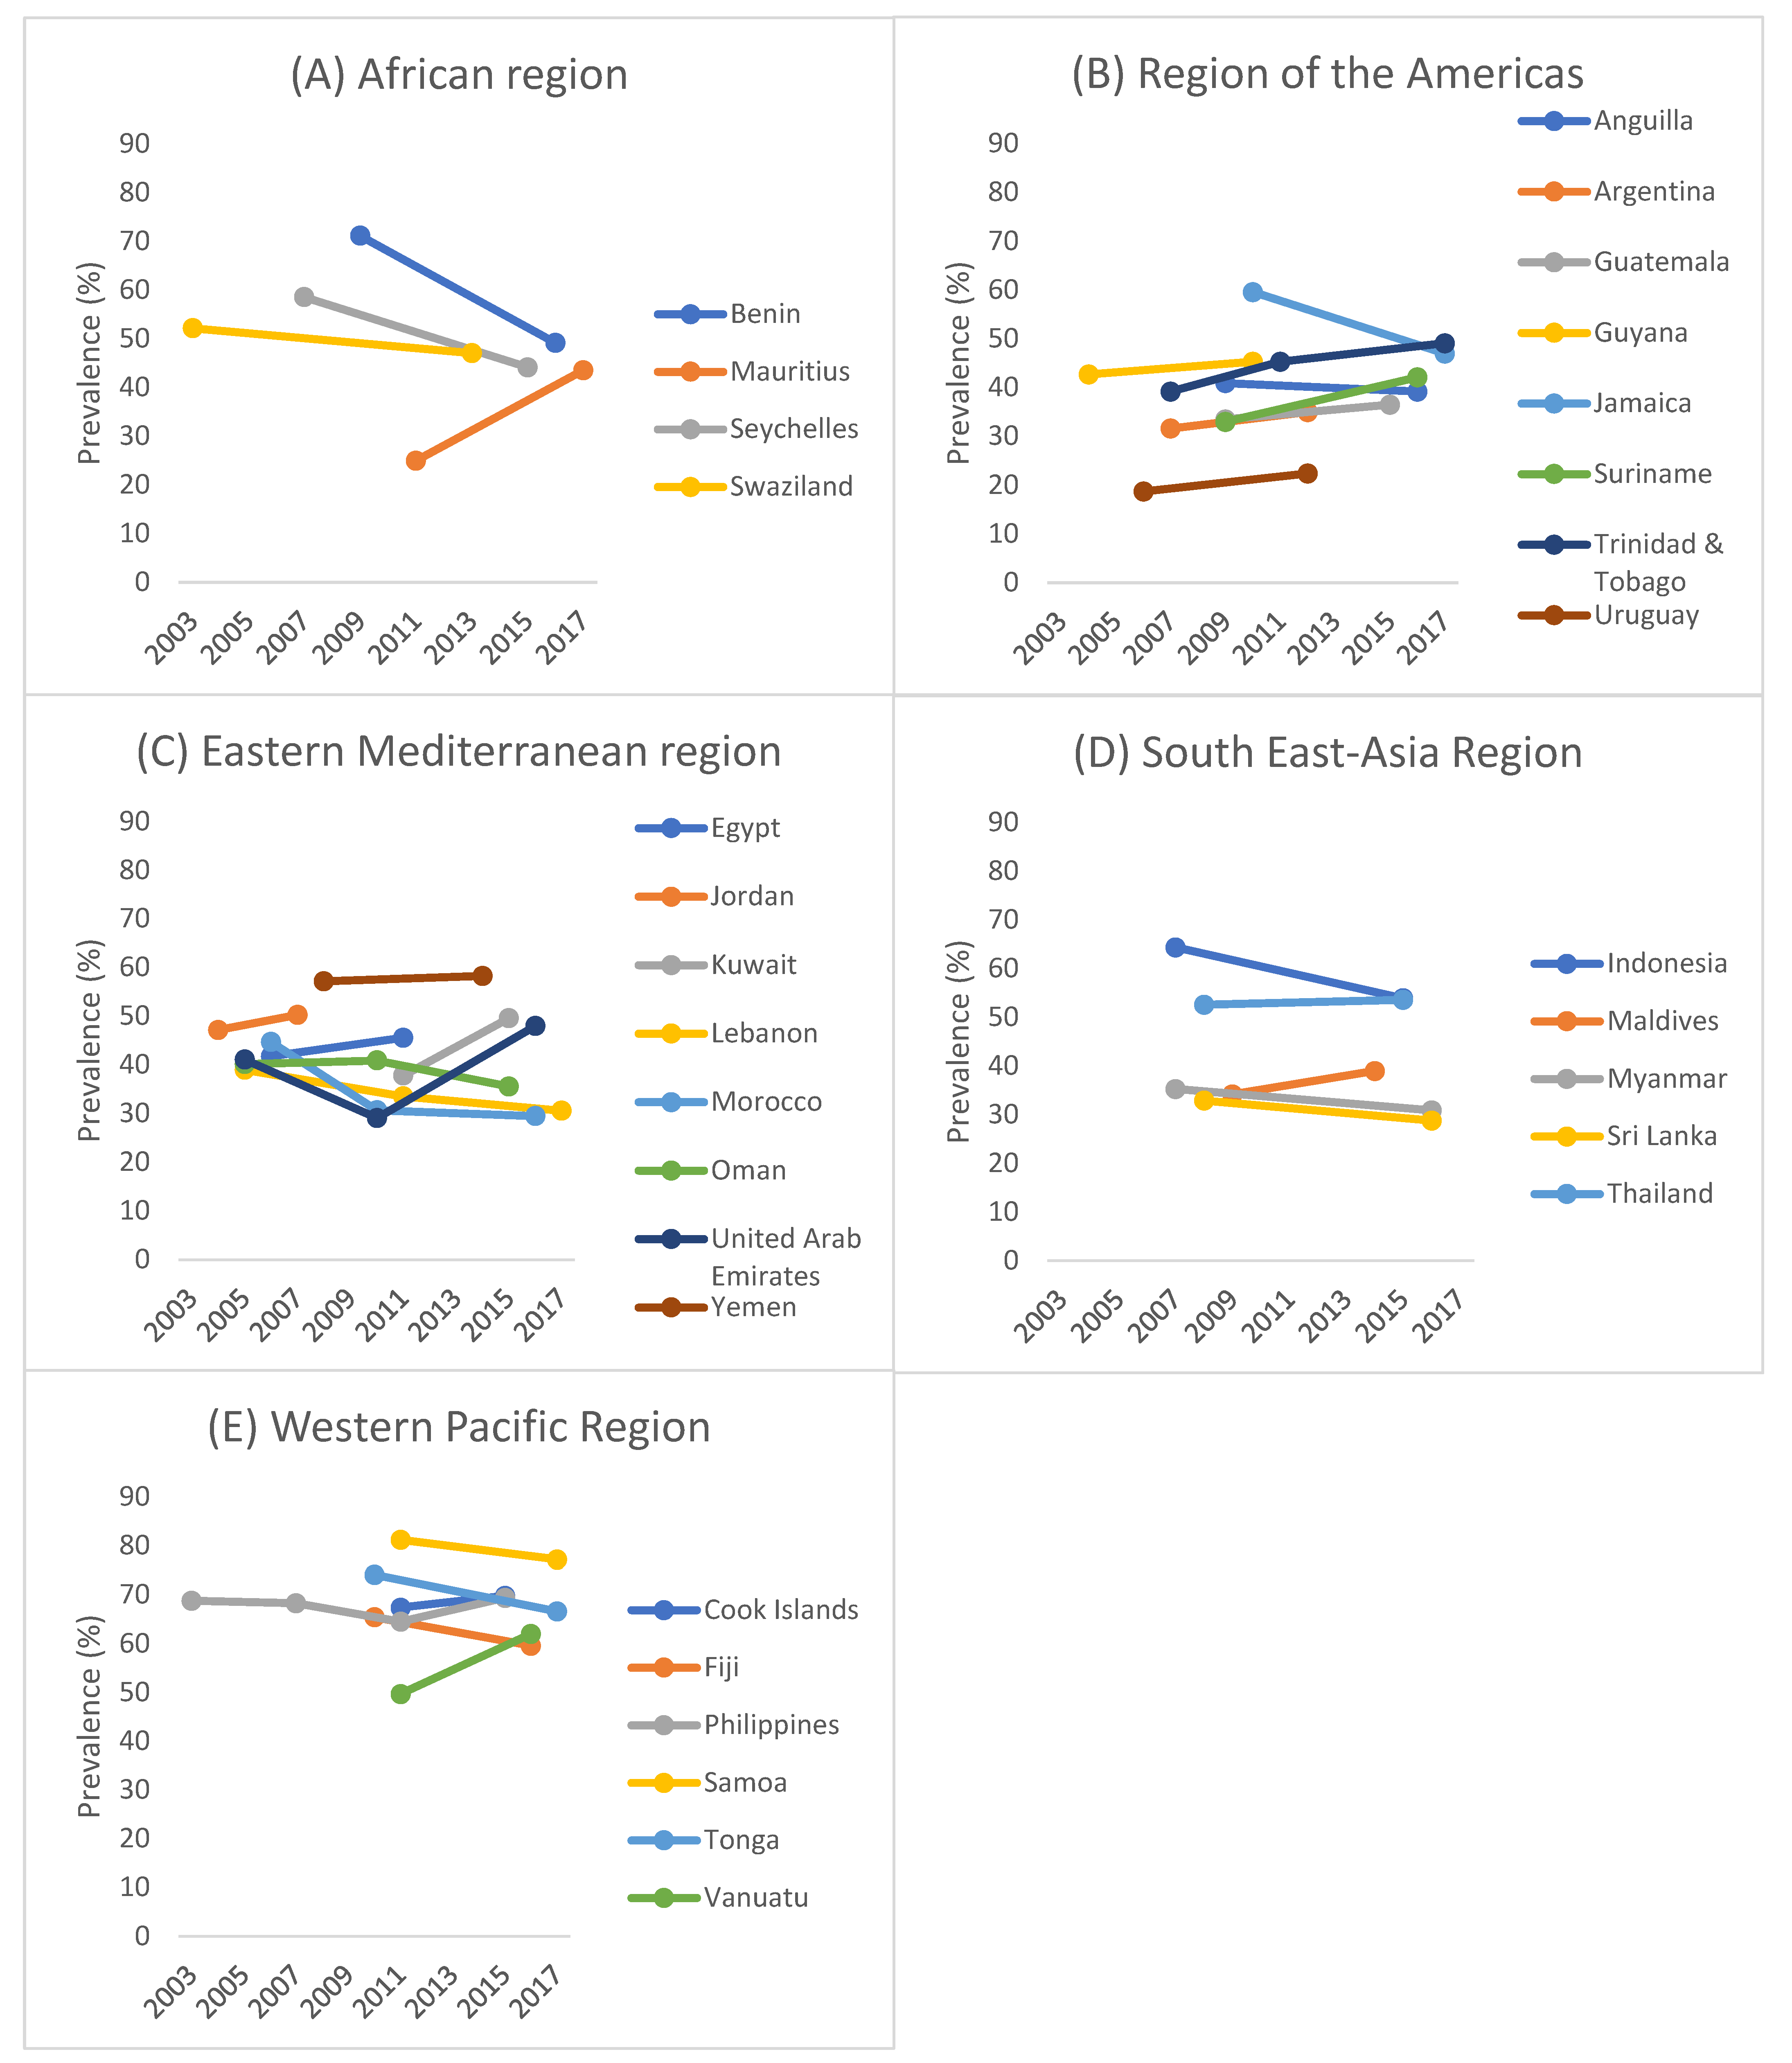
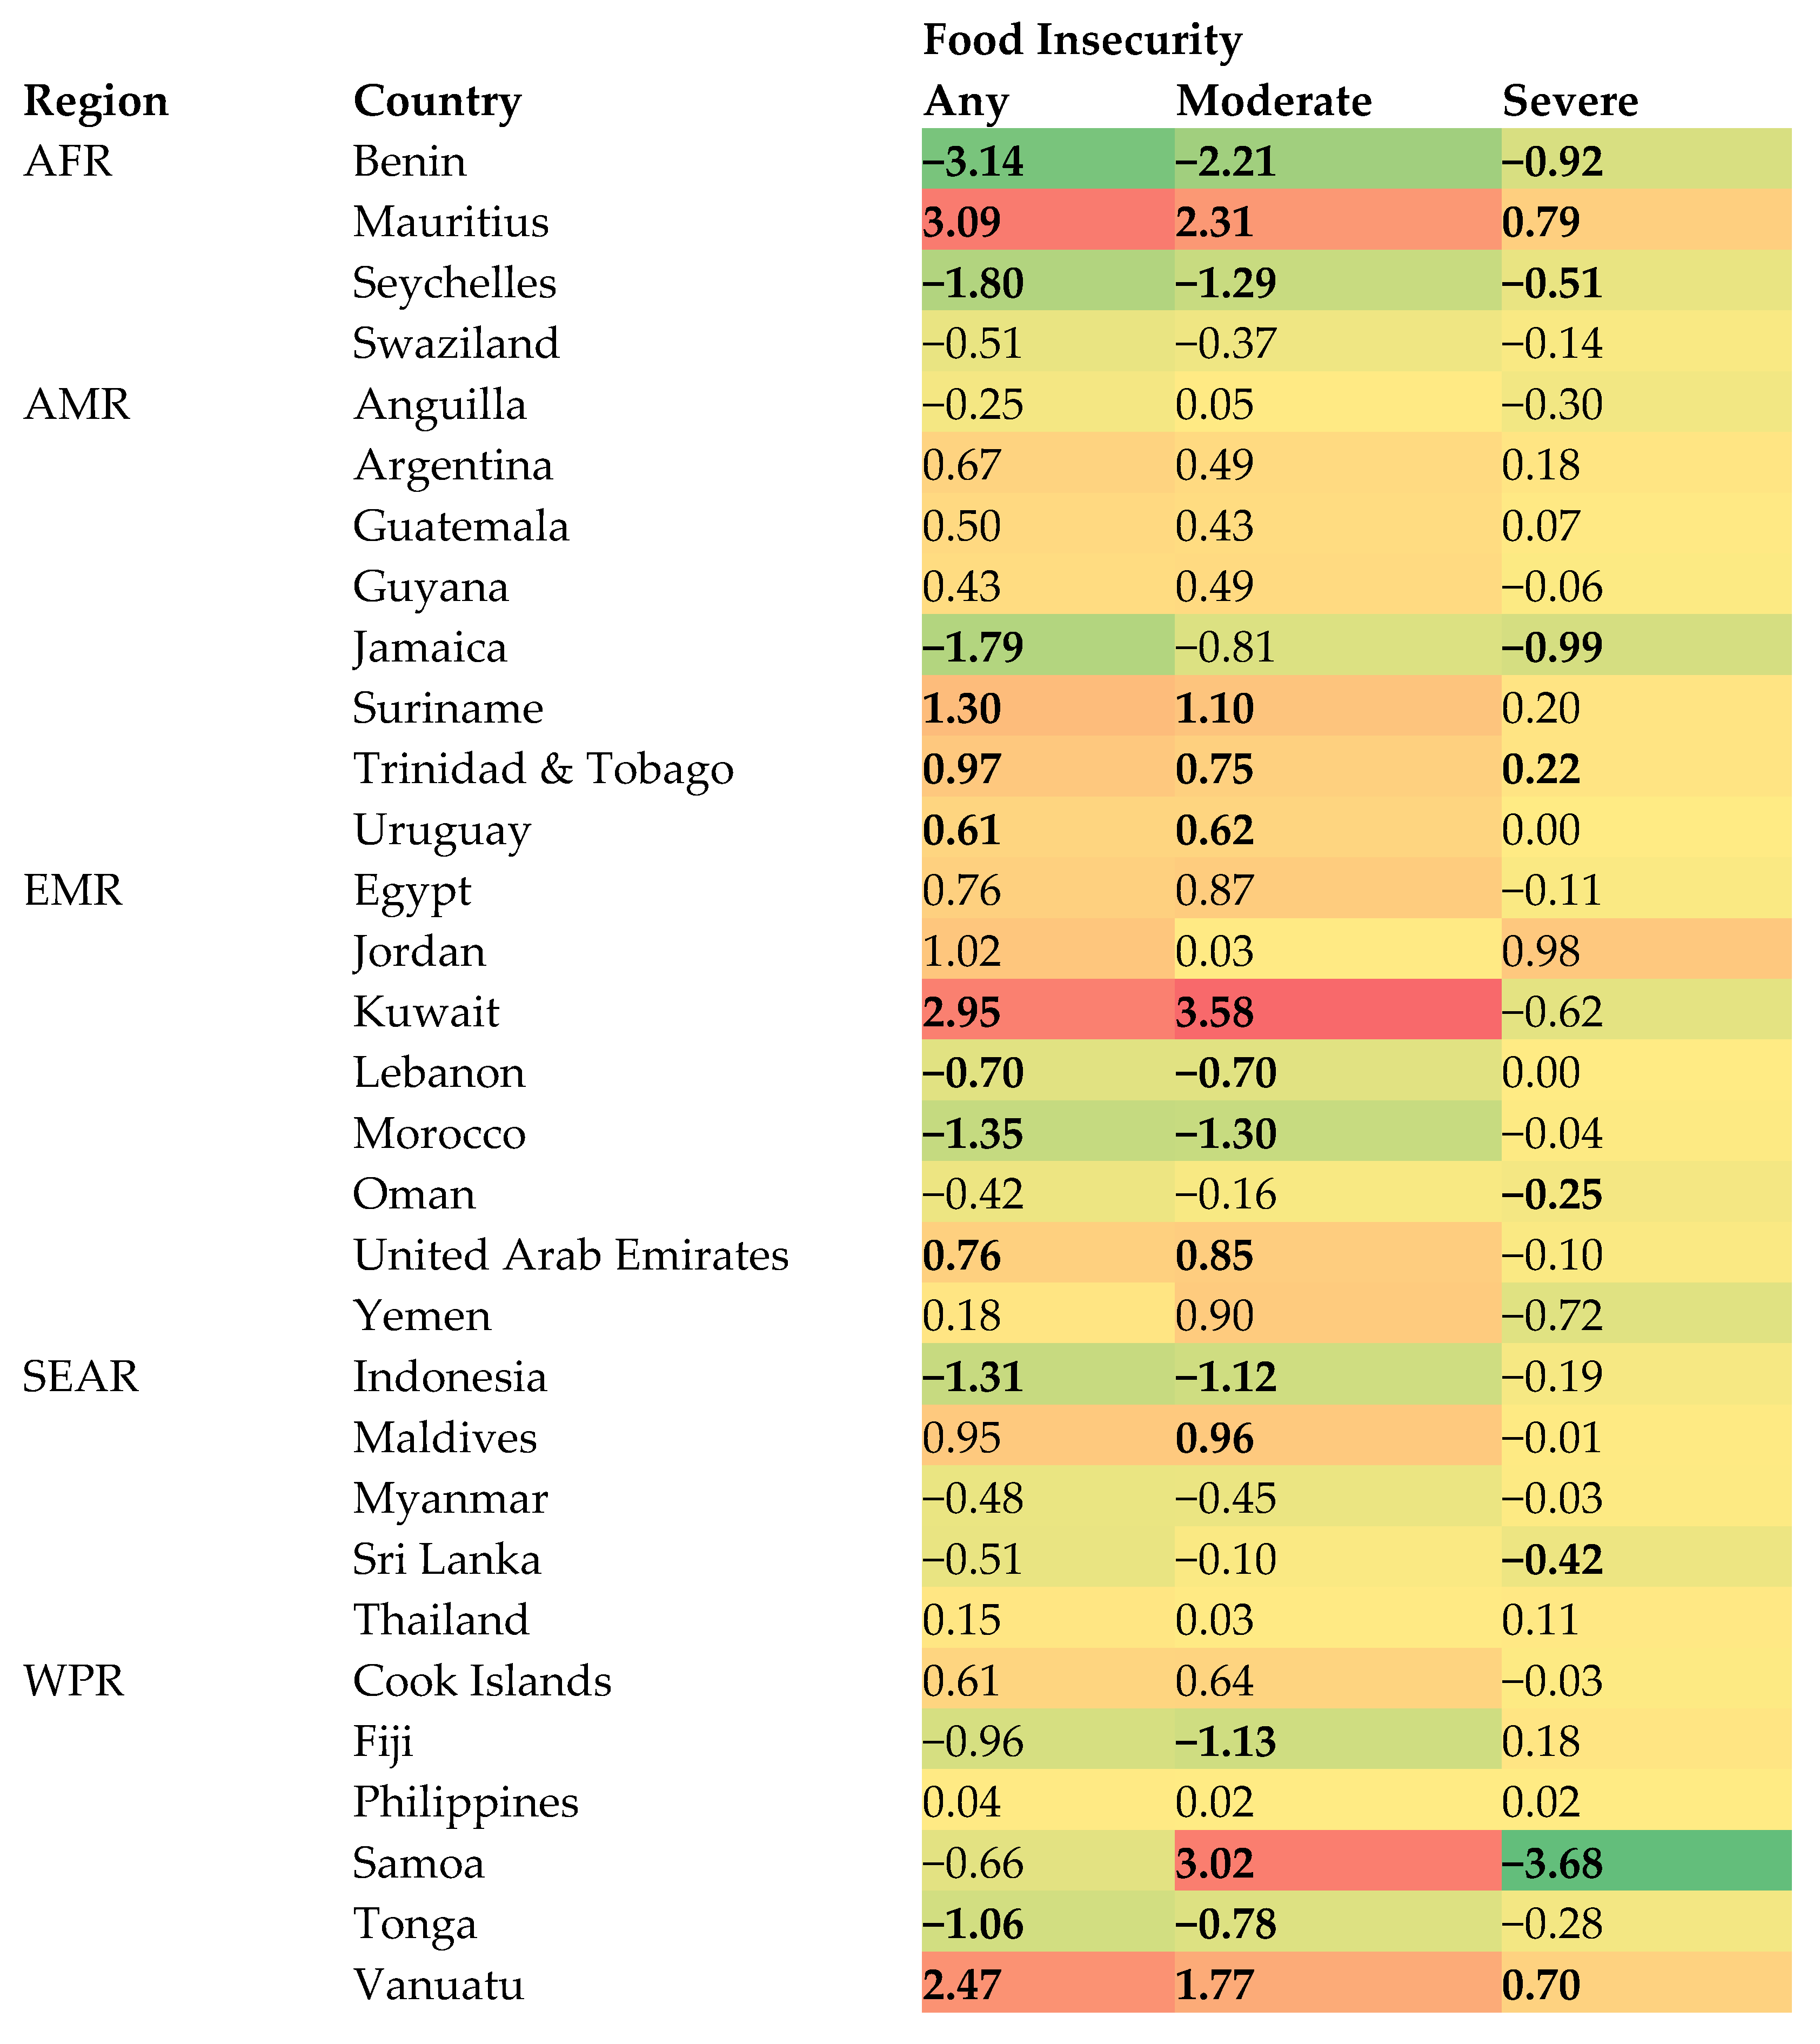
| Country | Year | % | [95%CI] | Beta a | [95%CI] | p for Trend a | Country | Year | % | [95%CI] | Beta a | [95%CI] | p for Trend a |
|---|---|---|---|---|---|---|---|---|---|---|---|---|---|
| AFR | EMR (continued) | ||||||||||||
| Benin | 2009 | 71.2 | [66.4, 75.6] | −3.14 | [−4.61, −1.66] | <0.001 | Morocco | 2006 | 44.7 | [41.7, 47.8] | −1.35 | [−1.74, −0.95] | <0.001 |
| 2016 | 49.2 | [40.5, 58.1] | 2010 | 30.7 | [26.8, 34.9] | ||||||||
| Mauritius | 2011 | 25.0 | [21.6, 28.8] | 3.09 | [2.16, 4.03] | <0.001 | 2016 | 29.5 | [27.3, 31.8] | ||||
| 2017 | 43.6 | [39.7, 47.6] | Oman | 2005 | 40.2 | [37.3, 43.1] | −0.42 | [−0.86, 0.03] | 0.066 | ||||
| Seychelles | 2007 | 58.6 | [57.9, 59.3] | −1.80 | [−2.21, −1.39] | <0.001 | 2010 | 40.9 | [36.9, 45.1] | ||||
| 2015 | 44.2 | [41.0, 47.4] | 2015 | 35.6 | [32.3, 38.9] | ||||||||
| Swaziland | 2003 | 52.2 | [49.8, 54.7] | −0.51 | [−1.04, 0.01] | 0.055 | United Arab Emirates | 2005 | 41.1 | [39.7, 42.5] | 0.76 | [0.34, 1.18] | <0.001 |
| 2013 | 47.1 | [42.6, 51.7] | 2010 | 29.1 | [26.9, 31.4] | ||||||||
| AMR | 2016 | 48.0 | [43.9, 52.2] | ||||||||||
| Anguilla | 2009 | 40.9 | [40.9, 40.9] | −0.25 | [−0.89, 0.39] | 0.432 | Yemen | 2008 | 57.2 | [48.5, 65.5] | 0.18 | [−1.66, 2.02] | 0.845 |
| 2016 | 39.2 | [34.9, 43.6] | 2014 | 58.3 | [52.0, 64.3] | ||||||||
| Argentina | 2007 | 31.6 | [28.2, 35.3] | 0.67 | [−0.08, 1.42] | 0.081 | SEAR | ||||||
| 2012 | 35.0 | [33.8, 36.1] | Indonesia | 2007 | 64.4 | [59.9, 68.6] | −1.31 | [−1.95, −0.67] | <0.001 | ||||
| Guatemala | 2009 | 33.5 | [28.6, 38.7] | 0.50 | [−0.88, 1.89] | 0.475 | 2015 | 53.9 | [51.3, 56.4] | ||||
| 2015 | 36.5 | [30.3, 43.2] | Maldives | 2009 | 34.2 | [30.3, 38.3] | 0.95 | [−0.19, 2.09] | 0.101 | ||||
| Guyana | 2004 | 42.7 | [37.4, 48.2] | 0.43 | [−0.82, 1.69] | 0.488 | 2014 | 39.0 | [35.0, 43.0] | ||||
| 2010 | 45.3 | [40.6, 50.1] | Myanmar | 2007 | 35.3 | [30.7, 40.1] | −0.48 | [−1.10, 0.13] | 0.122 | ||||
| Jamaica | 2010 | 59.6 | [55.3, 63.7] | −1.79 | [−2.79, −0.80] | 0.001 | 2016 | 30.9 | [28.3, 33.6] | ||||
| 2017 | 47.0 | [41.8, 52.3] | Sri Lanka | 2008 | 32.9 | [30.1, 35.8] | −0.51 | [−1.11, 0.08] | 0.088 | ||||
| Suriname | 2009 | 33.0 | [30.1, 36.0] | 1.30 | [0.37, 2.23] | 0.008 | 2016 | 28.8 | [25.3, 32.5] | ||||
| 2016 | 42.1 | [36.7, 47.6] | Thailand | 2008 | 52.6 | [49.4, 55.7] | 0.15 | [−0.49, 0.78] | 0.641 | ||||
| Trinidad & Tobago | 2007 | 39.2 | [34.7, 43.9] | 0.97 | [0.39, 1.55] | 0.001 | 2015 | 53.6 | [50.7, 56.6] | ||||
| 2011 | 45.3 | [41.3, 49.3] | WPR | ||||||||||
| 2017 | 49.1 | [45.5, 52.6] | Cook Islands | 2011 | 67.4 | [67.4, 67.4] | 0.61 | [−0.45, 1.67] | 0.251 | ||||
| Uruguay | 2006 | 18.7 | [16.9, 20.7] | 0.61 | [0.15, 1.08] | 0.011 | 2015 | 69.8 | [65.6, 73.8] | ||||
| 2012 | 22.4 | [20.5, 24.4] | Fiji | 2010 | 65.4 | [59.3, 71.0] | −0.96 | [−2.21, 0.29] | 0.129 | ||||
| EMR | 2016 | 59.6 | [55.5, 63.7] | ||||||||||
| Egypt | 2006 | 41.8 | [35.8, 48.1] | 0.76 | [−1.46, 2.97] | 0.496 | Philippines | 2003 | 68.8 | [65.2, 72.1] | 0.04 | [−0.27, 0.35] | 0.799 |
| 2011 | 45.6 | [37.0, 54.6] | 2007 | 68.3 | [65.9, 70.7] | ||||||||
| Jordan | 2004 | 47.2 | [43.7, 50.8] | 1.02 | [−1.03, 3.06] | 0.317 | 2011 | 64.5 | [60.7, 68.1] | ||||
| 2007 | 50.3 | [45.6, 54.9] | 2015 | 69.4 | [67.1, 71.7] | ||||||||
| Kuwait | 2011 | 37.8 | [34.9, 40.8] | 2.95 | [1.76, 4.15] | <0.001 | Samoa | 2011 | 81.2 | [78.5, 83.6] | −0.66 | [−1.49, 0.18] | 0.119 |
| 2015 | 49.6 | [46.1, 53.2] | 2017 | 77.2 | [72.8, 81.1] | ||||||||
| Lebanon | 2005 | 39.0 | [36.9, 41.1] | −0.70 | [−1.00, −0.39] | <0.001 | Tonga | 2010 | 74.1 | [71.6, 76.4] | −1.06 | [−1.61, −0.51] | <0.001 |
| 2011 | 33.5 | [30.5, 36.6] | 2017 | 66.6 | [63.6, 69.5] | ||||||||
| 2017 | 30.6 | [27.7, 33.6] | Vanuatu | 2011 | 49.7 | [42.3, 57.1] | 2.47 | [0.73, 4.21] | 0.006 | ||||
| 2016 | 62.0 | [57.8, 66.0] | |||||||||||
| Moderate Food Insecurity | Severe Food Insecurity | ||||||||||
|---|---|---|---|---|---|---|---|---|---|---|---|
| Country | Year | % | [95%CI] | Beta | [95%CI] | p for Trend | % | [95%CI] | Beta | [95%CI] | p for Trend |
| AFR | |||||||||||
| Benin | 2009 | 52.2 | [48.3, 56.2] | −2.21 | [−3.35, −1.08] | <0.001 | 19.0 | [14.7, 24.2] | −0.92 | [−1.83, −0.02] | 0.044 |
| 2016 | 36.7 | [30.5, 43.5] | 12.5 | [9.2, 16.8] | |||||||
| Mauritius | 2011 | 21.5 | [18.5, 25.0] | 2.31 | [1.50, 3.11] | <0.001 | 3.5 | [2.7, 4.5] | 0.79 | [0.25, 1.33] | 0.006 |
| 2017 | 35.4 | [32.2, 38.7] | 8.2 | [5.7, 11.7] | |||||||
| Seychelles | 2007 | 41.9 | [41.2, 42.6] | −1.29 | [−1.64, −0.95] | <0.001 | 16.6 | [16.1, 17.2] | −0.51 | [−0.81, −0.20] | 0.001 |
| 2015 | 31.6 | [29.0, 34.3] | 12.6 | [10.4, 15.1] | |||||||
| Swaziland | 2003 | 42.8 | [40.8, 44.8] | −0.37 | [−0.82, 0.07] | 0.096 | 9.4 | [8.3, 10.6] | −0.14 | [−0.39, 0.11] | 0.282 |
| 2013 | 39.1 | [35.3, 43.0] | 8.0 | [6.1, 10.6] | |||||||
| AMR | |||||||||||
| Anguilla | 2009 | 33.9 | [33.9, 33.9] | 0.05 | [−0.63, 0.72] | 0.891 | 7.0 | [7.0, 7.0] | −0.30 | [−0.61, 0.01] | 0.058 |
| 2016 | 34.2 | [29.8, 38.9] | 4.9 | [3.2, 7.5] | |||||||
| Argentina | 2007 | 29.0 | [25.3, 33.0] | 0.49 | [−0.31, 1.29] | 0.227 | 2.6 | [1.6, 4.2] | 0.18 | [−0.10, 0.46] | 0.216 |
| 2012 | 31.5 | [30.5, 32.5] | 3.5 | [2.9, 4.2] | |||||||
| Guatemala | 2009 | 31.2 | [26.6, 36.3] | 0.43 | [−0.87, 1.74] | 0.511 | 2.3 | [1.7, 3.0] | 0.07 | [−0.13, 0.27] | 0.507 |
| 2015 | 33.8 | [28.1, 40.0] | 2.7 | [1.8, 3.9] | |||||||
| Guyana | 2004 | 34.3 | [31.8, 37.0] | 0.49 | [−0.32, 1.30] | 0.227 | 8.4 | [5.2, 13.1] | −0.06 | [−0.87, 0.75] | 0.882 |
| 2010 | 37.3 | [33.4, 41.3] | 8.0 | [5.7, 11.1] | |||||||
| Jamaica | 2010 | 46.4 | [40.3, 52.6] | −0.81 | [−1.95, 0.34] | 0.161 | 13.1 | [9.7, 17.5] | −0.99 | [−1.62, −0.35] | 0.003 |
| 2017 | 40.8 | [36.2, 45.5] | 6.2 | [4.6, 8.4] | |||||||
| Suriname | 2009 | 24.8 | [22.5, 27.3] | 1.10 | [0.30, 1.89] | 0.009 | 8.1 | [6.4, 10.2] | 0.20 | [−0.14, 0.54] | 0.234 |
| 2016 | 32.5 | [28.0, 37.4] | 9.5 | [8.4, 10.9] | |||||||
| Trinidad & Tobago | 2007 | 33.2 | [29.1, 37.4] | 0.75 | [0.20, 1.29] | 0.008 | 6.0 | [4.5, 8.1] | 0.22 | [0.01, 0.43] | 0.036 |
| 2011 | 39.0 | [35.3, 42.8] | 6.3 | [5.2, 7.7] | |||||||
| 2017 | 40.9 | [37.3, 44.5] | 8.2 | [7.1, 9.5] | |||||||
| Uruguay | 2006 | 17.2 | [15.5, 19.1] | 0.62 | [0.17, 1.06] | 0.007 | 1.5 | [1.1, 2.0] | 0.00 | [−0.11, 0.10] | 0.949 |
| 2012 | 20.9 | [19.1, 22.9] | 1.5 | [1.1, 1.9] | |||||||
| EMR | |||||||||||
| Egypt | 2006 | 36.8 | [31.0, 43.0] | 0.87 | [−1.35, 3.09] | 0.435 | 5.1 | [3.8, 6.8] | −0.11 | [−0.58, 0.35] | 0.622 |
| 2011 | 41.1 | [32.5, 50.4] | 4.5 | [3.1, 6.5] | |||||||
| Jordan | 2004 | 37.0 | [34.9, 39.2] | 0.03 | [−1.49, 1.56] | 0.964 | 10.2 | [8.5, 12.3] | 0.98 | [−0.02, 1.99] | 0.055 |
| 2007 | 37.1 | [33.4, 41.0] | 13.2 | [11.1, 15.5] | |||||||
| Kuwait | 2011 | 28.9 | [26.3, 31.6] | 3.58 | [2.60, 4.56] | <0.001 | 8.9 | [7.3, 10.9] | −0.62 | [−1.35, 0.10] | 0.089 |
| 2015 | 43.2 | [40.6, 45.9] | 6.4 | [4.6, 8.9] | |||||||
| Lebanon | 2005 | 36.0 | [34.0, 38.0] | −0.70 | [−0.98, −0.41] | <0.001 | 3.0 | [2.6, 3.6] | 0.00 | [−0.07, 0.07] | 0.951 |
| 2011 | 29.9 | [27.3, 32.6] | 3.6 | [2.5, 5.1] | |||||||
| 2017 | 27.5 | [24.9, 30.2] | 3.1 | [2.5, 3.8] | |||||||
| Morocco | 2006 | 35.7 | [33.3, 38.1] | −1.30 | [−1.71, −0.90] | <0.001 | 9.0 | [7.2, 11.4] | −0.04 | [−0.30, 0.22] | 0.741 |
| 2010 | 21.0 | [17.5, 24.9] | 9.7 | [8.5, 11.1] | |||||||
| 2016 | 20.7 | [18.0, 23.7] | 8.8 | [7.3, 10.5] | |||||||
| Oman | 2005 | 32.8 | [30.0, 35.6] | −0.16 | [−0.60, 0.27] | 0.453 | 7.4 | [6.2, 8.7] | −0.25 | [−0.43, −0.08] | 0.006 |
| 2010 | 32.0 | [28.7, 35.4] | 8.9 | [7.0, 11.3] | |||||||
| 2015 | 31.1 | [28.0, 34.5] | 4.4 | [3.4, 5.7] | |||||||
| United Arab Emirates | 2005 | 32.1 | [30.9, 33.4] | 0.85 | [0.47, 1.24] | <0.001 | 8.9 | [8.2, 9.7] | −0.10 | [−0.23, 0.04] | 0.163 |
| 2010 | 24.3 | [22.8, 25.8] | 4.8 | [3.6, 6.4] | |||||||
| 2016 | 40.5 | [36.7, 44.3] | 7.5 | [6.4, 8.9] | |||||||
| Yemen | 2008 | 41.8 | [36.2, 47.6] | 0.90 | [−0.63, 2.42] | 0.240 | 15.4 | [10.3, 22.4] | −0.72 | [−1.82, 0.38] | 0.192 |
| 2014 | 47.2 | [40.6, 53.9] | 11.1 | [9.2, 13.3] | |||||||
| SEAR | |||||||||||
| Indonesia | 2007 | 58.7 | [55.0, 62.2] | −1.12 | [−1.69, −0.56] | <0.001 | 5.7 | [4.0, 8.0] | −0.19 | [−0.45, 0.07] | 0.157 |
| 2015 | 49.7 | [47.1, 52.2] | 4.2 | [3.6, 4.9] | |||||||
| Maldives | 2009 | 28.1 | [25.4, 31.1] | 0.96 | [0.03, 1.90] | 0.044 | 6.1 | [4.4, 8.3] | −0.01 | [−0.49, 0.47] | 0.966 |
| 2014 | 32.9 | [29.4, 36.7] | 6.0 | [4.8, 7.6] | |||||||
| Myanmar | 2007 | 32.4 | [28.2, 36.9] | −0.45 | [−1.00, 0.10] | 0.107 | 2.9 | [1.8, 4.6] | −0.03 | [−0.25, 0.18] | 0.745 |
| 2016 | 28.4 | [26.3, 30.5] | 2.5 | [1.5, 4.2] | |||||||
| Sri Lanka | 2008 | 26.2 | [23.2, 29.4] | −0.10 | [−0.71, 0.52] | 0.749 | 6.7 | [5.7, 7.9] | −0.42 | [−0.59, −0.25] | <0.001 |
| 2016 | 25.4 | [22.0, 29.2] | 3.4 | [2.7, 4.2] | |||||||
| Thailand | 2008 | 49.1 | [46.3, 52.0] | 0.03 | [−0.52, 0.59] | 0.900 | 3.5 | [2.7, 4.5] | 0.11 | [−0.08, 0.30] | 0.237 |
| 2015 | 49.4 | [46.9, 51.9] | 4.3 | [3.4, 5.3] | |||||||
| WPR | |||||||||||
| Cook Islands | 2011 | 59.0 | [59.0, 59.0] | 0.64 | [−0.79, 2.07] | 0.372 | 8.4 | [8.4, 8.4] | −0.03 | [−0.87, 0.81] | 0.943 |
| 2015 | 61.6 | [55.9, 66.9] | 8.3 | [5.5, 12.2] | |||||||
| Fiji | 2010 | 54.9 | [50.2, 59.5] | −1.13 | [−2.19, −0.08] | 0.036 | 10.5 | [8.6, 12.7] | 0.18 | [−0.32, 0.67] | 0.467 |
| 2016 | 48.1 | [44.2, 52.0] | 11.6 | [9.7, 13.7] | |||||||
| Philippines | 2003 | 61.5 | [58.5, 64.5] | 0.02 | [−0.24, 0.28] | 0.880 | 7.2 | [6.0, 8.6] | 0.02 | [−0.12, 0.16] | 0.775 |
| 2007 | 61.8 | [59.6, 64.0] | 6.5 | [5.7, 7.5] | |||||||
| 2011 | 57.8 | [54.1, 61.4] | 6.6 | [5.5, 8.1] | |||||||
| 2015 | 62.2 | [60.3, 64.0] | 7.2 | [6.1, 8.5] | |||||||
| Samoa | 2011 | 45.2 | [41.3, 49.1] | 3.02 | [1.99, 4.05] | <0.001 | 36.0 | [33.7, 38.3] | −3.68 | [−4.46, −2.90] | <0.001 |
| 2017 | 63.3 | [58.6, 67.8] | 13.9 | [10.4, 18.3] | |||||||
| Tonga | 2010 | 60.3 | [57.5, 63.1] | −0.78 | [−1.34, −0.22] | 0.007 | 13.7 | [12.0, 15.7] | −0.28 | [−0.66, 0.10] | 0.149 |
| 2017 | 54.9 | [52.1, 57.6] | 11.8 | [10.0, 13.8] | |||||||
| Vanuatu | 2011 | 44.7 | [38.2, 51.5] | 1.77 | [0.04, 3.49] | 0.045 | 4.9 | [3.3, 7.2] | 0.70 | [0.17, 1.23] | 0.011 |
| 2016 | 53.6 | [48.4, 58.6] | 8.4 | [6.8, 10.4] | |||||||
Disclaimer/Publisher’s Note: The statements, opinions and data contained in all publications are solely those of the individual author(s) and contributor(s) and not of MDPI and/or the editor(s). MDPI and/or the editor(s) disclaim responsibility for any injury to people or property resulting from any ideas, methods, instructions or products referred to in the content. |
© 2023 by the authors. Licensee MDPI, Basel, Switzerland. This article is an open access article distributed under the terms and conditions of the Creative Commons Attribution (CC BY) license (https://creativecommons.org/licenses/by/4.0/).
Share and Cite
Smith, L.; López Sánchez, G.F.; Tully, M.A.; Jacob, L.; Kostev, K.; Oh, H.; Butler, L.; Barnett, Y.; Shin, J.I.; Koyanagi, A. Temporal Trends in Food Insecurity (Hunger) among School-Going Adolescents from 31 Countries from Africa, Asia, and the Americas. Nutrients 2023, 15, 3226. https://doi.org/10.3390/nu15143226
Smith L, López Sánchez GF, Tully MA, Jacob L, Kostev K, Oh H, Butler L, Barnett Y, Shin JI, Koyanagi A. Temporal Trends in Food Insecurity (Hunger) among School-Going Adolescents from 31 Countries from Africa, Asia, and the Americas. Nutrients. 2023; 15(14):3226. https://doi.org/10.3390/nu15143226
Chicago/Turabian StyleSmith, Lee, Guillermo F. López Sánchez, Mark A. Tully, Louis Jacob, Karel Kostev, Hans Oh, Laurie Butler, Yvonne Barnett, Jae Il Shin, and Ai Koyanagi. 2023. "Temporal Trends in Food Insecurity (Hunger) among School-Going Adolescents from 31 Countries from Africa, Asia, and the Americas" Nutrients 15, no. 14: 3226. https://doi.org/10.3390/nu15143226
APA StyleSmith, L., López Sánchez, G. F., Tully, M. A., Jacob, L., Kostev, K., Oh, H., Butler, L., Barnett, Y., Shin, J. I., & Koyanagi, A. (2023). Temporal Trends in Food Insecurity (Hunger) among School-Going Adolescents from 31 Countries from Africa, Asia, and the Americas. Nutrients, 15(14), 3226. https://doi.org/10.3390/nu15143226