
Inverse Association between Cheese Consumption and Lower Cognitive Function in Japanese Community-Dwelling Older Adults Based on a Cross-Sectional Study
 , , ,
, , ,
Abstract
1. Introduction
2. Materials and Methods
2.1. Subjects
2.2. Outcome Measures
2.3. Data Analysis
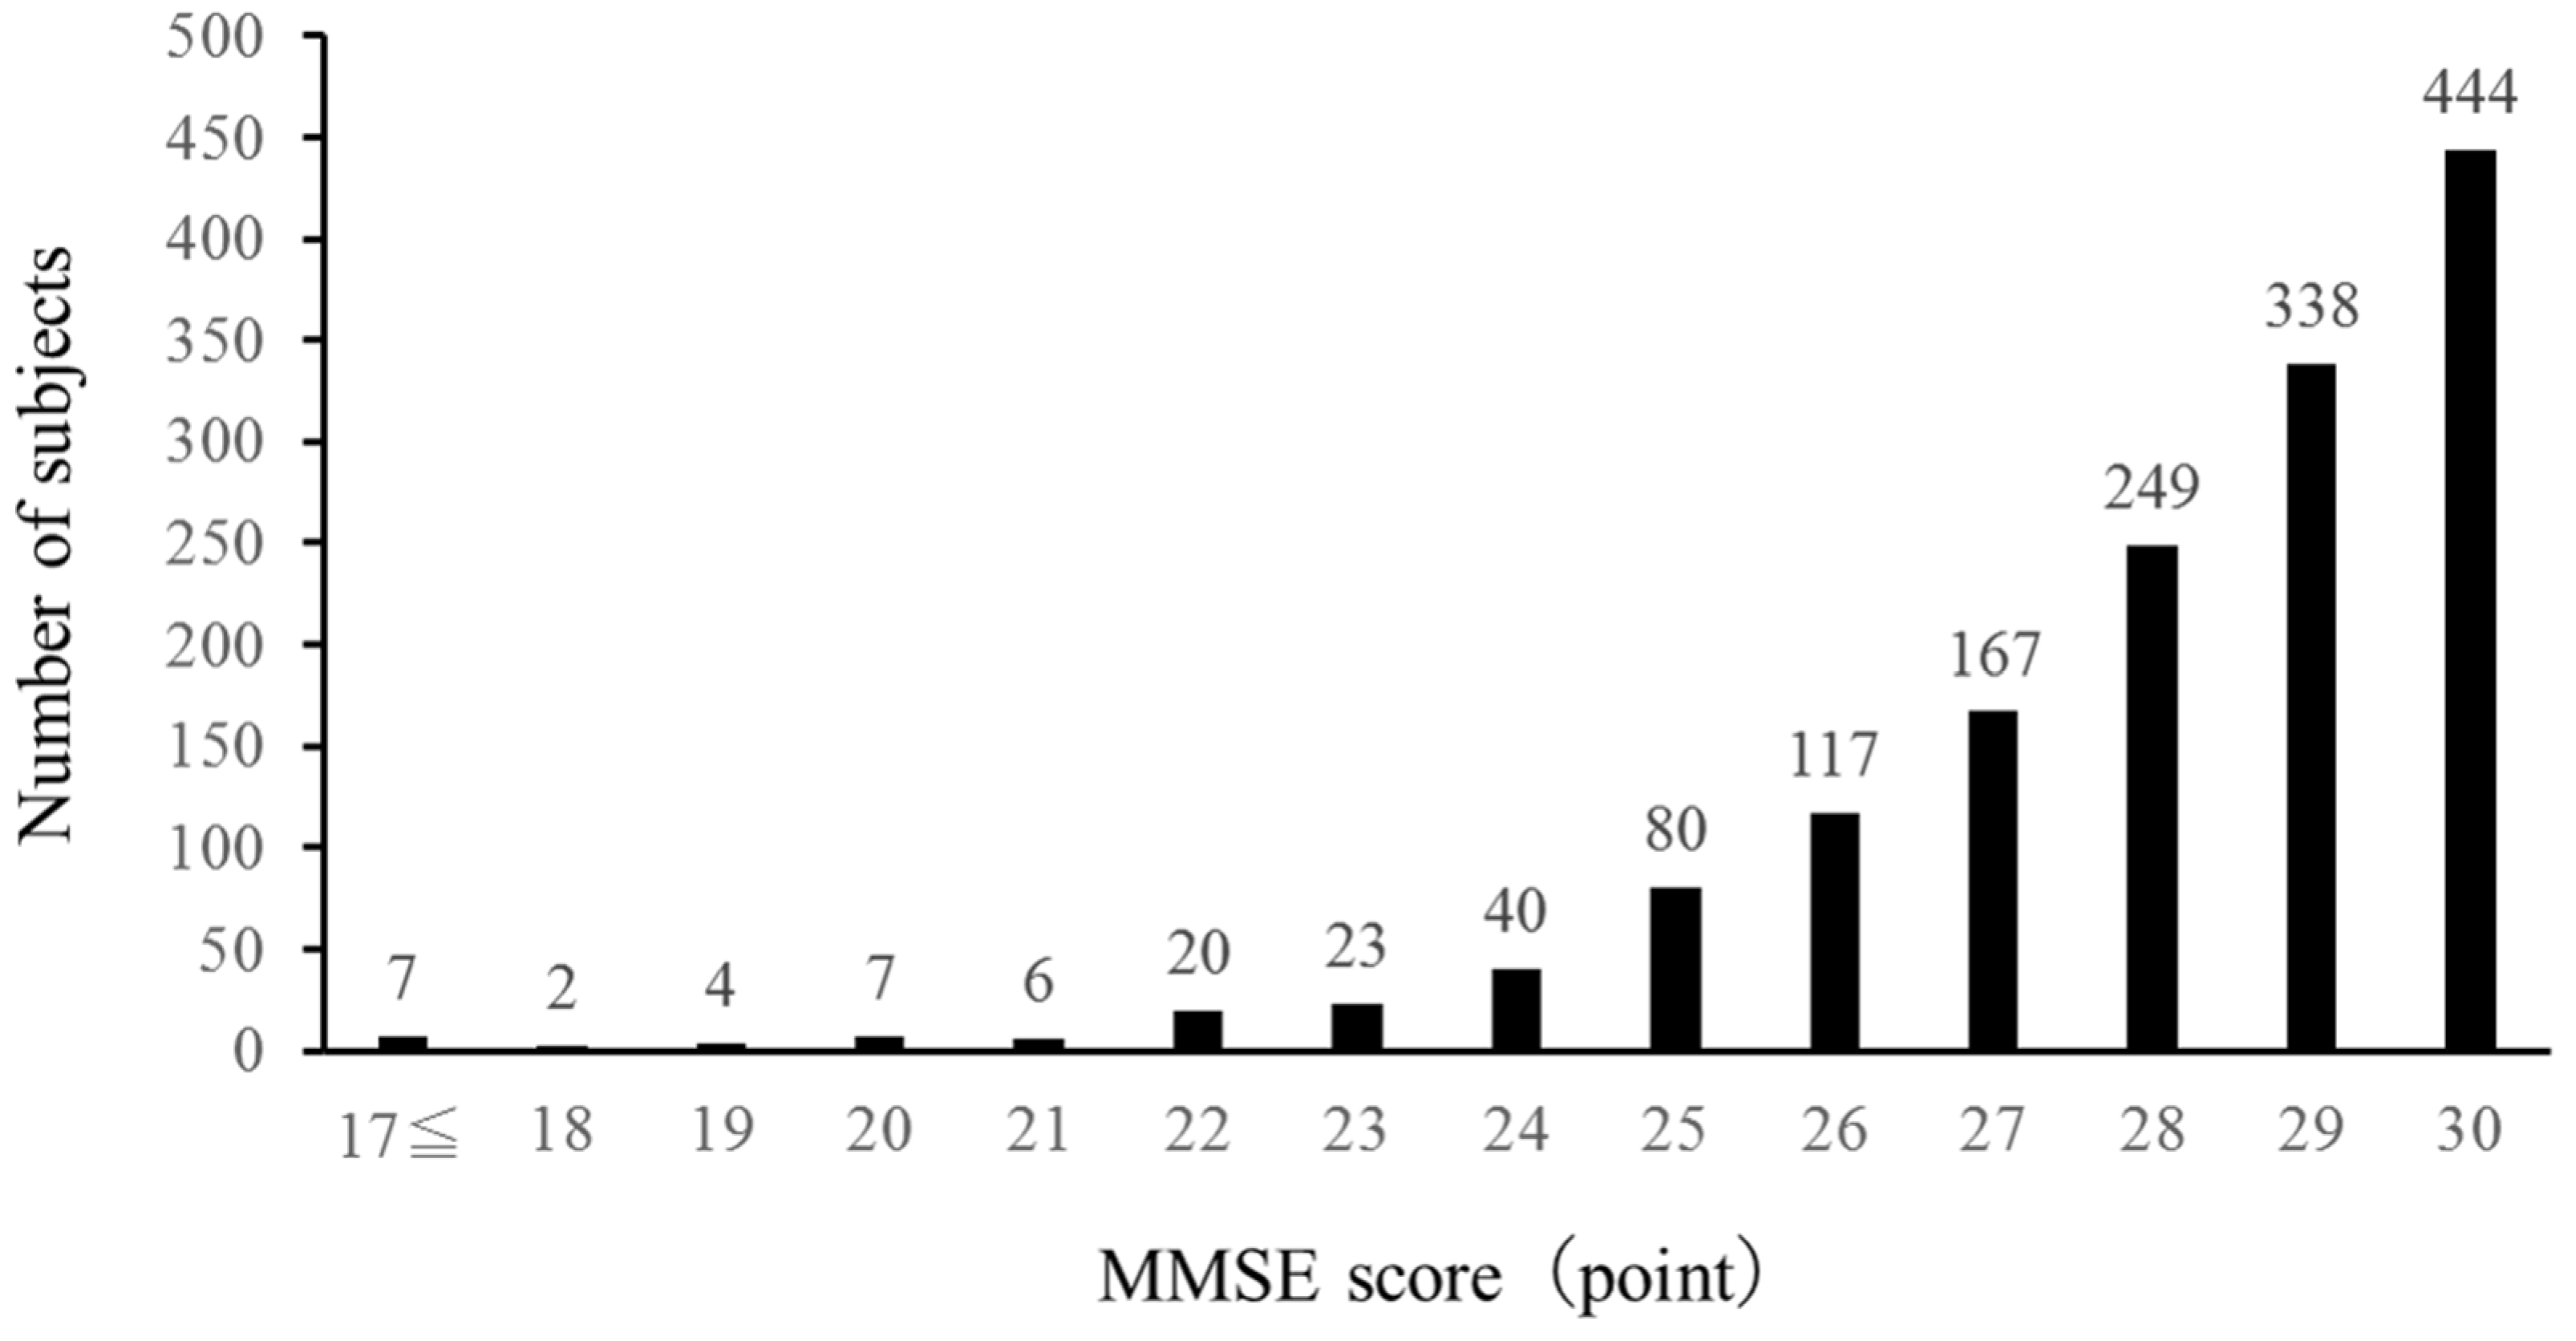
3. Results
4. Discussion
5. Conclusions
Author Contributions
Funding
Institutional Review Board Statement
Informed Consent Statement
Data Availability Statement
Conflicts of Interest
References
- Grande, G.; Qiu, C.; Fratiglioni, L. Prevention of dementia in an ageing world: Evidence and biological rationale. Ageing Res. Rev. 2020, 64, 101045. [Google Scholar] [CrossRef] [PubMed]
- Livingston, G.; Huntley, J.; Sommerlad, A.; Ames, D.; Ballard, C.; Banerjee, S.; Brayne, C.; Burns, A.; Cohen-Mansfield, J.; Cooper, C.; et al. Dementia prevention, intervention, and care: 2020 report of the Lancet Commission. Lancet 2020, 396, 413–446. [Google Scholar] [CrossRef] [PubMed]
- Luchsinger, J.A.; Tang, M.X.; Siddiqui, M.; Shea, S.; Mayeux, R. Alcohol intake and risk of dementia. J. Am. Geriatr. Soc. 2004, 52, 540–546. [Google Scholar] [CrossRef]
- Singh, B.; Parsaik, A.K.; Mielke, M.M.; Erwin, P.J.; Knopman, D.S.; Petersen, R.C.; Roberts, R.O. Association of mediterranean diet with mild cognitive impairment and Alzheimer’s disease: A systematic review and meta-analysis. J. Alzheimers. Dis. 2014, 39, 271–282. [Google Scholar] [CrossRef] [PubMed]
- Sofi, F.; Valecchi, D.; Bacci, D.; Abbate, R.; Gensini, G.F.; Casini, A.; Macchi, C. Physical activity and risk of cognitive decline: A meta-analysis of prospective studies. J. Intern. Med. 2011, 269, 107–117. [Google Scholar] [CrossRef]
- Talaei, M.; Feng, L.; Yuan, J.M.; Pan, A.; Koh, W.P. Dairy, soy, and calcium consumption and risk of cognitive impairment: The Singapore Chinese Health Study. Eur. J. Nutr. 2020, 59, 1541–1552. [Google Scholar] [CrossRef] [PubMed]
- Brangier, A.; Ferland, G.; Rolland, Y.; Gautier, J.; Féart, C.; Annweiler, C. Vitamin K Antagonists and Cognitive Decline in Older Adults: A 24-Month Follow-Up. Nutrients 2018, 10, 666. [Google Scholar] [CrossRef] [PubMed]
- Lin, C.H.; Lane, H.Y. Blood D-Amino Acid Oxidase Levels Increased with Cognitive Decline among People with Mild Cognitive Impairment: A Two-Year Prospective Study. Int. J. Neuropsychopharmacol. 2022, 25, 660–665. [Google Scholar] [CrossRef]
- Pal, K.; Mukadam, N.; Petersen, I.; Cooper, C. Mild cognitive impairment and progression to dementia in people with diabetes, prediabetes and metabolic syndrome: A systematic review and meta-analysis. Soc. Psychiatry Psychiatr. Epidemiol. 2018, 53, 1149–1160. [Google Scholar] [CrossRef]
- Samper-Ternent, R.; Al Snih, S.; Raji, M.A.; Markides, K.S.; Ottenbacher, K.J. Relationship between frailty and cognitive decline in older Mexican Americans. J. Am. Geriatr. Soc. 2008, 56, 1845–1852. [Google Scholar] [CrossRef]
- Slinin, Y.; Paudel, M.; Taylor, B.C.; Ishani, A.; Rossom, R.; Yaffe, K.; Blackwell, T.; Lui, L.Y.; Hochberg, M.; Ensrud, K.E. Association between serum 25(OH) vitamin D and the risk of cognitive decline in older women. J. Gerontol. A Biol. Sci. Med. Sci. 2012, 67, 1092–1098. [Google Scholar] [CrossRef] [PubMed]
- Otsuka, R.; Kato, Y.; Nishita, Y.; Tange, C.; Nakamoto, M.; Tomida, M.; Imai, T.; Ando, F.; Shimokata, H. Cereal Intake Increases and Dairy Products Decrease Risk of Cognitive Decline among Elderly Female Japanese. J. Prev. Alzheimers. Dis. 2014, 1, 160–167. [Google Scholar] [CrossRef] [PubMed]
- Ozawa, M.; Ohara, T.; Ninomiya, T.; Hata, J.; Yoshida, D.; Mukai, N.; Nagata, M.; Uchida, K.; Shirota, T.; Kitazono, T.; et al. Milk and dairy consumption and risk of dementia in an elderly Japanese population: The Hisayama Study. J. Am. Geriatr. Soc. 2014, 62, 1224–1230. [Google Scholar] [CrossRef] [PubMed]
- Bigman, G.; Shea, K.M.; Rusu, M.E.; Ryan, A.S. Intake of dark green vegetables may benefit specific cognitive domains in US men and women aged 60 years or older. Nutr. Healthy Aging 2023, 8, 67–77. [Google Scholar] [CrossRef]
- de Goeij, L.C.; van de Rest, O.; Feskens, E.J.M.; de Groot, L.; Brouwer-Brolsma, E.M. Associations between the Intake of Different Types of Dairy and Cognitive Performance in Dutch Older Adults: The B-PROOF Study. Nutrients 2020, 12, 468. [Google Scholar] [CrossRef]
- Suzuki, T.; Kojima, N.; Osuka, Y.; Tokui, Y.; Takasugi, S.; Kawashima, A.; Yamaji, T.; Hosoi, E.; Won, C.W.; Kim, H. The Effects of Mold-Fermented Cheese on Brain-Derived Neurotrophic Factor in Community-Dwelling Older Japanese Women with Mild Cognitive Impairment: A Randomized, Controlled, Crossover Trial. J. Am. Med. Dir. Assoc. 2019, 20, 1509–1514.e1502. [Google Scholar] [CrossRef]
- Folstein, M.F.; Folstein, S.E.; McHugh, P.R. “Mini-mental state”. A practical method for grading the cognitive state of patients for the clinician. J. Psychiatr. Res. 1975, 12, 189–198. [Google Scholar] [CrossRef]
- Ni, J.; Nishi, S.K.; Babio, N.; Martínez-González, M.A.; Corella, D.; Castañer, O.; Martínez, J.A.; Alonso-Gómez, Á.M.; Gómez-Gracia, E.; Vioque, J.; et al. Dairy Product Consumption and Changes in Cognitive Performance: Two-Year Analysis of the PREDIMED-Plus Cohort. Mol. Nutr. Food Res. 2022, 66, e2101058. [Google Scholar] [CrossRef]
- Lee, J.; Fu, Z.; Chung, M.; Jang, D.J.; Lee, H.J. Role of milk and dairy intake in cognitive function in older adults: A systematic review and meta-analysis. Nutr. J. 2018, 17, 82. [Google Scholar] [CrossRef]
- Osuka, Y.; Kojima, N.; Sakurai, R.; Watanabe, Y.; Kim, H. Reliability and construct validity of a novel motor-cognitive dual-task test: A Stepping Trail Making Test. Geriatr. Gerontol. Int. 2020, 20, 291–296. [Google Scholar] [CrossRef]
- Hayakawa, M.; Motokawa, K.; Mikami, Y.; Yamamoto, K.; Shirobe, M.; Edahiro, A.; Iwasaki, M.; Ohara, Y.; Watanabe, Y.; Kawai, H.; et al. Low Dietary Variety and Diabetes Mellitus Are Associated with Frailty among Community-Dwelling Older Japanese Adults: A Cross-Sectional Study. Nutrients 2021, 13, 641. [Google Scholar] [CrossRef] [PubMed]
- O’Bryant, S.E.; Humphreys, J.D.; Smith, G.E.; Ivnik, R.J.; Graff-Radford, N.R.; Petersen, R.C.; Lucas, J.A. Detecting dementia with the mini-mental state examination in highly educated individuals. Arch. Neurol. 2008, 65, 963–967. [Google Scholar] [CrossRef] [PubMed]
- Rahman, A.; Sawyer Baker, P.; Allman, R.M.; Zamrini, E. Dietary factors and cognitive impairment in community-dwelling elderly. J. Nutr. Health Aging 2007, 11, 49–54. [Google Scholar] [PubMed]
- Ylilauri, M.P.T.; Hantunen, S.; Lönnroos, E.; Salonen, J.T.; Tuomainen, T.P.; Virtanen, J.K. Associations of dairy, meat, and fish intakes with risk of incident dementia and with cognitive performance: The Kuopio Ischaemic Heart Disease Risk Factor Study (KIHD). Eur. J. Nutr. 2022, 61, 2531–2542. [Google Scholar] [CrossRef] [PubMed]
- Tessier, A.J.; Presse, N.; Rahme, E.; Ferland, G.; Bherer, L.; Chevalier, S. Milk, Yogurt, and Cheese Intake Is Positively Associated with Cognitive Executive Functions in Older Adults of the Canadian Longitudinal Study on Aging. J. Gerontol. A Biol. Sci. Med. Sci. 2021, 76, 2223–2231. [Google Scholar] [CrossRef]
- Milte, C.M.; Ball, K.; Crawford, D.; McNaughton, S.A. Diet quality and cognitive function in mid-aged and older men and women. BMC Geriatr. 2019, 19, 361. [Google Scholar] [CrossRef]
- Mena-Sánchez, G.; Babio, N.; Martínez-González, M.; Corella, D.; Schröder, H.; Vioque, J.; Romaguera, D.; Martínez, J.A.; Lopez-Miranda, J.; Estruch, R.; et al. Fermented dairy products, diet quality, and cardio-metabolic profile of a Mediterranean cohort at high cardiovascular risk. Nutr. Metab. Cardiovasc. Dis. 2018, 28, 1002–1011. [Google Scholar] [CrossRef]
- Dalmeijer, G.W.; Struijk, E.A.; van der Schouw, Y.T.; Soedamah-Muthu, S.S.; Verschuren, W.M.; Boer, J.M.; Geleijnse, J.M.; Beulens, J.W. Dairy intake and coronary heart disease or stroke—A population-based cohort study. Int. J. Cardiol. 2013, 167, 925–929. [Google Scholar] [CrossRef]
- Wang, H.; Zhang, H.; Chen, Y.; Cai, M.; Guo, C.; Chen, P. Association between walking speed and cognitive domain functions in Chinese suburban-dwelling older adults. Front. Aging Neurosci. 2022, 14, 935291. [Google Scholar] [CrossRef]
- Welmer, A.K.; Rizzuto, D.; Qiu, C.; Caracciolo, B.; Laukka, E.J. Walking speed, processing speed, and dementia: A population-based longitudinal study. J. Gerontol. A Biol. Sci. Med. Sci. 2014, 69, 1503–1510. [Google Scholar] [CrossRef]
- Chen, L.K.; Woo, J.; Assantachai, P.; Auyeung, T.W.; Chou, M.Y.; Iijima, K.; Jang, H.C.; Kang, L.; Kim, M.; Kim, S.; et al. Asian Working Group for Sarcopenia: 2019 Consensus Update on Sarcopenia Diagnosis and Treatment. J. Am. Med. Dir. Assoc. 2020, 21, 300–307.e302. [Google Scholar] [CrossRef] [PubMed]
- Kim, M.; Jeong, M.J.; Yoo, J.; Song, D.Y.; Won, C.W. Calf Circumference as a Screening Tool for Cognitive Frailty in Community-Dwelling Older Adults: The Korean Frailty and Aging Cohort Study (KFACS). J. Clin. Med. 2018, 7, 332. [Google Scholar] [CrossRef] [PubMed]
- Knol, M.J.; Le Cessie, S.; Algra, A.; Vandenbroucke, J.P.; Groenwold, R.H. Overestimation of risk ratios by odds ratios in trials and cohort studies: Alternatives to logistic regression. CMAJ 2012, 184, 895–899. [Google Scholar] [CrossRef] [PubMed]


| Variables | Category | N | % |
|---|---|---|---|
| Cheese intake | Daily | 418 | 27.6 |
| Once every two days | 358 | 23.7 | |
| 1–2 times a week | 449 | 29.7 | |
| No intake | 287 | 19.0 | |
| Type of cheese * | Processed cheese | 1082 | 65.7 |
| Fresh cheese | 215 | 13.0 | |
| White mold cheese | 252 | 15.3 | |
| Blue mold cheese | 41 | 2.5 | |
| Other | 57 | 3.5 |
| Variable | Cheese Intake | N | M | SD | t-Value † | p-Value | |
|---|---|---|---|---|---|---|---|
| Age, yrs | Yes | 1225 | 76.29 | ± | 4.82 | 1.445 | 0.074 |
| No | 287 | 76.75 | ± | 4.78 | |||
| BMI, kg/m2 | Yes | 1213 | 22.70 | ± | 3.35 | 0.695 | 0.244 |
| No | 279 | 22.85 | ± | 3.32 | |||
| SBP, mmHg | Yes | 1225 | 134.38 | ± | 17.46 | 0.741 | 0.229 |
| No | 287 | 135.24 | ± | 18.29 | |||
| DBP, mmHg | Yes | 1225 | 75.64 | ± | 11.23 | 0.439 | 0.330 |
| No | 287 | 75.97 | ± | 12.19 | |||
| % body fat, % | Yes | 1212 | 29.48 | ± | 8.95 | 0.027 | 0.489 |
| No | 277 | 29.49 | ± | 8.71 | |||
| Calf circumference, cm | Yes | 1225 | 34.37 | ± | 3.28 | 1.097 | 0.136 |
| No | 286 | 34.14 | ± | 3.08 | |||
| Grip strength, kg | Yes | 1221 | 22.28 | ± | 6.14 | 0.788 | 0.216 |
| No | 286 | 21.93 | ± | 6.75 | |||
| Usual walking speed, m/s | Yes | 1223 | 1.30 | ± | 0.25 | 3.517 | <0.001 |
| No | 281 | 1.24 | ± | 0.26 | |||
| MMSE score | Yes | 1218 | 28.11 | ± | 2.16 | 4.412 | <0.001 |
| No | 285 | 27.24 | ± | 3.17 | |||
| Number of teeth, N | Yes | 1224 | 20.00 | ± | 8.56 | 2.242 | 0.013 |
| No | 287 | 18.66 | ± | 9.27 | |||
| Creatinine, mg/dL | Yes | 1223 | 0.77 | ± | 0.34 | 0.788 | 0.215 |
| No | 287 | 0.78 | ± | 0.24 | |||
| Total cholesterol, mg/dL | Yes | 1223 | 214.52 | ± | 34.92 | 2.120 | 0.017 |
| No | 287 | 209.67 | ± | 34.57 | |||
| HDL cholesterol, mg/dL | Yes | 1223 | 68.47 | ± | 17.70 | 2.339 | 0.010 |
| No | 287 | 65.77 | ± | 17.15 | |||
| Triglycerides, mg/dL | Yes | 1223 | 145.40 | ± | 84.91 | 0.155 | 0.438 |
| No | 287 | 146.26 | ± | 86.60 | |||
| Albumin, g/dL | Yes | 1223 | 4.29 | ± | 0.27 | 0.395 | 0.346 |
| No | 287 | 4.28 | ± | 0.29 | |||
| HbA1c, % | Yes | 1222 | 5.99 | ± | 0.58 | 1.239 | 0.108 |
| No | 287 | 5.94 | ± | 0.60 | |||
| Number of chronic diseases, N | Yes | 1221 | 1.90 | ± | 1.31 | 0.017 | 0.493 |
| No | 286 | 1.90 | ± | 1.35 | |||
| Dietary variety score, point | Yes | 1218 | 4.65 | ± | 2.05 | 6.538 | <0.001 |
| No | 285 | 3.77 | ± | 2.04 | |||
| Anemia: yes, % | Yes | 1223 | 3.7 | 2.725 | 0.099 | ||
| No | 287 | 1.7 | |||||
| Urinary incontinence: yes, % | Yes | 1225 | 37.1 | 4.042 | 0.044 | ||
| No | 287 | 43.6 | |||||
| Milk intake: yes, % | Yes | 1225 | 79.3 | 57.773 | <0.001 | ||
| No | 287 | 57.8 | |||||
| Variable | Group | N | M | SD | t-Value † | p-Value | |
|---|---|---|---|---|---|---|---|
| Age, yrs | MMSE ≦ 23 | 69 | 80.13 | ± | 4.04 | 6.750 | <0.001 |
| MMSE > 23 | 1435 | 76.18 | ± | 4.77 | |||
| BMI, kg/m2 | MMSE ≦ 23 | 67 | 22.37 | ± | 3.64 | 0.903 | 0.183 |
| MMSE > 23 | 1417 | 22.75 | ± | 3.32 | |||
| SBP, mmHg | MMSE ≦ 23 | 69 | 134.99 | ± | 19.24 | 0.208 | 0.418 |
| MMSE > 23 | 1435 | 134.54 | ± | 17.50 | |||
| DBP, mmHg | MMSE ≦ 23 | 69 | 75.75 | ± | 13.99 | 0.019 | 0.491 |
| MMSE > 23 | 1435 | 75.72 | ± | 11.27 | |||
| Percentage body fat, % | MMSE ≦ 23 | 67 | 30.56 | ± | 11.02 | 1.064 | 0.144 |
| MMSE > 23 | 1414 | 29.38 | ± | 8.75 | |||
| Calf circumference, cm | MMSE ≦ 23 | 69 | 32.49 | ± | 3.56 | 4.424 | <0.001 |
| MMSE > 23 | 1434 | 34.42 | ± | 3.21 | |||
| Grip strength, kg | MMSE ≦ 23 | 68 | 20.62 | ± | 8.29 | 1.661 | 0.051 |
| MMSE > 23 | 1431 | 22.31 | ± | 6.15 | |||
| Usual walking speed, m/s | MMSE ≦ 23 | 68 | 1.10 | ± | 0.27 | 6.365 | <0.001 |
| MMSE > 23 | 1428 | 1.30 | ± | 0.25 | |||
| MMSE score | MMSE ≦ 23 | 69 | 20.67 | ± | 3.62 | 17.436 | <0.001 |
| MMSE > 23 | 1435 | 28.30 | ± | 1.67 | |||
| Number of teeth, N | MMSE ≦ 23 | 69 | 16.00 | ± | 9.58 | 3.342 | 0.001 |
| MMSE > 23 | 1434 | 19.93 | ± | 8.62 | |||
| Creatinine, mg/dL | MMSE ≦ 23 | 69 | 0.97 | ± | 0.87 | 2.010 | 0.024 |
| MMSE > 23 | 1433 | 0.76 | ± | 0.27 | |||
| Total cholesterol, mg/dL | MMSE ≦ 23 | 69 | 205.00 | ± | 36.04 | 2.116 | 0.017 |
| MMSE > 23 | 1433 | 214.07 | ± | 34.71 | |||
| HDL cholesterol, mg/dL | MMSE ≦ 23 | 69 | 62.87 | ± | 16.88 | 2.453 | 0.007 |
| MMSE > 23 | 1433 | 68.17 | ± | 17.57 | |||
| Triglyceride, mg/dL | MMSE ≦ 23 | 69 | 146.94 | ± | 99.56 | 0.122 | 0.451 |
| MMSE > 23 | 1433 | 145.66 | ± | 84.69 | |||
| Albumin, g/dL | MMSE ≦ 23 | 69 | 4.19 | ± | 0.31 | 3.171 | 0.001 |
| MMSE > 23 | 1433 | 4.29 | ± | 0.27 | |||
| HbA1c, % | MMSE ≦ 23 | 69 | 6.05 | ± | 0.73 | 1.083 | 0.140 |
| MMSE > 23 | 1432 | 5.97 | ± | 0.58 | |||
| Number of chronic diseases, N | MMSE ≦ 23 | 69 | 1.74 | ± | 1.50 | 0.939 | 0.176 |
| MMSE > 23 | 1430 | 1.91 | ± | 1.31 | |||
| Dietary variety score, point | MMSE ≦ 23 | 68 | 3.88 | ± | 2.15 | 2.474 | 0.013 |
| MMSE > 23 | 1428 | 4.52 | ± | 2.06 | |||
| Anemia: yes, % | MMSE ≦ 23 | 69 | 8.7 | 6.473 | 0.011 | ||
| MMSE > 23 | 1433 | 3.1 | |||||
| Urinary incontinence: yes, % | MMSE ≦ 23 | 69 | 29.0 | 2.727 | 0.099 | ||
| MMSE > 23 | 1435 | 37.1 | |||||
| Milk intake: yes, % | MMSE ≦ 23 | 69 | 65.2 | 3.922 | 0.048 | ||
| MMSE > 23 | 1435 | 75.7 | |||||
| Independent Variable | Model I | Model II | Model III | ||||||
|---|---|---|---|---|---|---|---|---|---|
| OR | 95% CI | p-Value | OR | 95% CI | p-Value | OR | 95% CI | p-Value | |
| Cheese intake, yes | 0.322 | 0.168–0.617 | 0.001 | 0.392 | 0.197–0.777 | 0.007 | 0.404 | 0.198–0.824 | 0.013 |
| Frequency of cheese intake, daily | 0.971 | 0.506–1.864 | 0.929 | 0.796 | 0.401–1.577 | 0.512 | 0.793 | 0.390–1.610 | 0.521 |
| Type of cheese, white mold cheese | 0.692 | 0.267–1.791 | 0.448 | 0.881 | 0.333–2.329 | 0.798 | 0.906 | 0.339–2.421 | 0.843 |
| Age, 1 unit | 1.170 | 1.089–1.256 | <0.001 | 1.150 | 1.066–1.239 | 0.000 | |||
| Usual walking speed, 1 unit | 0.171 | 0.062–0.472 | <0.001 | 0.218 | 0.075–0.638 | 0.005 | |||
| Grip strength, 1 unit | 1.023 | 0.982–1.066 | 0.281 | 1.010 | 0.965–1.057 | 0.672 | |||
| Calf circumference, 1 unit | 0.823 | 0.747–0.908 | <0.001 | 0.843 | 0.761–0.934 | 0.001 | |||
| Anemia, yes | 1.674 | 0.534–5.253 | 0.377 | ||||||
| DBP, 1 unit ** | 1.015 | 0.992–1.038 | 0.214 | ||||||
| Number of teeth, 1 unit | 0.988 | 0.960–1.016 | 0.388 | ||||||
| Creatinine, 1 unit | 1.506 | 0.828–2.739 | 0.180 | ||||||
| Albumin, 1 unit | 0.569 | 0.203–1.595 | 0.284 | ||||||
| Total cholesterol, 1 unit | 1.000 | 0.992–1.008 | 0.999 | ||||||
| Urinary incontinence, yes | 1.726 | 0.954–3.125 | 0.071 | ||||||
| Milk, intake | 1.038 | 0.580–1.855 | 0.901 | ||||||
| Dietary variety score, 1 unit | 0.912 | 0.800–1.039 | 0.166 |
Disclaimer/Publisher’s Note: The statements, opinions and data contained in all publications are solely those of the individual author(s) and contributor(s) and not of MDPI and/or the editor(s). MDPI and/or the editor(s) disclaim responsibility for any injury to people or property resulting from any ideas, methods, instructions or products referred to in the content. |
© 2023 by the authors. Licensee MDPI, Basel, Switzerland. This article is an open access article distributed under the terms and conditions of the Creative Commons Attribution (CC BY) license (https://creativecommons.org/licenses/by/4.0/).
Share and Cite
Kim, H.; Osuka, Y.; Kojima, N.; Sasai, H.; Nakamura, K.; Oba, C.; Sasaki, M.; Suzuki, T. Inverse Association between Cheese Consumption and Lower Cognitive Function in Japanese Community-Dwelling Older Adults Based on a Cross-Sectional Study. Nutrients 2023, 15, 3181. https://doi.org/10.3390/nu15143181
Kim H, Osuka Y, Kojima N, Sasai H, Nakamura K, Oba C, Sasaki M, Suzuki T. Inverse Association between Cheese Consumption and Lower Cognitive Function in Japanese Community-Dwelling Older Adults Based on a Cross-Sectional Study. Nutrients. 2023; 15(14):3181. https://doi.org/10.3390/nu15143181
Chicago/Turabian StyleKim, Hunkyung, Yosuke Osuka, Narumi Kojima, Hiroyuki Sasai, Kentaro Nakamura, Chisato Oba, Mayuki Sasaki, and Takao Suzuki. 2023. "Inverse Association between Cheese Consumption and Lower Cognitive Function in Japanese Community-Dwelling Older Adults Based on a Cross-Sectional Study" Nutrients 15, no. 14: 3181. https://doi.org/10.3390/nu15143181
APA StyleKim, H., Osuka, Y., Kojima, N., Sasai, H., Nakamura, K., Oba, C., Sasaki, M., & Suzuki, T. (2023). Inverse Association between Cheese Consumption and Lower Cognitive Function in Japanese Community-Dwelling Older Adults Based on a Cross-Sectional Study. Nutrients, 15(14), 3181. https://doi.org/10.3390/nu15143181