
Analysis of Metabolites in Gout: A Systematic Review and Meta-Analysis
 ,
,
Abstract
1. Introduction
2. Materials and Methods
2.1. Selection Criteria
2.2. Search Strategy
2.3. Study Selection
2.4. Risk of Bias Assessment
2.5. Data Collection
2.6. Data Synthesis
3. Results
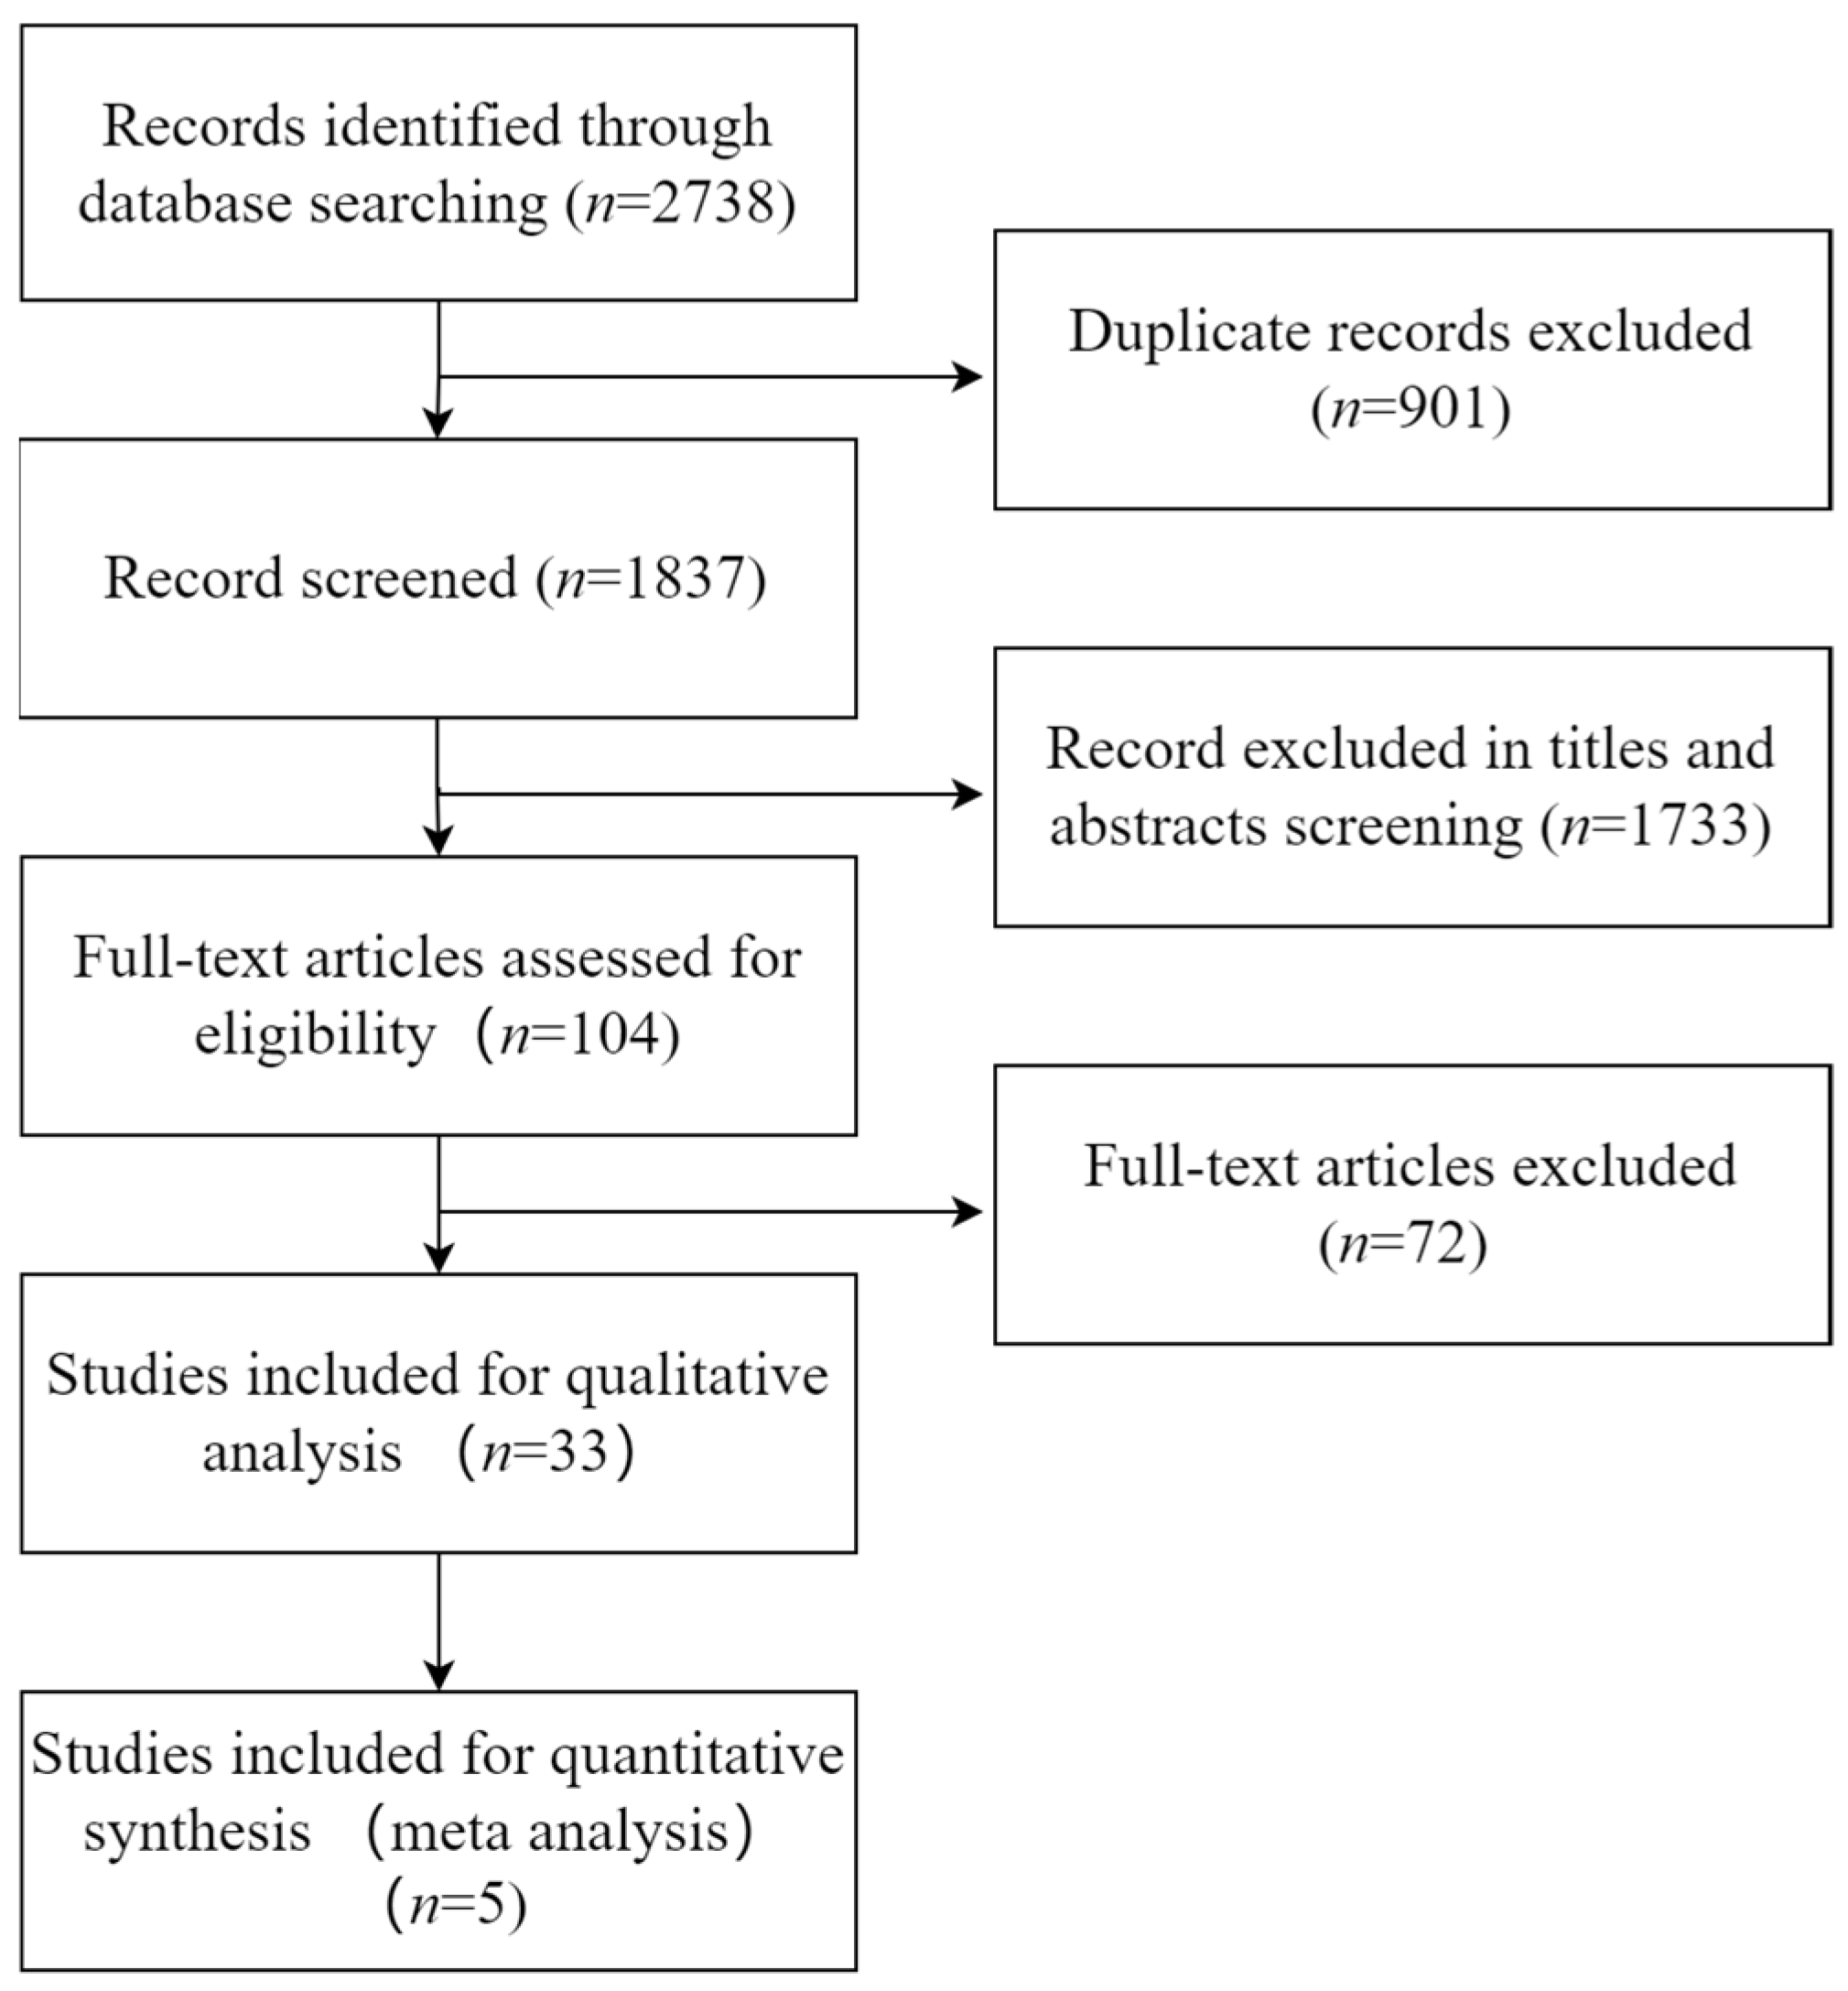
3.1. Literature Search
3.2. Characteristics of Included Studies
3.3. Risk of Bias of Included Studies
3.4. Qualitative Synthesis
3.5. Meta-Analysis
4. Discussion
5. Limitations of the Study
6. Conclusions
Supplementary Materials
Author Contributions
Funding
Institutional Review Board Statement
Informed Consent Statement
Data Availability Statement
Conflicts of Interest
References
- Dalbeth, N.; Merriman, T.R.; Stamp, L.K. Gout. Lancet 2016, 388, 2039–2052. [Google Scholar]
- Bardin, T.; Richette, P. Definition of hyperuricemia and gouty conditions. Curr. Opin. Rheumatol. 2014, 26, 186–191. [Google Scholar] [CrossRef] [PubMed]
- Thottam, G.E.; Krasnokutsky, S.; Pillinger, M.H. Gout and Metabolic Syndrome: A Tangled Web. Curr. Rheumatol. Rep. 2017, 19, 60. [Google Scholar]
- Wiseman, S.J.; Ralston, S.H.; Wardlaw, J.M. Cerebrovascular Disease in Rheumatic Diseases: A Systematic Review and Meta-Analysis. Stroke 2016, 47, 943–950. [Google Scholar] [CrossRef]
- Cox, P.; Gupta, S.; Zhao, S.S.; Hughes, D.M. The incidence and prevalence of cardiovascular diseases in gout: A systematic review and meta-analysis. Rheumatol. Int. 2021, 41, 1209–1219. [Google Scholar] [CrossRef] [PubMed]
- Mhanna, M.; Jabri, A.; Omar, Y.A.; AI-Abdouh, A.; Beran, A.; Ramahi, A.; Alrifai, N.; Almahameed, S.; Altorok, N. The Burden of Cardiac Arrhythmias in Gout: A National Representative Database Study. Curr. Probl. Cardiol. 2023, 48, 101437. [Google Scholar] [CrossRef] [PubMed]
- Fan, S.; Zhang, P.; Wang, A.Y.; Wang, X.; Wang, L.; Li, G.; Hong, D.Q. Hyperuricemia and its related histopathological features on renal biopsy. BMC Nephrol. 2019, 20, 95. [Google Scholar] [CrossRef]
- Dehlin, M.; Jacobsson, L.; Roddy, E. Global epidemiology of gout: Prevalence, incidence, treatment patterns and risk factors. Nat. Rev. Rheumatol. 2020, 16, 380–390. [Google Scholar] [CrossRef]
- Xia, Y.; Wu, Q.; Wang, H.; Zhang, S.; Jiang, Y.T.; Gong, T.T.; Xu, X.; Chang, Q.; Niu, K.J.; Zhao, Y.H. Global, regional and national burden of gout, 1990–2017: A systematic analysis of the Global Burden of Disease Study. Rheumatology 2020, 59, 1529–1538. [Google Scholar] [CrossRef]
- Danve, A.; Neogi, T. Rising Global Burden of Gout: Time to Act. Arthritis Rheumatol. 2020, 72, 1786–1788. [Google Scholar] [CrossRef]
- Kuo, C.F.; Grainge, M.J.; Mallen, C.; Zhang, W.Y.; Doherty, M. Rising burden of gout in the UK but continuing suboptimal management: A nationwide population study. Ann. Rheum. Dis. 2015, 74, 661–667. [Google Scholar] [CrossRef] [PubMed]
- Smith, E.; Hoy, D.; Cross, M.; Merriman, T.R.; Vos, T.; Buchbinder, R.; Woolf, A.; March, L. The global burden of gout: Estimates from the Global Burden of Disease 2010 study. Ann. Rheum. Dis. 2014, 73, 1470–1476. [Google Scholar] [PubMed]
- Rai, S.K.; Burns, L.C.; De Vera, M.A.; Haji, A.; Giustini, D.; Choi, H.K. The economic burden of gout: A systematic review. Semin. Arthritis Rheum. 2015, 45, 75–80. [Google Scholar] [CrossRef]
- Richette, P.; Doherty, M.; Pascual, E.; Barskova, V.; Becce, F.; Castaneda, J.; Coyfish, M.; Guillo, S.; Jansen, T.; Janssens, H.; et al. 2018 updated European League Agoutinst Rheumatism evidence-based recommendations for the diagnosis of gout. Ann. Rheum. Dis. 2020, 79, 31–38. [Google Scholar] [CrossRef]
- Neilson, J.; Bonnon, A.; Dickson, A.; Roddy, E. Gout: Diagnosis and management-summary of NICE guidance. BMJ 2022, 378, o1754. [Google Scholar] [CrossRef]
- Zhang, W.Z. Why Does Hyperuricemia Not Necessarily Induce Gout? Biomolecules 2021, 11, 280. [Google Scholar]
- Lin, K.C.; Lin, H.Y.; Chou, P. The interaction between uric acid level and other risk factors on the development of gout among asymptomatic hyperuricemic men in a prospective study. J. Rheumatol. 2000, 27, 1501–1505. [Google Scholar]
- Schlesinger, N.; Norquist, J.M.; Watson, D.J. Serum urate during acute gout. J. Rheumatol. 2009, 36, 1287–1289. [Google Scholar] [CrossRef]
- Theken, K.N. Variability in analgesic response to non-steroidal anti-inflammatory drugs. Prostaglandins Other Lipid Mediat. 2018, 139, 63–70. [Google Scholar] [PubMed]
- Whelton, A.; Hamilton, C.W. Nonsteroidal anti-inflammatory drugs: Effects on kidney function. J. Clin. Pharmacol. 1991, 31, 588–598. [Google Scholar] [CrossRef]
- Whitehouse, M.W. Anti-inflammatory glucocorticoid drugs: Reflections after 60 years. Inflammopharmacology 2011, 19, 1–19. [Google Scholar] [PubMed]
- Marinaki, S.; Skalioti, C.; Boletis, J.N. Colchicine in Renal Diseases: Present and Future. Curr. Pharm. Des. 2018, 24, 675–683. [Google Scholar] [CrossRef] [PubMed]
- Pascart, T.; Richette, P. Colchicine in Gout: An Update. Curr. Pharm. Des. 2018, 24, 684–689. [Google Scholar] [CrossRef] [PubMed]
- Scheepers, L.; Van Onna, M.; Stehouwer, C.D.A.; Singh, J.A.; Arts, L.C.W.; Boonen, A. Medication adherence among patients with gout: A systematic review and meta-analysis. Semin. Arthritis Rheum. 2018, 47, 689–702. [Google Scholar] [CrossRef]
- Pillinger, M.H.; Mandell, B.F. Therapeutic approaches in the treatment of gout. Semin. Arthritis Rheum. 2020, 50, S24–S30. [Google Scholar]
- Singh, J.A.; Reddy, S.G.; Kundukulam, J. Risk factors for gout and prevention: A systematic review of the literature. Curr. Opin. Rheumatol. 2011, 23, 192–202. [Google Scholar] [CrossRef]
- Wilson, L.; Saseen, J.J. Gouty Arthritis: A Review of Acute Management and Prevention. Pharmacotherapy 2016, 36, 906–922. [Google Scholar] [CrossRef]
- Liu, Y.; Yu, P.; Sun, X.; Di, D.L. Metabolite target analysis of human urine combined with pattern recognition techniques for the study of symptomatic gout. Mol. Biosyst. 2012, 8, 2956–2963. [Google Scholar] [CrossRef]
- Muthubharathi, B.C.; Gowripriya, T.; Balamurugoutn, K. Metabolomics: Small molecules that matter more. Mol. Omics 2021, 17, 210–229. [Google Scholar]
- Bujak, R.; Struck-Lewicka, W.; Markuszewski, M.J.; Kaliszan, R. Metabolomics for laboratory diagnostics. J. Pharm. Biomed. Anal. 2015, 113, 108–120. [Google Scholar] [CrossRef]
- Guijas, C.; Montenegro-Burke, J.R.; Warth, B.; Spilker, M.E.; Siuzdak, G. Metabolomics activity screening for identifying metabolites that modulate phenotype. Nat. Biotechnol. 2018, 36, 316–320. [Google Scholar] [CrossRef]
- Jin, Q.; Ma, R.C.W. Metabolomics in Diabetes and Diabetic Complications: Insights from Epidemiological Studies. Cells 2021, 10, 2832. [Google Scholar] [CrossRef] [PubMed]
- Huang, Y.; Xiao, M.; Ou, J.; Lv, Q.; Wei, Q.J.; Chen, Z.N.; Wu, J.L.; Tu, L.D.; Jiang, Y.T.; Zhang, X.; et al. Identification of the urine and serum metabolomics signature of gout. Rheumatology 2020, 59, 2960–2969. [Google Scholar] [CrossRef] [PubMed]
- Shen, X.; Wang, C.; Liang, N.; Liu, Z.; Li, X.D.; Zhu, Z.J.; Merriman, T.R.; Dalbeth, N.; Terkeltaub, R.; Li, C.J.; et al. Serum Metabolomics Identifies Dysregulated Pathways and Potential Metabolic Biomarkers for Hyperuricemia and Gout. Arthritis Rheumatol. 2021, 73, 1738–1748. [Google Scholar] [CrossRef]
- Zhong, Z. Preliminary Study on Serum Metabolic Prifiling of Gout Patients Based on UPLC-Q-TOF/MS. Master’s Thesis, Southern Medical University, Guangzhou, China, 2020. [Google Scholar]
- Liu, Y. Metabolomics Method Based on High Performance Liquid Chromatography Was Used to Study Biomarkers of Gout. Ph.D. Thesis, University of Chinese Academy of Sciences, Beijing, China, 2013. [Google Scholar]
- Zhao, J.-Y. Biomakers Study of Errors of Metabolism by Coupling Chromatography with MS. Master’s Thesis, Tsinghua University, Beijing, China, 2005. [Google Scholar]
- Wang, Y.; Deng, M.; Deng, B.; Ye, L.M.; Fei, X.M.; Huang, Z.G. Study on the diagnosis of gout with xanthine and hypoxanthine. J. Clin. Lab. Anal. 2019, 33, e22868. [Google Scholar] [CrossRef] [PubMed]
- Tarng, D.C.; Lin, H.Y.; Shyong, M.L.; Wang, J.S.; Yang, W.C.; Huang, T.P. Renal Function in Gout Patients. Am. J. Nephrol. 1995, 15, 31–37. [Google Scholar] [CrossRef]
- Yuan, Y.; Jiang, M.; Zhang, H.; Liu, J.; Zhang, M.; Hu, P. Simultaneous quantification of urinary purines and creatinine by ultrahigh performance liquid chromatography with ultraviolet spectroscopy and quadrupole time-of-flight mass spectrometry: Method development, validation, and application to gout study. J. Sep. Sci. 2019, 42, 2523–2533. [Google Scholar] [CrossRef] [PubMed]
- Feng, J.D.; Yeung, P.K. A simple high-performance liquid chromatography assay for simultaneous measurement of adenosine, guanosine, and the oxypurine metabolites in plasma. Ther. Drug Monit. 2000, 22, 177–183. [Google Scholar] [CrossRef]
- Page, M.J.; Mckenzie, J.E.; Bossuyt, P.M.; Boutron, I.; Hoffmann, T.C.; Mulrow, C.D.; Shamseer, L.; Tetzlaff, J.M.; Akl, E.A.; Brennan, S.E.; et al. The PRISMA 2020 statement: An updated guideline for reporting systematic reviews. BMJ 2021, 372, n71. [Google Scholar] [CrossRef]
- Stang, A. Critical evaluation of the Newcastle-Ottawa scale for the assessment of the quality of nonrandomized studies in meta-analyses. Eur. J. Epidemiol. 2010, 25, 603–605. [Google Scholar] [CrossRef]
- Kang, L.; Liu, J.; Zhang, H.; Jiang, M.; Jin, Y.D.; Zhang, M.; Hu, P. Improved ultra-high performance liquid chromatographic method for simultaneous determination of five gout-related metabolites in human serum. J. Sep. Sci. 2021, 44, 954–962. [Google Scholar] [CrossRef] [PubMed]
- Lv, S. Study on the Mechanism of Pulchinenoside b4 Anty-Gouty Arthritis (GOUT) Based on Metabolomics. Ph.D. Thesis, Jiangxi University of Chinese Medicine, Nanchang, China, 2020. [Google Scholar]
- Lyu, S.; Rao, Y.; Liu, P.; Yang, S.L.; Chen, W.Y.; Yang, H.J.; Ke, S.K.; Yang, H.O.; He, M.Z.; Feng, Y.L. Metabolomics analysis reveals four biomarkers associated with the gouty arthritis progression in patients with sequential stages. Semin. Arthritis Rheum. 2022, 55, 152022. [Google Scholar] [CrossRef] [PubMed]
- Huang, Q.-L. Pricking Blood Therapy of Zhuang Medicine Combined with Medicated Thread Moxibustion in the Treatment of Acute Gouty Arthritis and Metabonomics Study. Master’s Thesis, Guangxi University of Chinese Medicine, Nanning, China, 2014. [Google Scholar]
- Chen, J.; Zhou, J.; Wei, S.-S.; Li, H.-C.; Wen, C.-P.; Xu, G.-W. Analysis of Serum Metabolic Characteristics in Patients with Gout Using Gouts Chromatography—Mass Spectrometry. J. Instrum. Anal. 2016, 35, 137–142. [Google Scholar]
- Sterne, J.A.; Sutton, A.J.; Ioannidis, J.P.; Terrin, N.; Jones, D.R.; Lau, J.; Carpenter, J.; Rücker, G.; Harbord, R.M.; Schmid, C.H.; et al. Recommendations for examining and interpreting funnel plot asymmetry in meta-analyses of randomised controlled trials. BMJ 2011, 343, d4002. [Google Scholar] [CrossRef] [PubMed]
- Egger, M.; Davey Smith, G.; Schneider, M.; Minder, C. Bias in meta-analysis detected by a simple, graphical test. BMJ 1997, 315, 629–634. [Google Scholar] [CrossRef]
- Qiu, F.-H.; Zhang, H.-Z. Effect of pricking blood therapy on acute gouty arthritis and its effect on serum metabolites. China Medical. Herald. 2018, 15, 135–139+81. [Google Scholar]
- Yin, T.-T.; Zhao, C.-J.; Zhang, Y.-Z. Study on substance of damp-heat syndrome of rheumatic disease based on lipidomics. China J. Tradit. Chin. Med. 2013, 28, 210–213. [Google Scholar]
- Yin, T.-T.; Zhao, T. Study of gouty arthritis on lipidomics of the human serum. J. Shenyang Pharm. Univ. 2021, 38, 815–820. [Google Scholar]
- Yu, X.-F.; Chen, K.-Y.; Tong, Y. Lipid metabolism study of hyperuricemia and gout arthritis based on lipidomics technology. World Latest Med. Inf. 2016, 16, 30–31. [Google Scholar]
- Li, Y.-T.; Sang, C.; Liang, D.-D.; Chen, T.-L. A metabolic profiling study on typical arthritis based on Bayesian network. Transl. Med. J. 2019, 8, 232–236. [Google Scholar]
- Zhao, T.; Yin, T.-T.; Zhang, Y.-Z.; Lu, J.; Li, P.; Wang, G.-C.; Zu, N.; Yan, X.-P.; Zhang, X.-L. Study on Common Features of Damp-Heat Syndrome in Rheumatism Based on Metabolomics. J. Tradit. Chin. Med. 2013, 54, 592–596. [Google Scholar]
- Sun, F.-S. Clinical Obserwation of Zhibai Bixie Dihuang Decoction in the Treatment of Acute Gouty Arthritis and Metabonomics Study. Master’s Thesis, Nanjing University of Chinese Medicine, Nanjing, China, 2019. [Google Scholar]
- Wang, M.-J. Biology Characteristics of Spleen-Deficiency Syndrome Gout Based on Faces Metabonomics and Genomics. Master’s Thesis, Zhejiang Chinese Medicine University, Hangzhou, China, 2013. [Google Scholar]
- Zhang, M.-M. Serum Metabonomic of Patients with Gout and Hyperuricemia Based on UPLC-MC. Master’s Thesis, Southwest Jiaotong University, Chengdu, China, 2021. [Google Scholar]
- Chen, Y.; Ma, H.; Du, Y.; Dong, J.; Jin, C.; Tan, L.; Wei, R. Functions of 1,25-dihydroxy vitamin D3, vitamin D3 receptor and interleukin-22 involved in pathogenesis of gout arthritis through altering metabolic pattern and inflammatory responses. PeerJ 2021, 9, e12585. [Google Scholar] [CrossRef] [PubMed]
- Cui, L.; Liu, J.; Yan, X.; Hu, S. Identification of Metabolite Biomarkers for Gout Using Capillary Ion Chromatography with Mass Spectrometry. Anal. Chem. 2017, 89, 11737–11743. [Google Scholar] [CrossRef] [PubMed]
- Istok, R.; Kovalancík, M.; Rovenský, J. Total plasma homocysteine in patients with gout. J. Rheumatol. 1999, 26, 2068–2069. [Google Scholar] [PubMed]
- Jiang, M.; Chen, T.; Feng, H.; Zhang, Y.; Li, L.; Zhao, A.; Niu, X.; Liang, F.; Wang, M.; Zhan, J.; et al. Serum metabolic signatures of four types of human arthritis. J. Proteome Res. 2013, 12, 3769–3779. [Google Scholar] [CrossRef]
- Li, Q.; Wei, S.; Wu, D.; Wen, C.; Zhou, J. Urinary Metabolomics Study of Patients with Gout Using Gouts Chromatography-Mass Spectrometry. Biomed. Res. Int. 2018, 2018, 3461572. [Google Scholar] [CrossRef]
- Liu, S.; Wang, Y.; Liu, H.; Xu, T.; Wang, M.; Lu, J.; Guo, Y.; Chen, W.; Ke, M.; Zhou, G.; et al. Serum lipidomics reveals distinct metabolic profiles for asymptomatic hyperuricemic and gout patients. Rheumatology 2022, 61, 2644–2651. [Google Scholar] [CrossRef]
- Liu, Y.; Sun, X.; Di, D.; Quan, J.; Zhang, J.; Yang, X. A metabolic profiling analysis of symptomatic gout in human serum and urine using high performance liquid chromatography-diode array detector technique. Clin. Chim. Acta 2011, 412, 2132–2140. [Google Scholar] [CrossRef]
- Luo, Y.; Wang, L.; Peng, A.; Liu, J. Metabolic profiling of human plasma reveals the activation of 5-lipoxygenase in the acute attack of gouty arthritis. Rheumatology 2019, 58, 345–351. [Google Scholar] [CrossRef]
- Shao, T.; Shao, L.; Li, H.; Xie, Z.; He, Z.; Wen, C. Combined Signature of the Fecal Microbiome and Metabolome in Patients with Gout. Front. Microbiol. 2017, 8, 268. [Google Scholar] [CrossRef]
- Stamp, L.K.; Turner, R.; Khalilova, I.S.; Zhang, M.; Drake, J.; Forbes, L.; Kettle, A. Myeloperoxidase and oxidation of uric acid in gout: Implications for the clinical consequences of hyperuricaemia. Rheumatology 2014, 53, 1958–1965. [Google Scholar] [CrossRef] [PubMed]
- Zhang, Y.; Zhang, H.; Chang, D.; Guo, F.; Pan, H.; Yang, Y. Metabolomics approach by (1) H NMR spectroscopy of serum reveals progression axes for asymptomatic hyperuricemia and gout. Arthritis Res. Ther. 2018, 20, 111. [Google Scholar] [CrossRef]
- Zhang, Y.Z.; Sui, X.L.; Xu, Y.P.; Gu, F.J.; Zhang, A.S.; Chen, J.H. NLRP3 inflammasome and lipid metabolism analysis based on UPLC-Q-TOF-MS in gouty nephropathy. Int. J. Mol. Med. 2019, 44, 172–184. [Google Scholar] [CrossRef] [PubMed]
- Zhao, J.; Liang, Q.; Luo, G.; Wang, Y.; Zuo, Y.; Jiang, M.; Yu, G.; Zhang, T. Purine metabolites in gout and asymptomatic hyperuricemia: Analysis by HPLC-electrospray tandem mass spectrometry. Clin. Chem. 2005, 51, 1742–1744. [Google Scholar] [CrossRef] [PubMed]
- Dalbeth, N.; Choi, H.K.; Joosten LA, B.; Khanna, P.P.; Matsuo, H.; Perez-Ruiz, F.; Stamp, L.K. Gout. Nat. Rev. Dis. Primers 2019, 5, 69. [Google Scholar] [CrossRef] [PubMed]
- Rees, F.; Hui, M.; Doherty, M. Optimizing current treatment of gout. Nat. Rev. Rheumatol. 2014, 10, 271–283. [Google Scholar]
- So, A.; Thorens, B. Uric acid transport and disease. J. Clin. Investig. 2010, 120, 1791–1799. [Google Scholar] [CrossRef]
- Goldfarb, D.S.; Macdonald, P.A.; Hunt, B.; Gunawardhana, L. Febuxostat in gout: Serum urate response in uric acid overproducers and underexcretors. J. Rheumatol. 2011, 38, 1385–1389. [Google Scholar] [CrossRef]
- Jung, S.W.; Kim, S.M.; Kim, Y.G.; Lee, S.H.; Moon, J.Y. Uric acid and inflammation in kidney disease. Am. J. Physiol. Renal. Physiol. 2020, 318, F1327–F1340. [Google Scholar] [CrossRef]
- Kang, D.H.; Nakagoutwa, T.; Feng, L.; Watanabe, S.; Han, L.; Mazzali, M.; Truong, L.; Harris, R.; Johnson, R.J. A role for uric acid in the progression of renal disease. J. Am. Soc. Nephrol. 2002, 13, 2888–2897. [Google Scholar] [CrossRef]
- Kamijo-Ikemori, A.; Sugoutya, T.; Hibi, C.; Nakamura, T.; Murase, T.; Oikawa, T.; Hoshino, S.; Hisamichi, M.; Hirata, K.; Kimura, K.; et al. Renoprotective effect of the xanthine oxidoreductase inhibitor topiroxostat on adenine-induced renal injury. Am. J. Physiol. Renal. Physiol. 2016, 310, F1366–F1376. [Google Scholar] [CrossRef] [PubMed]
- Cai, W.; Duan, X.M.; Liu, Y.; Yu, J.; Tang, Y.L.; Liu, Z.L.; Jiang, S.; Zhang, C.P.; Liu, J.Y.; Xu, J.X. Uric Acid Induces Endothelial Dysfunction by Activating the HMGB1/RAGE Signaling Pathway. Biomed. Res. Int. 2017, 2017, 4391920. [Google Scholar] [CrossRef] [PubMed]
- Kim, S.M.; Lee, S.H.; Kim, Y.G.; Kim, S.Y.; Seo, J.W.; Choi, Y.W.; Kim, D.J.; Jeong, K.H.; Lee, T.W.; Ihm, C.G.; et al. Hyperuricemia-induced NLRP3 activation of macrophages contributes to the progression of diabetic nephropathy. Am. J. Physiol. Renal. Physiol. 2015, 308, F993–F1003. [Google Scholar] [CrossRef] [PubMed]
- Xiao, J.; Fu, C.; Zhang, X.; Zhu, D.Y.; Chen, W.J.; Lu, Y.J.; Ye, Z.B. Soluble monosodium urate, but not its crystal, induces toll like receptor 4-dependent immune activation in renal mesangial cells. Mol. Immunol. 2015, 66, 310–318. [Google Scholar] [CrossRef]
- Martinon, F.; Petrilli, V.; Mayor, A.; Tardivel, A.; Tschopp, J. Gout-associated uric acid crystals activate the NALP3 inflammasome. Nature 2006, 440, 237–241. [Google Scholar] [CrossRef]
- Fathallah-Shaykh, S.A.; Cramer, M.T. Uric acid and the kidney. Pediatr. Nephrol. 2014, 29, 999–1008. [Google Scholar] [CrossRef]
- Ramos, G.K.; Goldfarb, D.S. Update on Uric Acid and the Kidney. Curr. Rheumatol. Rep. 2022, 24, 132–138. [Google Scholar] [CrossRef]
- Zhuang, J.; Zhou, X.; Liu, T.; Zhang, S.; Yuan, F.; Zhang, L.F.; Yang, Z.S.; Chen, Y. Astaxanthin attenuated hyperuricemia and kidney inflammation by inhibiting uric acid synthesis and the NF-kappa B/NLRP3 signaling pathways in potassium oxonate and hypoxanthine-induced hyperuricemia mice. Pharmazie 2021, 76, 551–558. [Google Scholar]
- Devito, S.; Woodrick, J.; Song, L.; Roy, R. Mutagenic potential of hypoxanthine in live human cells. Mutat. Res. 2017, 803–805, 9–16. [Google Scholar] [CrossRef]
- Li, X.; Gouto, J.; Tao, J. Purinergic Signaling in the Regulation of Gout Flare and Resolution. Front. Immunol. 2021, 12, 785425. [Google Scholar] [CrossRef]
- Linden, J.; Cekic, C. Regulation of lymphocyte function by adenosine. Arterioscler Thromb. Vasc. Biol. 2012, 32, 2097–2103. [Google Scholar] [CrossRef]
- Wirthgen, E.; Hoeflich, A.; Rebl, A.; Günther, J. Kynurenic Acid: The Janus-Faced Role of an Immunomodulatory Tryptophan Metabolite and Its Link to Pathological Conditions. Front. Immunol. 2017, 8, 1957. [Google Scholar] [CrossRef] [PubMed]
- Kiank, C.; Zeden, J.P.; Drude, S.; Domanska, G.; Fusch, G.; Otten, W.; Schuett, C. Psychological stress-induced, IDO1-dependent tryptophan catabolism: Implications on immunosuppression in mice and humans. PLoS ONE 2010, 5, e11825. [Google Scholar] [CrossRef] [PubMed]
- Oh, Y.J.; Moon, K.W. Presence of tophi is associated with a rapid decline in the renal function in patients with gout. Sci. Rep. 2021, 11, 5684. [Google Scholar] [CrossRef] [PubMed]
- Narang, R.K.; Dalbeth, N. Pathophysiology of Gout. Semin. Nephrol. 2020, 40, 550–563. [Google Scholar] [CrossRef] [PubMed]
- Rae, S.A.; Davidson, E.M.; Smith, M.J. Leukotriene B4, an inflammatory mediator in gout. Lancet 1982, 2, 1122–1124. [Google Scholar] [CrossRef]
- Crookss, S.W.; Stockley, R.A. Molecules in focus. Leukotriene B4. Int. J. Biochem. Cell Biol. 1998, 30, 173–178. [Google Scholar] [CrossRef]
- Hotamisligil, G.S. Inflammation, metaflammation and immunometabolic disorders. Nature 2017, 542, 177–185. [Google Scholar] [CrossRef]


| Author (Year) | Country | Sample (Gout/Health) | Age (Gout/Health) | Metabolomics Technique | NOS |
|---|---|---|---|---|---|
| Fanghui Qiu et al. (2018) [51] | China | 10/10 | 46.70 ± 8.69/NG | LC-MS | 6 |
| Tingting Yin et al. (2013) [52] | China | 29/22 | 45.6 ± 13.0/45.7 ± 12.2 | LC-GC | 7 |
| Zheng Zhong et al. (2020) [35] | China | 31/31 | 34.72 ± 10.62/34.83 ± 8.16 | UPLC-Q-TOF/MS | 7 |
| Yitao Li et al. (2019) [55] | China | 34/60 | 51 ± 12/26 ± 12 | LC-GC | 5 |
| Shang Lv et al. (2020) [45] | China | 69/80 | 49.23 ± 17.90/NG | UPLC-Hqtof-MS | 8 |
| Tie Zhao et al. (2013) [56] | China | 29/22 | 45.6 ± 13.0/45.7 ± 12.2 | UPLC-Q-TOF/MS | 5 |
| Meijiao Wang et al. (2013) [58] | China | 53/40 | 33.1 ± 8.6/30.6 ± 6.6 | NMR | 7 |
| Yun Liu et al. (2013) [36] | China | 21/20 | 48.3 ± 16.7/44.8 ± 13.12 | HPLC | 7 |
| Jiao Chen et al. (2016) [48] | China | 29/26 | 50.3 ± 11.4/NG | GC-MS | 6 |
| Mingmei Zhang et al. (2021) [59] | China | 50/50 | 38.61 ± 12.6/NG | UPLC-MS | 7 |
| Xuefeng Yu et al. (2016) [54] | China | 20/15 | NG | UPLC | 6 |
| Jiyuan Zhao et al. (2005) [37] | China | 49/35 | NG | HPLC-MS-MS | 4 |
| Tingting Yin et al. (2021) [53] | China | 29/22 | 45.6/18–70 | UPLC/MS/MS | 6 |
| Fanshu Sun et al. (2019) [7] | China | 57/92 | 48.26 ± 14.21/46.85 ± 12.50 | UPLC-MS | 7 |
| Qilin Huang et al. (2014) [47] | China | 60/30 | 44. 8 ± 8.2/NG | GC-MS | 7 |
| Tiejuan Shao et al. (2017) [68] | China | 26/26 | 43.60 ± 1.98/39.42 ± 2.33 | 1H NMR | 7 |
| Yuqi Chen et al. (2021) [60] | China | 58/20 | 43 ± 15.68/43.0 ± 8.6 | GC-TOF-MS | 7 |
| Li Cui et al. (2017) [61] | China | 8/15 | NG | MS/MS/MS | 7 |
| Yefei Huang et al. (2020) [33] | China | 30/30 | 44.27 ± 12.69/39.93 ± 9.57 | UPLC-MS | 7 |
| Kang Lu et al. (2021) [44] | China | 50/15 | NG | UPLC | 3 |
| Yun Liu et al. (2011) [66] | China | 21/20 | 48.3 ± 16.70/47.4 ± 14.24 | HPLC-DAD | 6 |
| Ying Luo et al. (2019) [67] | China | 26/26 | 48.9 (12.8)/51.3 (9.3) | LC-MS/MS | 7 |
| Yun Liu et al. (2012) [28] | China | 45/41 | 43 (20–74) | HPLC-DAD | 7 |
| Shang Lyu et al. (2022) [46] | China | 295/80 | 46.5 ± 15.8/52.1 ± 9.3 | UHPLC-QTOF-MS-MS | 8 |
| Yannan Zhang et al. (2018) [70] | China | 49/50 | 45.6 ± 7.3/43.8 ± 11.5 | H NMR | 7 |
| Lisa K. Stamp et al. (2014) [69] | New Zealand | 31/27 | 60.6 (40~91)/58.1 (39~79) | HPLC | 7 |
| Zizhang Yan et al. (2019) [71] | China | 30/30 | 49.56 ± 11.78/44.32 ± 11.51 | UPLC-Q-TOF-MS | 4 |
| Jiyuan Zhao et al. (2005) [72] | China | 12/35 | NG | HPLC-UV-MS/MS | 8 |
| Shijia Liu et al. (2022) [65] | China | 183/88 | 51.3 ± 13.8/46.3 ± 15.8 | UHPLC-Q | 8 |
| Jiang Miao et al. (2013) [63] | China | 33/60 | 51 (30–69)/34 (25–74) | (GC−TOF MS) and (UPLC−QTOF MS) | 8 |
| Shen Xia et al. (2021) [34] | China | 109/119 | 43.94 ± 11.88/46.77 ± 10.14 | LC-MS | 8 |
| Richard et al. (1999) [62] | Slovak | 28/18 | 50.2 ± 10.3 | HPLC | 4 |
| Qianqian Li et al. (2018) [64] | China | 35/29 | 45.3 ± 1.8/43.1 ± 1.6 | GC-MS | 8 |
| Concentration Trend | Small Molecule Metabolite Name | ||
|---|---|---|---|
| Blood Samples | Urine Samples | Fecal Samples | |
| Upward | Uric acid, Phenylalanine, Hypoxanthine, Xanthine, Creatinine, Kynurenic acid, Mannose, Mannitol, Leukotriene B4, Leucine, Guanosine, Gluconic acid, Creatine, 13(S)-HODE, 2-deoxyadenosine, 2PY, 5-oxo-ETE, 9(S)-HODE, Acetylornithine, Alanine, Arabitol, Aspartate, Aspartic acid, Blood urea nitrogen, Cis-5,8,11,14,17-eicosapentaenoic acid, Cysteine, D-Gluconic acid, Dihydroxyfumaric acid, Glyceraldehyde, Homoserine, Indoleacetic acid, Isoleucine, Lactic acid, L-Ornithine, Low density lipoprotein, LPC14:0, LPC20:3, LPE18:0, LysoPC(16:0), Malic acid, PE16:0-18:2, PE18:0-18:1, Succinic acid, Thromboxin B2, Valine | Taurine | |
| Downward | Arachidonic acid, LysoPC(18:2(9Z,12Z)), Lauric acid, Threonate, Stearic acid, High-density lipoprotein, 11-HETE, 8-HETE, 20-carboxy-ARA, 14(15)EET, 11(12)EET, 8(9)EET, 5(6)EET, 19(20)EDP, 19,20-DHDPA, 17,18-DHETE, 11,12-DHET, TAG18:0-18:1-22:1, TAG18:1-20:0-22:1, 12-HETE | Tryptophan, Creatinine | |
| Inconsistent | Inosine, Linoleic acid, Glycerol, Uracil, Tryptophan, Adenosine, Taurine, Dehydroepiandrosterone sulfate, Myristic acid, DL-2-Aminoadipic acid, Urea, Tyramine, Glycine, Oleic acid, Triglyceride, Glycoursodeoxycholic acid, 15-HETE, 5-HETE, 13(S)-HOTrE, 9(S)-HOTrE, 13-oxo-ODE, 9-oxo-ODE, 12(13)EpOME, 9(10)EpOME, 12(13)EpOME, 9(10)EpOME, 12,13-DHOME, 9,10-DHOME, 14,15-DHET, 8,9-DHET, 5,6-DHET, Thromboxin B3, L-Phenylalanine, TAG16:0-16:1-18:1, Choline phosphate | Uric acid, Hypoxanthine, Guanosine | |
| Small Molecule Metabolites | Studies for Synthesis | SMD | 95% CI | I2 | p-Value |
|---|---|---|---|---|---|
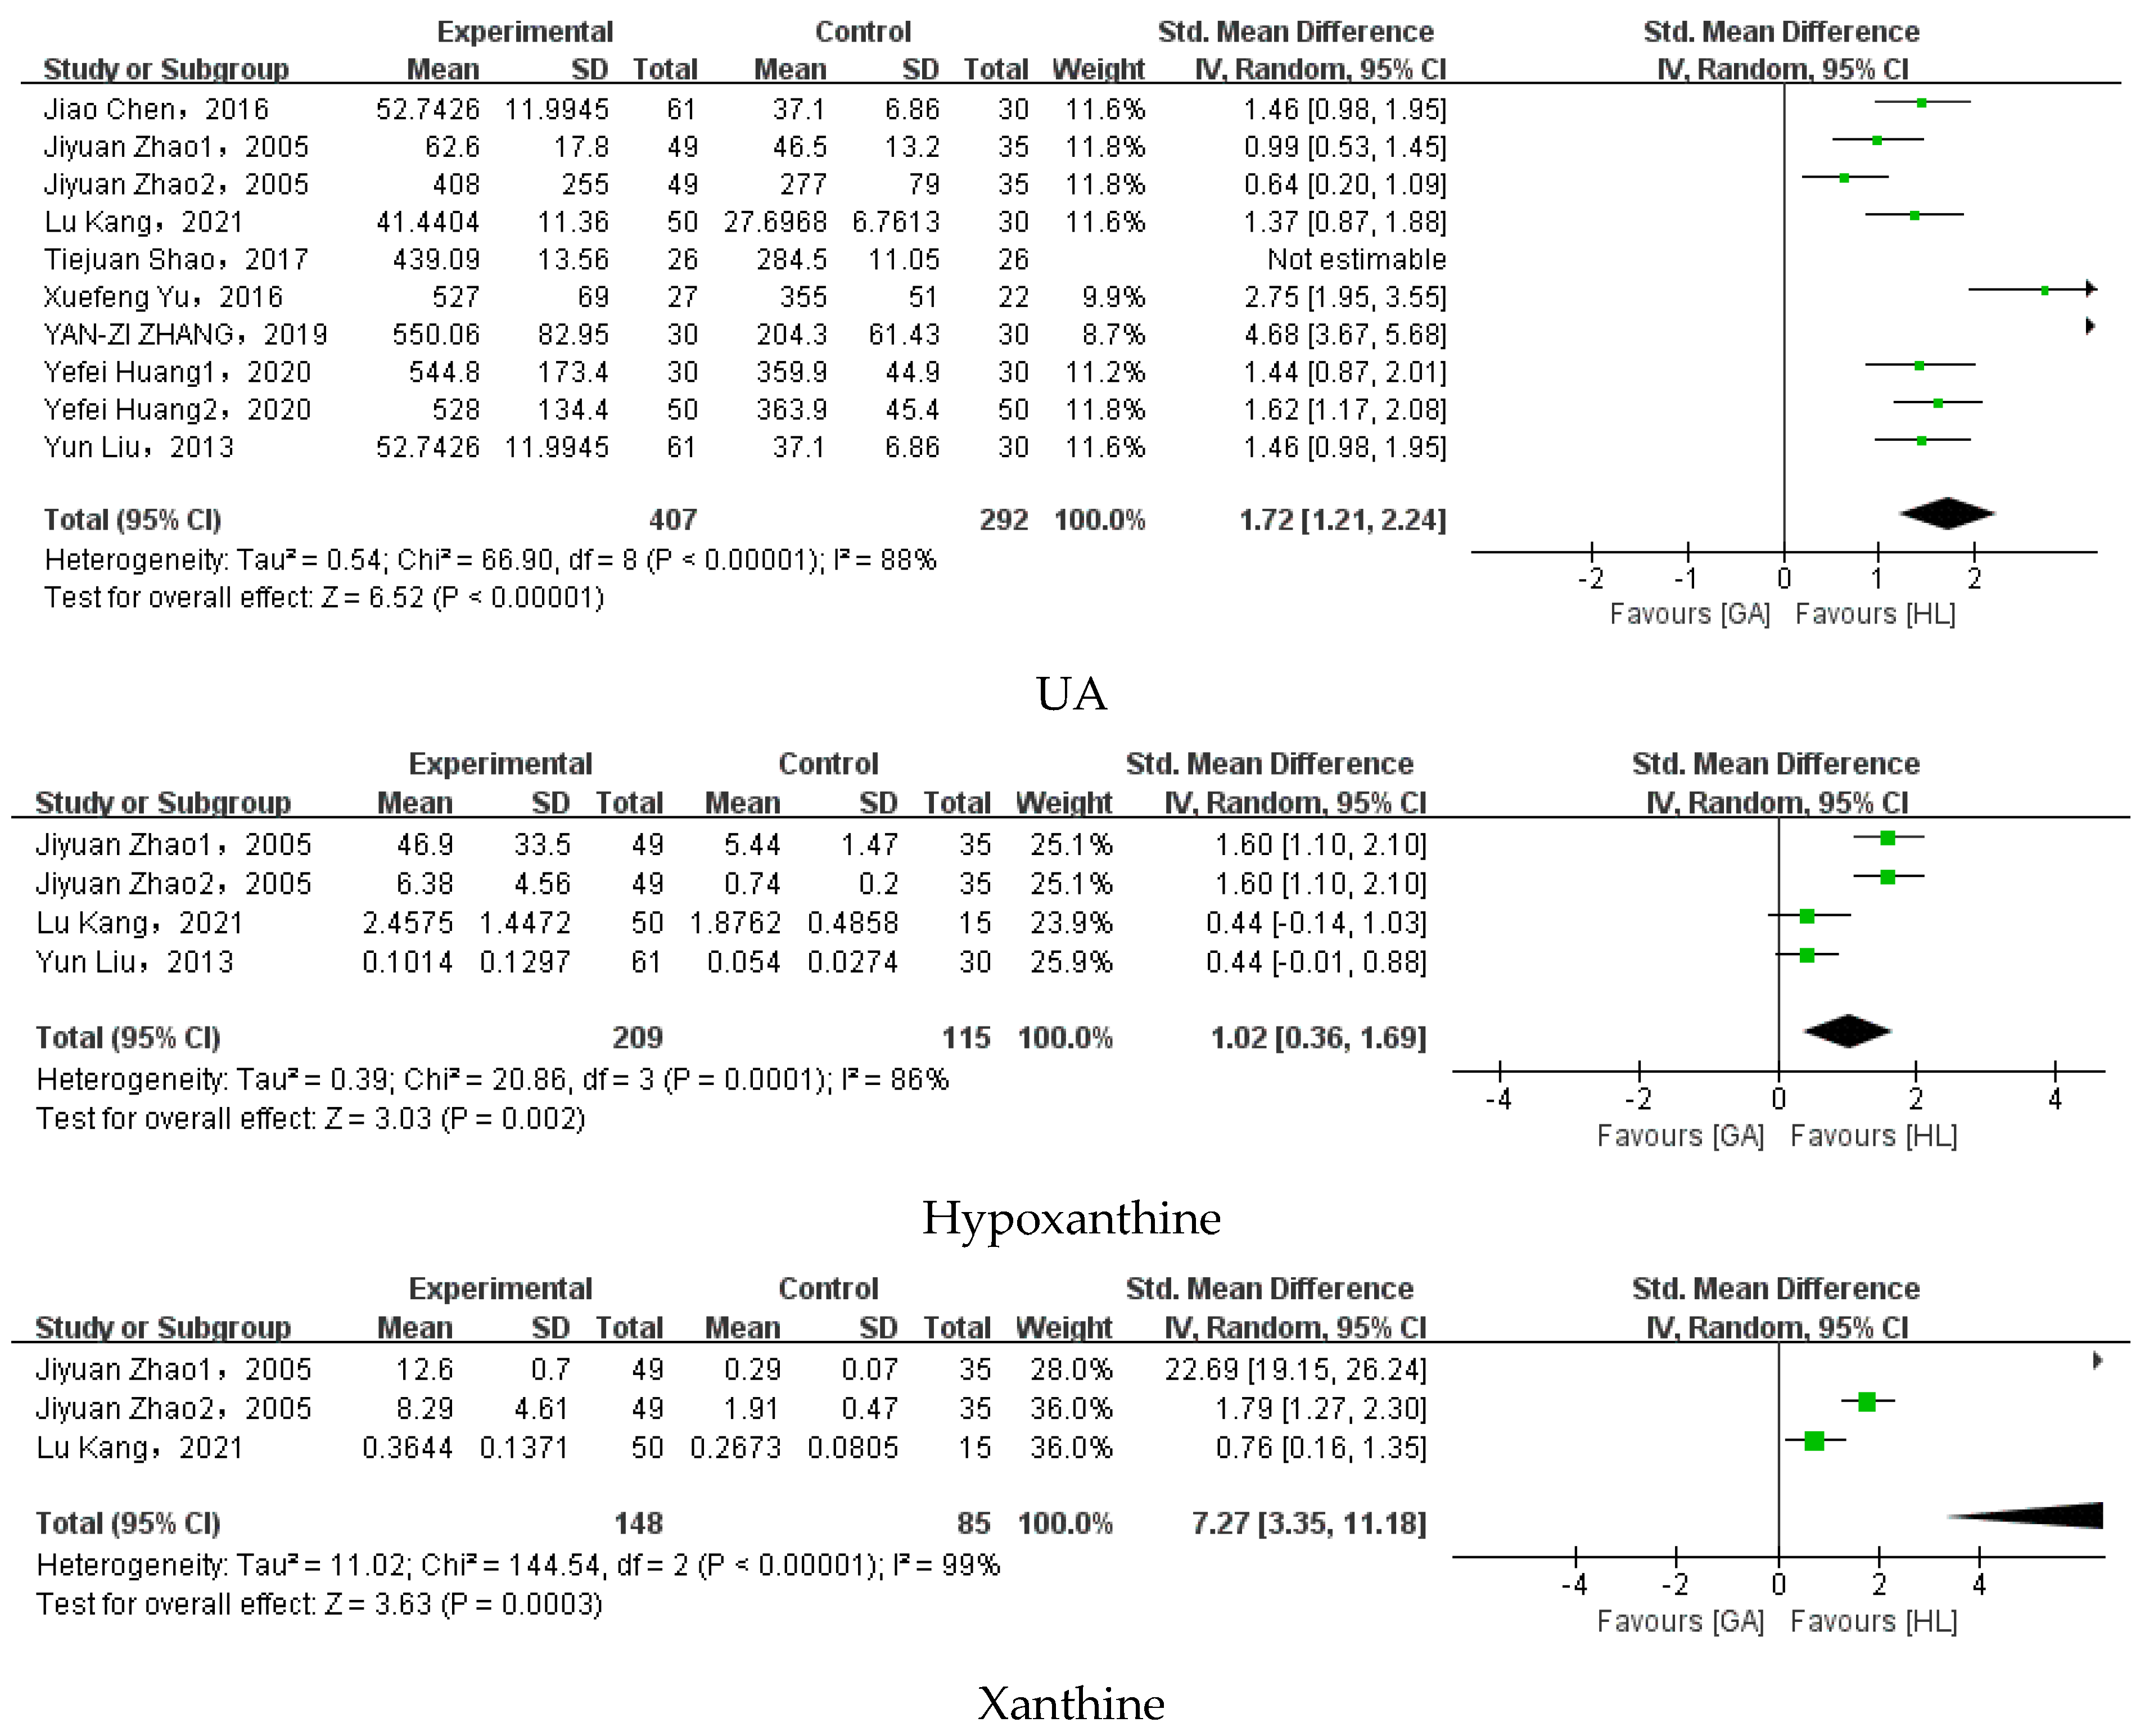
| Uric acid | Jiyuan Zhao et al. (2005) [37]; Jiyuan Zhao et al. (2005) [72]; Yun Liu et al. (2013) [36]; Jiao Chen et al. (2016) [48]; Xuefeng Yu et al. (2016) [54]; Tiejuan Shao et al. (2017) [68]; Zizhang Yan et al. (2019) [71]; Yefei Huang et al. (2020) [33]; Kang Lu et al. (2021) [44] | 2.27 | [1.55, 2.99] | 93% | p < 0.00001 |
| Kynurenic acid | Shang Lv et al. (2020) [45]; Shang Lyu et al. (2022) [46] | 0.58 | 0.36–0.79 | 0% | p < 0.00001 |
| Guanosine | Jiyuan Zhao et al. (2005) [37]; Jiyuan Zhao et al. (2005) [72] | 0.9 | [0.58, 1.23] | 0% | p < 0.00001 |
| Creatinine | Tiejuan Shao et al. (2017) [68]; Zizhang Yan et al. (2019) [71]; Yefei Huang et al. (2020) [33]; Kang Lu et al. (2021) [44] | 1.4 | [0.96, 1.84] | 67% | p < 0.00001 |
| DL-2-Aminoadipic acid | Shang Lv et al. (2020) [45]; Shang Lyu et al. (2022) [46] | 1.45 | [1.21, 1.69] | 0% | p < 0.00001 |
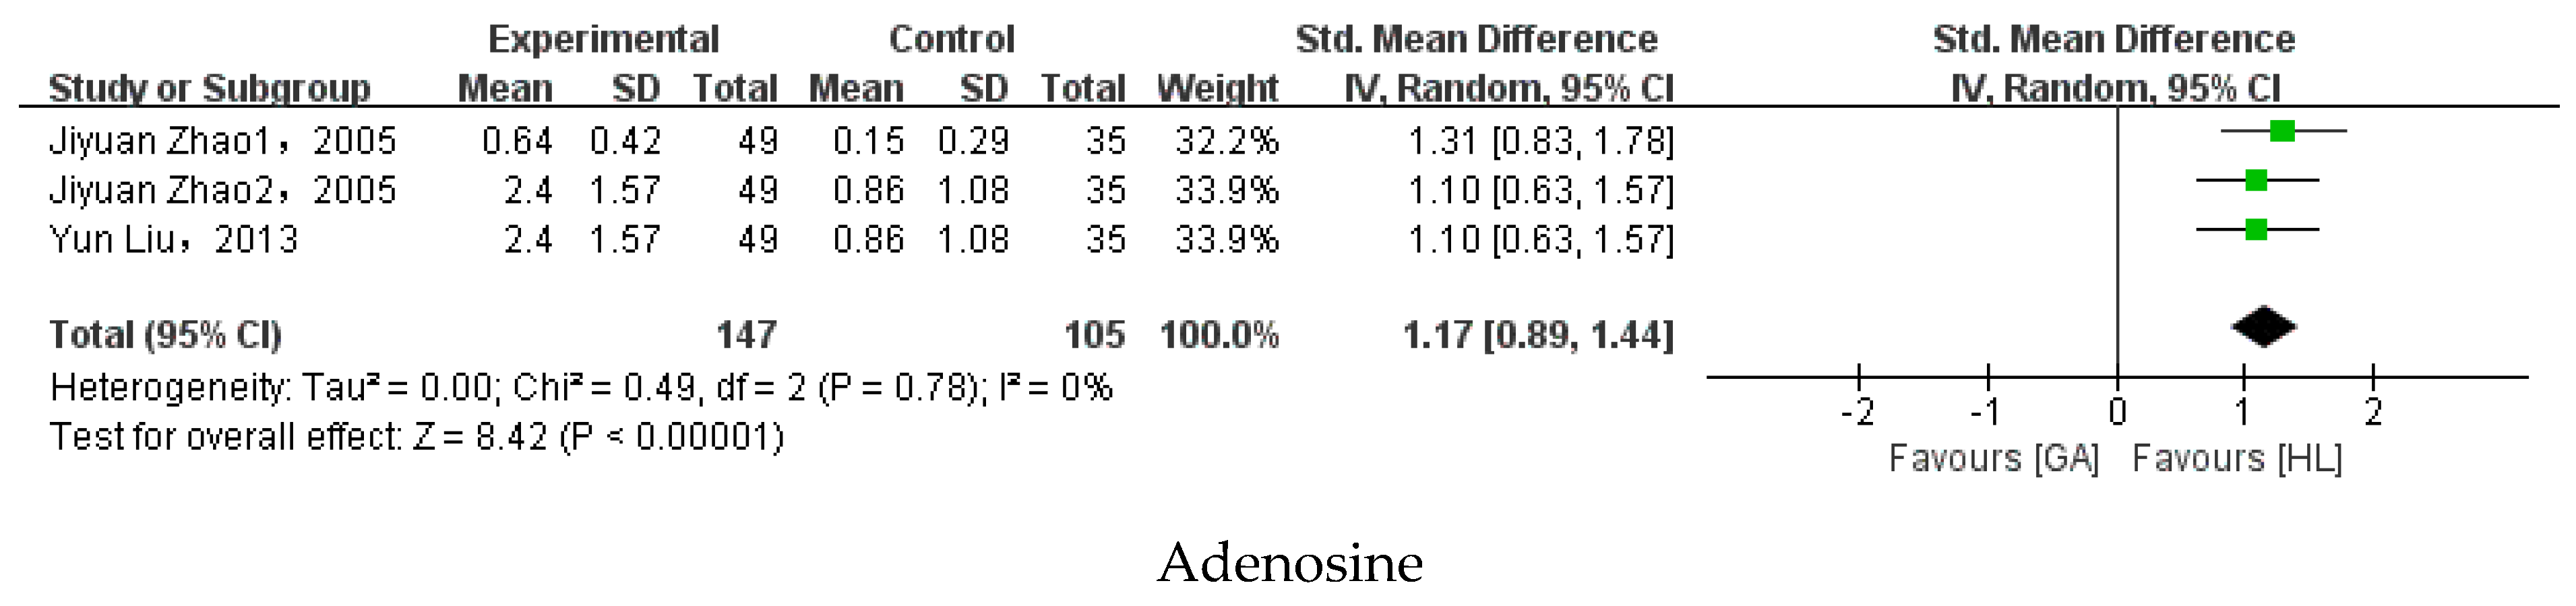
| Adenosine | Jiyuan Zhao et al. (2005) [37]; Jiyuan Zhao et al. (2005) [72]; Yun Liu et al. (2013) [36] | 1.17 | [0.89, 1.44] | 0% | p < 0.00001 |
| 19,20-DHDPA | Ying Luo et al. (2019) [67] | −0.92 | [−1.35, −0.49] | 0% | p < 0.0001 |
| Xanthine | Jiyuan Zhao et al. (2005) [37]; Jiyuan Zhao et al. (2005) [72] | 7.27 | [3.35–11.8] | 99% | p = 0.0003 |
| 5-oxo-ETE | Ying Luo et al. (2019) [67] | 0.57 | [0.15, 0.99] | 0% | p = 0.008 |
| Leukotriene B4 | Ying Luo et al. (2019) [67] | 0.59 | [0.17, 1.01] | 0% | p = 0.005 |
| Hypoxanthine | Jiyuan Zhao et al. (2005) [37]; Jiyuan Zhao et al. (2005) [72]; Yun Liu et al. (2013) [36]; Kang Lu et al. (2021) [44] | 1.02 | [0.36, 1.69] | 86% | p = 0.002 |
| 2-Deoxyadenosine | Jiyuan Zhao et al. (2005) [37]; Jiyuan Zhao et al. (2005) [72] | 0.38 | [0.07, 0.69] | 0% | p = 0.02 |
| 13(S)-HODE | Ying Luo et al. (2019) [67] | 0.51 | [0.09, 0.92] | 0% | p = 0.02 |
| 9(S)-HODE | Ying Luo et al. (2019) [67] | 0.52 | [0.10, 0.93] | 0% | p = 0.02 |
| 11,12-DHET | Ying Luo et al. (2019) [67] | −0.5 | [−0.91, −0.08] | 0% | p = 0.02 |
| 12-HETE | Ying Luo et al. (2019) [67] | −0.73 | [−1.38, −0.08] | 56% | p = 0.03 |
| 20-carboxy-ARA | Ying Luo et al. (2019) [67] | −0.46 | [−0.87, −0.04] | 0% | p = 0.03 |
| High-density lipoprotein | Xuefeng Yu et al. (2016) [54]; Zizhang Yan et al. (2019) [71] | −1.28 | [−3.05, 0.48] | 93% | p = 0.15 |
| Low-density lipoprotein | Xuefeng Yu et al. (2016) [54]; Zizhang Yan et al. (2019) [71] | 2.37 | [−0.02, 4.75] | 95% | p = 0.05 |
| Blood urea nitrogen | Tiejuan Shao et al. (2017) [68]; Zizhang Yan et al. (2019) [71] | 2.47 | [−0.63, 5.57] | 97% | p = 0.12 |
| 11-HETE | Ying Luo et al. (2019) [67] | −0.49 | [−1.18, 0.20] | 62% | p = 0.16 |
| 8-HETE | Ying Luo et al. (2019) [67] | −0.2 | [−0.61, 0.21] | 0% | p = 0.34 |
| 14(15)EET | Ying Luo et al. (2019) [67] | −0.93 | [−2.07, 0.22] | 85% | p = 0.11 |
| 11(12)EET | Ying Luo et al. (2019) [67] | −0.84 | [−2.07, 0.39] | 87% | p = 0.18 |
| 8(9)EET | Ying Luo et al. (2019) [67] | 0.91 | [−1.95, 0.13] | 82% | p = 0.09 |
| 5(6)EET | Ying Luo et al. (2019) [67] | −1.04 | [−2.53, 0.45] | 9% | p = 0.17 |
| 19(20)EDP | Ying Luo et al. (2019) [67] | −0.59 | [−1.47, 0.28] | 76% | p = 0.18 |
| 17,18- DHETE | Ying Luo et al. (2019) [67] | −0.42 | [−0.83, −0.00] | 0% | p = 0.05 |
| Thromboxin B2 | Ying Luo et al. (2019) [67] | 0.25 | [−0.16, 0.66] | 0% | p = 0.23 |
| Inosine | Jiyuan Zhao et al. (2005) [37]; Jiyuan Zhao et al. (2005) [72]; Yun Liu et al. (2013) [36]; Kang Lu et al. (2021) [44] | 0.09 | [−1.07, 1.26] | 95% | p = 0.87 |
| Uracil | Yun Liu et al. (2013) [36]; Shang Lyu et al. (2022) [46] | −5.14 | [−15.12, 4.84] | 99% | p = 0.31 |
| Linoleic acid | Qilin Huang et al. (2014) [47]; Xuefeng Yu et al. (2016) [54] | −0.36 | [−3.69, 2.97] | 98% | p = 0.83 |
| 15-HETE | Ying Luo et al. (2019) [67] | −0.27 | [−0.91, 0.37] | 57% | p = 0.40 |
| 5-HETE | Ying Luo et al. (2019) [67] | −0.28 | [−2.37, 1.80] | 85% | p = 0.79 |
| 13(S)-HOTrE | Ying Luo et al. (2019) [67] | 0.95 | [−0.15, 2.05] | 66% | p = 0.09 |
| 9(S)-HOTrE | Ying Luo et al. (2019) [67] | 0.42 | [−0.65, 1.48] | 84% | p = 0.44 |
| 13-oxo-ODE | Ying Luo et al. (2019) [67] | −0.31 | [−2.55, 1.94] | 96% | p = 0.79 |
| 9-oxo-ODE | Ying Luo et al. (2019) [67] | −0.15 | [−2.28, 1.97] | 96% | p = 0.89 |
| 12(13)EpOME | Ying Luo et al. (2019) [67] | 0.47 | [−0.75, 1.70] | 88% | p = 0.45 |
| 9(10)EpOME | Ying Luo et al. (2019) [67] | 0.06 | [−0.92, 1.05] | 82% | p = 0.90 |
| 12,13-DHOME | Ying Luo et al. (2019) [67] | 0.26 | [−0.63, 1.15] | 78% | p = 0.57 |
| 9,10-DHOME | Ying Luo et al. (2019) [67] | 0.00 | [−1.09, 1.09] | 85% | p = 1.00 |
| 14,15-DHET | Ying Luo et al. (2019) [67] | −0.04 | [−1.07, 0.98] | 83% | p = 0.93 |
| 8,9-DHET | Ying Luo et al. (2019) [67] | 0.42 | [−0.63, 1.47] | 83% | p = 0.44 |
| 5,6-DHET | Ying Luo et al. (2019) [67] | −0.47 | [−2.42, 1.49] | 95% | p = 0.64 |
| Thromboxin B3 | Ying Luo et al. (2019) [67] | 0.25 | [−0.41, 0.41] | 0% | p = 0.98 |
Disclaimer/Publisher’s Note: The statements, opinions and data contained in all publications are solely those of the individual author(s) and contributor(s) and not of MDPI and/or the editor(s). MDPI and/or the editor(s) disclaim responsibility for any injury to people or property resulting from any ideas, methods, instructions or products referred to in the content. |
© 2023 by the authors. Licensee MDPI, Basel, Switzerland. This article is an open access article distributed under the terms and conditions of the Creative Commons Attribution (CC BY) license (https://creativecommons.org/licenses/by/4.0/).
Share and Cite
Li, Y.; Han, X.; Tong, J.; Wang, Y.; Liu, X.; Liao, Z.; Jiang, M.; Zhao, H. Analysis of Metabolites in Gout: A Systematic Review and Meta-Analysis. Nutrients 2023, 15, 3143. https://doi.org/10.3390/nu15143143
Li Y, Han X, Tong J, Wang Y, Liu X, Liao Z, Jiang M, Zhao H. Analysis of Metabolites in Gout: A Systematic Review and Meta-Analysis. Nutrients. 2023; 15(14):3143. https://doi.org/10.3390/nu15143143
Chicago/Turabian StyleLi, Yuanyuan, Xu Han, Jinlin Tong, Yuhe Wang, Xin Liu, Zeqi Liao, Miao Jiang, and Hongyan Zhao. 2023. "Analysis of Metabolites in Gout: A Systematic Review and Meta-Analysis" Nutrients 15, no. 14: 3143. https://doi.org/10.3390/nu15143143
APA StyleLi, Y., Han, X., Tong, J., Wang, Y., Liu, X., Liao, Z., Jiang, M., & Zhao, H. (2023). Analysis of Metabolites in Gout: A Systematic Review and Meta-Analysis. Nutrients, 15(14), 3143. https://doi.org/10.3390/nu15143143