
Nutrition and Outcome of 100 Endoscopic Gastrostomy-Fed Citizens with Severe Dementia

 ,
,  , and
, and 
Abstract
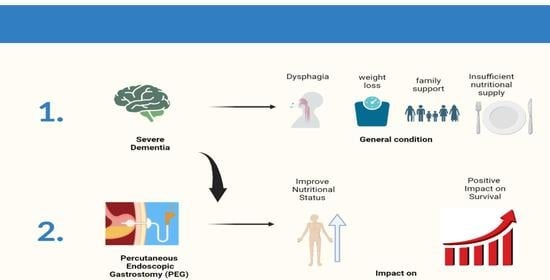
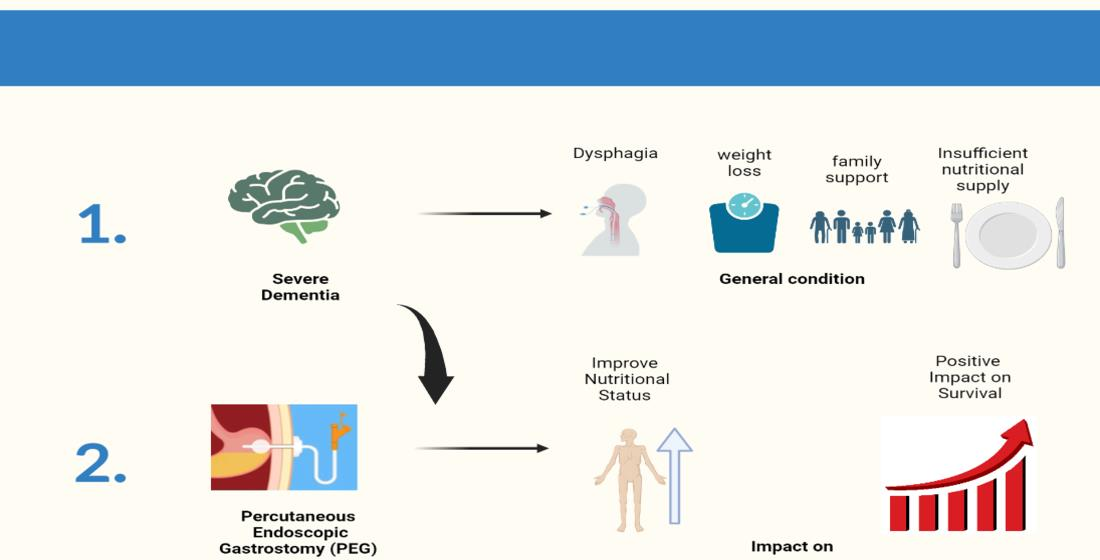
1. Introduction
Objectives
- 1.
- To evaluate PWSDs’ clinical and nutritional status at three GENE routine evaluation follow-ups. T0—at the day of the endoscopic gastrostomy procedure, T1—1 month after gastrostomy, and T2—three months after gastrostomy.Using several easily accessible tools, even with patients who have speech difficulties, namely:
- 1.1
- Anthropometry.
- 1.2
- Laboratory data.
- 2.
- To evaluate the survival of PEG-fed PWSD after the gastrostomy procedure.
- 3.
- To evaluate the impact of nutritional status on the survival outcome of PWSD patients that underwent endoscopic gastrostomy, using anthropometric and biochemical markers.
- 4.
- To evaluate the impact of PEG feeding on the nutritional status and patients’ outcomes, evaluated using anthropometric and biochemical markers.
- 5.
- To evaluate the occurrence of major complications from the gastrostomy procedure or PEG-feeding to establish the safety of endoscopic gastrostomy on PWSD.
2. Materials and Methods
2.1. Patients
- Early dementia stage.
- Insufficient data in the clinical file.
2.2. Safety
2.3. Clinical Outcome
2.4. Anthropometric Evaluation
2.5. Laboratory Evaluation
2.6. Ethical Considerations
2.7. Statistics
3. Results
3.1. Subjects
3.2. Anthropometry at T0
3.3. Laboratory Assessment at T0
3.4. Safety
3.5. Evolution Data According to Follow-Ups (T0 to T2)
3.6. Clinical Outcome
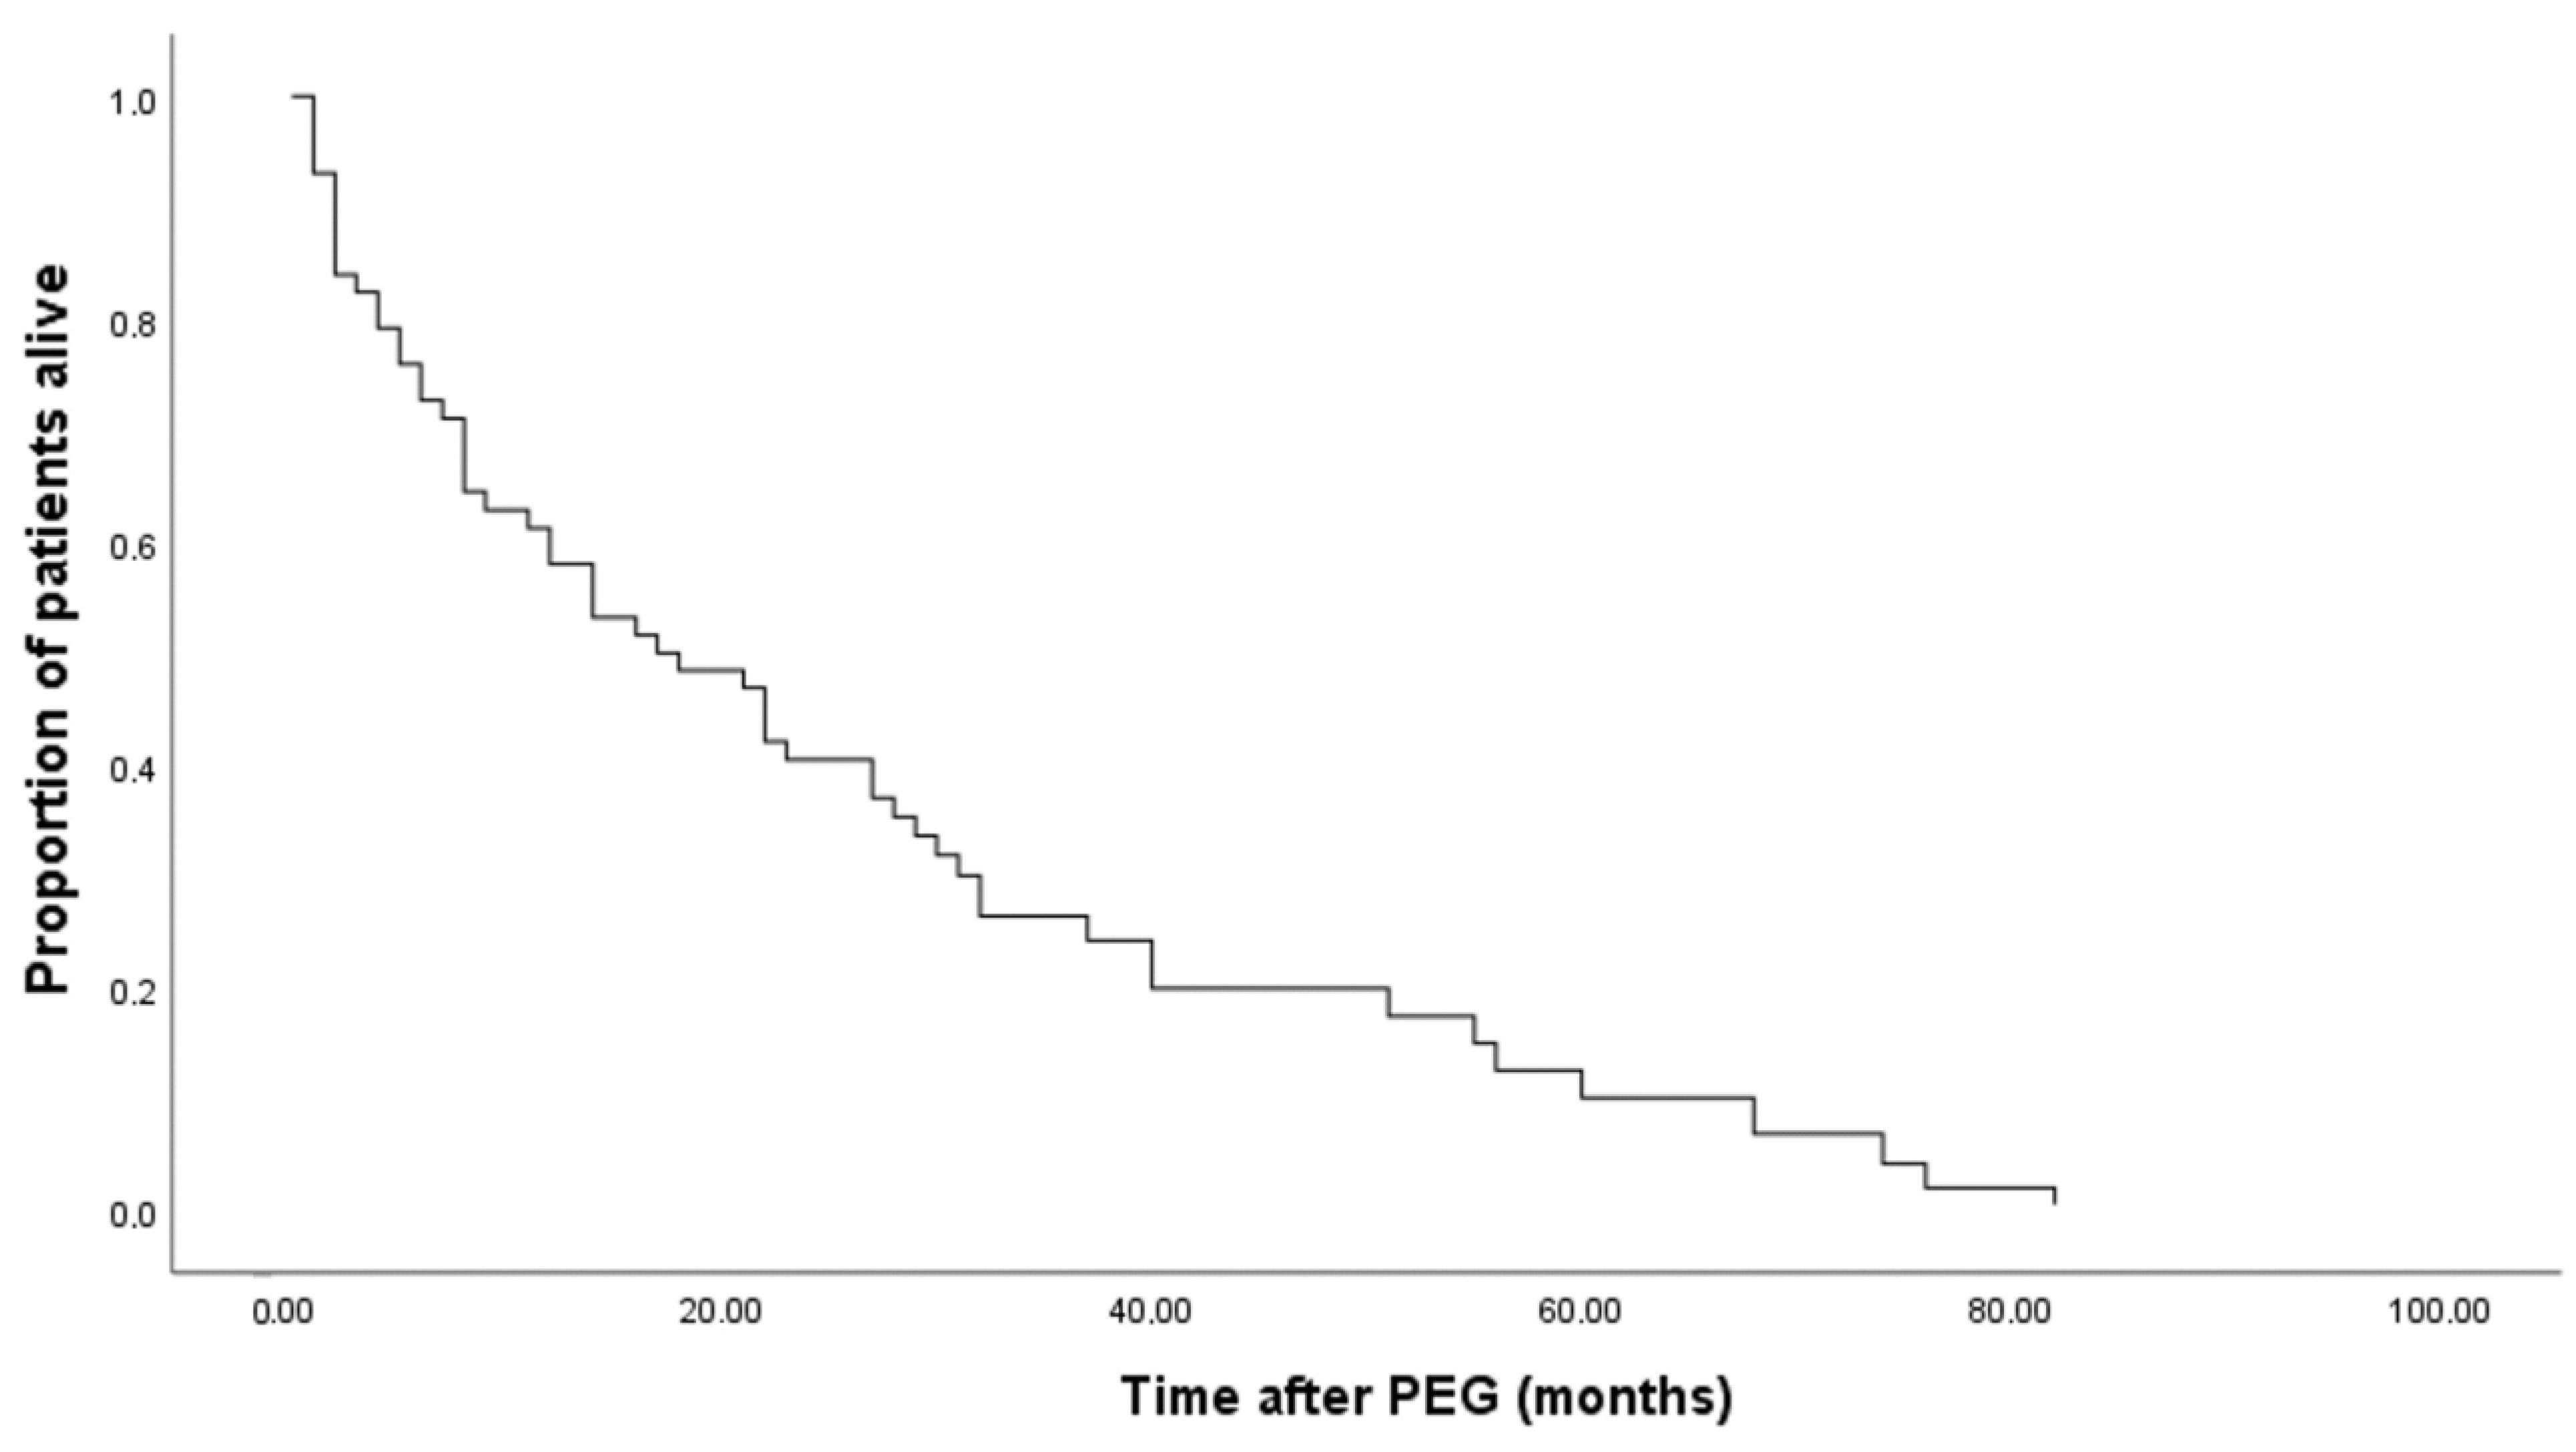
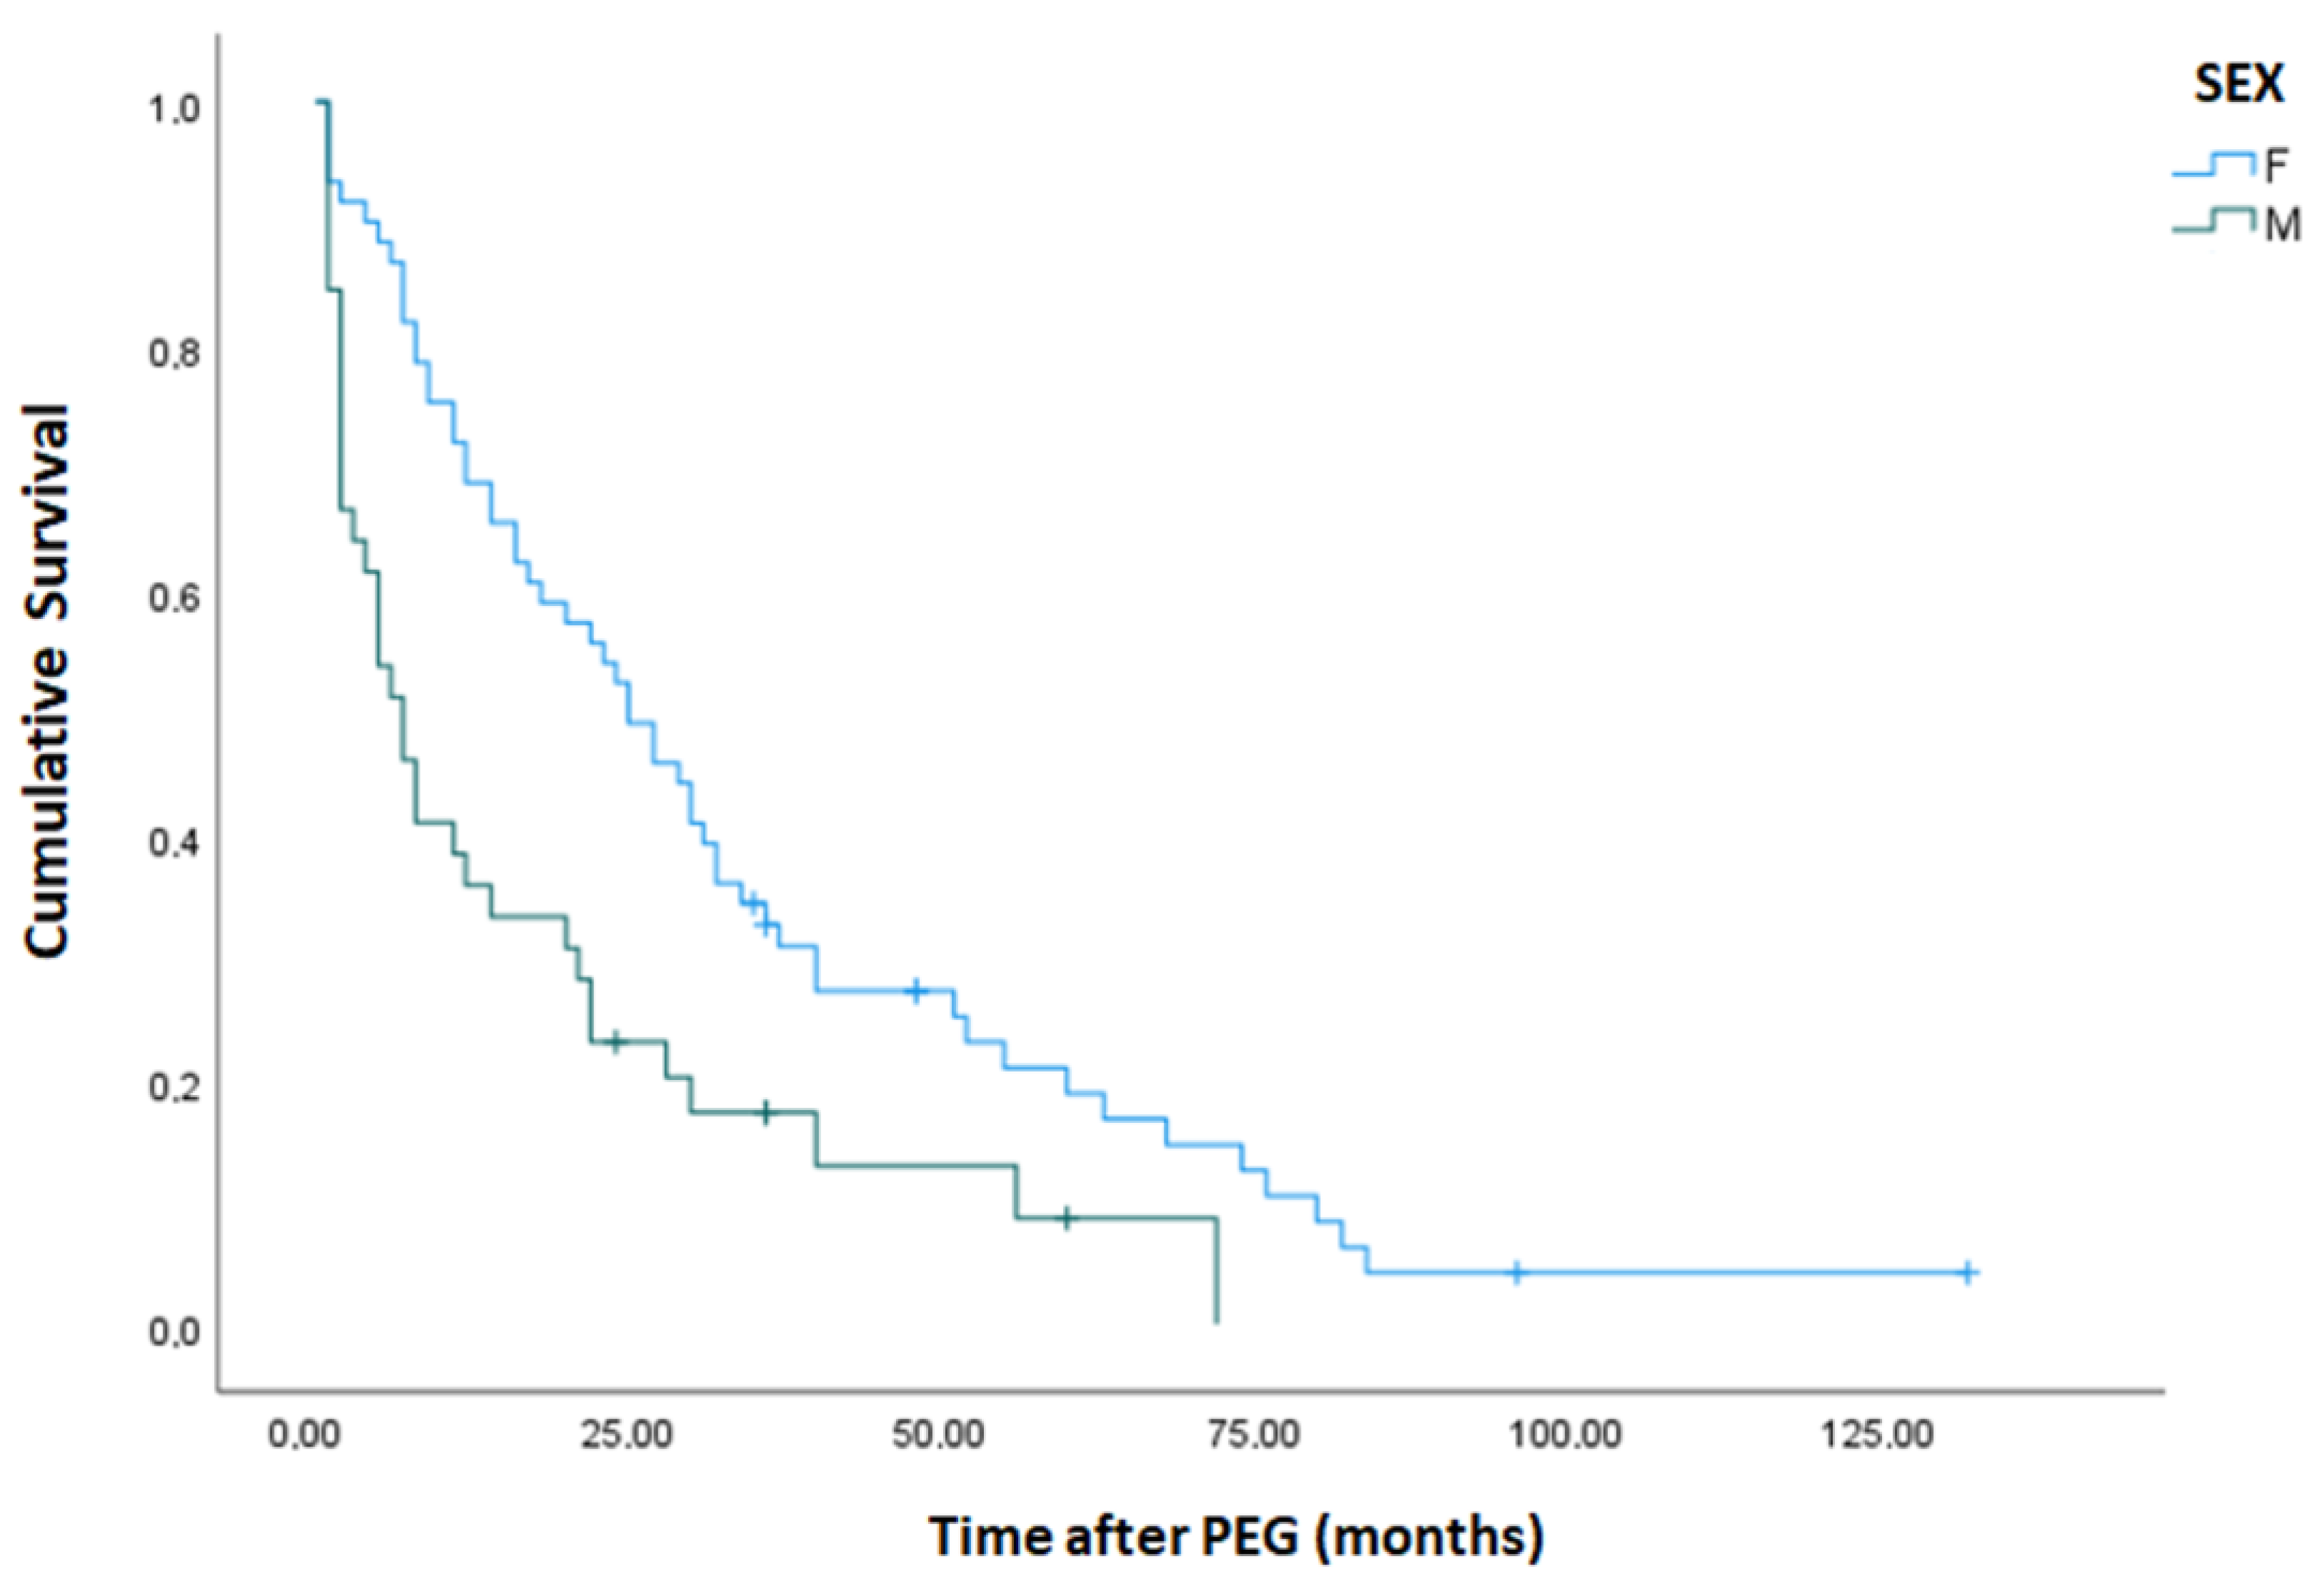
3.7. Kaplan–Meier Survival Analysis
3.8. Survival According to Data Follow-Ups (T0 to T2)
4. Discussion
5. Conclusions
Author Contributions
Funding
Institutional Review Board Statement
Informed Consent Statement
Data Availability Statement
Acknowledgments
Conflicts of Interest
References
- Arvanitakis, Z.; Shah, R.C.; Bennett, D.A. Diagnosis and Management of Dementia: Review. JAMA 2019, 322, 1589–1599. [Google Scholar] [CrossRef]
- Dementia: A Public Health Priority. Who.int. Available online: https://www.who.int/publications/i/item/dementia-a-public-health-priority (accessed on 6 January 2020).
- Prince, M.; Wimo, A.; Guerchet, M.; Ali, G.-C.; Wu, Y.-T.; Prina, M.; Kit, Y.; Xia, Z. World Alzheimer Report 2015 The Global Impact of Dementia. Available online: https://www.alzint.org/u/WorldAlzheimerReport2015.pdf (accessed on 6 January 2020).
- Rikkert, M.G.M.O.; Tona, K.D.; Janssen, L.; Burns, A.; Lobo, A.; Robert, P.; Sartorius, N.; Stoppe, G.; Waldemar, G. Validity, Reliability, and Feasibility of Clinical Staging Scales in Dementia: A Systematic Review: A Systematic Review. Am. J. Alzheimers Dis. Other Dement. 2011, 26, 357–365. [Google Scholar] [CrossRef]
- Burke, W.J.; Houston, M.J.; Boust, S.J.; Roccaforte, W.H. Use of the Geriatric Depression Scale in Dementia of the Alzheimer Type. J. Am. Geriatr. Soc. 1989, 37, 856–860. [Google Scholar] [CrossRef]
- Eisdorfer, C.; Cohen, D.; Paveza, G.J.; Ashford, J.W.; Luchins, D.J.; Gorelick, P.B.; Hirschman, R.S.; Freels, S.A.; Levy, P.S.; Semla, T.P. An Empirical Evaluation of the Global Deterioration Scale for Staging Alzheimer’s Disease. Am. J. Psychiatry 1992, 149, 190–194. [Google Scholar] [CrossRef]
- Sclan, S.G.; Reisberg, B. Functional Assessment Staging (FAST) in Alzheimer’s Disease: Reliability, Validity, and Ordinality. Int. Psychogeriatr. 1992, 4 (Suppl. 1), 55–69. [Google Scholar] [CrossRef]
- Volkert, D.; Chourdakis, M.; Faxen-Irving, G.; Frühwald, T.; Landi, F.; Suominen, M.H.; Vandewoude, M.; Wirth, R.; Schneider, S.M. ESPEN Guidelines on Nutrition in Dementia. Clin. Nutr. 2015, 34, 1052–1073. [Google Scholar] [CrossRef]
- Sampson, E.L.; Candy, B.; Jones, L. Enteral Tube Feeding for Older People with Advanced Dementia. Cochrane Database Syst. Rev. 2009, 2009, CD007209. [Google Scholar] [CrossRef]
- Goldberg, L.S.; Altman, K.W. The Role of Gastrostomy Tube Placement in Advanced Dementia with Dysphagia: A Critical Review. Clin. Interv. Aging 2014, 9, 1733–1739. [Google Scholar] [CrossRef]
- Salomon, R.; Garbi Novaes, C. Outcomes of Enteral Nutrition for Patients with Advanced Dementia: A Systematic Review. J. Nutr. Health Aging 2015, 19, 169–177. [Google Scholar] [CrossRef]
- Brooke, J.; Ojo, O. Enteral Nutrition in Dementia: A Systematic Review. Nutrients 2015, 7, 2456–2468. [Google Scholar] [CrossRef]
- Douglas, J.W.; Lawrence, J.C.; Turner, L.W. Social Ecological Perspectives of Tube-Feeding Older Adults with Advanced Dementia: A Systematic Literature Review. J. Nutr. Gerontol. Geriatr. 2017, 36, 1–17. [Google Scholar] [CrossRef] [PubMed]
- American Geriatrics Society Ethics Committee; Clinical Practice and Models of Care Committee. American Geriatrics Society Feeding Tubes in Advanced Dementia Position Statement. J. Am. Geriatr. Soc. 2014, 62, 1590–1593. [Google Scholar] [CrossRef] [PubMed]
- Orlandoni, P.; Jukic Peladic, N.; Cherubini, A. Enteral Nutrition in Advanced Dementia: An Unresolved Dilemma in Clinical Practice. Eur. Geriatr. Med. 2020, 11, 191–194. [Google Scholar] [CrossRef]
- Sanders, D.S.; Anderson, A.J.; Bardhan, K.D. Percutaneous Endoscopic Gastrostomy: An Effective Strategy for Gastrostomy Feeding in Patients with Dementia. Clin. Med. 2004, 4, 235–241. [Google Scholar] [CrossRef] [PubMed]
- Sanders, D.S.; Leeds, J.S.; Drew, K. The Role of Percutaneous Endoscopic Gastrostomy in Patients with Dementia. Br. J. Nurs. 2008, 17, 588–594. [Google Scholar] [CrossRef] [PubMed]
- Nunes, G.; Santos, C.A.; Santos, C.; Fonseca, J. Percutaneous Endoscopic Gastrostomy for Nutritional Support in Dementia Patients. Aging Clin. Exp. Res. 2016, 28, 983–989. [Google Scholar] [CrossRef] [PubMed]
- Orlandoni, P.; Peladic, N.J.; Di Rosa, M.; Venturini, C.; Fagnani, D.; Sparvoli, D.; Giorgini, N.; Basile, R.; Cola, C. The Outcomes of Long Term Home Enteral Nutrition (HEN) in Older Patients with Severe Dementia. Clin. Nutr. 2019, 38, 1871–1876. [Google Scholar] [CrossRef]
- Powell-Tuck, J.; Hennessy, E.M. A comparison of mid upper arm circumference, body mass index and weight loss as indices of undernutrition in acutely hospitalized patients. Clin. Nutr. 2003, 22, 307–312. [Google Scholar] [CrossRef]
- Pereira, M.; Santos, C.; Fonseca, J. Body Mass Index Estimation on Gastrostomy Patients Using the Mid Upper Arm Circumference. J. Aging Res. Clin. Pract. 2010, 1, 252–255. [Google Scholar]
- Barosa, R.; Roque Ramos, L.; Santos, C.A.; Pereira, M.; Fonseca, J. Mid Upper Arm Circumference and Powell-Tuck and Hennessy’s Equation Correlate with Body Mass Index and Can Be Used Sequentially in Gastrostomy Fed Patients. Clin. Nutr. 2018, 37, 1584–1588. [Google Scholar] [CrossRef]
- A Healthy Lifestyle-WHO Recommendations. Who.int. Available online: https://www.who.int/europe/news-room/fact-sheets/item/a-healthy-lifestyle---who-recommendations (accessed on 6 January 2020).
- Frisancho, A.R. New Standards of Weight and Body Composition by Frame Size and Height for Assessment of Nutritional Status of Adults and the Elderly. Am. J. Clin. Nutr. 1984, 40, 808–819. [Google Scholar] [CrossRef] [PubMed]
- Fonseca, J.; Santos, C.A. Clinical anatomy: Anthropometry for nutritional assessment of 367 adults who underwent endoscopic gastrostomy. Acta Med. Port. 2013, 26, 212–218. [Google Scholar] [PubMed]
- Sultan, S.; Nasir, K.; Qureshi, R.; Dhrolia, M.; Ahmad, A. Assessment of the Nutritional Status of the Hemodialysis Patients by Anthropometric Measurements. Cureus 2021, 13, e18605. [Google Scholar] [CrossRef] [PubMed]
- Kuzuya, M.; Izawa, S.; Enoki, H.; Okada, K.; Iguchi, A. Is Serum Albumin a Good Marker for Malnutrition in the Physically Impaired Elderly? Clin. Nutr. 2007, 26, 84–90. [Google Scholar] [CrossRef]
- Fonseca, J.; Adriana Santos, C.; Brito, J. Predicting Survival of Endoscopic Gastrostomy Candidates Using the Underlying Disease, Serum Cholesterol, Albumin and Transferrin Levels. Nutr. Hosp. 2013, 28, 1280–1285. [Google Scholar] [CrossRef]
- Vyroubal, P.; Chiarla, C.; Giovannini, I.; Hyspler, R.; Ticha, A.; Hrnciarikova, D.; Zadak, Z. Hypocholesterolemia in Clinically Serious Conditions—Review. Biomed. Pap. Med. Fac. Univ. Palacky Olomouc Czech. Repub. 2008, 152, 181–189. [Google Scholar] [CrossRef]
- Callahan, C.M.; Haag, K.M.; Weinberger, M.; Tierney, W.M.; Buchanan, N.N.; Stump, T.E.; Nisi, R. Outcomes of Percutaneous Endoscopic Gastrostomy among Older Adults in a Community Setting. J. Am. Geriatr. Soc. 2000, 48, 1048–1054. [Google Scholar] [CrossRef]
- Volkert, D.; Berner, Y.N.; Berry, E.; Cederholm, T.; Coti Bertrand, P.; Milne, A.; Palmblad, J.; Schneider, S.; Sobotka, L.; Stanga, Z.; et al. ESPEN Guidelines on Enteral Nutrition: Geriatrics. Clin. Nutr. 2006, 25, 330–360. [Google Scholar] [CrossRef]
- American Psychiatric Association. Delirium, dementia, and amnestic and olther cognitive disorders. In Diagnostic and Statistical Manual of Mental Disorders Text Revision, 4th ed.; American Psychiatric Publishing, Inc.: Washington, DC, USA, 2000; pp. 135–180. [Google Scholar]


| Low | Normal | High | |
|---|---|---|---|
| <65 Years | <18.5 kg/m2 | ≥18.5–<25 kg/m2 | ≥25 kg/m2 |
| ≥65 Years | <22 kg/m2 | ≥22–<27 kg/m2 | ≥27 kg/m2 |
| Total (n = 100) | Male (n = 39) | Female (n = 61) | Total Mean | |
|---|---|---|---|---|
| Anthropometry Results | ||||
| BMI | 39 Low (39%) | 13 Low (33.3%) | 26 Low (42.6%) | |
| 33 Normal (33%) | 16 Normal (41%) | 17 Normal (27.8%) | ||
| 28 High (28%) | 10 High (25.7%) | 18 High (29.6%) | ||
| MUAC | 77 Low (77%) | 31 Low (79.5%) | 46 Low (75.4%) | |
| 23 Normal (23%) | 8 Normal (20.5%) | 15 Normal (24.6%) | ||
| TSF | 84 Low (84%) | 29 Low (74.4%) | 55 Low (90.1%) | |
| 16 Normal (16%) | 10 Normal (25.6%) | 6 Normal (9.9%) | ||
| MAMC | 52 Low (52%) | 31 Low (79.5%) | 21 Low (34.4%) | |
| 48 Normal (48%) | 8 Normal (20.5%) | 40 Normal (65.6%) | ||
| Laboratory serum data | ||||
| Albumin | 64 Low (64%) | 31 Low (79.5%) | 33 Low (54.1%) | 3.25 g/dL |
| 36 Normal (36%) | 8 Normal (20.5%) | 28 Normal (45.9%) | ||
| Transferrin | 62 Low (62%) | 35 Low (89.7%) | 45 Low (73.7%) | 170.6 mg/dL |
| 34 Normal (34%) | 4 Normal (10.3%) | 16 Normal (26.3%) | ||
| Total Cholesterol | 51 Low (51%) | 28 Low (71.8%) | 23 Low (33.7%) | 164.4 mg/dL |
| 49 Normal (49%) | 11 Normal (28.2%) | 38 Normal (66.3%) | ||
| Hemoglobin * (n = 65) | 43 low (66.1%) | 23 Low (88.5%) | 20 Low (50%) | 11.3 g/dL |
| 22 Normal (33.9% | 2 Normal (11.5%) | 20 Normal (50%) | ||
| Comparisons Pairwise | Recovery [95% Conf. Int.] | Sig. | |
|---|---|---|---|
| BMI | 1/2 | −0.328 [−1.468, 0.812] | 0.566 |
| 2/3 | 0.073 [−0.496, 0.642] | 0.798 | |
| 1/3 | −0.255 [−1.494, 0.984] | 0.681 | |
| MUAC | 1/2 | 2.172 [−5.473, 9.817] | 0.571 |
| 2/3 | 0.023 [−0.498, 0.545] | 0.929 | |
| 1/3 | 2.195 [−5.544, 9.934] | 0.572 | |
| MAMC | 1/2 | −0.666 [−8.317, 6.984] | 0.862 |
| 2/3 | 0.023 [−0.498, 0.545] | 0.929 | |
| 1/3 | −0.643 [−8.384, 7.098] | 0.868 | |
| TSF | 1/2 | 0.468 [−0.226, 1.162] | 0.182 |
| 2/3 | −0.026 [−0.751, 0.700] | 0.944 | |
| 1/3 | 0.442 [−0.438–1.323] | 0.318 | |
| Albumin | 1/2 | −0.191 [−0.324, −0.059] | 0.006 |
| 2/3 | −0.124 [−0.250, 0.001] | 0.052 | |
| 1/3 | −0.316 [−0.490, −0.141] | 0.001 | |
| Transferrin | 1/2 | −14.356 [−29.126, 0.413] | 0.056 |
| 2/3 | −18.375 [−31.473, −5.277] | 0.007 | |
| 1/3 | −32.731 [−51.665, −13.797] | 0.001 | |
| Total Cholesterol | 1/2 | −4.707 [−14.319, 4.904] | 0.328 |
| 2/3 | 2.976 [−9.252, 15.203] | 0.626 | |
| 1/3 | −1.732 [−17.538, 14.075] | 0.826 | |
| Hemoglobin | 1/2 | 4.454 [−8.045, 16.953] | 0.467 |
| 2/3 | −9.177 [−20.962, 2.609] | 0.120 | |
| 1/3 | −4.723 [−12.191, 2.745] | 0.203 |
| Survival (Month) | Mean a | Mean CI 95% | Median |
|---|---|---|---|
| Female | 34.2 | 26.1–42.3 | 25.0 |
| Male | 17.2 | 10.1–24.3 | 7.0 |
| Total | 27.9 | 21.8–34 | 17.0 |
| Survival (Month) | Mean a | Mean CI 95% | Median |
|---|---|---|---|
| BMI at baseline (T0) | |||
| Low | 26.588 | 15.93–37.24 | 18.000 |
| Normal | 31.258 | 18.17–44.34 | 9.000 |
| High | 26.462 | 19.07–33.85 | 22.000 |
| HR (Hazards Ratio) a | 95% CI | Sig. | ||
|---|---|---|---|---|
| Inferior | Superior | |||
| Sex (female) | 0.48 | 0.27 | 0.85 | 0.012 |
| Hemoglobin_0 | 0.98 | 0.97 | 0.91 | 0.005 |
| BMI_02 | 0.89 | 0.81 | 0.98 | 0.023 |
| MUAC_02 | 0.90 | 0.79 | 10.0 | 0.172 |
| MAMC_02 | 0.88 | 0.76 | 10.0 | 0.094 |
Disclaimer/Publisher’s Note: The statements, opinions and data contained in all publications are solely those of the individual author(s) and contributor(s) and not of MDPI and/or the editor(s). MDPI and/or the editor(s) disclaim responsibility for any injury to people or property resulting from any ideas, methods, instructions or products referred to in the content. |
© 2023 by the authors. Licensee MDPI, Basel, Switzerland. This article is an open access article distributed under the terms and conditions of the Creative Commons Attribution (CC BY) license (https://creativecommons.org/licenses/by/4.0/).
Share and Cite
Sousa-Catita, D.; Mascarenhas, P.; Oliveira, C.; Grunho, M.; Santos, C.A.; Fonseca, J. Nutrition and Outcome of 100 Endoscopic Gastrostomy-Fed Citizens with Severe Dementia. Nutrients 2023, 15, 2753. https://doi.org/10.3390/nu15122753
Sousa-Catita D, Mascarenhas P, Oliveira C, Grunho M, Santos CA, Fonseca J. Nutrition and Outcome of 100 Endoscopic Gastrostomy-Fed Citizens with Severe Dementia. Nutrients. 2023; 15(12):2753. https://doi.org/10.3390/nu15122753
Chicago/Turabian StyleSousa-Catita, Diogo, Paulo Mascarenhas, Cátia Oliveira, Miguel Grunho, Carla Adriana Santos, and Jorge Fonseca. 2023. "Nutrition and Outcome of 100 Endoscopic Gastrostomy-Fed Citizens with Severe Dementia" Nutrients 15, no. 12: 2753. https://doi.org/10.3390/nu15122753
APA StyleSousa-Catita, D., Mascarenhas, P., Oliveira, C., Grunho, M., Santos, C. A., & Fonseca, J. (2023). Nutrition and Outcome of 100 Endoscopic Gastrostomy-Fed Citizens with Severe Dementia. Nutrients, 15(12), 2753. https://doi.org/10.3390/nu15122753