
Impact of Intravenous Iron Substitution on Serum Phosphate Levels and Bone Turnover Markers—An Open-Label Pilot Study


Abstract
1. Introduction
2. Materials and Methods
3. Results
4. Discussion
5. Conclusions
Author Contributions
Funding
Institutional Review Board Statement
Informed Consent Statement
Data Availability Statement
Conflicts of Interest
References
- Okada, M.; Imamura, K.; Iida, M.; Fuchigami, T.; Omae, T. Hypophosphatemia induced by intravenous administration of Saccharated iron oxide. Klin. Wochenschr. 1983, 61, 99–102. [Google Scholar] [CrossRef]
- Shimizu, Y.; Tada, Y.; Yamauchi, M.; Okamoto, T.; Suzuki, H.; Ito, N.; Fukumoto, S.; Sugimoto, T.; Fujita, T. Hypophosphatemia induced by intravenous administration of saccharated ferric oxide: Another form of FGF23-related hypophosphatemia. Bone 2009, 45, 814–816. [Google Scholar] [CrossRef]
- Zoller, H.; Schaefer, B.; Glodny, B. Iron-induced hypophosphatemia: An emerging complication. Curr. Opin. Nephrol. Hypertens. 2017, 26, 266–275. [Google Scholar] [CrossRef] [PubMed]
- Bartko, J.; Roschger, P.; Zandieh, S.; Brehm, A.; Zwerina, J.; Klaushofer, K. Hypophosphatemia, Severe Bone Pain, Gait Disturbance, and Fatigue Fractures After Iron Substitution in Inflammatory Bowel Disease. A Case Report. J. Bone Min. Res. 2018, 33, 534–539. [Google Scholar] [CrossRef] [PubMed]
- Koumakis, E.; Cormier, C.; Roux, C.; Briot, K. The Causes of Hypo- and Hyperphosphatemia in Humans. Calcif. Tissue Int. 2021, 108, 41–73. [Google Scholar] [CrossRef] [PubMed]
- Gaasbeek, A.; Meinders, A.E. Hypophosphatemia: An update on its etiology and treatment. Am. J. Med. 2005, 118, 1094–1101. [Google Scholar] [CrossRef]
- Goswami, R. Primer on the metabolic bone diseases and disorders of mineral metabolism. Indian J. Med. Res. 2016, 144, 489–490. [Google Scholar] [CrossRef]
- O’Connor, L.R.; Wheeler, W.S.; Bethune, J.E. Effect of hypophosphatemia on myocardial performance in man. N. Engl. J. Med. 1977, 297, 901–903. [Google Scholar] [CrossRef]
- Shiber, J.R.; Mattu, A. Serum phosphate abnormalities in the emergency department. J. Emerg. Med. 2002, 23, 395–400. [Google Scholar] [CrossRef]
- Ravid, M.; Robson, M. Proximal myopathy caused by latrogenic phosphate depletion. JAMA 1976, 236, 1380–1381. [Google Scholar] [CrossRef]
- Glaspy, J.A.; Lim-Watson, M.Z.; Libre, M.A.; Karkare, S.S.; Hadker, N.; Bajic-Lucas, A.; Strauss, W.E.; Dahl, N.V. Hypophosphatemia Associated with Intravenous Iron Therapies for Iron Deficiency Anemia: A Systematic Literature Review. Ther. Clin. Risk Manag. 2020, 8, 245–259. [Google Scholar] [CrossRef] [PubMed]
- Wolf, M.; White, K.E. Coupling fibroblast growth factor 23 production and cleavage: Iron deficiency, rickets, and kidney disease. Curr. Opin. Nephrol. Hypertens. 2014, 23, 411–419. [Google Scholar] [CrossRef] [PubMed]
- Lorcerie, B.; Audia, S.; Samson, M.; Millière, A.; Falvo, N.; Leguy-Seguin, V.; Berthier, S.; Bonnotte, B. Diagnosis of hyperferritinemia in routine clinical practice. La Presse Médicale 2017, 46, 329–338. [Google Scholar] [CrossRef]
- Lorcerie, B.; Audia, S.; Samson, M.; Millière, A.; Falvo, N.; Leguy-Seguin, V.; Berthier, S.; Bonnotte, B. Diagnosis of an increased serum level of ferritin. La Rev. Med. Interne 2015, 36, 522–529. [Google Scholar] [CrossRef] [PubMed]
- Wang, W.; Knovich, M.A.; Coffman, L.G.; Torti, F.M.; Torti, S.V. Serum ferritin: Past, present and future. BBA 2010, 1800, 760–769. [Google Scholar] [CrossRef]
- Jacobs, A.; Miller, F.; Worwood, M.; Beamish, M.R.; Wardrop, C.A. Ferritin in the serum of normal subjects and patients with iron deficiency and iron overload. Br. Med. J. 1972, 4, 206–208. [Google Scholar] [CrossRef]
- Knovich, M.A.; Storey, J.A.; Coffman, L.G.; Torti, S.V.; Torti, F.M. Ferritin for the clinician. Blood Rev. 2009, 23, 95–104. [Google Scholar] [CrossRef]
- Kratz, A.; Ferraro, M.; Sluss, P.M.; Lewandrowski, K.B. Case records of the Massachusetts General Hospital. Weekly clinicopathological exercises. Laboratory reference values. N. Engl. J. Med. 2004, 351, 1548–1563. [Google Scholar] [CrossRef]
- Guyatt, G.H.; Oxman, A.D.; Ali, M.; Willan, A.; McIlroy, W.; Patterson, C. Laboratory diagnosis of iron-deficiency anemia: An overview. J. Gen. Intern. Med. 1992, 7, 145–153. [Google Scholar] [CrossRef]
- Hallberg, L.; Bengtsson, C.; Lapidus, L.; Lindstedt, G.; Lundberg, P.A.; Hultén, L. Screening for iron deficiency: An analysis based on bone-marrow examinations and serum ferritin determinations in a population sample of women. Br. J. Haematol. 1993, 85, 787–798. [Google Scholar] [CrossRef]
- Darton, T.C.; Blohmke, C.J.; Giannoulatou, E.; Waddington, C.S.; Jones, C.; Sturges, P.; Webster, C.; Drakesmith, H.; Pollard, A.J.; Armitage, A.E. Rapidly Escalating Hepcidin and Associated Serum Iron Starvation Are Features of the Acute Response to Typhoid Infection in Humans. PLoS Negl. Trop. Dis. 2015, 22, e0004029. [Google Scholar] [CrossRef] [PubMed]
- Williams, A.M.; Ladva, C.N.; Leon, J.S.; Ben A Lopman, B.; Tangpricha, V.; Whitehead, R.D.; E Armitage, A.; Wray, K.; Morovat, A.; Pasricha, S.-R.; et al. Changes in micronutrient and inflammation serum biomarker concentrations after a norovirus human challenge. Am. J. Clin. Nutr. 2019, 110, 1456–1464. [Google Scholar] [CrossRef] [PubMed]
- Namaste, S.; Richardson, B.; Ssebiryo, F.; Kantuntu, D.; Vosti, S.; D’Agostino, A. Comparing the effectiveness and cost-effectiveness of facility-versus community-based distribution of micronutrient powders in rural Uganda. Ann. N. Y. Acad. Sci. 2021, 1502, 28–39. [Google Scholar] [CrossRef]
- Greenblatt, M.B.; Tsai, J.N.; Wein, M.N. Bone Turnover Markers in the Diagnosis and Monitoring of Metabolic Bone Disease. Clin. Chem. 2017, 63, 464–474. [Google Scholar] [CrossRef]
- Janckila, A.J.; Yam, L.T. Biology and clinical significance of tartrate-resistant acid phosphatases: New perspectives on an old enzyme. Calcif. Tissue Int. 2009, 85, 465–483. [Google Scholar] [CrossRef] [PubMed]
- Nagy, E.E.; Nagy-Finna, C.; Popoviciu, H.; Kovács, B. Soluble Biomarkers of Osteoporosis and Osteoarthritis, from Pathway Mapping to Clinical Trials: An Update. Clin. Interv. Aging. 2020, 15, 501–518. [Google Scholar] [CrossRef]
- Kim, B.J.; Lee, S.H.; Koh, J.M. Potential Biomarkers to Improve the Prediction of Osteoporotic Fractures. Endocrinol. Metab. 2020, 35, 55–63. [Google Scholar] [CrossRef]
- Mohamed, Y.; Haifa, H.; Datel, O.; Fadoua, H.N.; Smeh, B.H.; Mahbouba, J.; Saoussen, Z.; Bejia, I.; Mongi, T.; Mohamed, F.N.; et al. The role of biochemical markers of bone turnover in the diagnosis of osteoporosis and predicting fracture risk. Tunis Med. 2014, 92, 304–310. [Google Scholar]
- Garnero, P. Biomarkers for osteoporosis management: Utility in diagnosis, fracture risk prediction and therapy monitoring. Mol. Diagn Ther. 2008, 12, 157–170. [Google Scholar] [CrossRef]
- Schaefer, B.; Meindl, E.; Wagner, S.; Tilg, H.; Zoller, H. Intravenous iron supplementation therapy. Mol. Asp. Med. 2020, 75, 100862. [Google Scholar] [CrossRef]
- Wolf, M.; Rubin, J.; Achebe, M.; Econs, M.J.; Peacock, M.; Imel, E.A.; Thomsen, L.L.; Carpenter, T.O.; Weber, T.; Brandenburg, V.; et al. Effects of Iron Isomaltoside vs. Ferric Carboxymaltose on Hypophosphatemia in Iron-Deficiency Anemia: Two Randomized Clinical Trials. JAMA 2020, 323, 432–443. [Google Scholar] [CrossRef] [PubMed]
- Schaefer, B.; Tobiasch, M.; Wagner, S.; Glodny, B.; Tilg, H.; Wolf, M.; Zoller, H. Hypophosphatemia after intravenous iron therapy: Comprehensive review of clinical findings and recommendations for management. Bone 2022, 154, 116202. [Google Scholar] [CrossRef]
- Zoller, H.; Wolf, M.; Blumenstein, I.; Primas, C.; Lindgren, S.; Thomsen, L.L.; Reinisch, W.; Iqbal, T. Hypophosphataemia following ferric derisomaltose and ferric carboxymaltose in patients with iron deficiency anaemia due to inflammatory bowel disease: A randomised clinical trial. Gut 2023, 72, 644–653. [Google Scholar] [CrossRef] [PubMed]
- Fusaro, M.; Holden, R.; Lok, C.; Iervasi, G.; Plebani, M.; Aghi, A.; Gallieni, M.; Cozzolino, M. Phosphate and bone fracture risk in chronic kidney disease patients. Nephrol. Dial. Transplant. 2021, 36, 405–412. [Google Scholar] [CrossRef]
- Block, G.A.; Klassen, P.S.; Lazarus, J.M.; Ofsthun, N.; Lowrie, E.G.; Chertow, G.M. Mineral metabolism, mortality, and morbidity in maintenance hemodialysis. J. Am. Soc. Nephrol. 2004, 15, 2208–2218. [Google Scholar] [CrossRef] [PubMed]
- Campos-Obando, N.; Koek, W.N.H.; Hooker, E.R.; van der Eerden, B.C.; Pols, H.A.; Hofman, A.; van Leeuwen, J.P.; Uitterlinden, A.G.; Nielson, C.M.; Zillikens, M.C. Serum phosphate is as- sociated with fracture risk: The Rotterdam study and MrOS. J. Bone Miner. Res. 2017, 32, 1182–1193. [Google Scholar] [CrossRef]
- Aleksova, J.; Wong, P.; Mulley, W.R.; Choy, K.W.; McLachlan, R.; Ebeling, P.R.; Kerr, P.G.; Milat, F. Serum phosphorus levels and fracture following renal transplantation. Clin. Endocrinol. 2017, 87, 141–148. [Google Scholar] [CrossRef]
- Schaefer, B.; Zoller, H.; Wolf, M. Risk Factors for and Effects of Persistent and Severe Hypophosphatemia Following Ferric Carboxymaltose. J. Clin. Endocrinol. Metab. 2022, 107, 1009–1919. [Google Scholar] [CrossRef]
- Holick, M.F. Vitamin D deficiency. N. Engl. J. Med. 2007, 357, 266–281. [Google Scholar] [CrossRef]
- Yao, P.; Sun, L.; Lu, L.; Ding, H.; Chen, X.; Tang, L.; Xu, X.; Liu, G.; Hu, Y.; Ma, Y.; et al. Effects of genetic and non genetic factors on total and bioavailable 25(OH)D responses to vitamin D supplementation. J. Clin. Endocrinol. Metab. 2017, 102, 100–110. [Google Scholar] [CrossRef]
- Ross, A.C.; Manson, J.E.; Abrams, S.A.; Aloia, J.F.; Brannon, P.M.; Clinton, S.K.; Durazo-Arvizu, R.A.; Gallagher, J.C.; Gallo, R.L.; Jones, G.; et al. The 2011 report on dietary reference intakes for calcium and vitamin D from the Institute of Medicine: What clinicians need to know. J. Clin. Endocrinol. Metab. 2011, 96, 53–58. [Google Scholar] [CrossRef] [PubMed]
- Yao, P.; Lu, L.; Hu, Y.; Liu, G.; Chen, X.; Sun, L.; Ye, X.; Zheng, H.; Chen, Y.; Hu, F.B.; et al. A dose-response study of vitamin D3 supplementation in healthy Chinese: A 5-arm randomized, placebo-controlled trial. Eur. J. Nutr. 2016, 55, 383–392. [Google Scholar] [CrossRef] [PubMed]
- Feng, Y.; Cheng, G.; Wang, H.; Chen, B. The associations between serum 25-hydroxyvitamin D level and the risk of total fracture and hip fracture. Osteoporos. Int. 2017, 28, 1641–1652. [Google Scholar] [CrossRef] [PubMed]
- Bischof-Ferrari, H.; Willett, W.; Wong, J.; Giovannucci, E.; Dietrich, T.; Dawson-Hughes, B. Fracture prevention with vitamin D supplementation: A meta-analysis of randomized controlled trials. JAMA 2005, 293, 257–2264. [Google Scholar] [CrossRef]
- Bischoff-Ferrari, H.A.; Willett, W.C.; Orav, E.J.; Lips, P.; Meunier, P.J.; Lyons, R.A.; Flicker, L.; Wark, J.; Jackson, R.D.; Cauley, J.A.; et al. A pooled analysis of vitamin D dose requirements for fracture prevention. N. Engl. J. Med. 2012, 367, 40–49. [Google Scholar] [CrossRef]
- Gorter, E.; Hamdy, N.; Appelman-Dijkstra, N.; Schipper, I. The role of vitamin D in human fracture healing: A systematic review of the literature. Bone. 2014, 64, 288–297. [Google Scholar] [CrossRef]
- Sprague, S.; Petrisor, B.; Scott, T.; Devji, T.; Phillips, M.; Spurr, H.; Bhandari, M.; Slobogean, G.P. What is the role of vitamin D supplementation in acute fracture patients? A systematic review and meta-analysis of the prevalence of hypovitaminosis D and supplementation efficacy. J. Orthop. Traumatol. 2016, 30, 53–63. [Google Scholar] [CrossRef]


| Ferric Carboxymaltose | Iron Sucrose | p-Value | |
|---|---|---|---|
| Age | 48 [34;57] | 63 [46;72] | 0.558 |
| Gender (female/male) | 5/3 | 6/4 | 0.999 |
| Height (cm) | 167 [163;172] | 167 [163;181] | 0.552 |
| Weight (kg) | 67 [49;74] | 72 [38;87] | 0.852 |
| BMI (kg/m2) | 21.7 [18.7;26.8] | 23.2 [14.5;29.9] | 0.883 |
| Phosphate (0.60–1.55 mmol/L) | 0.99 [0.79;1.30] | 1.07 [0.94;1.24] | 0.848 |
| Calcium (2.10–2.58 mmol/L) | 2.13 [2.07;2.26] | 2.14 [2.02;2.20] | 0.609 |
| 25(OH)D (20–70 ng/mL) | 37.00 [25.50;47.60] | 18.80 [13.60;24.95] | 0.051 |
| iPTH (15–65 pg/mL) | 28.40 [20.90;53.50] | 47.00 [38.60;53.10] | 0.200 |
| P1NP (15–59 µg/L) | 45.76 [43.68;71.00] | 82.61 [54.39;91.45] | 0.505 |
| CTX (<0.57 ng/mL) | 0.36 [0.26;0.40] | 0.57 [0.39;1.05] | 0.152 |
| Hb (12–16 g/dL) | 10.80 [9.20;11.50] | 9.65 [8.78;11.80] | 0.817 |
| Iron (37–145 µg/dL) | 88.50 [38.30;369.00] | 43.00 [28.50;74.00] | 0.336 |
| Ferritin (5–204 ng/mL) | 50.00 [28.25;211.25] | 30.00 [10.50;141.50] | 0.417 |
| Transferrin (200–360 mg/dL) | 311.00 [233.00;312.00] | 242.50 [204.25;292.00] | 0.553 |
| Ferric Carboxymaltose | Iron Sucrose | p-Value | |
|---|---|---|---|
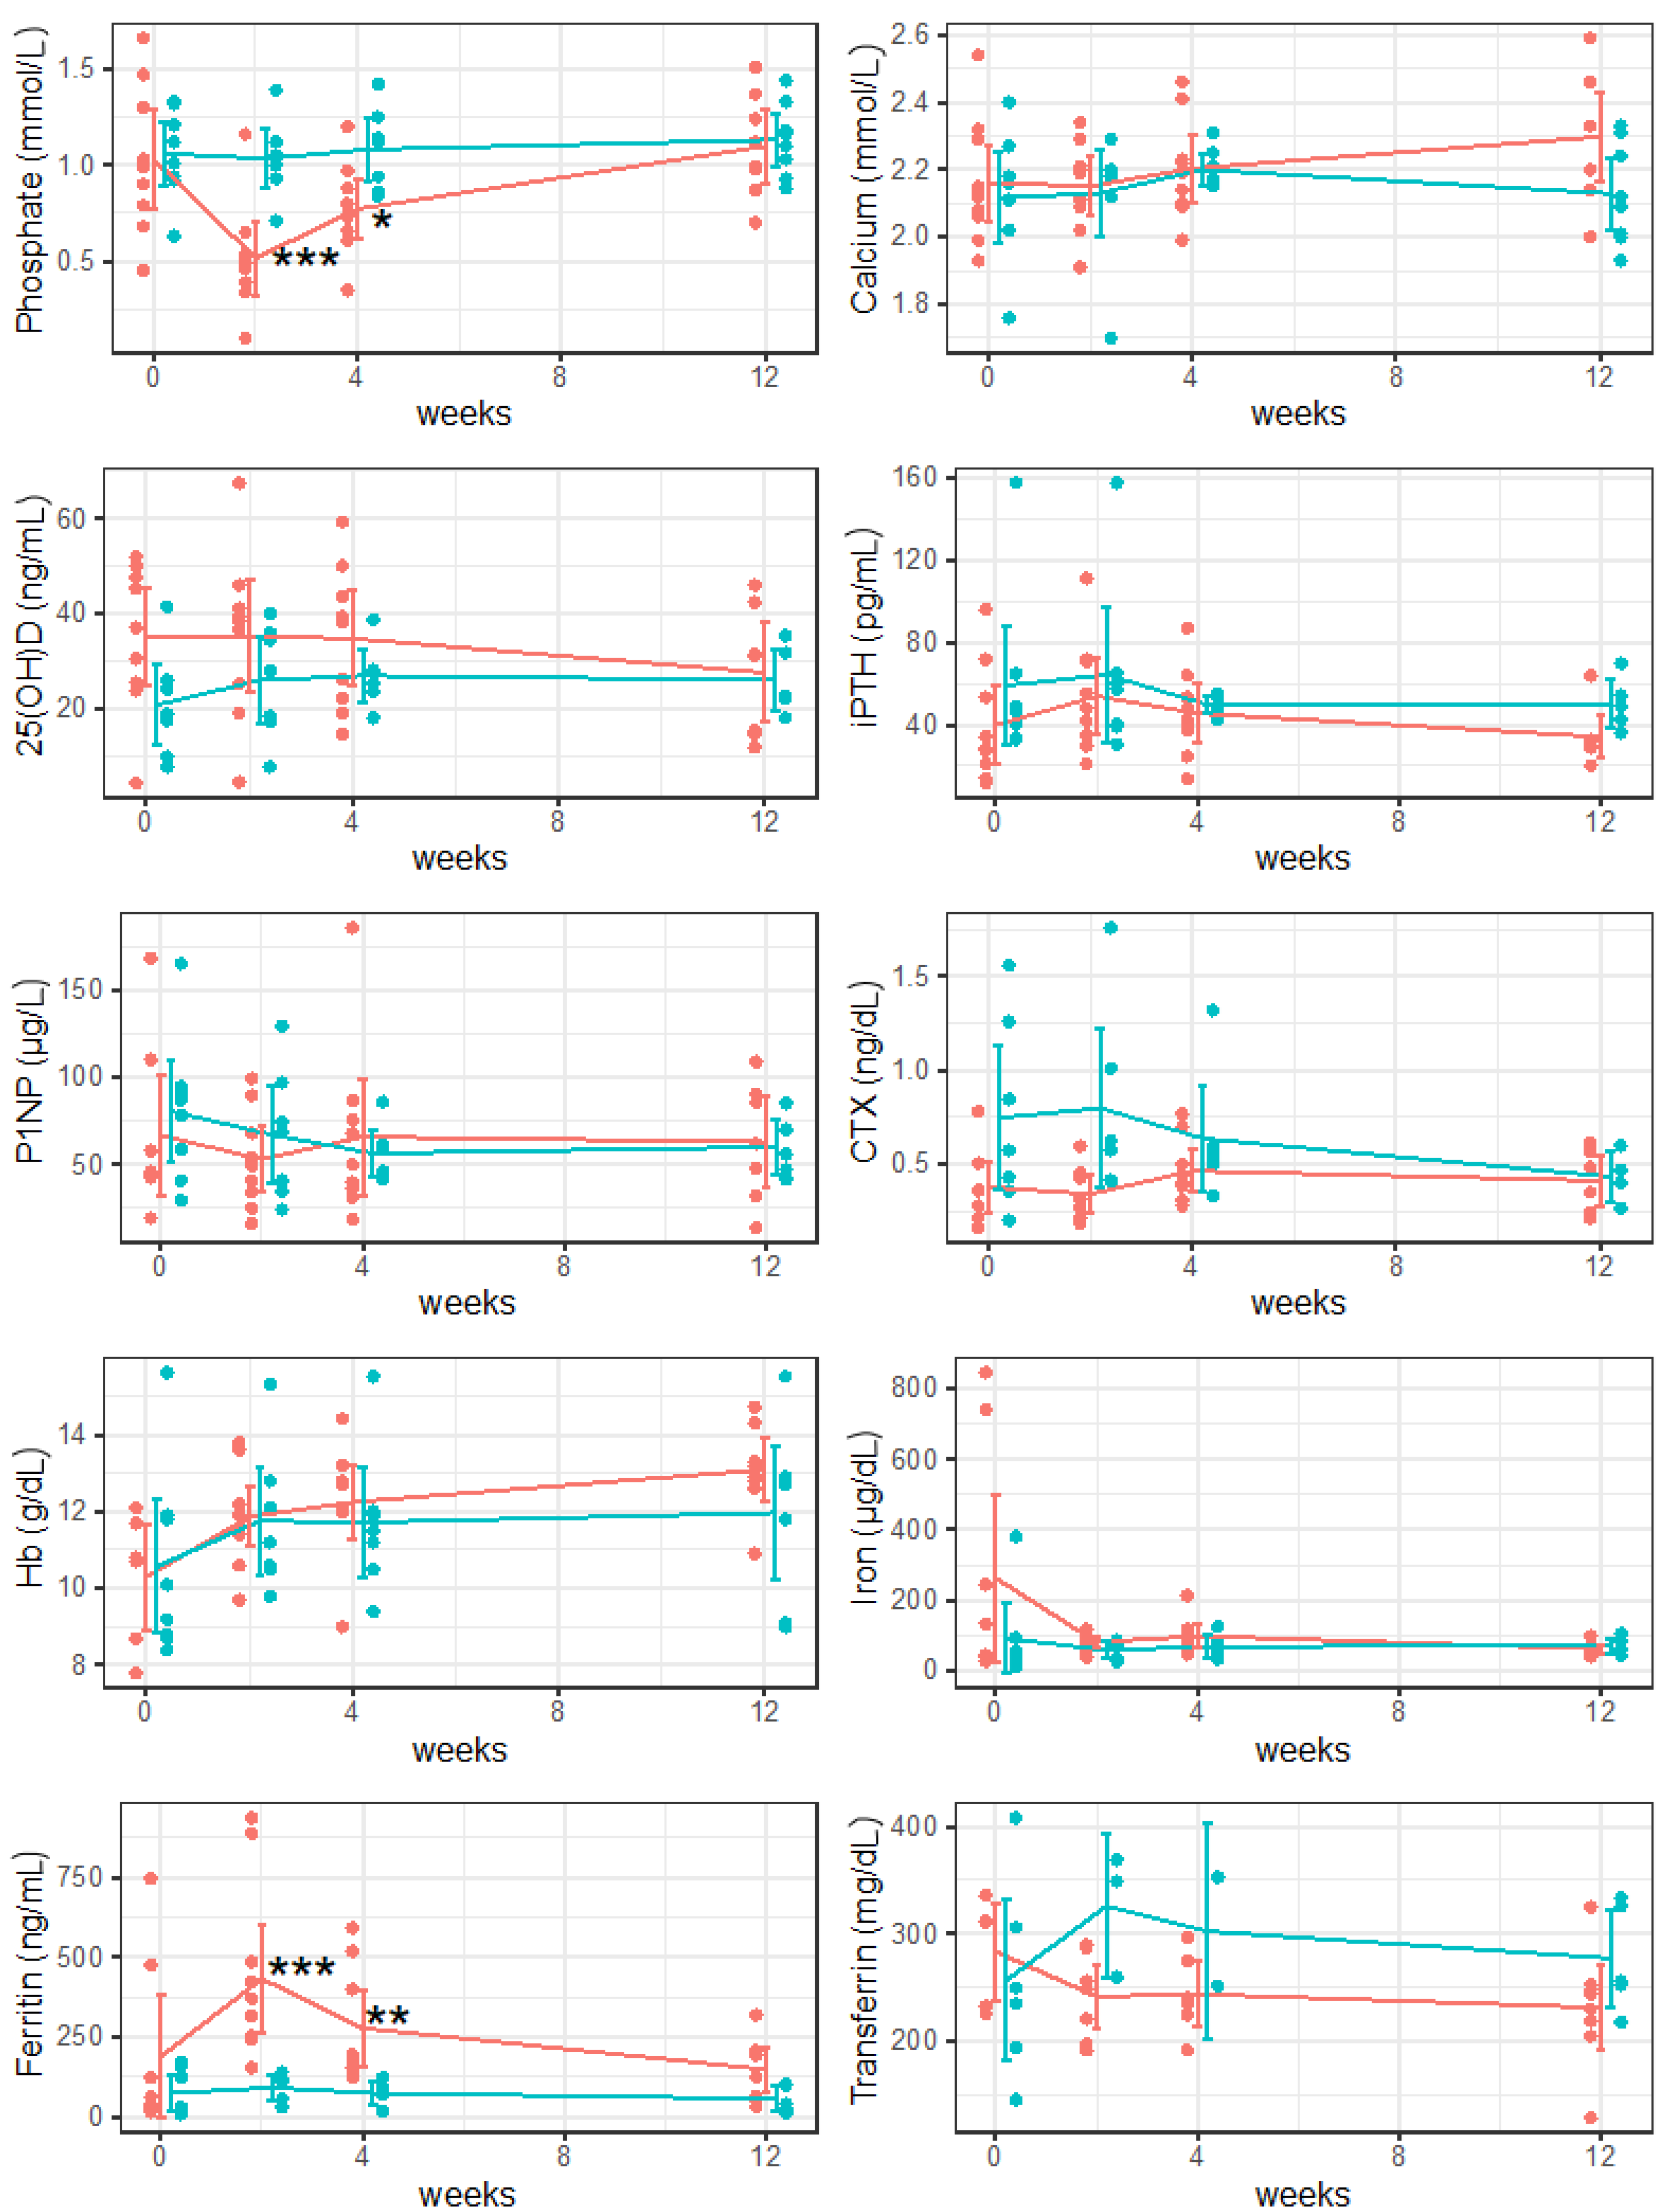
| Phosphate (0.60–1.55 mmol/L) | |||
| 2 weeks | 0.50 [0.44;0.57] | 1.04 [0.97;1.09] | <0.001 |
| 4 weeks | 0.74 [0.66;0.88] | 1.12 [0.90;1.12] | 0.043 |
| 12 weeks | 1.06 [0.95;1.27] | 1.13 [1.01;1.22] | 0.725 |
| Calcium (2.10–2.58 mmol/L) | |||
| 2 weeks | 2.19 [2.09;2.21] | 2.18 [2.17;2.19] | 0.908 |
| 4 weeks | 2.19 [2.10;2.23] | 2.17 [2.16;2.23] | 0.957 |
| 12 weeks | 2.33 [2.19; 2.36] | 2.11 [2;20.26] | 0.1 |
| 25(OH)D (20–70 ng/mL) | |||
| 2 weeks | 38.50 [25.20;41.00] | 28.00 [17.80;35.15] | 0.987 |
| 4 weeks | 38.20 [22.10;43.50] | 26.55 [23.95;27.95] | 0.942 |
| 12 weeks | 31.10 [15.00;36.90] | 22.70 [22.10;31.70] | 0.57 |
| iPTH (15–65 pg/mL) | |||
| 2 weeks | 48.00 [35.20;70.80] | 57.40 [39.75;62.75] | 0.516 |
| 4 weeks | 42.10 [37.20;53.40] | 50.85 [45.40;53.53] | 0.578 |
| 12 weeks | 31.40 [29.40;32.30] | 49.00 [42.60;54.40] | 0.075 |
| P1NP (15–59 µg/L) | |||
| 2 weeks | 49.55 [34.55;68.12] | 68.71 [37.93;85.80] | 0.859 |
| 4 weeks | 50.20 [36.46;75.81] | 53.12 [44.20;61.02] | 0.218 |
| 12 weeks | 61.93 [40.17;88.00] | 56.16 [47.46;70.00] | 0.618 |
| CTX (<0.57 ng/mL) | |||
| 2 weeks | 0.29 [0.25;0.43] | 0.60 [0.45;0.91] | 0.199 |
| 4 weeks | 0.40 [0.38;0.50] | 0.54 [0.50;0.58] | 0.717 |
| 12 weeks | 0.41 [0.27;0.55] | 0.43 [0.36;0.60] | 0.824 |
| Hb (12–16 g/dL) | |||
| 2 weeks | 11.90 [11.45;12.12] | 11.20 [10.55;12.45] | 0.85 |
| 4 weeks | 12.10 [12.00;12.80] | 11.50 [10.90;12.00] | 0.13 |
| 12 weeks | 13.10 [12.80;13.60] | 12.70 [10.50;12.90] | 0.073 |
| Iron (37–145 µg/dL) | |||
| 2 weeks | 80.00 [59.80;101.00] | 68.00 [36.00;78.00] | 0.342 |
| 4 weeks | 89.00 [66.00;115.00] | 60.00 [44.00;80.00] | 0.273 |
| 12 weeks | 61.00 [49.00;66.50] | 60.00 [58.00;85.00] | 0.770 |
| Ferritin (5–204 ng/mL) | |||
| 2 weeks | 344.50 [252.50;471.00] | 111.00 [55.00;119.00] | <0.001 |
| 4 weeks | 191.00 [154.00;401.00] | 71.00 [70.00;89.00] | 0.009 |
| 12 weeks | 159.00 [61.00;200.25] | 41.00 [25.00;100.00] | 0.109 |
| Transferrin (200–360 mg/dL) | |||
| 2 weeks | 249.00 [209.50;271.50] | 349.00 [304.50;359.00] | 0.326 |
| 4 weeks | 238.00 [227.50;266.50] | 302.50 [277.25;327.75] | 0.831 |
| 12 weeks | 237.00 [215.50;249.25] | 256.00 [253.00;326.00] | 0.324 |
Disclaimer/Publisher’s Note: The statements, opinions and data contained in all publications are solely those of the individual author(s) and contributor(s) and not of MDPI and/or the editor(s). MDPI and/or the editor(s) disclaim responsibility for any injury to people or property resulting from any ideas, methods, instructions or products referred to in the content. |
© 2023 by the authors. Licensee MDPI, Basel, Switzerland. This article is an open access article distributed under the terms and conditions of the Creative Commons Attribution (CC BY) license (https://creativecommons.org/licenses/by/4.0/).
Share and Cite
Struppe, A.; Schanda, J.E.; Baierl, A.; Watzl, P.; Muschitz, C. Impact of Intravenous Iron Substitution on Serum Phosphate Levels and Bone Turnover Markers—An Open-Label Pilot Study. Nutrients 2023, 15, 2693. https://doi.org/10.3390/nu15122693
Struppe A, Schanda JE, Baierl A, Watzl P, Muschitz C. Impact of Intravenous Iron Substitution on Serum Phosphate Levels and Bone Turnover Markers—An Open-Label Pilot Study. Nutrients. 2023; 15(12):2693. https://doi.org/10.3390/nu15122693
Chicago/Turabian StyleStruppe, Alexandra, Jakob E. Schanda, Andreas Baierl, Paul Watzl, and Christian Muschitz. 2023. "Impact of Intravenous Iron Substitution on Serum Phosphate Levels and Bone Turnover Markers—An Open-Label Pilot Study" Nutrients 15, no. 12: 2693. https://doi.org/10.3390/nu15122693
APA StyleStruppe, A., Schanda, J. E., Baierl, A., Watzl, P., & Muschitz, C. (2023). Impact of Intravenous Iron Substitution on Serum Phosphate Levels and Bone Turnover Markers—An Open-Label Pilot Study. Nutrients, 15(12), 2693. https://doi.org/10.3390/nu15122693