

Association of Spinal Alignment and Abdominal Circumference with Sarcopenia Status and Fall Risk in Patients with Osteoporosis: A Retrospective Study

 , ,
, ,
Abstract
1. Introduction
2. Materials and Methods
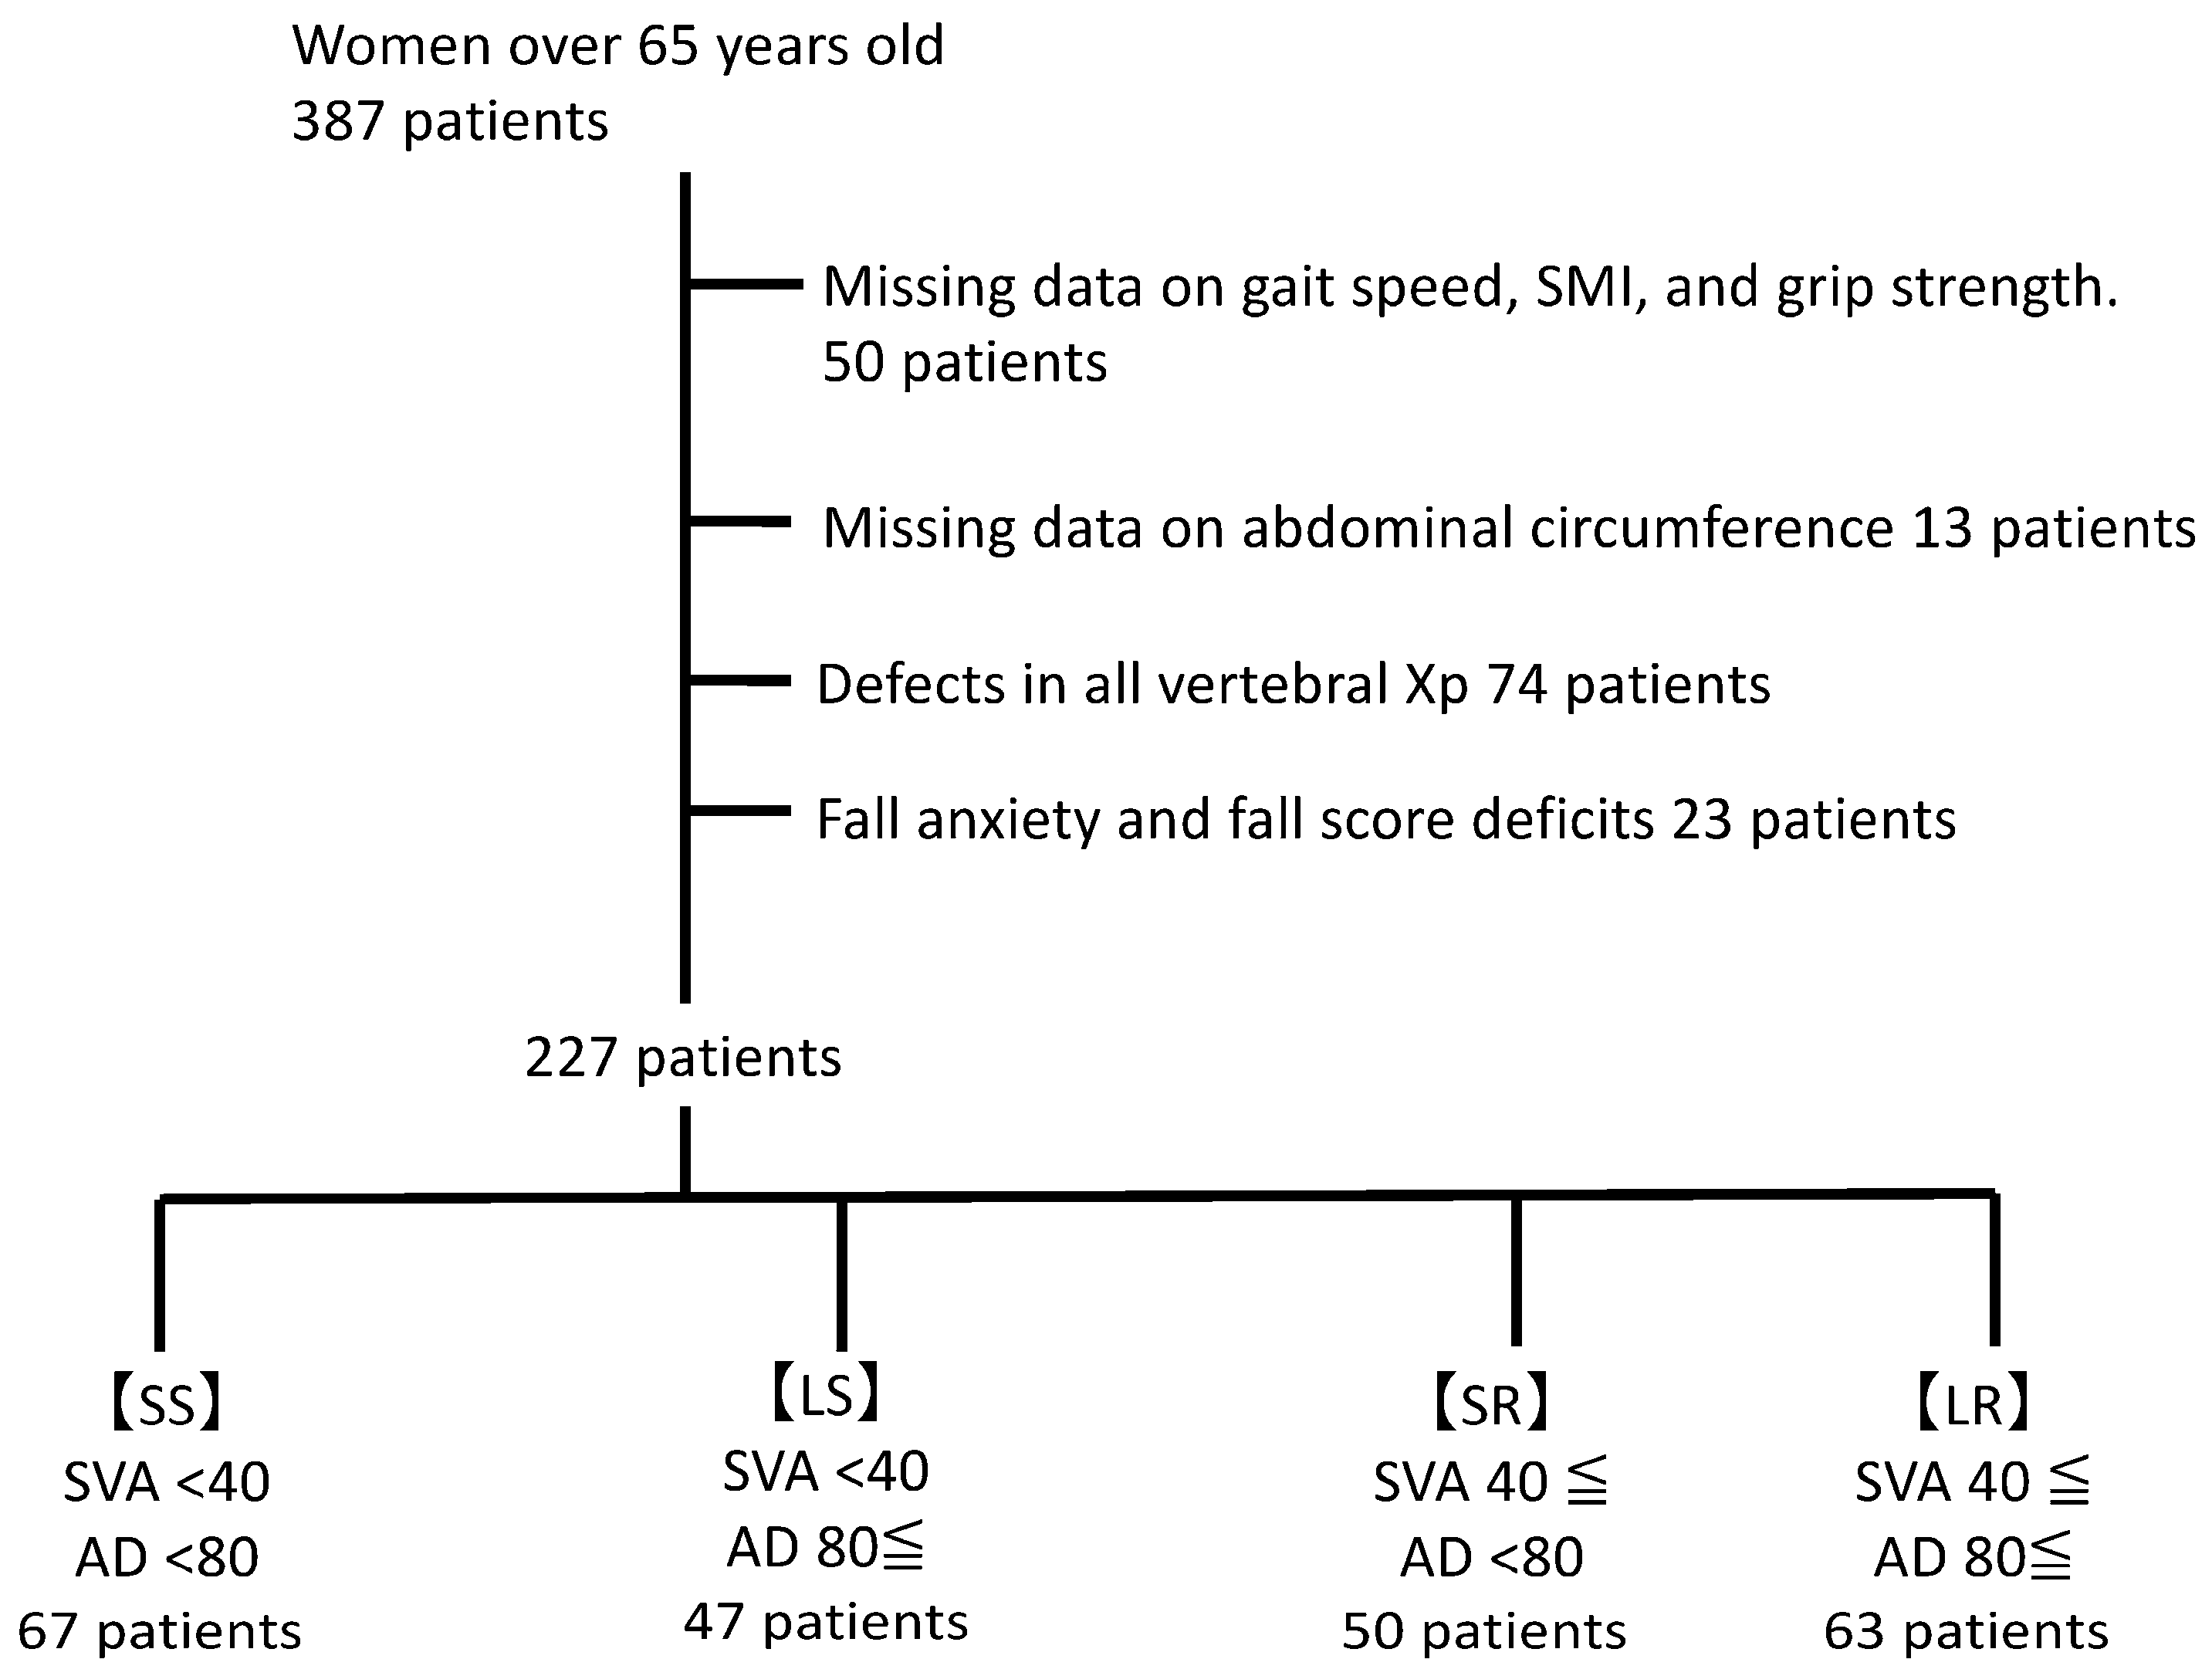
2.1. Patients
2.2. Study Design
2.3. Evaluation of Hand Grip Strength
2.4. Assessment of Fall Risk
2.5. Sarcopenia
2.6. Patient Groups
2.7. Data Analysis and Statistical Methods
2.8. Number of Samples Required
3. Results
3.1. Baseline Patient Characteristics and Group Allocation
3.2. Between-Group Comparisons
3.2.1. Participant Numbers
3.2.2. Body Composition
SMI
Trunk Fat
3.2.3. HbA1c
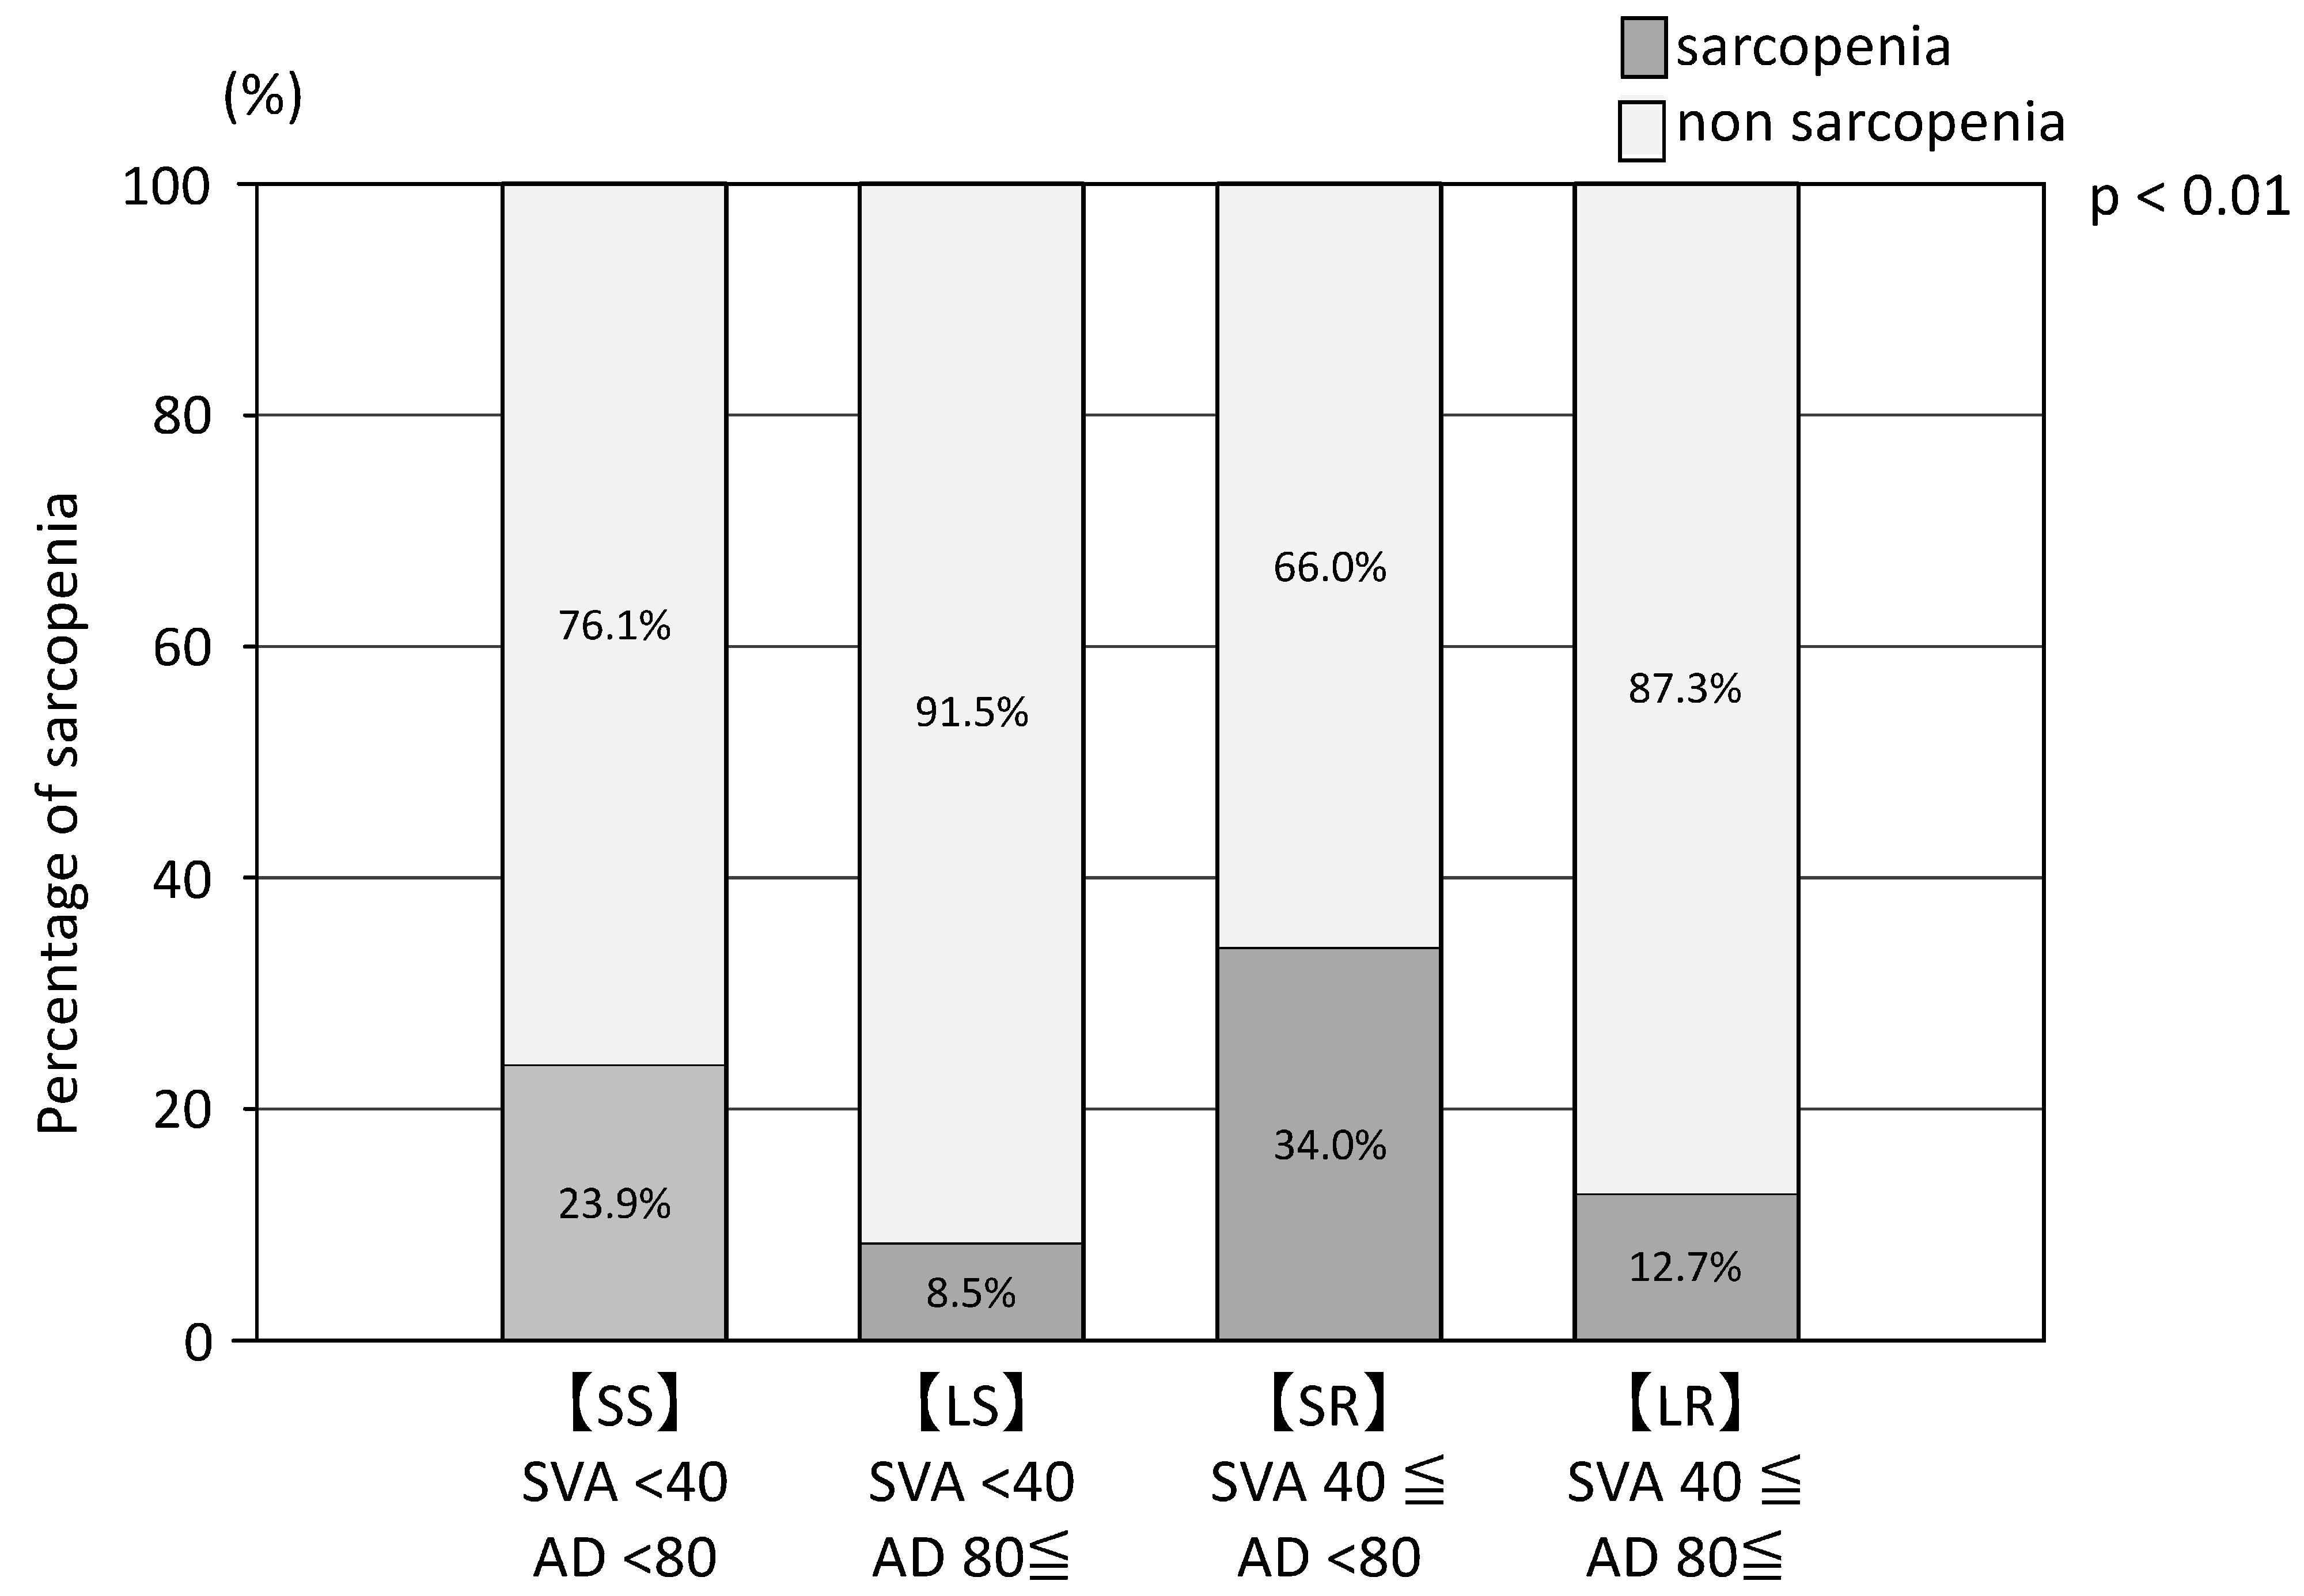
3.2.4. Sarcopenia
3.2.5. Bone Mineral Density
3.2.6. CONUT
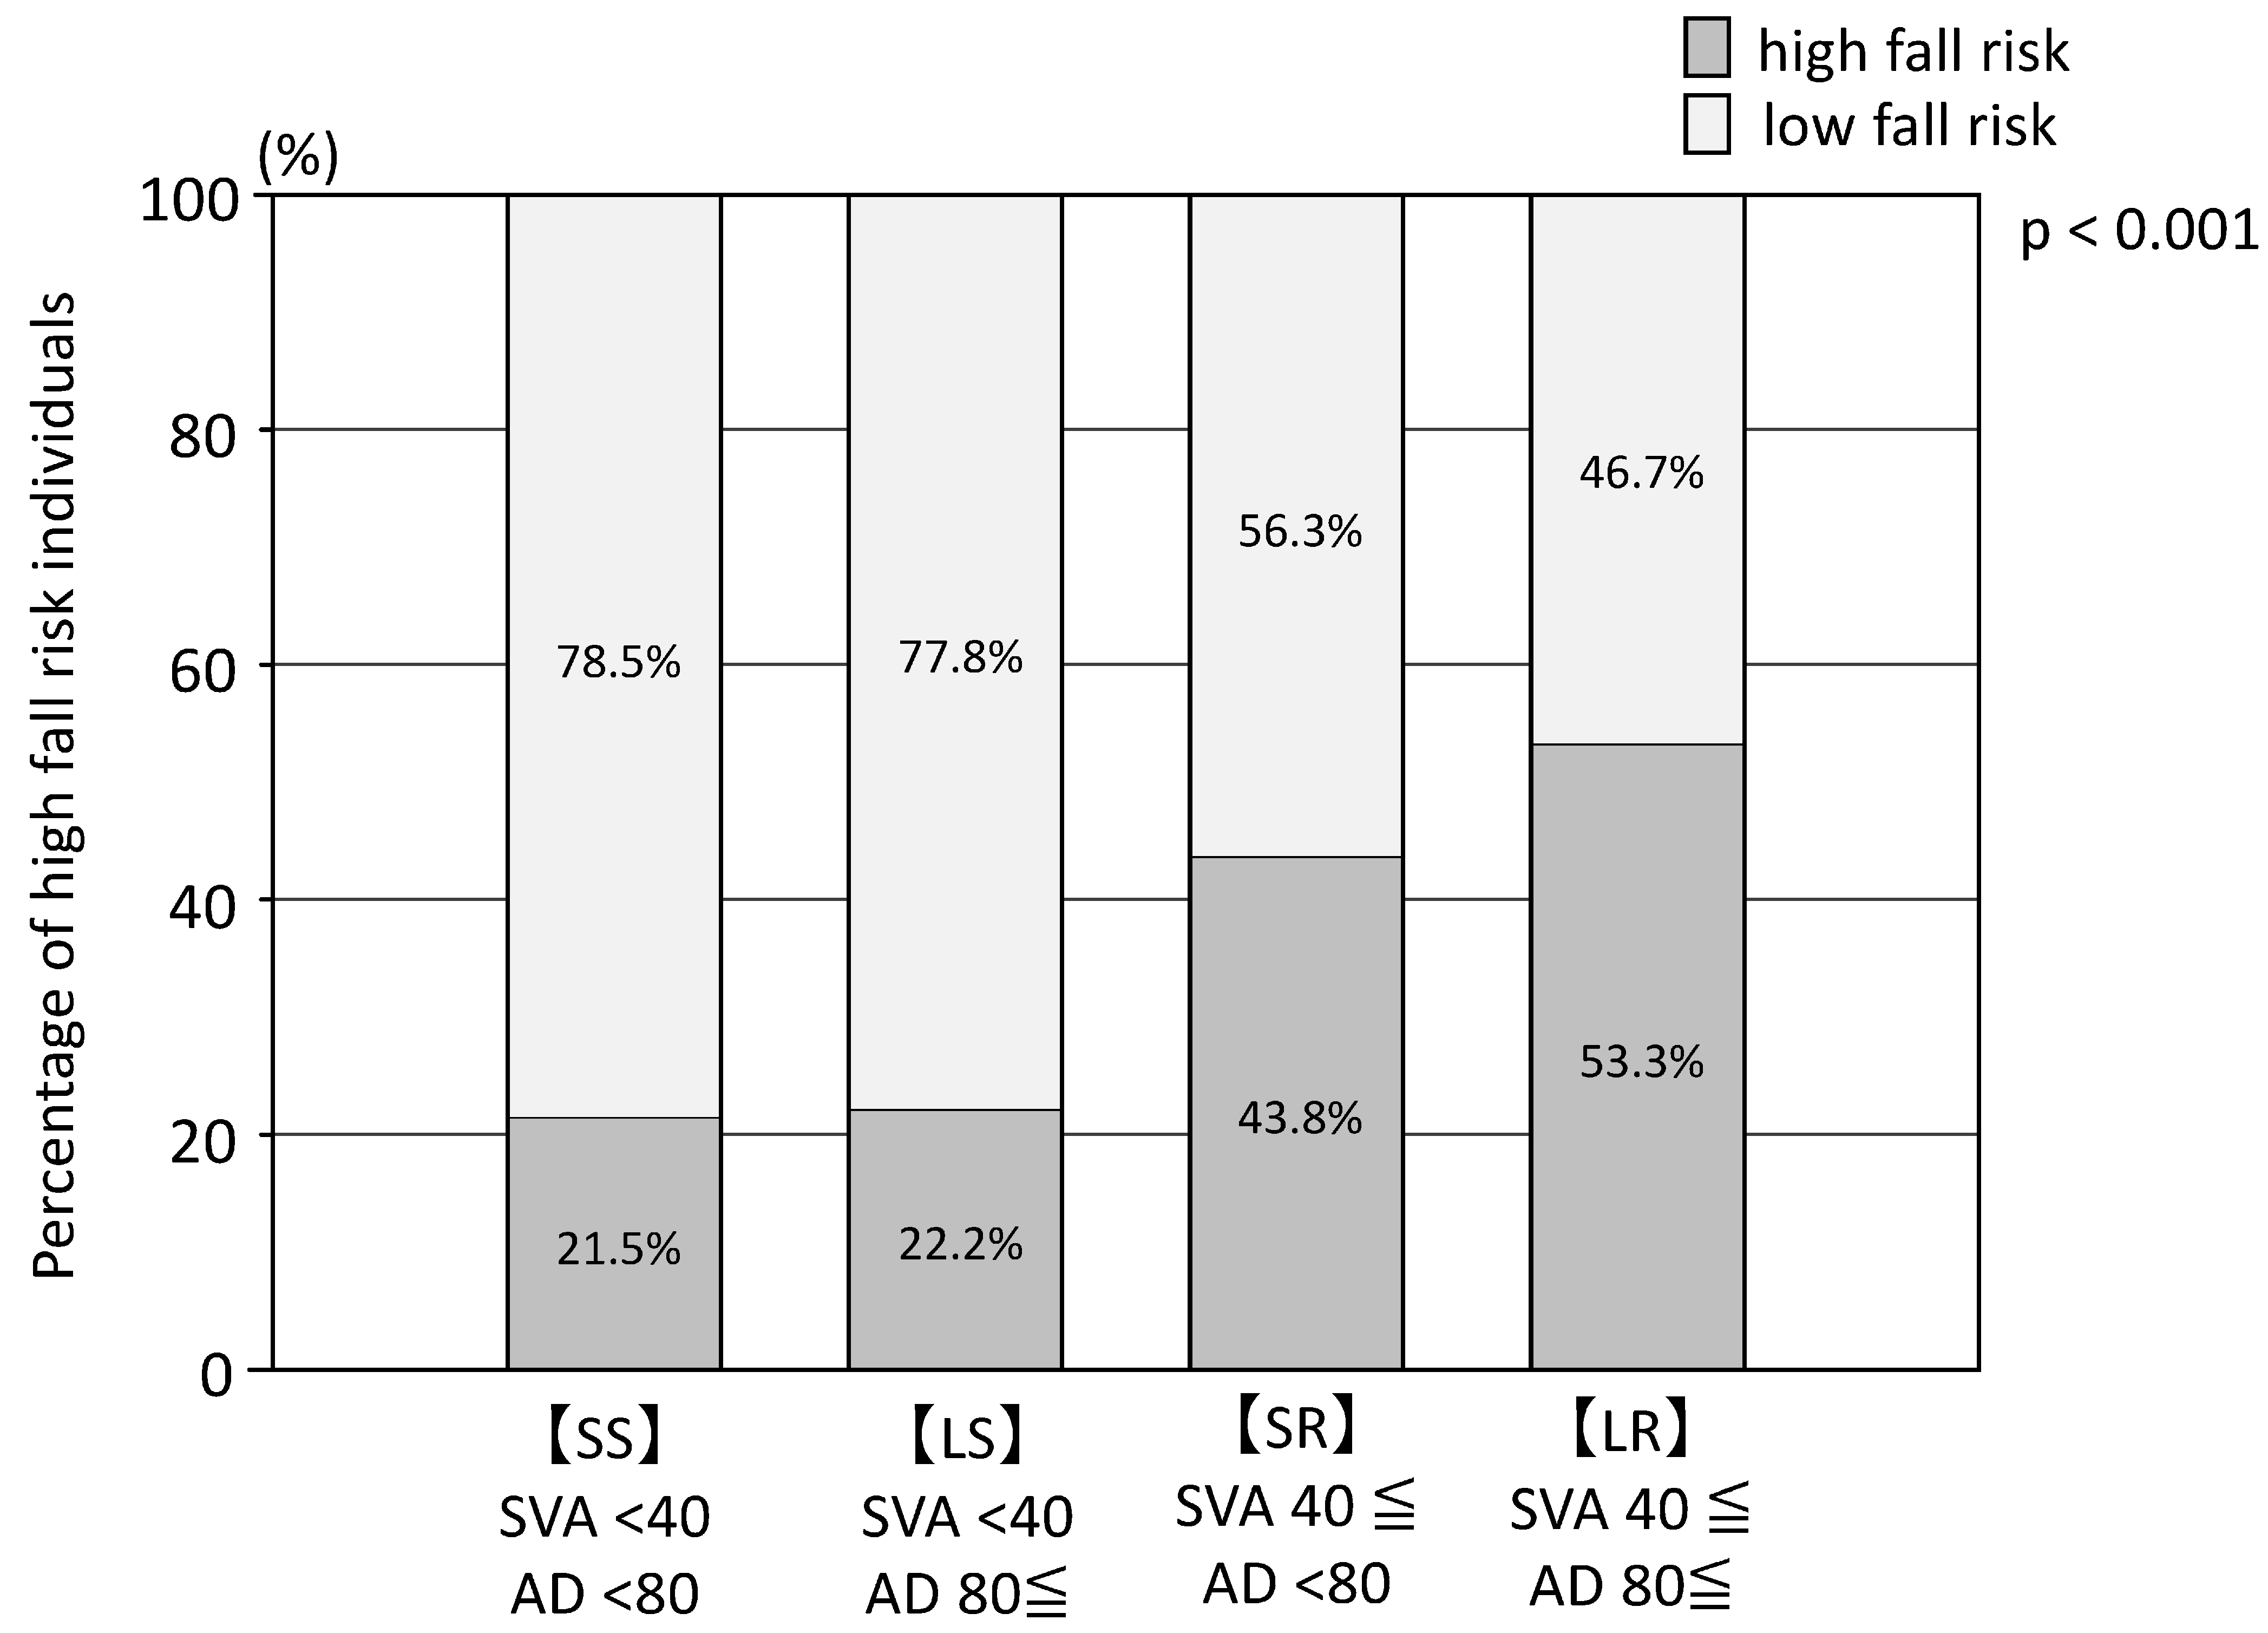
3.2.7. Fall Score and Fall Anxiety
3.3. Fall Risk Factors
4. Discussion
5. Conclusions
Author Contributions
Funding
Institutional Review Board Statement
Informed Consent Statement
Data Availability Statement
Acknowledgments
Conflicts of Interest
References
- Salari, N.; Ghasemi, H.; Mohammadi, L.; Behzadi, M.H.; Rabieenia, E.; Shohaimi, S.; Mohammadi, M. The global prevalence of osteoporosis in the world: A comprehensive systematic review and meta-analysis. J. Orthop. Surg. Res. 2021, 16, 609. [Google Scholar] [CrossRef]
- Inoue, T.; Maeda, K.; Satake, S.; Matsui, Y.; Arai, H. Osteosarcopenia, the co-existence of osteoporosis and sarcopenia, is associated with social frailty in older adults. Aging Clin. Exp. Res. 2022, 34, 535–543. [Google Scholar] [CrossRef] [PubMed]
- Inoue, T.; Maeda, K.; Nagano, A.; Shimizu, A.; Ueshima, J.; Murotani, K.; Sato, K.; Hotta, K.; Morishita, S.; Tsubaki, A. Related Factors and Clinical Outcomes of Osteosarcopenia: A Narrative Review. Nutrients 2021, 13, 291. [Google Scholar] [CrossRef]
- Forni, C.; D’Alessandro, F.; Gallerani, P.; Genco, R.; Bolzon, A.; Bombino, C.; Mini, S.; Rocchegiani, L.; Notarnicola, T.; Vitulli, A.; et al. Effectiveness of using a new polyurethane foam multi-layer dressing in the sacral area to prevent the onset of pressure ulcer in the elderly with hip fractures: A pragmatic randomised controlled trial. Int. Wound J. 2018, 15, 383–390. [Google Scholar] [CrossRef]
- Zhou, J.; Liu, B.; Qin, M.Z.; Liu, J.P. Fall Prevention and Anti-Osteoporosis in Osteopenia Patients of 80 Years of Age and Older: A Randomized Controlled Study. Orthop. Surg. 2020, 12, 890–899. [Google Scholar] [CrossRef] [PubMed]
- Distefano, G.; Goodpaster, B.H. Effects of Exercise and Aging on Skeletal Muscle. Cold Spring Harb. Perspect. Med. 2018, 8, a029785. [Google Scholar] [CrossRef] [PubMed]
- Paintin, J.; Cooper, C.; Dennison, E. Osteosarcopenia. Br. J. Hosp. Med. 2018, 79, 253–258. [Google Scholar] [CrossRef]
- Cruz-Jentoft, A.J.; Baeyens, J.P.; Bauer, J.M.; Boirie, Y.; Cederholm, T.; Landi, F.; Martin, F.C.; Michel, J.P.; Rolland, Y.; Schneider, S.M.; et al. Sarcopenia: European consensus on definition and diagnosis: Report of the European Working Group on Sarcopenia in Older People. Age Ageing 2010, 39, 412–423. [Google Scholar] [CrossRef]
- Kim, H.; Hirano, H.; Edahiro, A.; Ohara, Y.; Watanabe, Y.; Kojima, N.; Kim, M.; Hosoi, E.; Yoshida, Y.; Yoshida, H.; et al. Sarcopenia: Prevalence and associated factors based on different suggested definitions in community-dwelling older adults. Geriatr. Gerontol. Int. 2016, 16 (Suppl. 1), 110–122. [Google Scholar] [CrossRef]
- Ito, H.; Toyone, T.; Nagai, T.; Ishikawa, K.; Kuroda, T.; Inagaki, K. Relationship between Muscle Mass of the Lower Limbs and Falls Caused by Spinal Misalignment in Women Aged 70 Years: A Retrospective Study. Clin. Spine Surg. 2021, 34, E19–E25. [Google Scholar] [CrossRef]
- Verhaegen, J.C.F.; Innmann, M.; Batista, N.A.; Dion, C.A.; Horton, I.; Pierrepont, J.; Merle, C.; Grammatopoulos, G. Defining “Normal” Static and Dynamic Spinopelvic Characteristics: A Cross-Sectional Study. JBJS Open Access 2022, 7, e22.00007. [Google Scholar] [CrossRef]
- Araújo, F.; Lucas, R.; Alegrete, N.; Azevedo, A.; Barros, H. Individual and contextual characteristics as determinants of sagittal standing posture: A population-based study of adults. Spine J. 2014, 14, 2373–2383. [Google Scholar] [CrossRef] [PubMed]
- Roussouly, P.; Pinheiro-Franco, J.L. Biomechanical analysis of the spino-pelvic organization and adaptation in pathology. Eur. Spine J. 2011, 20 (Suppl. 5), 609–618. [Google Scholar] [CrossRef]
- Schwab, F.; Ungar, B.; Blondel, B.; Buchowski, J.; Coe, J.; Deinlein, D.; DeWald, C.; Mehdian, H.; Shaffrey, C.; Tribus, C.; et al. Scoliosis Research Society-Schwab adult spinal deformity classification: A validation study. Spine 2012, 37, 1077–1082. [Google Scholar] [CrossRef]
- Fava, M.C.; Agius, R.; Fava, S. Obesity and cardio-metabolic health. Br. J. Hosp. Med. 2019, 80, 466–471. [Google Scholar] [CrossRef]
- Mendrick, D.L.; Diehl, A.M.; Topor, L.S.; Dietert, R.R.; Will, Y.; La Merrill, M.A.; Bouret, S.; Varma, V.; Hastings, K.L.; Schug, T.T.; et al. Metabolic Syndrome and Associated Diseases: From the Bench to the Clinic. Toxicol. Sci. 2018, 162, 36–42. [Google Scholar] [CrossRef]
- Guo, C.; Xu, S.; Liang, Y.; Meng, F.; Zhu, Z.; Liu, H. Abdominal changes in patients with degenerative spinal deformity. Medicine 2021, 100, e26851. [Google Scholar] [CrossRef]
- Máximo, R.O.; Santos, J.L.F.; Perracini, M.R.; Oliveira, C.; Duarte, Y.A.O.; Alexandre, T.D.S. Abdominal obesity, dynapenia and dynapenic-abdominal obesity as factors associated with falls. Braz. J. Phys. Ther. 2019, 23, 497–505. [Google Scholar] [CrossRef]
- Okamura, H.; Ishikawa, K.; Kudo, Y.; Matsuoka, A.; Maruyama, H.; Emori, H.; Yamamura, R.; Hayakawa, C.; Tani, S.; Tsuchiya, K.; et al. Risk factors predicting osteosarcopenia in postmenopausal women with osteoporosis: A retrospective study. PLoS ONE 2020, 15, e0237454. [Google Scholar] [CrossRef]
- Nagai, T.; Okano, I.; Ishikawa, K.; Kuroda, T.; Oshita, Y.; Tsuchiya, K.; Tani, S.; Okamura, H.; Sakamoto, K.; Inagaki, K. The serum 25(OH)D level and hand grip strength for fall risk assessment among osteoporotic elderly Japanese women. Arch. Osteoporos. 2021, 16, 42. [Google Scholar] [CrossRef]
- Okochi, J.; Toba, K.; Takahashi, T.; Matsubayashi, K.; Nishinaga, M.; Takahashi, R.; Ohrui, T. Simple screening test for risk of falls in the elderly. Geriatr. Gerontol. Int. 2006, 6, 223–227. [Google Scholar] [CrossRef]
- Okochi, J. Development of a simple fall screening method. Geriatr. Med. 2009, 47, 685–688. (In Japanese) [Google Scholar]
- Sri-On, J.; Fusakul, Y.; Kredarunsooksree, T.; Paksopis, T.; Ruangsiri, R. The prevalence and risk factors of sarcopenia among Thai community-dwelling older adults as defined by the Asian Working Group for Sarcopenia (AWGS-2019) criteria: A cross-sectional study. BMC Geriatr. 2022, 22, 786. [Google Scholar] [CrossRef]
- De Ulíbarri, J.I.; González-Madroño, A.; de Villar, N.G.; González, P.; González, B.; Mancha, A.; Rodríguez, F.; Fernández, G. CONUT: A tool for controlling nutritional status. First validation in a hospital population. Nutr. Hosp. 2005, 20, 38–45. [Google Scholar]
- Kroc, Ł.; Fife, E.; Piechocka-Wochniak, E.; Sołtysik, B.; Kostka, T. Comparison of Nutrition Risk Screening 2002 and Subjective Global Assessment Form as Short Nutrition Assessment Tools in Older Hospitalized Adults. Nutrients 2021, 13, 225. [Google Scholar] [CrossRef] [PubMed]
- Watanabe, T.; Kobayashi, S.; Yamaguchi, T.; Hibi, M.; Fukuhara, I.; Osaki, N. Coffee Abundant in Chlorogenic Acids Reduces Abdominal Fat in Overweight Adults: A Randomized, Double-Blind, Controlled Trial. Nutrients 2019, 11, 1617. [Google Scholar] [CrossRef] [PubMed]
- Eguchi, Y.; Suzuki, M.; Yamanaka, H.; Tamai, H.; Kobayashi, T.; Orita, S.; Yamauchi, K.; Suzuki, M.; Inage, K.; Fujimoto, K.; et al. Associations between sarcopenia and degenerative lumbar scoliosis in older women. Scoliosis Spinal Disord. 2017, 12, 9. [Google Scholar] [CrossRef]
- Examination Committee of Criteria for ‘Obesity Disease’ in Japan; Japan Society for the Study of Obesity. New criteria for ‘obesity disease’ in Japan. Circ. J. 2002, 66, 987–992. [Google Scholar] [CrossRef]
- Dagan, S.S.; Segev, S.; Novikov, I.; Dankner, R. Waist circumference vs body mass index in association with cardiorespiratory fitness in healthy men and women: A cross sectional analysis of 403 subjects. Nutr. J. 2013, 12, 12. [Google Scholar] [CrossRef]
- Bibiloni, M.D.M.; Karam, J.; Bouzas, C.; Aparicio-Ugarriza, R.; Pedrero-Chamizo, R.; Sureda, A.; González-Gross, M.; Tur, J.A. Association between Physical Condition and Body Composition, Nutrient Intake, Sociodemographic Characteristics, and Lifestyle Habits in Older Spanish Adults. Nutrients 2018, 10, 1608. [Google Scholar] [CrossRef]
- Moura, L.; Pagotto, V.; Pereira, C.C.; de Oliveira, C.; Silveira, E.A. Does Abdominal Obesity Increase All-Cause, Cardiovascular Disease, and Cancer Mortality Risks in Older Adults? A 10-Year Follow-Up Analysis. Nutrients 2022, 14, 4315. [Google Scholar] [CrossRef]
- Kudo, D.; Miyakoshi, N.; Hongo, M.; Kasukawa, Y.; Ishikawa, Y.; Mizutani, T.; Mizutani, Y.; Shimada, Y. Impact of appendicular and trunk skeletal muscle mass and back extensor strength on sagittal spinal alignment in Japanese women without vertebral fracture. Osteoporos. Sarcopenia 2021, 7, 36–41. [Google Scholar] [CrossRef]
- Bo, J.; Zhao, X.; Hua, Z.; Li, J.; Qi, X.; Shen, Y. Impact of sarcopenia and sagittal parameters on the residual back pain after percutaneous vertebroplasty in patients with osteoporotic vertebral compression fracture. J. Orthop. Surg. Res. 2022, 17, 111. [Google Scholar] [CrossRef]
- Asai, Y.; Tsutsui, S.; Yoshimura, N.; Hashizume, H.; Iidaka, T.; Horii, C.; Kawaguchi, H.; Nakamura, K.; Tanaka, S.; Yoshida, M.; et al. Relationship between Age-Related Spinopelvic Sagittal Alignment and Low Back Pain in Adults of Population-Based Cohorts: The ROAD Study. J. Pain Res. 2022, 15, 33–38. [Google Scholar] [CrossRef]
- Yoo, M.C.; Won, C.W.; Soh, Y. Association of high body mass index, waist circumference, and body fat percentage with sarcopenia in older women. BMC Geriatr. 2022, 22, 937. [Google Scholar] [CrossRef]
- Yagi, T.; Oshita, Y.; Okano, I.; Kuroda, T.; Ishikawa, K.; Nagai, T.; Inagaki, K. Controlling nutritional status score predicts postoperative complications after hip fracture surgery. BMC Geriatr. 2020, 20, 243. [Google Scholar] [CrossRef]
- Hill, J.O.; Wyatt, H.R.; Peters, J.C. Energy balance and obesity. Circulation 2012, 126, 126–132. [Google Scholar] [CrossRef]
- Proietto, J. Obesity and Bone. F1000Research 2020, 9, 1111. [Google Scholar] [CrossRef]
- Kim, K.-C.; Shin, D.-H.; Lee, S.-Y.; Im, J.-A.; Lee, D.-C. Relation between obesity and bone mineral density and vertebral fractures in Korean postmenopausal women. Yonsei Med. J. 2010, 51, 857–863. [Google Scholar] [CrossRef]


| Age (years), Median [IQR] | 78.0 [72.0–82.0] |
| BMI (kg/m2), mean (SD) | 21.5 (3.6) |
| <18.5, n (%) | 46 (20.3) |
| 18.5–25, n (%) | 148 (65.2) |
| 25–30, n (%) | 28 (12.3) |
| >30, n (%) | 5 (2.2) |
| Height (cm), median [IQR] | 151.1 [146.2–154.6] |
| Weight (kg), median [IQR] | 48.7 [42.0–53.7] |
| Anti-osteoporotic drugs | |
| Any, n (%) | 214 (94) |
| SERM, n (%) | 54 (23.8) |
| Bisphosphonate, n (%) | 94 (41.4) |
| Denosumab, n (%) | 43 (18.9) |
| Teriparatide, n (%) | 7 (3.1) |
| CCI (points), median [IQR] | 0.0 [0.0–2.0] |
| SMI (kg/m2) | 5.8 (0.7) |
| Albumin (g/dL), median [IQR] | 4.1 [4.0–4.3] |
| Serum calcium level (mg/dL), median [IQR] | 9.4 [9.2–9.7] |
| Serum creatinine level (mg/dL), median [IQR] | 0.68 [0.59–0.77] |
| eGFR, mean (SD) | 63.9 (16.1) |
| T-col (mg/dL), mean (SD) | 215.7 (30.4) |
| HDL-C (mg/dL), mean (SD) | 69.9 (16.5) |
| LDL-C (mg/dL), mean (SD) | 119.4 (27.0) |
| PTH-intact (pg/mL), median [IQR] | 30.0 [24.0–39.8] |
| HbA1c (%), median [IQR] | 5.8 [5.5–6.0] |
| 25(OH)D (ng/mL), mean (SD) | 20.6 (7.7) |
| Bone mineral density (spine; g/cm2), median [IQR] | 0.789 [0.689–0.884] |
| Bone mineral density (hip neck; g/cm2), mean (SD) | 0.528 (0.091) |
| Bone mineral density (hip total; g/cm2), mean (SD) | 0.641 (0.098) |
| Bone mineral density (hip trochanter; g/cm2), mean (SD) | 0.506 (0.082) |
| PT (°), median [IQR] | 19.0 [13.0–28.0] |
| SVA (mm), median [IQR] | 39.7 [17.0–78.8] |
| Trunk fat (%), mean (SD) | 29.8 (8.2) |
| Hand grip (kg), mean (SD) | 18.7 (4.7) |
| Abdominal circumference (cm), mean (SD) | 79.9 (10.3) |
| SAD (mm), median [IQR] | 158.1 [144.0–178.8] |
| CONUT score (points), median [IQR] | 1.0 [0.0–1.0] |
| Frailty (points), median [IQR] | 1.0 [0.0–2.0] |
| SVA < 40 | SVA ≥ 40 | |||||||
|---|---|---|---|---|---|---|---|---|
| Abdominal Circumference <80 cm | Abdominal Circumference ≥80 cm | p-Value | Abdominal Circumference <80 cm | Abdominal Circumference ≥80 cm | p-Value | Comparison among All Four Groups | Comparison of SVA < 40 mm and SVA ≥ 40 mm Groups | |
| [SS] | [LS] | [SR] | [LR] | |||||
| Age (years), mean (SD) | 73.7 (5.9) | 75.7 (6.7) | 0.12 | 79.6 (6.6) | 81.1 (7.1) | 0.14 | p < 0.001 | p < 0.001 |
| BMI (kg/m2), mean (SD) | 19.5 (2.5) | 23.5 (2.6) | <0.001 | 19.2 (2.6) | 24.0 (3.4) | <0.001 | p < 0.001 | p = 0.22 |
| Height (cm), mean (SD) | 152.0 (5.6) | 151.7 (5.8) | 0.71 | 149.7 (5.6) | 148.5 (6.6) | 0.45 | p < 0.05 | p < 0.01 |
| Weight (kg), mean (SD) | 45.0 (6.0) | 54.1 (7.3) | <0.001 | 43.1 (5.8) | 53.0 (8.3) | <0.001 | p < 0.001 | p = 0.63 |
| SMI (kg/m2), mean (SD) | 5.5 (0.6) | 6.1 (0.7) | <0.001 | 5.6 (0.6) | 6.1 (0.7) | <0.001 | p < 0.001 | p = 0.09 |
| Percentage of sarcopenia, n (%) | 16 (23.9) | 4 (8.5) | 0.03 | 17 (34%) | 8 (12.7%) | <0.01 | p < 0.01 | p = 0.39 |
| CCI (points), mean (SD) | 0.8 (1.2) | 0.7 (1.4) | 0.27 | 1.0 (1.4) | 1.1(1.5) | 0.68 | 0.38 | 0.11 |
| Bone mineral density, spine (g/cm2), mean (SD) | 0.735 (0.143) | 0.803 (0.165) | 0.02 | 0.808 (0.159) | 0.856 (0.182) | 0.28 | p < 0.001 | p < 0.001 |
| Bone mineral density, hip neck (g/cm2), mean (SD) | 0.520 (0.077) | 0.542 (0.115) | 0.24 | 0.516 (0.082) | 0.535 (0.089) | 0.24 | p = 0.41 | p = 0.82 |
| HbA1c (%), mean (SD) | 5.8 (0.6) | 5.8 (0.5) | 0.74 | 5.9 (0.7) | 6.3 (1.2) | <0.001 | p < 0.001 | p < 0.01 |
| CONUT score (points), mean (SD) | 0.7 (0.9) | 0.4 (0.6) | <0.05 | 1.2 (1.1) | 1.0 (1.0) | 0.49 | p < 0.01 | p < 0.001 |
| CONUT 0–1 (point), n (%) | 56 (84) | 44 (94) | 31 (62) | 41 (65) | ||||
| CONUT 2–4 (points), n (%) | 11(16) | 3 (6) | 18 (36) | 20 (32) | ||||
| CONUT 5–8 (points), n (%) | 0(0) | 0 (0) | 0 (0) | 0 (0) | ||||
| CONUT unclear, n (%) | 0(0) | 0 (0) | 1 (2) | 2 (3) | ||||
| Fall down score, mean (SD) | 3.1 (3.1) | 3.3 (3.4) | 0.77 | 5.1 (3.4) | 5.8 (3.5) | 0.26 | p < 0.001 | p < 0.001 |
| Fall scores > 6, n (%) | 14 (21.5) | 10 (22.2) | 0.93 | 21 (43.8) | 32 (53.3) | 0.32 | p < 0.001 | p < 0.001 |
| Eyes open, one leg standing time (second), mean (SD) | 13.0 (4.0) | 11.4 (5.0) | 0.05 | 10.5 (5.4) | 6.5 (5.7) | <0.001 | p < 0.001 | p < 0.001 |
| Grip power, mean (SD) | 20.1 (4.1) | 19.7 (4.8) | 0.88 | 17.6 (5.0) | 17.5 (4.4) | 0.83 | p < 0.01 | p < 0.001 |
| Sense of insecurity about falling, n (%) | 29 (44.6) | 9 (20.5) | <0.01 | 26 (56.5) | 39 (62.9) | 0.50 | p < 0.001 | p < 0.001 |
| Vertebral fracture history, n (%) | 23 (34.3) | 27 (57.4) | 0.01 | 37 (74.0) | 40 (63.5) | 0.23 | p < 0.001 | p < 0.001 |
| PT, mean (SD) | 16.3 (10.2) | 16.9 (8.0) | 0.41 | 22.5 (11.8) | 28.2 (10.5) | 0.01 | p < 0.001 | p < 0.001 |
| Trunk fat (%), mean (SD) | 26.6 (6.7) | 34.6 (5.9) | <0.001 | 23.8 (7.8) | 34.4 (6.7) | <0.001 | p < 0.001 | p = 0.97 |
| Factor | Odds Ratio (95%CI) for High Fall Risk Score | p-Value |
|---|---|---|
| Sarcopenia | 3.27 (1.47–7.29) | p < 0.01 |
| SVA (mm) | 1.01 (1.01–1.02) | p < 0.001 |
| Abdominal circumference (cm) | 1.04 (1.00–1.07) | p < 0.05 |
Disclaimer/Publisher’s Note: The statements, opinions and data contained in all publications are solely those of the individual author(s) and contributor(s) and not of MDPI and/or the editor(s). MDPI and/or the editor(s) disclaim responsibility for any injury to people or property resulting from any ideas, methods, instructions or products referred to in the content. |
© 2023 by the authors. Licensee MDPI, Basel, Switzerland. This article is an open access article distributed under the terms and conditions of the Creative Commons Attribution (CC BY) license (https://creativecommons.org/licenses/by/4.0/).
Share and Cite
Nagai, T.; Miyagami, M.; Okano, I.; Nakamura, S.; Okazaki, Y.; Sakamoto, K.; Kasai, F.; Kudo, Y.; Kawate, N. Association of Spinal Alignment and Abdominal Circumference with Sarcopenia Status and Fall Risk in Patients with Osteoporosis: A Retrospective Study. Nutrients 2023, 15, 2571. https://doi.org/10.3390/nu15112571
Nagai T, Miyagami M, Okano I, Nakamura S, Okazaki Y, Sakamoto K, Kasai F, Kudo Y, Kawate N. Association of Spinal Alignment and Abdominal Circumference with Sarcopenia Status and Fall Risk in Patients with Osteoporosis: A Retrospective Study. Nutrients. 2023; 15(11):2571. https://doi.org/10.3390/nu15112571
Chicago/Turabian StyleNagai, Takashi, Makoto Miyagami, Ichiro Okano, Shota Nakamura, Yuichiro Okazaki, Keizo Sakamoto, Fumihito Kasai, Yoshifumi Kudo, and Nobuyuki Kawate. 2023. "Association of Spinal Alignment and Abdominal Circumference with Sarcopenia Status and Fall Risk in Patients with Osteoporosis: A Retrospective Study" Nutrients 15, no. 11: 2571. https://doi.org/10.3390/nu15112571
APA StyleNagai, T., Miyagami, M., Okano, I., Nakamura, S., Okazaki, Y., Sakamoto, K., Kasai, F., Kudo, Y., & Kawate, N. (2023). Association of Spinal Alignment and Abdominal Circumference with Sarcopenia Status and Fall Risk in Patients with Osteoporosis: A Retrospective Study. Nutrients, 15(11), 2571. https://doi.org/10.3390/nu15112571