Prevalence of Obesity and the Factors Associated with Low Obesity Awareness among Urban Adolescents in Harare, Zimbabwe


Abstract
1. Introduction
2. Materials and Methods
2.1. Study Design and Theoretical Framework
2.2. Sample Size and Sampling Technique
2.3. Data Collection and Tools
2.3.1. Structured Questionnaire
2.3.2. Obesity Awareness
2.3.3. Self-Efficacy and Barriers to Change
2.3.4. Nutrition Knowledge, Food Habits, and Physical Activity Levels
Nutrition Knowledge
Food habits
Physical activity
2.3.5. Anthropometry
2.4. Data Analysis
3. Results
3.1. Socio-Demographic Characteristics
3.2. Obesity Awareness and Socio-Demographic Characteristics
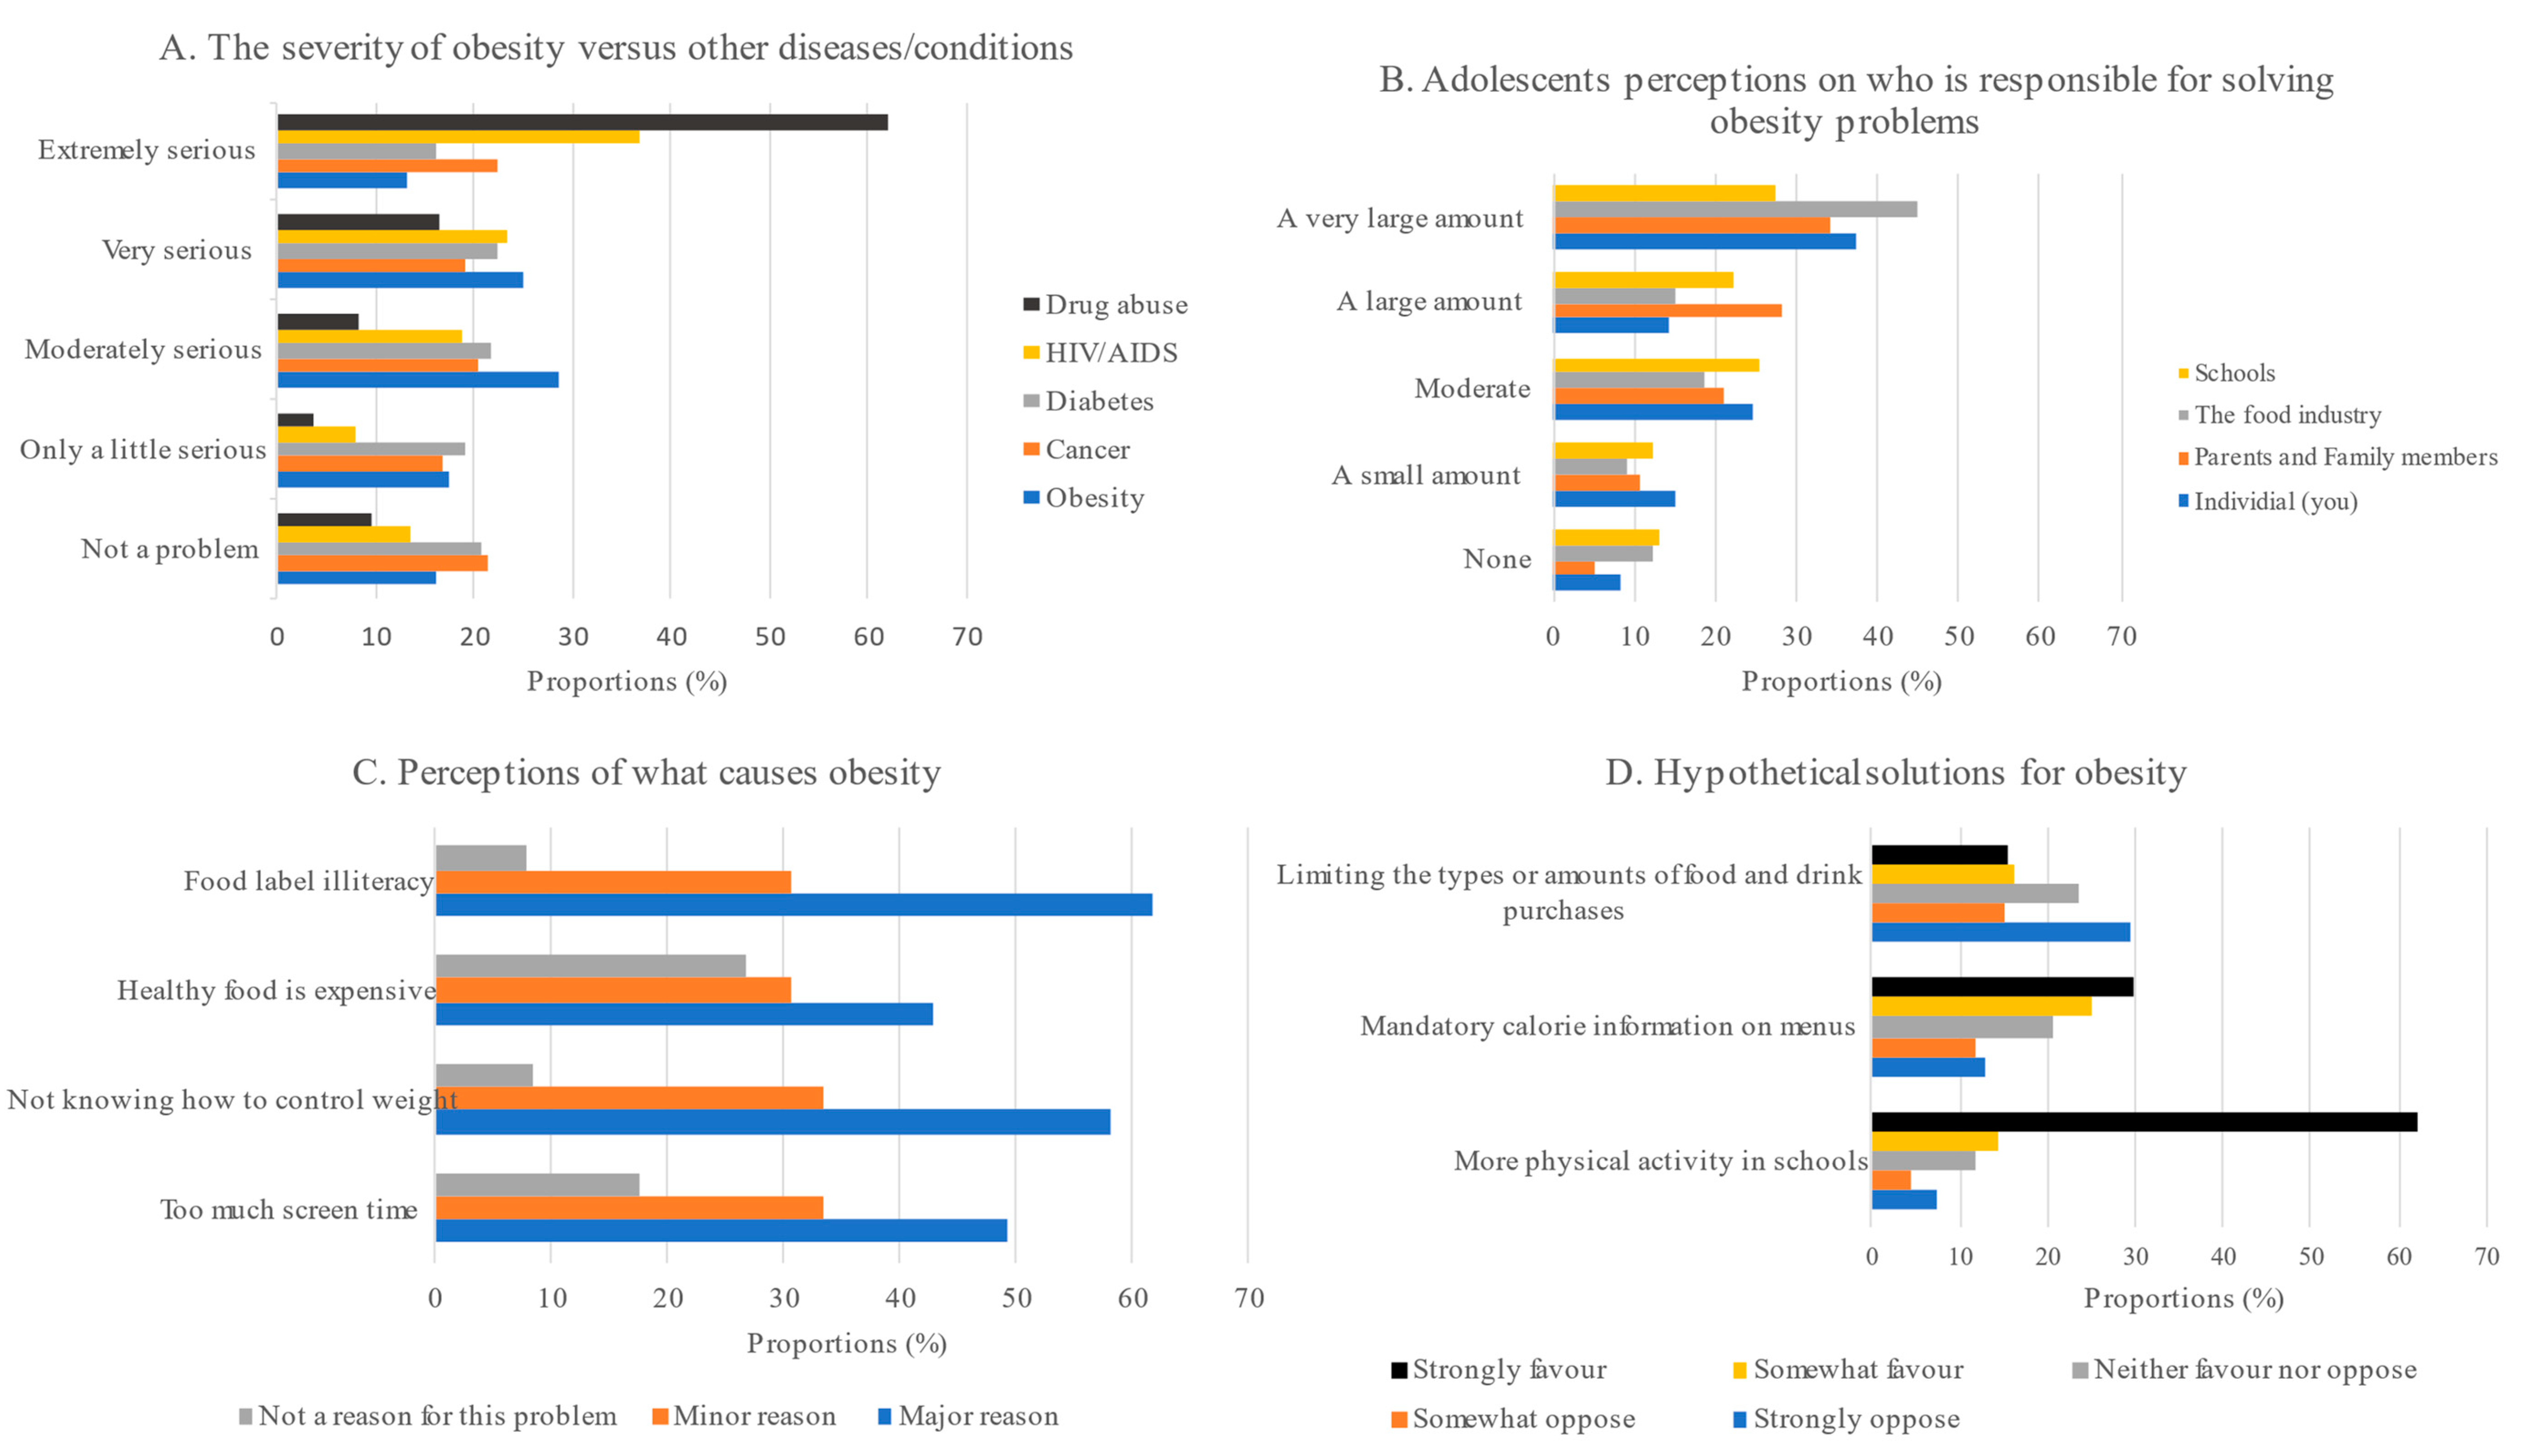
Obesity Perceptions Overview
3.3. Obesity Awareness and Barriers to Change, Self-Efficacy, Food Habits, Nutrition Knowledge, and Physical Activity
3.4. Nutritional Status of Adolescents
3.5. Factors Associated with Low Obesity Awareness among Zimbabwean Adolescents
4. Discussion
4.1. Prevalence of Overweight/Obesity and Low Obesity Awareness
4.2. Factors Associated with Low Obesity Awareness
4.3. Cross-Cutting Issues
5. Practical Implications of the Study
6. Limitations of the Study
7. Conclusions
Author Contributions
Funding
Institutional Review Board Statement
Informed Consent Statement
Data Availability Statement
Acknowledgments
Conflicts of Interest
Appendix A
| 1. Name of school:………………………………………… |
| 2. Age (years) [As at last birthday] :…………………………. |
| 3. Sex: [1] Male [2] Female [3] Prefer not to say |
| 4. Where do you stay? E.g. Kuwadzana, Westgate, Hatfield:…………………… |
| 5. Who do you stay with? |
| [1] Both parents |
| [2] Single parent |
| [3] Relatives/Guardian |
| [4] Child headed |
| [5] Others specify………………………. |
| 6. How many people live in the same household as you?………………………. |
| 7. What is the employment status of your parents/guardians? |
| [1] Formally employed |
| [2] Unemployed |
| [3] Business owners or Self-employed |
| 8. What is the educational level of your parents/guardians? [The household head] |
| [1] No formal Education |
| [2] Primary School |
| [3] Ordinary and Advanced level |
| [4] Tertiary level (College or university graduate) |
- How serious a problem is each of these health issues for adolescents in this country?
| Not a Problem | Only a Little Serious | Moderately Serious | Very Serious | Extremely Serious | |
| Cancer | 1 | 2 | 3 | 4 | 5 |
| Overweight and obesity | 1 | 2 | 3 | 4 | 5 |
| Diabetes | 1 | 2 | 3 | 4 | 5 |
| Alcohol and drug abuse | 1 | 2 | 3 | 4 | 5 |
| HIV/AIDS | 1 | 2 | 3 | 4 | 5 |
- 2.
- More people are becoming obese these days. These might be the causes. For cause each, please show if you think it is a major reason, a minor reason, or not a reason for this problem.
- (A).
- People spend too much time in front of the TV, video games, and computer screens,[1] a major reason [2] a minor reason [3] not a reason for this problem
- (B).
- People do not know how to control their weight,[1] a major reason [2] a minor reason [3] not a reason for this problem
- (C).
- Healthy foods are expensive,[1] a major reason [2] a minor reason [3] not a reason for this problem
- (D).
- People don’t have enough information about what’s in their food,[1] a major reason [2] a minor reason [3] not a reason for this problem
- (E).
- There are not enough safe places for people to be physically active outdoors[1] a major reason [2] a minor reason [3] not a reason for this problem
- 3.
- Do you think one can be overweight and still be healthy?[1] Yes [2] No
- 4.
- How much discrimination do obese people face because of their weight?[1] A lot [2] A little [3] Some [4] Not very much [5] None
- 5.
- How many years does obesity shorten an individual’s life expectancy?[1] <5 years [2] 5–10 years [3] 11–15 years [4] 16–20 years [5] >21 years
- 6.
- Do you favour the following government policies: strongly favour [5], somewhat favour [4], neither favour nor oppose [3], somewhat oppose [2], strongly oppose [1]?
| Strongly Oppose | Somewhat Oppose | Neither Favour nor Oppose | Somewhat Favour | Strongly Favour | |
| Requiring more physical activity in schools | 1 | 2 | 3 | 4 | 5 |
| Requiring take-away shops to post calorie information on menus | 1 | 2 | 3 | 4 | 5 |
| Limiting the types or amounts of foods and drinks people can buy | 1 | 2 | 3 | 4 | 5 |
- 7.
- How much responsibility does each of the following groups have for solving the country’s obesity problems?
| No Responsibility at All | A Small Amount of Responsibility | A Moderate Amount | A Large Amount | A Very Large Amount of Responsibility | |
| Individual (you) | 1 | 2 | 3 | 4 | 5 |
| Parents and other family members | 1 | 2 | 3 | 4 | 5 |
| Food industry | 1 | 2 | 3 | 4 | 5 |
| Schools | 1 | 2 | 3 | 4 | 5 |
| Medical aid companies | 1 | 2 | 3 | 4 | 5 |
| The government | 1 | 2 | 3 | 4 | 5 |
| State and local governments | 1 | 2 | 3 | 4 | 5 |
| Employers | 1 | 2 | 3 | 4 | 5 |
- 8.
- Obesity increases the risk for illnesses like diabetes, high blood pressure, sleep apnoea (a sleeping disorder where breathing repeatedly starts and stops), heart disease, and cancer. Which of the following is the most effective way to treat morbid obesity?[1] Exercise [2] Diet control [3] Medication [4] Surgery [5] Other
- 9.
- In general, how would you rate your overall health?[1] Excellent [2] Very good [3] Good [4] Fair
- 10.
- Do you personally know anybody who you would consider to be obese?[1] Yes [2] No
- 11.
- Which of the following best describes your current weight?[1] Underweight [2] Normal/healthy weight [3] Overweight [4] Obese
- 12.
- How do you feel about your current weight?[1] Very happy [2] Happy [3] Neither happy nor unhappy[4] Unhappy [5] Very unhappy
- 13.
- Is it very easy, somewhat easy, neither easy nor hard, somewhat hard, or very hard to:
- (a)
- Get to fast-food restaurants,[1] It is very easy [2] somewhat easy [3] neither easy nor hard[4] somewhat hard [5] very hard
- (b)
- Find safe places to be physically active outdoors?[1] It is very easy [2] somewhat easy [3] neither easy nor hard[4] somewhat hard [5] very hard
- 14.
- When was your last visit with a doctor for a check-up?[1] <6 months ago [2] 6–12 months ago [3] 1–2 years ago [4] >2 years ago [5]Never
- 15.
- Has your doctor ever talked with you about the health risks of being or becoming overweight or obese?[1] Yes [2] No [3] I rarely go to the doctor
| 1. Do you think you can choose anything by yourself? |
| [1] Yes [2] No [3] I don’t know |
| 2. Do you think you can use advice aimed at improving your well-being? |
| [1] Yes [2] No [3] I don’t know |
| 3. Do you think you can change your diet if needed? |
| [1] Yes [2] No [3] I don’t know |
| 4. Do you think you can lose or gain weight if needed? |
| [1] Yes [2] No [3] I don’t know |
| 5. Do you think you can use nutrition advice aimed at improving your dietary habits? |
| [1] Yes [2] No [3] I don’t know |
| 6. Do you think you can use nutrition advice aimed at improving your health status? |
| [1] Yes [2] No [3] I don’t know |
| 7. Do you think you can practice constant physical activity to improve your well-being? |
| [1] Yes [2] No [3] I don’t know |
| 8. Do you think you can practice constant physical activity to improve your physical aspect? |
| [1] Yes [2] No [3] I don’t know |
| 1. Do you have some influence on cooking food at home? |
| [1] Yes [2] No |
| 2. Do you know which foods must be avoided to reduce dietary intake of fats and cholesterol? |
| [1] Yes [2] No |
| 3. Do you know which foods must be restricted to reduce dietary intake of sugar? |
| [1] Yes [2] No |
| 4. Do you know which foods must be eaten to increase your dietary intake of fiber? |
| [1] Yes [2] No |
| 5. Do you know which benefits you could gain by eating a healthy diet? |
| [1] Yes [2] No |
| 6. Do you know how to improve your diet? |
| [1] Yes [2] No |
| 7. Do you know how much you must eat to satisfy your energy requirement? |
| [1] Yes [2] No |
| 8. Do you know how important it is not to be influenced by your friends in choosing your food? |
| [1] Yes [2] No |
| 9. Do you think that your family would support your efforts in improving your food habits? |
| [1] Yes [2] No |
| 1. If I am having lunch away from home, I often choose a low-fat option. |
| [1] True [2] False [3] I never have lunch away from home |
| 2. I usually avoid eating fried foods. |
| [1] True [2] False |
| 3. I usually eat a dessert if there is one available. |
| [1] True [2] False |
| 4. I make sure I eat at least one serving of fruit a day. |
| [1] True [2] False |
| 5. I try to keep my overall fat intake down. |
| [1] True [2] False |
| 6. If I am buying milk, I often choose a low-fat brand. |
| [1] True [2] False [3] I never buy milk |
| 7. I avoid eating lots of sausages and burgers. |
| [1] True [2] False [3] I never eat sausages or burgers |
| 8. I often buy biscuits, donuts cream puffs, or cakes. |
| [1] True [2] False |
| 9. I try to keep my overall sugar intake down. |
| [1] True [2] False |
| 10. I make sure I eat at least one portion of vegetables or salad a day. |
| [1] True [2] False |
| 11. If I am having a dessert at home, I try to have something low in fat. |
| [1] True [2] False [3] I don’t eat desserts |
| 12. I rarely eat takeaway meals. |
| [1] True [2] False |
| 13. I try to ensure I eat plenty of fruit and vegetables. |
| [1] True [2] False |
| 14. I often eat sweet snacks between meals. |
| [1] True [2] False |
| 15. I usually eat at least one serving of vegetables (excluding potatoes) or salad with my evening meal. |
| [1] True [2] False |
| 16. When I am buying a soft drink, I usually choose a diet drink e.g., diet Coke. |
| [1] True [2] False [3] I never buy soft drinks |
| 17. When I put butter or margarine on bread, I usually spread it thinly. |
| [1] True [2] False [3] I never have butter or margarine on bread |
| 18. If I have a packed lunch, I usually include some chocolate and/or biscuits. |
| [1] True [2] False [3] I never have a packed lunch |
| 19. When I have a snack between meals, I often choose fruit. |
| [1] True [2] False [3] I never eat snacks between meals |
| 20. If I am having a dessert in a restaurant, I usually choose the healthiest one. |
| [1] True [2] False [3] I never have desserts in restaurants |
| 21. I often have cream on desserts. |
| [1] True [2] False [3] I don’t eat desserts |
| 22. I eat at least three servings of fruit most days. |
| [1] True [2] False |
| 23. I generally try to have a healthy diet. |
| [1] True [2] False |
| Never | Seldom | Sometimes | Often | Always | |
| 24. How often do you skip breakfast? | 1 | 2 | 3 | 4 | 5 |
| 25. How often do you skip lunch? | 1 | 2 | 3 | 4 | 5 |
| 26. How often do you skip supper? | 1 | 2 | 3 | 4 | 5 |
| 27. How often do you eat regular meals with your immediate family at home, sitting down together? | 1 | 2 | 3 | 4 | 5 |
| Adequate and balanced nutrition. |
| 1. Regularly eating breakfast improves school performance. |
| [1] True [2] False [3] Not sure |
| 2. Especially milk and eggs should be consumed at breakfast. |
| [1] True [2] False [3] Not sure |
| 3. We should drink 8–10 glasses of water every day. |
| [1] True [2] False [3] Not sure |
| 4. We should drink at least 2 glasses of milk every day. |
| [1] True [2] False [3] Not sure |
| 5. We should consume 5 portions of fruits and vegetables every day. |
| [1] True [2] False [3] Not sure |
| 6. Consuming bread and cereals (maize) is important for adequate and balanced nutrition. |
| [1] True [2] False [3] Not sure |
| 7. We should not consume meat more than 3 days a week. |
| [1] True [2] False [3] Not sure |
| 8. According to the nutrition expert, the amount of salt a person consumes in a day should not exceed 6 g. |
| [1] True [2] False [3] Not sure |
| 9. Fast food (burgers, fried chips, fizzy drinks, etc.) is not suitable for adequate and balanced nutrition. |
| [1] True [2] False [3] Not sure |
| Essential nutrients |
| 10. Nutrients are divided into six groups. |
| [1] True [2] False [3] Not sure |
| 11. The carbohydrate group has more energy than the fats group. |
| [1] True [2] False [3] Not sure |
| 12. Fizzy drinks contain high amounts of sugar. |
| [1] True [2] False [3] Not sure |
| 13. Pasta and rice are starchy foods. |
| [1] True [2] False [3] Not sure |
| 14. Chicken and eggs contain a high amount of protein. |
| [1] True [2] False [3] Not sure |
| 15. Sugar beans and baked beans contain a high amount of protein. |
| [1] True [2] False [3] Not sure |
| 16. Nuts are an alternative to meat in terms of protein content. |
| [1] True [2] False [3] Not sure |
| 17. The most reasonable act for limiting the amount of fat is consuming biscuits. |
| [1] True [2] False [3] Not sure |
| 18. Bread contains a high amount of fat. |
| [1] True [2] False [3] Not sure |
| 19. Meat and chicken are important sources of omega-3 fatty acids. |
| [1] True [2] False [3] Not sure |
| 20. When we consume animal fat, the amount of cholesterol in the body increases. |
| [1] True [2] False [3] Not sure |
| 21. Fried chips are junk food. |
| [1] True [2] False [3] Not sure |
| 22. Whole-grain bread contains more vitamins and minerals than white bread. |
| [1] True [2] False [3] Not sure |
| 23. Vitamins A and C can be classified as antioxidant vitamins. |
| [1] True [2] False [3] Not sure |
| 24. Green pepper and oranges contain high amounts of vitamin C. |
| [1] True [2] False [3] Not sure |
| 25. Cheese contains a high amount of calcium. |
| [1] True [2] False [3] Not sure |
| 26. Calcium and vitamin D are important for strong bones. |
| [1] True [2] False [3] Not sure |
| 27. Meat contains a high amount of salt. |
| [1] True [2] False [3] Not sure |
| 28. White bread contains more fiber than whole-grain bread. |
| [1] True [2] False [3] Not sure |
| 29. Peaches do not contain a high amount of fibre. |
| [1] True [2] False [3] Not sure |
| Malnutrition related diseases |
| 30. Obese people have health problems more than normal. |
| [1] True [2] False [3] Not sure |
| 31. Eating fish is a risk factor for cardiovascular diseases. |
| [1] True [2] False [3] Not sure |
| 32. Obesity may be due to excessive fat consumption. |
| [1] True [2] False [3] Not sure |
| 33. Consuming foods such as fruits and vegetables which have high amount of fibre reduce the risk of getting cancer. |
| [1] True [2] False [3] Not sure |
| 34. Reducing salt consumption does not reduce the risk of heart disease. |
| [1] True [2] False [3] Not sure |
| 35. Overusing of sugar and salt is associated with health problems such as diabetes, hypertension, and heart disease. |
| [1] True [2] False [3] Not sure |
| 36. The low consumption of fruits increases the risk of infectious diseases. |
| [1] True [2] False [3] Not sure |
| 37. Adequate and balanced nutrition decreases the risk of anemia. |
| [1] True [2] False [3] Not sure |
| 1. Do you usually practice any form of physical activity? |
| [1] Always during the entire year |
| [2] Only in some seasons |
| [3] Sometimes |
| [4] Never |
| 2. How many hours do you practice? |
| [1] 1–2 h per week |
| [2] 3–4 h per week |
| [3] More than 4 h per week |
| [4] Never |
| 3. In the last 7 days, during your physical education (PE) class, how often were you very active (playing hard, jumping, and throwing)? |
| [1] Always [2] Quite often [3] Sometimes [4] Hardly [5] I don’t do PE |
| 4. The physical activity you practice at school: |
| [1] Makes you feel well. |
| [2] Stimulates you to practice sports even out of school |
| [3] Is tiring |
| [4] Is boring |
| 5. What do you prefer doing during your free time? |
| [1] Practicing a sport |
| [2] Walking |
| [3] Shopping |
| [4] Watching TV/listening to music/using the computer/reading a book |
| 6. How many hours a day do you spend on the computer or watching TV? |
| [1] 1–2 h a day |
| [2] 3–4 h a day |
| [3] 5–6 h a day |
| [4] More than 6 h a day |
| 7. Your lifestyle is: |
| [1] Very active |
| [2] Moderately active |
| [3] Sedentary |
| [4] Very sedentary |
References
- World Health Organization (WHO). Obesity. In System; World Health Organization (WHO): Geneva, Switzerland, 2000; p. 9. [Google Scholar]
- Mukora-Mutseyekwa, F.; Zeeb, H.; Nengomasha, L.; Adjei, N.K. Trends in Prevalence and Related Risk Factors of Overweight and Obesity among Women of Reproductive Age in Zimbabwe, 2005–2015. Int. J. Environ. Res. Public Health 2019, 16, 2758. [Google Scholar] [CrossRef]
- Kamvura, T.T.; Dambi, J.M.; Chiriseri, E.; Turner, J.; Verhey, R.; Chibanda, D. Barriers to the provision of non-communicable disease care in Zimbabwe: A qualitative study of primary health care nurses. BMC Nurs. 2022, 21, 1–12. [Google Scholar] [CrossRef] [PubMed]
- Matsungo, T.M.; Chopera, P. Nutrition in contemporary Zimbabwe: A situational analysis. N. Afr. J. Food Nutr. Res. 2020, 4, S25–S35. [Google Scholar] [CrossRef]
- Pencil, A.; Matsungo, T.M.; Hayami, N. Determinants of overweight and obesity among adolescents in Zimbabwe: A scoping review. N. Afr. J. Food Nutr. Res. 2021, 5, 112–121. [Google Scholar] [CrossRef]
- Renzaho, A.M. Fat, rich and beautiful: Changing socio-cultural paradigms associated with obesity risk, nutritional status and refugee children from sub-Saharan Africa. Health Place 2004, 10, 105–113. [Google Scholar] [CrossRef]
- Reese-Masterson, A.; Murakwani, P. Assessment of Adolescent Girl Nutrition, Dietary Practices and Roles in Zimbabwe. F. Exch. Emerg. Nutr. Netw. ENN 2016, 52, 113–115. Available online: https://www.ennonline.net/fex/52/adolescentgirlnutrition (accessed on 5 May 2023).
- Simfukwe, P.; Van Wyk, B.; Swart, C. Perceptions, attitudes and challenges about obesity and adopting a healthy lifestyle among health workers in Pietermaritzburg, KwaZulu-Natal province. Afr. J. Prim. Health Care Fam. Med. 2017, 9, 1–9. [Google Scholar] [CrossRef]
- Manafe, M.; Chelule, P.K.; Madiba, S. The Perception of Overweight and Obesity among South African Adults: Implications for Intervention Strategies. Int. J. Environ. Res. Public Health 2022, 19, 12335. [Google Scholar] [CrossRef]
- Mangemba, N.T.; Sebastian, M.S. Societal risk factors for overweight and obesity in women in Zimbabwe: A cross-sectional study. BMC Public Health 2020, 20, 1–8. [Google Scholar] [CrossRef]
- Negash, S.; Agyemang, C.; E Matsha, T.; Peer, N.; Erasmus, R.T.; Kengne, A.P. Differential prevalence and associations of overweight and obesity by gender and population group among school learners in South Africa: A cross-sectional study. BMC Obes. 2017, 4, 1–8. [Google Scholar] [CrossRef]
- Liu, Y.-F.; Liu, D.-M.; Shi, L.; Zhang, B.; Han, L.-L.; Zhang, Y.; Yu, L.; Zhao, Y. Analysis of Related Factors of Overweight and Obesity among Secondary School Students in Chongqing, China. Phys. Procedia 2012, 33, 104–110. [Google Scholar] [CrossRef]
- Mmolai, S.K. HIV/AIDS Stigma in Botswana: Implications for the Dignity of People Living With HIV/AIDS. LWATI 2011, 8, 84–95. [Google Scholar]
- Shouli, M.M.; Soliman, N.M.; El Moneemelsayied, H.A. High Risk for Obesity among Youth in West Bank /Palestine. Egypt. J. Health Care 2018, 9, 64–77. [Google Scholar] [CrossRef]
- Visscher, T.L.S.; Lakerveld, J.; Olsen, N.; Küpers, L.; Ramalho, S.; Keaver, L.; Brei, C.; Bjune, J.-I.; Ezquerro, S.; Yumuk, V. Perceived Health Status: Is Obesity Perceived as a Risk Factor and Disease? Obes. Facts 2017, 10, 52–60. [Google Scholar] [CrossRef] [PubMed]
- Savige, G.; MacFarlane, A.; Ball, K.; Worsley, A.; Crawford, D. Snacking behaviours of adolescents and their association with skipping meals. Int. J. Behav. Nutr. Phys. Act. 2007, 4, 1–9. [Google Scholar] [CrossRef] [PubMed]
- Feyzabadi, V.Y.; Mohammadi, N.K.; Omidvar, N.; Karimi-Shahanjarini, A.; Nedjat, S.; Rashidian, A. Factors Associated With Unhealthy Snacks Consumption Among Adolescents in Iran’s Schools. Int. J. Health Policy Manag. 2017, 6, 519–528. [Google Scholar] [CrossRef] [PubMed]
- Ministry Of Primary and Secondary Education, Zimbabwe. (MoPSE). 2021. Available online: http://mopse.co.zw/sites/default/files/public/downloads/pdf (accessed on 9 May 2023).
- Nguu-gutu, C.M.; Imungi, J.K.; Ngatia, E.M. Snacking and Its Effect on Nutritional Status of Adolescents in Two National High Schools in Nairobi Kenya. Food Sci. Qual. Manag. 2014, 30, 48–59. Available online: https://www.iosrjournals.org/iosr-jnhs/papers/vol6-issue3/Version-7/C0603072131.pdf (accessed on 9 May 2023).
- Klump, K.L. Puberty as a critical risk period for eating disorders: A review of human and animal studies. Horm Behav. 2013, 64, 399–410. [Google Scholar] [CrossRef]
- Washburn, L. Understanding the Health Belief Model; University of Tennessee: Knoxville, TN, USA, 2020; Available online: https://extension.tennessee.edu/publications/Documents/W931-C.pdf (accessed on 2 February 2023).
- Fan, M.; Jin, Y.; Khubchandani, J. Overweight Misperception among Adolescents in the United States. J. Pediatr. Nurs. 2014, 29, 536–546. [Google Scholar] [CrossRef]
- Talamayan, K.S.; Springer, A.E.; Kelder, S.H.; Gorospe, E.C.; Joye, K.A. Prevalence of overweight misperception and weight control behaviors among normal weight adolescents in the United States. Sci. World J. 2006, 6, 365–373. [Google Scholar] [CrossRef] [PubMed]
- Zimbabwe Demographic and Health Survey (ZDHS). ZimStats, 2015. Harare, Zimbabwe. Available online: http://www.zimstat.co.zw/sites/default/files/img/publications/Health/ZDHS_2015.pdf. (accessed on 2 February 2023).
- Charan, J.; Biswas, T. How to Calculate Sample Size for Different Study Designs in Medical Research? Indian J. Psychol. Med. 2013, 35, 121–126. [Google Scholar] [CrossRef]
- Adiele, D.; Morgan, G.P.; Carolyne, L.M. An Unhealthy, Obesogenic Lifestyle: A Case Study of Urban Primary School Children in Kwekwe, Zimbabwe. Sci. J. Public Health 2018, 6, 35. [Google Scholar] [CrossRef]
- Jayawardene, W.; Pinar, S.; Torabi, M.; Xun, P.; Özer, M.K. Obesity perception survey among youth in Turkey: Instrument development and test-retest reliability. Turk. J. Med Sci. 2019, 49, 1228–1235. [Google Scholar] [CrossRef]
- Turconi, G.; Celsa, M.; Rezzani, C.; Biino, G.; Sartirana, M.A.; Roggi, C. Reliability of a dietary questionnaire on food habits, eating behaviour and nutritional knowledge of adolescents. Eur. J. Clin. Nutr. 2003, 57, 753–763. [Google Scholar] [CrossRef]
- Oz, F.; Aydin, R.; Onsuz, M.F.; Metintas, S.; Emiral, G.O. Development of a reliable and valid adolescence nutritional knowledge questionnaire. Nutrition 2016, 18, 125–134. [Google Scholar] [CrossRef]
- Johnson, F.; Wardle, J.; Griffith, J. The Adolescent Food Habits Checklist: Reliability and validity of a measure of healthy eating behaviour in adolescents. Eur. J. Clin. Nutr. 2002, 56, 644–649. [Google Scholar] [CrossRef]
- Silva, D.R.; O Werneck, A.; Collings, P.J.; A Fernandes, R.; Barbosa, D.S.; Ronque, E.R.V.; Sardinha, L.B.; Cyrino, E.S. Physical activity maintenance and metabolic risk in adolescents. J. Public Health 2018, 40, 493–500. [Google Scholar] [CrossRef] [PubMed]
- Amador, X.F.; Strauss, D.H.; Yale, S.A.; Gorman, J.M. Awareness of Illness in Schizophrenia. Schizophr. Bull. 1991, 17, 113–132. [Google Scholar] [CrossRef] [PubMed]
- Preston, C.C.; Colman, A. Optimal number of response categories in rating scales: Reliability, validity, discriminating power, and respondent preferences. Acta Psychol. 2000, 104, 2000. [Google Scholar] [CrossRef]
- World Health Organization (WHO). Consideration of the Evidence on Childhood Obesity for the Commission on Ending Childhood Obesity: Report of the Ad Hoc Working Group on Science and Evidence for Ending Childhood Obesity; World Health Organization (WHO): Geneva, Switzerland, 2016; p. 219. [Google Scholar]
- Zhang, Y.-X. Letter to the Editor from Zhang: “International Waist Circumference Percentile Cutoffs for Central Obesity in Children and Adolescents Aged 6 to 18 Years”. J. Clin. Endocrinol. Metab. 2020, 105, 2020. [Google Scholar] [CrossRef]
- Bacopoulou, F.; Efthymiou, V.; Landis, G.; Rentoumis, A.; Chrousos, G.P. Waist circumference, waist-to-hip ratio and waist-to-height ratio reference percentiles for abdominal obesity among Greek adolescents. BMC Pediatr. 2015, 15, 2015. [Google Scholar] [CrossRef] [PubMed]
- Saghafi-Asl, M.; Aliasgharzadeh, S.; Asghari-Jafarabadi, M. Factors influencing weight management behavior among college students: An application of the Health Belief Model. PLoS ONE 2020, 15, e0228058. [Google Scholar] [CrossRef] [PubMed]
- Dalwood, P.; Marshall, S.; Burrows, T.L.; McIntosh, A.; Collins, C.E. Diet quality indices and their associations with health-related outcomes in children and adolescents: An updated systematic review. Nutr. J. 2020, 19, 1–43. [Google Scholar] [CrossRef] [PubMed]
- Mapfumo, P.T.; Muderedzwa, T.M.; Matsungo, T.M. Prevalence and determinants of overweight and obesity among in-school adolescents in Harare, Zimbabwe. North Afr. J. Food Nutr. Res. 2022, 6, 29–38. [Google Scholar] [CrossRef]
- Irelosen, A.K.; Etim, N.E.; Babatunde, A.S. Adolescent obesity: An emerging public health crisis in an urban city in South-South Nigeria. Ann. Clin. Biomed. Res. 2021, 2. [Google Scholar] [CrossRef]
- Nwosu, E.; Fismen, A.-S.; Helleve, A.; Hongoro, C.; Sewpaul, R.; Reddy, P.; Alaba, O.; Harbron, J. Trends in prevalence of overweight and obesity among South African and European adolescents: A comparative outlook. BMC Public Health 2022, 22, 1–13. [Google Scholar] [CrossRef]
- Zhang, J.; Zhai, Y.; Feng, X.; Li, W.; Lyu, Y.; Astell-Burt, T.; Zhao, P.; Shi, X.-M. Gender Differences in the Prevalence of Overweight and Obesity, Associated Behaviors, and Weight-related Perceptions in a National Survey of Primary School Children in China. Biomed. Env. Sci. 2018, 31, 1–11. [Google Scholar]
- Cao, Y.; Huynh, Q.; Kapoor, N.; Jeemon, P.; De Mello, G.T. Associations between Dietary Patterns and Cardiometabolic Risk Factors-A Longitudinal Analysis among High-Risk Individuals for Diabetes in Kerala, India. Nutrients 2022, 14, 662. [Google Scholar] [CrossRef]
- Ogden, C.L.; Carroll, M.D.; Fakhouri, T.H.; Hales, C.M.; Fryar, C.D.; Li, X.; Freedman, D.S. Prevalence of Obesity Among Youths by Household Income and Education Level of Head of Household—United States 2011–2014. MMWR Morb. Mortal. Wkly. Rep. 2018, 67, 186–189. [Google Scholar] [CrossRef]
- Aitsi-Selmi, A.; Chandola, T.; Friel, S.; Nouraei, R.; Shipley, M.J.; Marmot, M.G. Interaction between Education and Household Wealth on the Risk of Obesity in Women in Egypt. PLoS ONE 2012, 7, e39507. [Google Scholar] [CrossRef]
- Ogden, C.L.; Carroll, M.D.; Curtin, L.R.; Lamb, M.M.; Flegal, K.M. Prevalence of High Body Mass Index in US Children and Adolescents, 2007–2008. JAMA 2010, 303, 242–249. [Google Scholar] [CrossRef]
- Liu, Y.; Ma, Y.; Jiang, N.; Song, S.; Fan, Q.; Wen, D. Interaction between Parental Education and Household Wealth on Children’s Obesity Risk. Int. J. Environ. Res. Public Health 2018, 15, 1754. [Google Scholar] [CrossRef] [PubMed]
- Wolfson, J.A.; Gollust, S.E.; Niederdeppe, J.; Barry, C.L. The Role of Parents in Public Views of Strategies to Address Childhood Obesity in the United States. Milbank Q. 2015, 93, 73–111. [Google Scholar] [CrossRef] [PubMed]
- Kambondo, G.; Sartorius, B. Risk Factors for Obesity and Overfat among Primary School Children in Mashonaland West Province, Zimbabwe. Int. J. Environ. Res. Public Health 2018, 15, 249. [Google Scholar] [CrossRef]
- Barry, C.L.; Gollust, S.E.; McGinty, E.E.; Niederdeppe, J. Effects of messages from a media campaign to increase public awareness of childhood obesity. Obesity 2014, 22, 466–473. [Google Scholar] [CrossRef] [PubMed]
- Medina, C.R.; Urbano, M.B.; Espinosa, A.D.J.; López, Á.T. Eating Habits Associated with Nutrition-Related Knowledge among University Students Enrolled in Academic Programs Related to Nutrition and Culinary Arts in Puerto Rico. Nutrients 2020, 12, 1408. [Google Scholar] [CrossRef]
- Loring, B.; Robertson, A. Obesity and Inequities; World Health Organization (WHO): Geneva, Switzerland, 2014; p. 48. [Google Scholar]
- Monzani, A.; Ricotti, R.; Caputo, M.; Solito, A.; Archero, F.; Bellone, S.; Prodam, F. A Systematic Review of the Association of Skipping Breakfast with Weight and Cardiometabolic Risk Factors in Children and Adolescents. What Should We Better Investigate in the Future? Nutrients 2019, 11, 387. [Google Scholar] [CrossRef]
- Sincovich, A.; Moller, H.; Smithers, L.; Brushe, M.; Lassi, Z.S.; Brinkman, S.A.; Gregory, T. Prevalence of breakfast skipping among children and adolescents: A cross-sectional population level study. BMC Pediatr. 2022, 22, 1–10. [Google Scholar] [CrossRef] [PubMed]
- Moyo, J. Obesity Emerges as Health Hazard in Cash—Strapped Zimbabwe Related News; Harare, Zimbabwe. 2021; p. 2021. Available online: https://www.aa.com.tr/en/africa/obesity-emerges-as-health-hazard-in-cash-strapped-zimbabwe/2315231 (accessed on 3 March 2023).
- Slaght, J.L.; Wicklow, B.A.; Dart, A.B.; Sellers, E.A.C.; Gabbs, M.; Carino, M.; McGavock, J.M. Physical activity and cardiometabolic health in adolescents with type 2 diabetes: A cross-sectional study. BMJ Open Diabetes Res. Care 2021, 9, 1–7. [Google Scholar] [CrossRef]
- Tompson, T.; Benz, J.; Agiesta, J.; Brewer, K.; Bye, L.; Reimer, R.; Junius, D. Obesity in the United States: Public Perceptions. Assoc. Press. Cent. Public Aff. Res. 2013, 1–8. Available online: http://www.apnorc.org/PDFs/Obesity/AP-NORC-Obesity-Research-Highlights.pdf (accessed on 3 February 2023).
- Hughes, E. “I’m Supposed To Be Thick”: Managing Body Image Anxieties Among Black American Women. J. Black Stud. 2021, 52, 310–330. [Google Scholar] [CrossRef]
- Pradeilles, R.; Holdsworth, M.; Olaitan, O.; Irache, A.; Osei-Kwasi, H.A.; Ngandu, C.B.; Cohen, E. Body size preferences for women and adolescent girls living in Africa: A mixed-methods systematic review. Public Health Nutr. 2022, 25, 738–759. [Google Scholar] [CrossRef] [PubMed]
- Hahn, T. Who Is to Blame for the Health Risks of Junk Food: Consumers or Food Companies? Related Programmes Join the Do Better Community Business Innovation Technology Global Agenda; Esade Business and Law School: Barcelona, Spain, 2019; p. 2023. Available online: https://dobetter.esade.edu/en/junk-food-health-risks (accessed on 20 March 2023).
- Chopera, P.; Chagwena, D.; Mushonga, N.; Chagwena, T. Food label reading and understanding in parts of rural and urban Zimbabwe. Afr. Health Sci. 2014, 14, 576–584. [Google Scholar] [CrossRef] [PubMed]
- Inclusive Physical Activity and Ways to Reduce Inequalities; Sports England: Leicestershire, UK, 2021. Available online: https://sportengland-production-files.s3.eu-west-2.amazonaws.com (accessed on 20 March 2023).
- Ministry of Primary and Secondary Education. Zimbabwe School Health Policy: Harare, Zimbabwe, 2018. pp. 1–38. Available online: http://www.mopse.co.zw/sites/default/files/public/downloads/ZSHP%20final%20signed%20March%202018.pdf (accessed on 7 April 2023).
- Scaling up nutrition in Zimbabwe, The Food and Nutrition Council, Harare, Zimbabwe. 2019. Available online: https://fnc.org.zw/wp-content/uploads/2019/01/Scaling-Up-Nutrition-In-Zimbabwe.pdf (accessed on 18 April 2023).
- MoHCC. Zimbabwe National Nutrition Strategy 2014–2018. Natl. Nutr. Strateg. 2014. Available online: https//extranet.who.int/nutrition/gina/sites/default/files/ZWE (accessed on 2 May 2023).
- Matsungo, T.; Chopera, P.; Tsikayi, P.; Benhura, C.; Mushonga, N.G. Nutritional Status and Lifestyle characteristics of adults aged 15-49 years living in Harare, Zimbabwe. Cent. Afr. J. Med. 2019, 65, 10–14. [Google Scholar]
- Multi-Sectoral Nutrition Needs and Gap Analysis. Available online: https://pubdocs.worldbank.org/en/825961538777240208/pdf/Oct-3-S3-Zimbabwe-Presentation.pdf (accessed on 3 May 2023).


| Variable | Obesity Awareness | ||||
|---|---|---|---|---|---|
| Total n (%) | Low n (%) | High n (%) | p-Value 1 | ||
| Sex | Boys | 198 (46.8) | 38 (33.0) | 160 (51.9) | 0.001 * |
| Girls | 225 (53.2) | 77 (67.0) | 148 (48.1) | ||
| Age Group | 14–16 years | 229 (54.1) | 58 (51.3) | 171 (56.8) | 0.317 |
| 17–19 years | 185 (43.7) | 55 (48.7) | 130 (43.2) | ||
| BMI | Underweight | 41 (9.7) | 26 (63.4) | 15 (36.6) | 0.001 * |
| Normal | 315 (74.5) | 51 (16.2) | 264 (83.8) | ||
| Overweight/obese | 67 (15.8) | 38 (56.8) | 29 (43.3) | ||
| Household Size | Average | 359 (84.9) | 94 (81.7) | 265 (86.0) | 0.272 |
| Above Average | 64 (14.8) | 21 (18.3) | 43 (14.0) | ||
| Place of Residence | Low density | 72 (17.0) | 21 (18.3) | 51 (16.6) | 0.630 |
| Middle density | 98 (23.2) | 23 (20.0) | 75 (24.4) | ||
| High density | 153 (59.8) | 71 (61.7) | 182 (59.1) | ||
| Family Structure | Both parents | 282 (66.7) | 80 (69.6) | 202 (65.6) | 0.253 |
| Single parent | 79 (18.7) | 16 (13.9) | 63 (20.5) | ||
| Relatives/guardians | 52 (12.3) | 14 (12.2) | 38 (12.3) | ||
| Child headed | 7 (1.7) | 4 (3.5) | 3 (1.0) | ||
| Other | 3 (0.4) | 1 (0.9) | 2 (0.6) | ||
| Education level of HH | No formal education | 19 (4.5) | 12 (10.4) | 7 (2.3) | 0.001 * |
| Primary education | 15 (3.5) | 9 (7.8) | 6 (1.9) | ||
| Ordinary education | 147 (34.6) | 41 (35.7) | 106 (34.4) | ||
| Tertiary education | 242 (57.2) | 53 (46.1) | 189 (61.4) | ||
| Employment status of HH | Formally employed | 228 (53.9) | 64 (55.7) | 164 (53.2) | 0.010 * |
| Unemployed | 23 (5.4) | 12 (10.4) | 11 (3.6) | ||
| Entrepreneur | 172 (40.7) | 39 (33.9) | 133 (43.2) | ||
| Variable | Obesity Awareness | ||||
|---|---|---|---|---|---|
| Total n (%) | Low n (%) | High n (%) | p Value 1 | ||
| BtC | Fewer | 213 (50.4) | 48 (41.7) | 165 (53.6) | 0.038 * |
| More | 210 (49.6) | 67 (58.3) | 143 (46.4) | ||
| SE | Low | 192 (45.3) | 65 (56.5) | 127 (41.2) | 0.005 * |
| High | 231 (54.6) | 50 (43.5) | 181 (58.8) | ||
| PAS | Inadequate | 214 (50.6) | 70 (60.9) | 144 (46.8) | 0.010 * |
| Adequate | 209 (49.4) | 45 (39.1) | 164 (53.2) | ||
| FHS | Inadequate | 221 (52.2) | 71 (61.7) | 150 (48.7) | 0.017 * |
| Adequate | 202 (47.8) | 44 (38.3) | 158 (51.3) | ||
| NKS | Inadequate | 171 (40.4) | 61 (53.0) | 110 (35.7) | 0.001 * |
| Adequate | 252 (59.6) | 54 (47.0) | 198 (64.3) | ||
| Variable | Gender | Obesity Awareness | |||||||
|---|---|---|---|---|---|---|---|---|---|
| Total n (%) | Male n (%) | Female n (%) | p-Value | Totals n (%) | Low n (%) | High n (%) | p-Value | ||
| BMI | Underweight | 41 (9.7) | 20 (48.8) | 21 (51.2) | 0.002 * | 41 (9.7) | 26 (63.4) | 15 (36.6) | 0.001 * |
| Normal | 315 (74.5) | 160 (50.8) | 155 (49.2) | 315 (74.5) | 51 (16.2) | 264 (83.8) | |||
| Overweight/Obese | 67 (15.8) | 18 (26.9) | 49 (73.1) | 67 (15.8) | 38 (56.7) | 29 (43.3) | |||
| WHR | Normal | 349 (82.5) | 166 (44.7) | 205 (55.3) | 0.023 * | 371 (87.8) | 99 (86.1) | 272 (88.3) | 0.535 |
| High | 52 (12.3) | 32 (61.5) | 20 (38.5) | 52 (12.2) | 16 (13.9) | 36 (11.7) | |||
| WtHR | Normal | 373 (88.2) | 184 (49.3) | 189 (50.7) | 0.005 * | 373 (88.2) | 94 (81.7) | 279 (90.6) | 0.012 * |
| High | 50 (11.8) | 14 (28.0) | 36 (72.0) | 50 (11.2) | 21 (18.3) | 29 (9.4) | |||
| Variable | B | S.E. | p-Value | Odds Ratio (OR) | 95% C.I. for OR | |
|---|---|---|---|---|---|---|
| Lower | Upper | |||||
| Boys | −0.42 | 0.33 | 0.204 | 0.66 | 0.34 | 1.26 |
| Age group (14–16 years) | −0.43 | 0.31 | 0.172 | 0.65 | 0.35 | 1.20 |
| Location (LDS) | 0.28 | 0.52 | 0.597 | 1.32 | 0.47 | 3.69 |
| HH No formal education | 2.24 | 0.74 | 0.003 * | 9.412 | 2.20 | 40.36 |
| Overweight and obese (BMI) | −0.26 | 0.55 | 0.614 | 0.76 | 0.26 | 2.21 |
| Barriers to Change (More) | 0.47 | 0.32 | 0.144 | 1.59 | 0.85 | 2.97 |
| Physical Activity (Inadequate) | 0.39 | 0.33 | 0.227 | 1.48 | 0.78 | 2.80 |
| Food Habits (Inadequate) | 0.95 | 0.34 | 0.005 * | 2.58 | 1.33 | 5.01 |
| NKS (Inadequate) | 0.25 | 0.33 | 0.447 | 1.28 | 0.674 | 2.44 |
| Constant | 0.98 | 1.27 | 0.439 | 2.67 | ||
Disclaimer/Publisher’s Note: The statements, opinions and data contained in all publications are solely those of the individual author(s) and contributor(s) and not of MDPI and/or the editor(s). MDPI and/or the editor(s) disclaim responsibility for any injury to people or property resulting from any ideas, methods, instructions or products referred to in the content. |
© 2023 by the authors. Licensee MDPI, Basel, Switzerland. This article is an open access article distributed under the terms and conditions of the Creative Commons Attribution (CC BY) license (https://creativecommons.org/licenses/by/4.0/).
Share and Cite
Pencil, A.; Matsungo, T.M.; Hongu, N.; Hayami, N. Prevalence of Obesity and the Factors Associated with Low Obesity Awareness among Urban Adolescents in Harare, Zimbabwe. Nutrients 2023, 15, 2302. https://doi.org/10.3390/nu15102302
Pencil A, Matsungo TM, Hongu N, Hayami N. Prevalence of Obesity and the Factors Associated with Low Obesity Awareness among Urban Adolescents in Harare, Zimbabwe. Nutrients. 2023; 15(10):2302. https://doi.org/10.3390/nu15102302
Chicago/Turabian StylePencil, Ashleigh, Tonderayi M. Matsungo, Nobuko Hongu, and Naomi Hayami. 2023. "Prevalence of Obesity and the Factors Associated with Low Obesity Awareness among Urban Adolescents in Harare, Zimbabwe" Nutrients 15, no. 10: 2302. https://doi.org/10.3390/nu15102302
APA StylePencil, A., Matsungo, T. M., Hongu, N., & Hayami, N. (2023). Prevalence of Obesity and the Factors Associated with Low Obesity Awareness among Urban Adolescents in Harare, Zimbabwe. Nutrients, 15(10), 2302. https://doi.org/10.3390/nu15102302