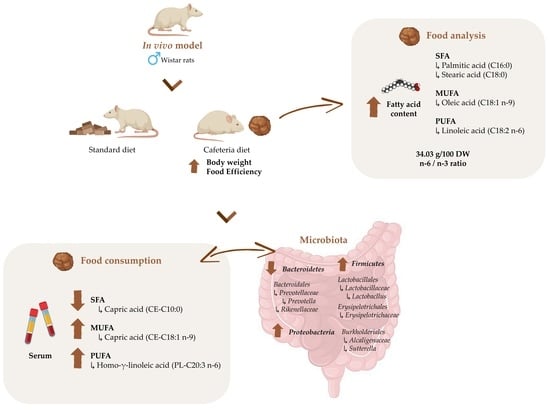
Characterization of the Cafeteria Diet as Simulation of the Human Western Diet and Its Impact on the Lipidomic Profile and Gut Microbiota in Obese Rats
Abstract
1. Introduction
2. Materials and Methods
2.1. Diets
2.2. Fatty acid Composition of Cafeteria Diet
2.3. Animal Procedures
2.4. Fatty Acid Profiling of Serum Cholesterol and Phospholipids Fractions
2.5. Gut Microbiota Analysis from Male Wistar Rats by Illumina Mi-Seq Sequencing
2.6. Statistical Analysis
3. Results
3.1. Fatty Acid Profile of the Cafeteria Diet as a Model of a Western Diet
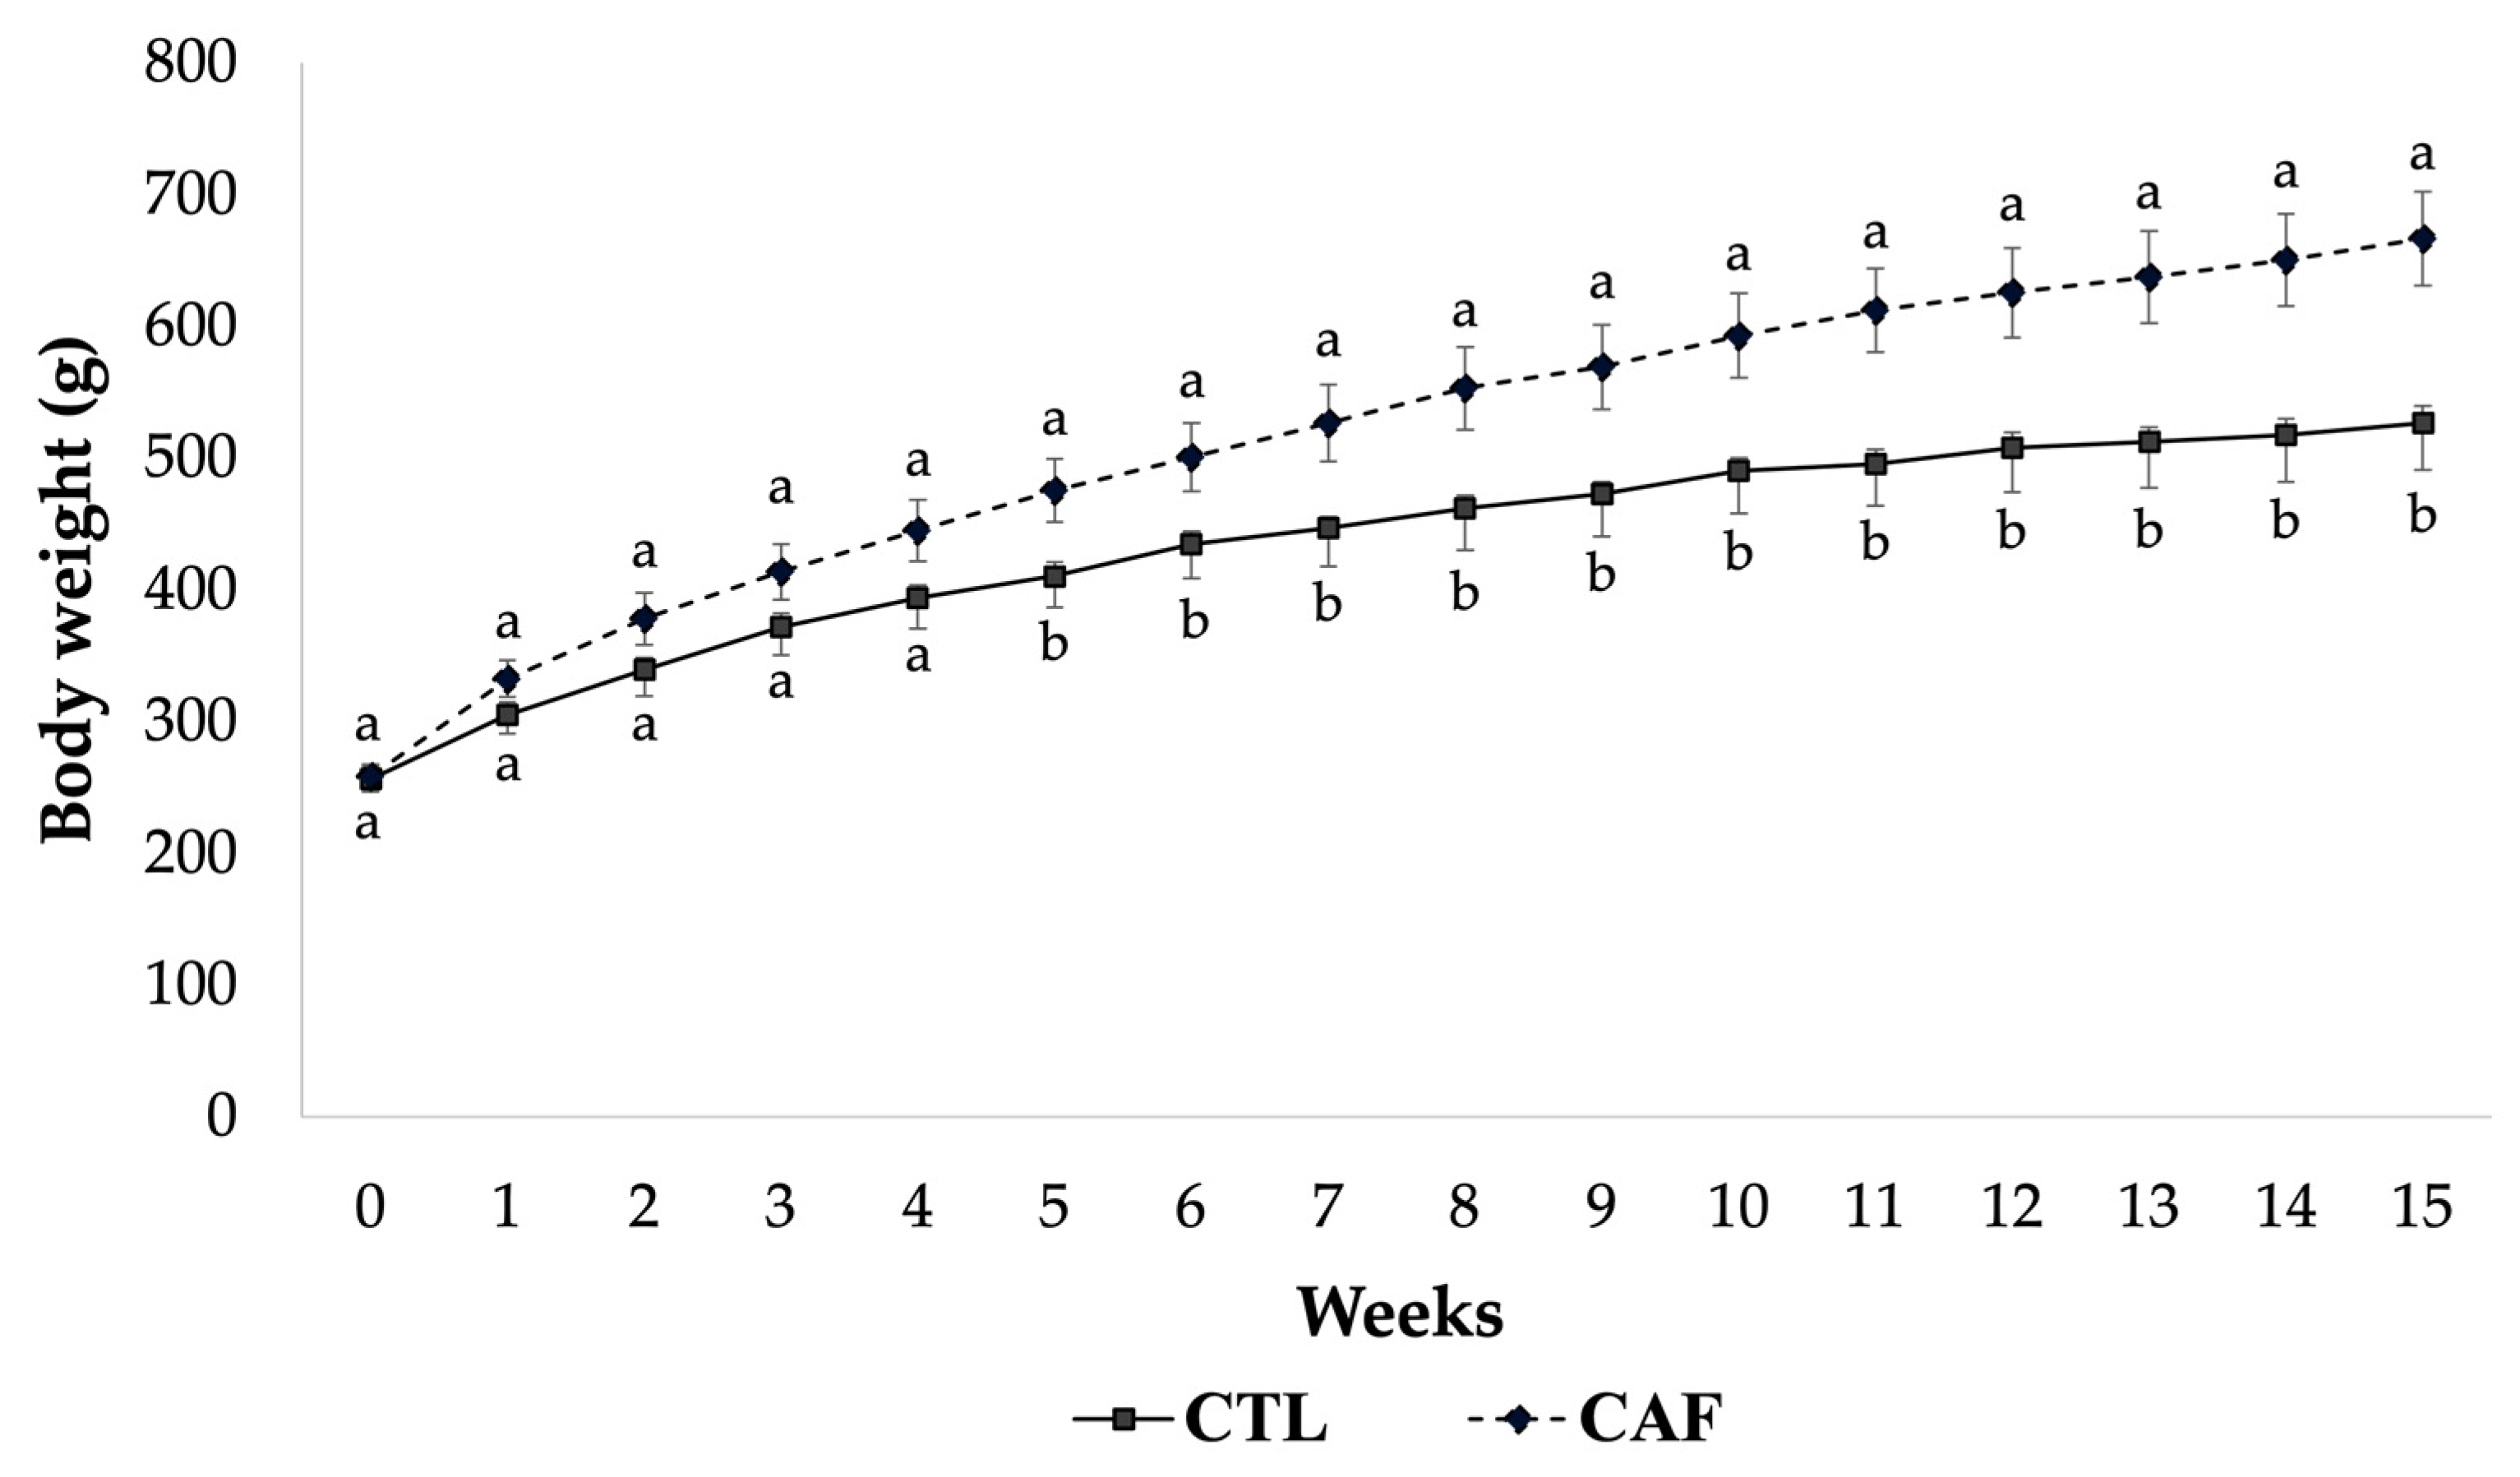
3.2. Effect of Cafeteria Diet on Body Weight and Biometric Parameters in Male Wistar Rats
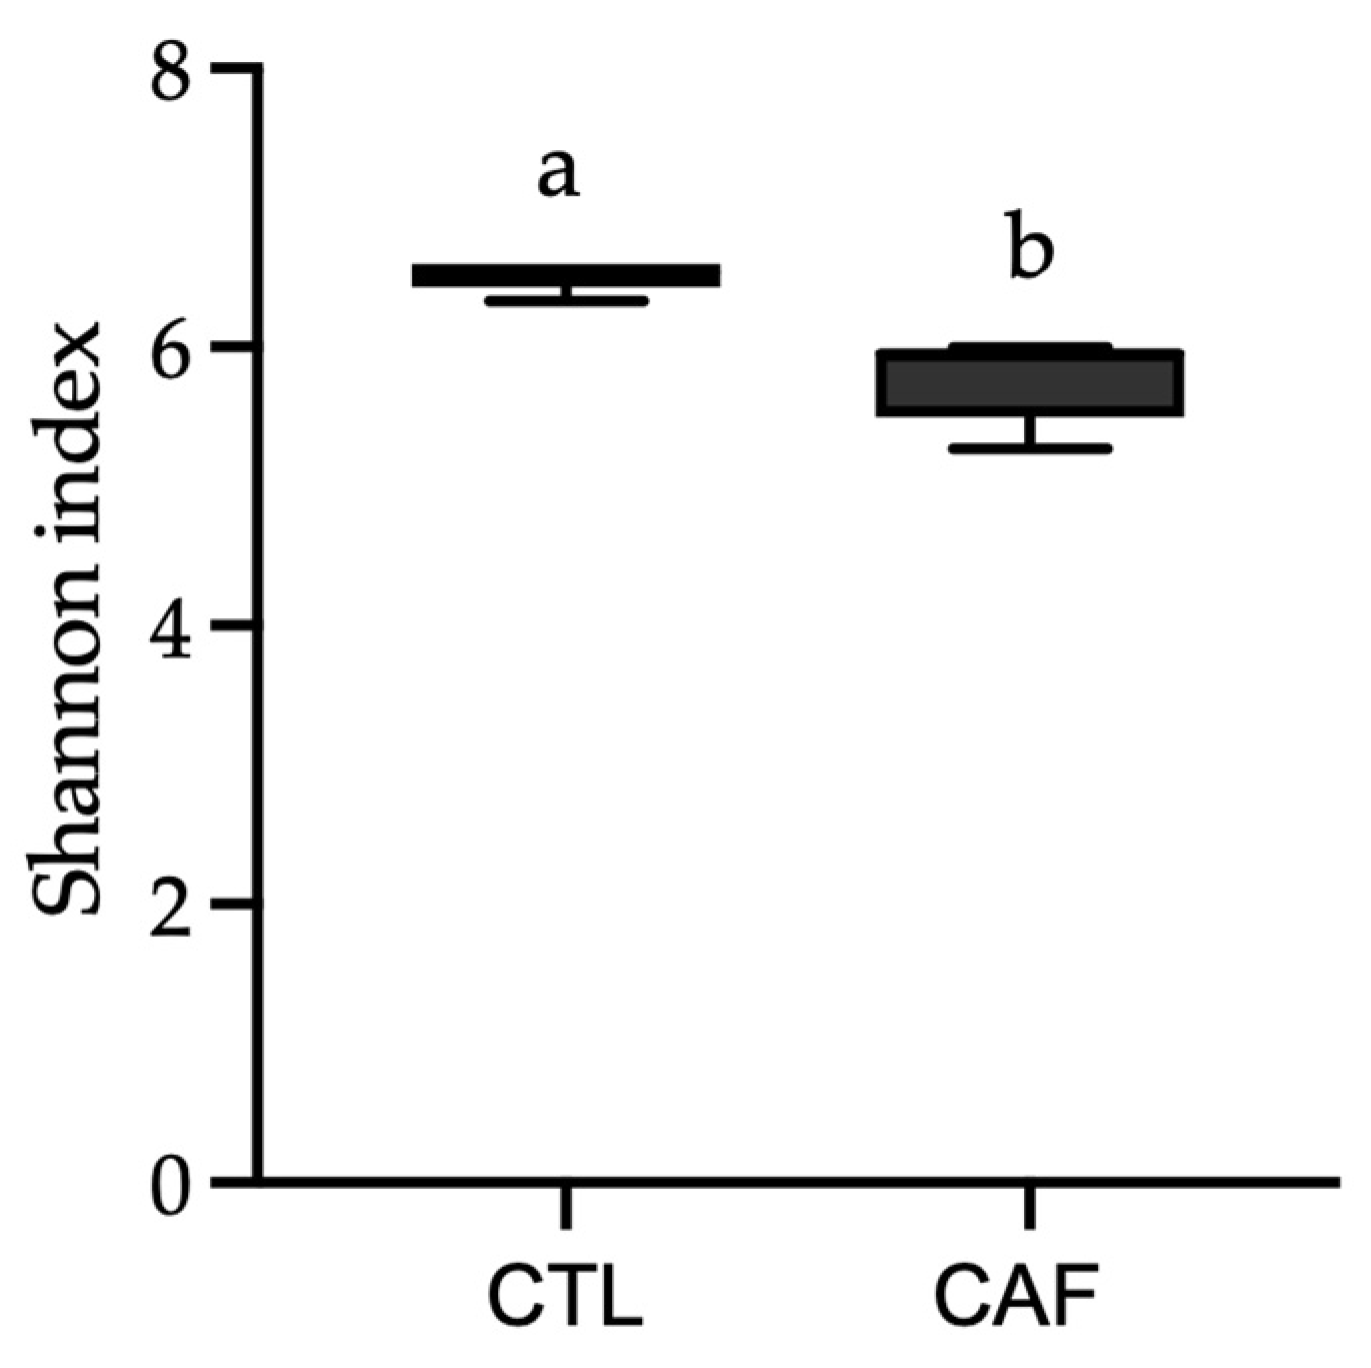
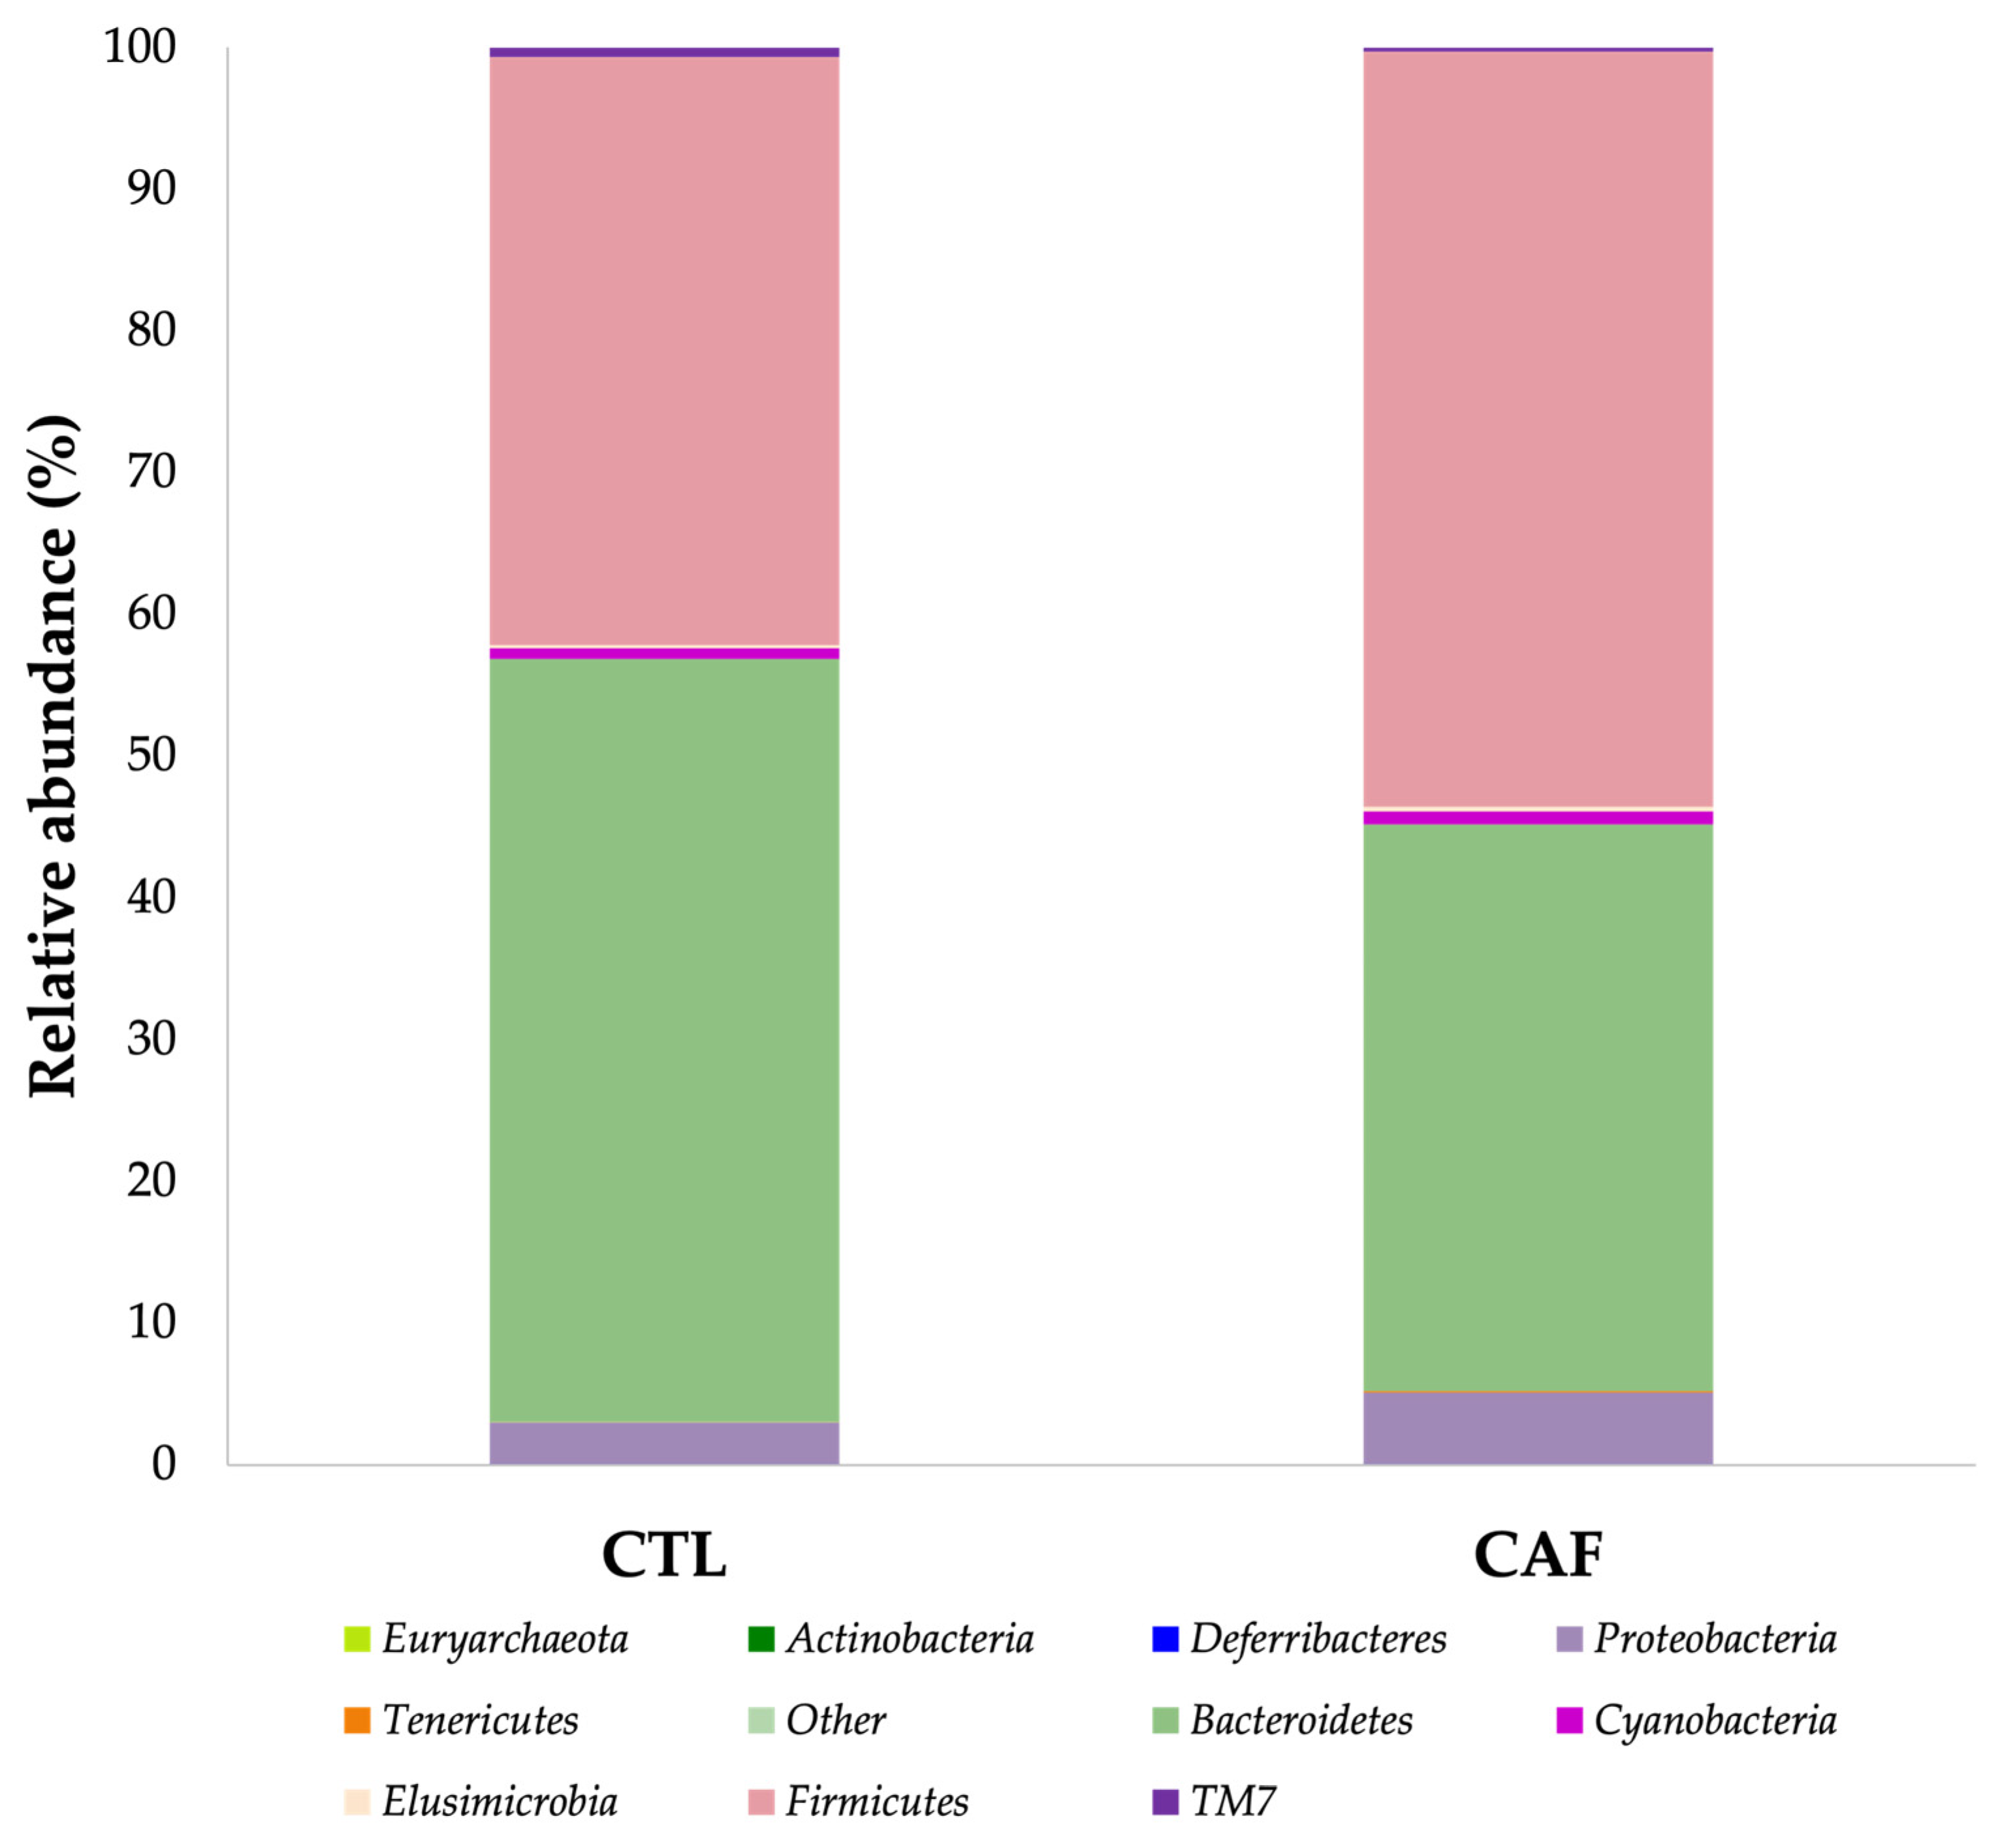
3.3. Shifts in Gut Microbiota after Eating Cafeteria Diet for 15 Weeks in Male Wistar Rats
3.4. Lipid Metabolism Is Altered after Eating Cafeteria Diet for 15 Weeks in Male Wistar Rats
3.5. Alterations in the Host-Microbiome Lipid Co-Metabolism
4. Discussion
5. Conclusions
Author Contributions
Funding
Institutional Review Board Statement
Informed Consent Statement
Data Availability Statement
Acknowledgments
Conflicts of Interest
References
- Kearney, J. Food Consumption Trends and Drivers. Philos. Trans. R. Soc. Lond. B. Biol. Sci. 2010, 365, 2793–2807. [Google Scholar] [CrossRef] [PubMed]
- Zinöcker, M.K.; Lindseth, I.A. The Western Diet-Microbiome-Host Interaction and Its Role in Metabolic Disease. Nutrients 2018, 10, 365. [Google Scholar] [CrossRef]
- Crovesy, L.; Rosado, E.L. Interaction between Genes Involved in Energy Intake Regulation and Diet in Obesity. Nutrition 2019, 67–68, 110547. [Google Scholar] [CrossRef]
- Pruszyńska-Oszmałek, E.; Wojciechowska, M.; Sassek, M.; Krauss, H.; Leciejewska, N.; Szczepankiewicz, D.; Ślósarz, P.; Nogowski, L.; Kołodziejski, P.A. The Long-Term Effects of High-Fat and High-Protein Diets on the Metabolic and Endocrine Activity of Adipocytes in Rats. Biology 2021, 10, 339. [Google Scholar] [CrossRef] [PubMed]
- Lalanza, J.F.; Snoeren, E.M.S. The Cafeteria Diet: A Standardized Protocol and Its Effects on Behavior. Neurosci. Biobehav. Rev. 2021, 122, 92–119. [Google Scholar] [CrossRef] [PubMed]
- Ribaroff, G.A.; Wastnedge, E.; Drake, A.J.; Sharpe, R.M.; Chambers, T.J.G. Animal Models of Maternal High Fat Diet Exposure and Effects on Metabolism in Offspring: A Meta-Regression Analysis. Obes. Rev. 2017, 18, 673–686. [Google Scholar] [CrossRef]
- Martínez-Micaelo, N.; González-Abuín, N.; Terra, X.; Ardévol, A.; Pinent, M.; Petretto, E.; Behmoaras, J.; Blay, M. Identification of a Nutrient-Sensing Transcriptional Network in Monocytes by Using Inbred Rat Models on a Cafeteria Diet. Dis. Model. Mech. 2016, 9, 1231–1239. [Google Scholar] [CrossRef]
- de la Garza, A.L.; Treviño-de Alba, C.; Cárdenas-Pérez, R.E.; Camacho, A.; Gutierrez-Lopez, M.; Castro, H. Chapter 6—Fatty Acid Intake during Perinatal Periods; Vinciguerra, M., Cordero Sanchez, P., Eds.; Academic Press: Cambridge, MA, USA, 2021; pp. 135–154. ISBN 978-0-12-813862-5. [Google Scholar]
- Simopoulos, A.P. An Increase in the Omega-6/Omega-3 Fatty Acid Ratio Increases the Risk for Obesity. Nutrients 2016, 8, 128. [Google Scholar] [CrossRef]
- DiNicolantonio, J.J.; O’Keefe, J. The Importance of Maintaining a Low Omega-6/Omega-3 Ratio for Reducing the Risk of Autoimmune Diseases, Asthma, and Allergies. Mo. Med. 2021, 118, 453–459. [Google Scholar]
- Ghosh, S.; Molcan, E.; DeCoffe, D.; Dai, C.; Gibson, D.L. Diets Rich in N-6 PUFA Induce Intestinal Microbial Dysbiosis in Aged Mice. Br. J. Nutr. 2013, 110, 515–523. [Google Scholar] [CrossRef]
- Machate, D.J.; Figueiredo, P.S.; Marcelino, G.; Guimarães, R.D.C.A.; Hiane, P.A.; Bogo, D.; Pinheiro, V.A.Z.; Oliveira, L.C.S.d.; Pott, A. Fatty Acid Diets: Regulation of Gut Microbiota Composition and Obesity and Its Related Metabolic Dysbiosis. Int. J. Mol. Sci. 2020, 21, 4093. [Google Scholar] [CrossRef]
- Magne, F.; Gotteland, M.; Gauthier, L.; Zazueta, A.; Pesoa, S.; Navarrete, P.; Balamurugan, R. The Firmicutes/Bacteroidetes Ratio: A Relevant Marker of Gut Dysbiosis in Obese Patients? Nutrients 2020, 12, 1474. [Google Scholar] [CrossRef] [PubMed]
- Alemao, C.A.; Budden, K.F.; Gomez, H.M.; Rehman, S.F.; Marshall, J.E.; Shukla, S.D.; Donovan, C.; Forster, S.C.; Yang, I.A.; Keely, S.; et al. Impact of Diet and the Bacterial Microbiome on the Mucous Barrier and Immune Disorders. Allergy 2021, 76, 714–734. [Google Scholar] [CrossRef] [PubMed]
- Zhang, X.; Coker, O.O.; Chu, E.S.; Fu, K.; Lau, H.C.H.; Wang, Y.-X.; Chan, A.W.H.; Wei, H.; Yang, X.; Sung, J.J.Y.; et al. Dietary Cholesterol Drives Fatty Liver-Associated Liver Cancer by Modulating Gut Microbiota and Metabolites. Gut 2021, 70, 761–774. [Google Scholar] [CrossRef] [PubMed]
- Pedreschi, R.; Hollak, S.; Harkema, H.; Otma, E.; Robledo, P.; Westra, E.; Somhorst, D.; Ferreyra, R.; Defilippi, B.G. Impact of Postharvest Ripening Strategies on ‘Hass’ Avocado Fatty Acid Profiles. S. Afr. J. Bot. 2016, 103, 32–35. [Google Scholar] [CrossRef]
- Castillo, E.C.; Elizondo-Montemayor, L.; Hernández-Brenes, C.; Rodríguez-Sánchez, D.G.; Silva-Platas, C.; Marín-Obispo, L.M.; Rodríguez-Gutierrez, N.A.; Treviño, V.; García-Rivas, G. Integrative Analysis of Lipid Profiles in Plasma Allows Cardiometabolic Risk Factor Clustering in Children with Metabolically Unhealthy Obesity. Oxid. Med. Cell. Longev. 2020, 2020, 2935278. [Google Scholar] [CrossRef]
- Etxeberria, U.; De La Garza, A.L.; Alfredo Martínez, J.; Milagro, F.I. Biocompounds Attenuating the Development of Obesity and Insulin Resistance Produced by a High-Fat Sucrose Diet. Nat. Prod. Commun. 2015, 10, 1417–1420. [Google Scholar] [CrossRef]
- de la Garza, A.L.; Romero-Delgado, B.; Martínez-Tamez, A.M.; Cárdenas-Tueme, M.; Camacho-Zamora, B.D.; Matta-Yee-Chig, D.; Sánchez-Tapia, M.; Torres, N.; Camacho-Morales, A. Maternal Sweeteners Intake Modulates Gut Microbiota and Exacerbates Learning and Memory Processes in Adult Male Offspring. Front. Pediatr. 2022, 9, 746437. [Google Scholar] [CrossRef]
- Rakhra, V.; Galappaththy, S.L.; Bulchandani, S.; Cabandugama, P.K. Obesity and the Western Diet: How We Got Here. Mo. Med. 2020, 117, 536–538. [Google Scholar]
- Gual-Grau, A.; Guirro, M.; Mayneris-Perxachs, J.; Arola, L.; Boqué, N. Impact of Different Hypercaloric Diets on Obesity Features in Rats: A Metagenomics and Metabolomics Integrative Approach. J. Nutr. Biochem. 2019, 71, 122–131. [Google Scholar] [CrossRef]
- Boqué, N.; Campión, J.; de la Iglesia, R.; de la Garza, A.L.; Milagro, F.I.; San Román, B.; Bañuelos, O.; Martínez, J.A. Screening of Polyphenolic Plant Extracts for Anti-Obesity Properties in Wistar Rats. J. Sci. Food Agric. 2013, 93, 1226–1232. [Google Scholar] [CrossRef] [PubMed]
- Cardenas-Perez, R.E.; Fuentes-Mera, L.; De La Garza, A.L.; Torre-Villalvazo, I.; Reyes-Castro, L.A.; Rodriguez-Rocha, H.; Garcia-Garcia, A.; Corona-Castillo, J.C.; Tovar, A.R.; Zambrano, E.; et al. Maternal Overnutrition by Hypercaloric Diets Programs Hypothalamic Mitochondrial Fusion and Metabolic Dysfunction in Rat Male Offspring. Nutr. Metab. 2018, 15, 38. [Google Scholar] [CrossRef] [PubMed]
- Monteiro, C.A.; Cannon, G.; Levy, R.B.; Moubarac, J.-C.; Louzada, M.L.C.; Rauber, F.; Khandpur, N.; Cediel, G.; Neri, D.; Martinez-Steele, E.; et al. Ultra-Processed Foods: What They Are and How to Identify Them. Public Health Nutr. 2019, 22, 936–941. [Google Scholar] [CrossRef] [PubMed]
- Mayerhofer, A.; Dietrich, K.-G.; Urbanski, H.F.; Köhn, F.-M.; Pickl, U.; Trottmann, M.; Kievit, P.; Welter, H. Palmitic Acid Targets Human Testicular Peritubular Cells and Causes a Pro-Inflammatory Response. J. Clin. Med. 2020, 9, 2655. [Google Scholar] [CrossRef] [PubMed]
- Saraswathi, V.; Kumar, N.; Gopal, T.; Bhatt, S.; Ai, W.; Ma, C.; Talmon, G.A.; Desouza, C. Lauric Acid versus Palmitic Acid: Effects on Adipose Tissue Inflammation, Insulin Resistance, and Non-Alcoholic Fatty Liver Disease in Obesity. Biology 2020, 9, 346. [Google Scholar] [CrossRef] [PubMed]
- Hua, M.-C.; Su, H.-M.; Lai, M.-W.; Yao, T.-C.; Tsai, M.-H.; Liao, S.-L.; Lai, S.-H.; Huang, J.-L. Palmitoleic and Dihomo-γ-Linolenic Acids Are Positively Associated with Abdominal Obesity and Increased Metabolic Risk in Children. Front. Pediatr. 2021, 9, 628496. [Google Scholar] [CrossRef]
- Bermúdez-Cardona, J.; Velásquez-Rodríguez, C. Profile of Free Fatty Acids and Fractions of Phospholipids, Cholesterol Esters, and Triglycerides in Serum of Obese Youth with and without Metabolic Syndrome. Nutrients 2016, 8, 54. [Google Scholar] [CrossRef]
- Sampath, H.; Ntambi, J.M. The Fate and Intermediary Metabolism of Stearic Acid. Lipids 2005, 40, 1187–1191. [Google Scholar] [CrossRef]
- Johnston, L.W.; Harris, S.B.; Retnakaran, R.; Zinman, B.; Giacca, A.; Liu, Z.; Bazinet, R.P.; Hanley, A.J. Longitudinal Associations of Phospholipid and Cholesteryl Ester Fatty Acids with Disorders Underlying Diabetes. J. Clin. Endocrinol. Metab. 2016, 101, 2536–2544. [Google Scholar] [CrossRef]
- Noble, E.E.; Hsu, T.M.; Kanoski, S.E. Gut to brain dysbiosis: Mechanisms linking western diet consumption, the microbiome, and cognitive impairment. Front. Behav. Neurosci. 2017, 11, 1–10. [Google Scholar] [CrossRef]
- Li, H.; Liu, Y.; Zhang, X.; Xu, Q.; Zhang, Y.; Xue, C.; Guo, C. Medium-Chain Fatty Acids Decrease Serum Cholesterol via Reduction of Intestinal Bile Acid Reabsorption in C57BL/6J Mice. Nutr. Metab. 2018, 15, 37. [Google Scholar] [CrossRef] [PubMed]
- Dekkers, K.F.; Sayols-Baixeras, S.; Baldanzi, G.; Nowak, C.; Hammar, U.; Nguyen, D.; Varotsis, G.; Brunkwall, L.; Nielsen, N.; Eklund, A.C.; et al. An Online Atlas of Human Plasma Metabolite Signatures of Gut Microbiome Composition. Nat. Commun. 2022, 13, 5370. [Google Scholar] [CrossRef] [PubMed]
- de Wit, N.J.W.; Derrien, M.; Bosch-Vermeulen, H.; Oosterink, E.; Keshtkar, S.; Duval, C.; de Vogel-van den Bosch, J.; Kleerebezem, M.; Müller, M.; van der Meer, R. Saturated Fat Stimulates Obesity and Hepatic Steatosis and Affects Gut Microbiota Composition by an Enhanced Overflow of Dietary Fat to the Distal Intestine. Am. J. Physiol. Gastrointest. Liver Physiol. 2012, 303, G589–G599. [Google Scholar] [CrossRef] [PubMed]
- Etxeberria, U.; Milagro, F.; González- Navarro, C.J.; Alfredo Martínez, J. Role of Gut Microbiota in Obesity. An. Real Acad. Farm. 2016, 82, 234–259. [Google Scholar] [CrossRef]
- Gomes, A.C.; Hoffmann, C.; Mota, J.F. Gut Microbiota Is Associated with Adiposity Markers and Probiotics May Impact Specific Genera. Eur. J. Nutr. 2020, 59, 1751–1762. [Google Scholar] [CrossRef]
- Hu, Y.; Xu, J.; Sheng, Y.; Liu, J.; Li, H.; Guo, M.; Xu, W.; Luo, Y.; Huang, K.; He, X. Pleurotus Ostreatus Ameliorates Obesity by Modulating the Gut Microbiota in Obese Mice Induced by High-Fat Diet. Nutrients 2022, 14, 1868. [Google Scholar] [CrossRef]
- Duckett, S.K.; Volpi-Lagreca, G.; Alende, M.; Long, N.M. Palmitoleic Acid Reduces Intramuscular Lipid and Restores Insulin Sensitivity in Obese Sheep. Diabetes Metab. Syndr. Obes. 2014, 7, 553–563. [Google Scholar] [CrossRef]
- Bailén, M.; Bressa, C.; Martínez-López, S.; González-Soltero, R.; Montalvo Lominchar, M.G.; San Juan, C.; Larrosa, M. Microbiota Features Associated with a High-Fat/Low-Fiber Diet in Healthy Adults. Front. Nutr. 2020, 7, 583608. [Google Scholar] [CrossRef]
- Myles, I.A.; Fontecilla, N.M.; Janelsins, B.M.; Vithayathil, P.J.; Segre, J.A.; Datta, S.K. Parental Dietary Fat Intake Alters Offspring Microbiome and Immunity. J. Immunol. 2013, 191, 3200–3209. [Google Scholar] [CrossRef]
- Tseng, C.-H.; Wu, C.-Y. The Gut Microbiome in Obesity. J. Formos. Med. Assoc. 2019, 118, S3–S9. [Google Scholar] [CrossRef]
- Requena, T.; Martínez-Cuesta, M.C.; Peláez, C. Diet and Microbiota Linked in Health and Disease. Food Funct. 2018, 9, 688–704. [Google Scholar] [CrossRef] [PubMed]
- Pu, S.; Khazanehei, H.; Jones, P.J.; Khafipour, E. Interactions between Obesity Status and Dietary Intake of Monounsaturated and Polyunsaturated Oils on Human Gut Microbiome Profiles in the Canola Oil Multicenter Intervention Trial (COMIT). Front. Microbiol. 2016, 7, 1612. [Google Scholar] [CrossRef] [PubMed]
| Fatty Acids | Cafeteria Diet (g/100 g Dry Matter) * |
|---|---|
| Total saturated fatty acids (SFA) | 7.94 ± 0.05 |
| Caprylic acid C8:0 | 0.04 ± 0.00 |
| Capric acid C10:0 | 0.03 ± 0.00 |
| Lauric acid C12:0 | 0.03 ± 0.00 |
| Myristic acid C14:0 | 0.18 ± 0.00 |
| Pentadecanoic acid C15:0 | 0.02 ± 0.00 |
| Palmitic acid C16:0 | 5.19 ± 0.04 |
| Margaric acid C17:0 | 0.06 ± 0.00 |
| Stearic acid C18:0 | 2.30 ± 0.02 |
| Arachidic acid C20:0 | 0.06 ± 0.00 |
| Behenic acid C22:0 | 0.02 ± 0.00 |
| Lignoceric acid C24:0 | 0.01 ± 0.00 |
| Total monounsaturated fatty acids (MUFA) | 8.13 ± 0.082 |
| Palmitoleic acid C16:1 n-7 | 0.31 ± 0.00 |
| Heptadecenoic acid C17:1 n-7 | 0.03 ± 0.00 |
| Oleic acid C18:1 n-9 | 7.21 ± 0.07 |
| Vaccenic acid C18:1 n-7 | 0.46 ± 0.01 |
| Eicosenoic acid C20:1 n-9 | 0.11 ± 0.00 |
| Erucic acid C22:1 n-9 | 0.01 ± 0.00 |
| Total polyunsaturated fatty acids (PUFA) | 6.62 ± 0.14 |
| Linoleic acid C18:2 n-6 | 6.29 ± 0.13 |
| α-linolenic acid (ALA) C18:3 n-3 | 0.17 ± 0.00 |
| Eicosadienoic acid C20:2 n-6 | 0.07 ± 0.00 |
| Homo-γ-linoleic acid C20:3 n-6 | 0.01 ± 0.00 |
| Dihomo-γ-linolenic acid C20:3 n-3 | 0.01 ± 0.00 |
| Arachidonic acid C20:4 n-6 | 0.10 ± 0.00 |
| Docosatetraenoic acid C22:4 n-6 | 0.02 ± 0.00 |
| Docosapentaenoic acid (DPA) C22:5 n-3 | 0.01 ± 0.00 |
| Total n-3 | 0.19 ± 0.00 |
| Total n-6 | 6.49 ± 0.14 |
| Total n-7 | 0.80 ± 0.01 |
| Total n-9 | 7.33 ± 0.07 |
| n-6/n-3 ratio | 34.04 ± 0.29 |
| Parameter | CTL | CAF |
|---|---|---|
| Daily food intake (g) | 27.20 ± 0.42 a | 32.36 ± 1.23 b |
| Daily caloric intake (kcal) | 91.13 ± 1.42 a | 120.38 ± 4.59 b |
| Food efficiency (g/100 kcal) | 2.82 ± 0.03 a | 3.22 ± 0.12 b |
| Liver weight (%) | 2.83 ± 0.05 a | 2.50 ± 0.15 a |
| Spleen weight (%) | 0.17 ± 0.01 a | 0.12 ± 0.01 b |
| sWAT (%) | 1.23 ± 0.43 a | 1.28 ± 0.20 a |
| eWAT (%) | 2.75 ± 0.66 a | 2.63 ± 0.32 a |
| rWAT (%) | 2.87 ± 0.75 a | 3.29 ± 0.21 a |
| mWAT (%) | 2.11 ± 0.60 a | 1.63 ± 0.21 a |
| BAT (%) | 0.14 ± 0.03 a | 0.17 ± 0.02 a |
| Gastrocnemius (%) | 0.45 ± 0.03 a | 0.37 ± 0.02 a |
| Soleus (%) | 0.10 ± 0.01 a | 0.08 ± 0.01 a |
| Taxonomy | CTL | CAF |
|---|---|---|
| Phylum/Order | ||
| Actinobacteria | ||
| Bifidobacteriales | 0.00 ± 0.00 a | 0.01 ± 0.01 a |
| Coriobacteriales | 0.02 ± 0.00 a | 0.03 ± 0.02 a |
| Bacteroidetes | ||
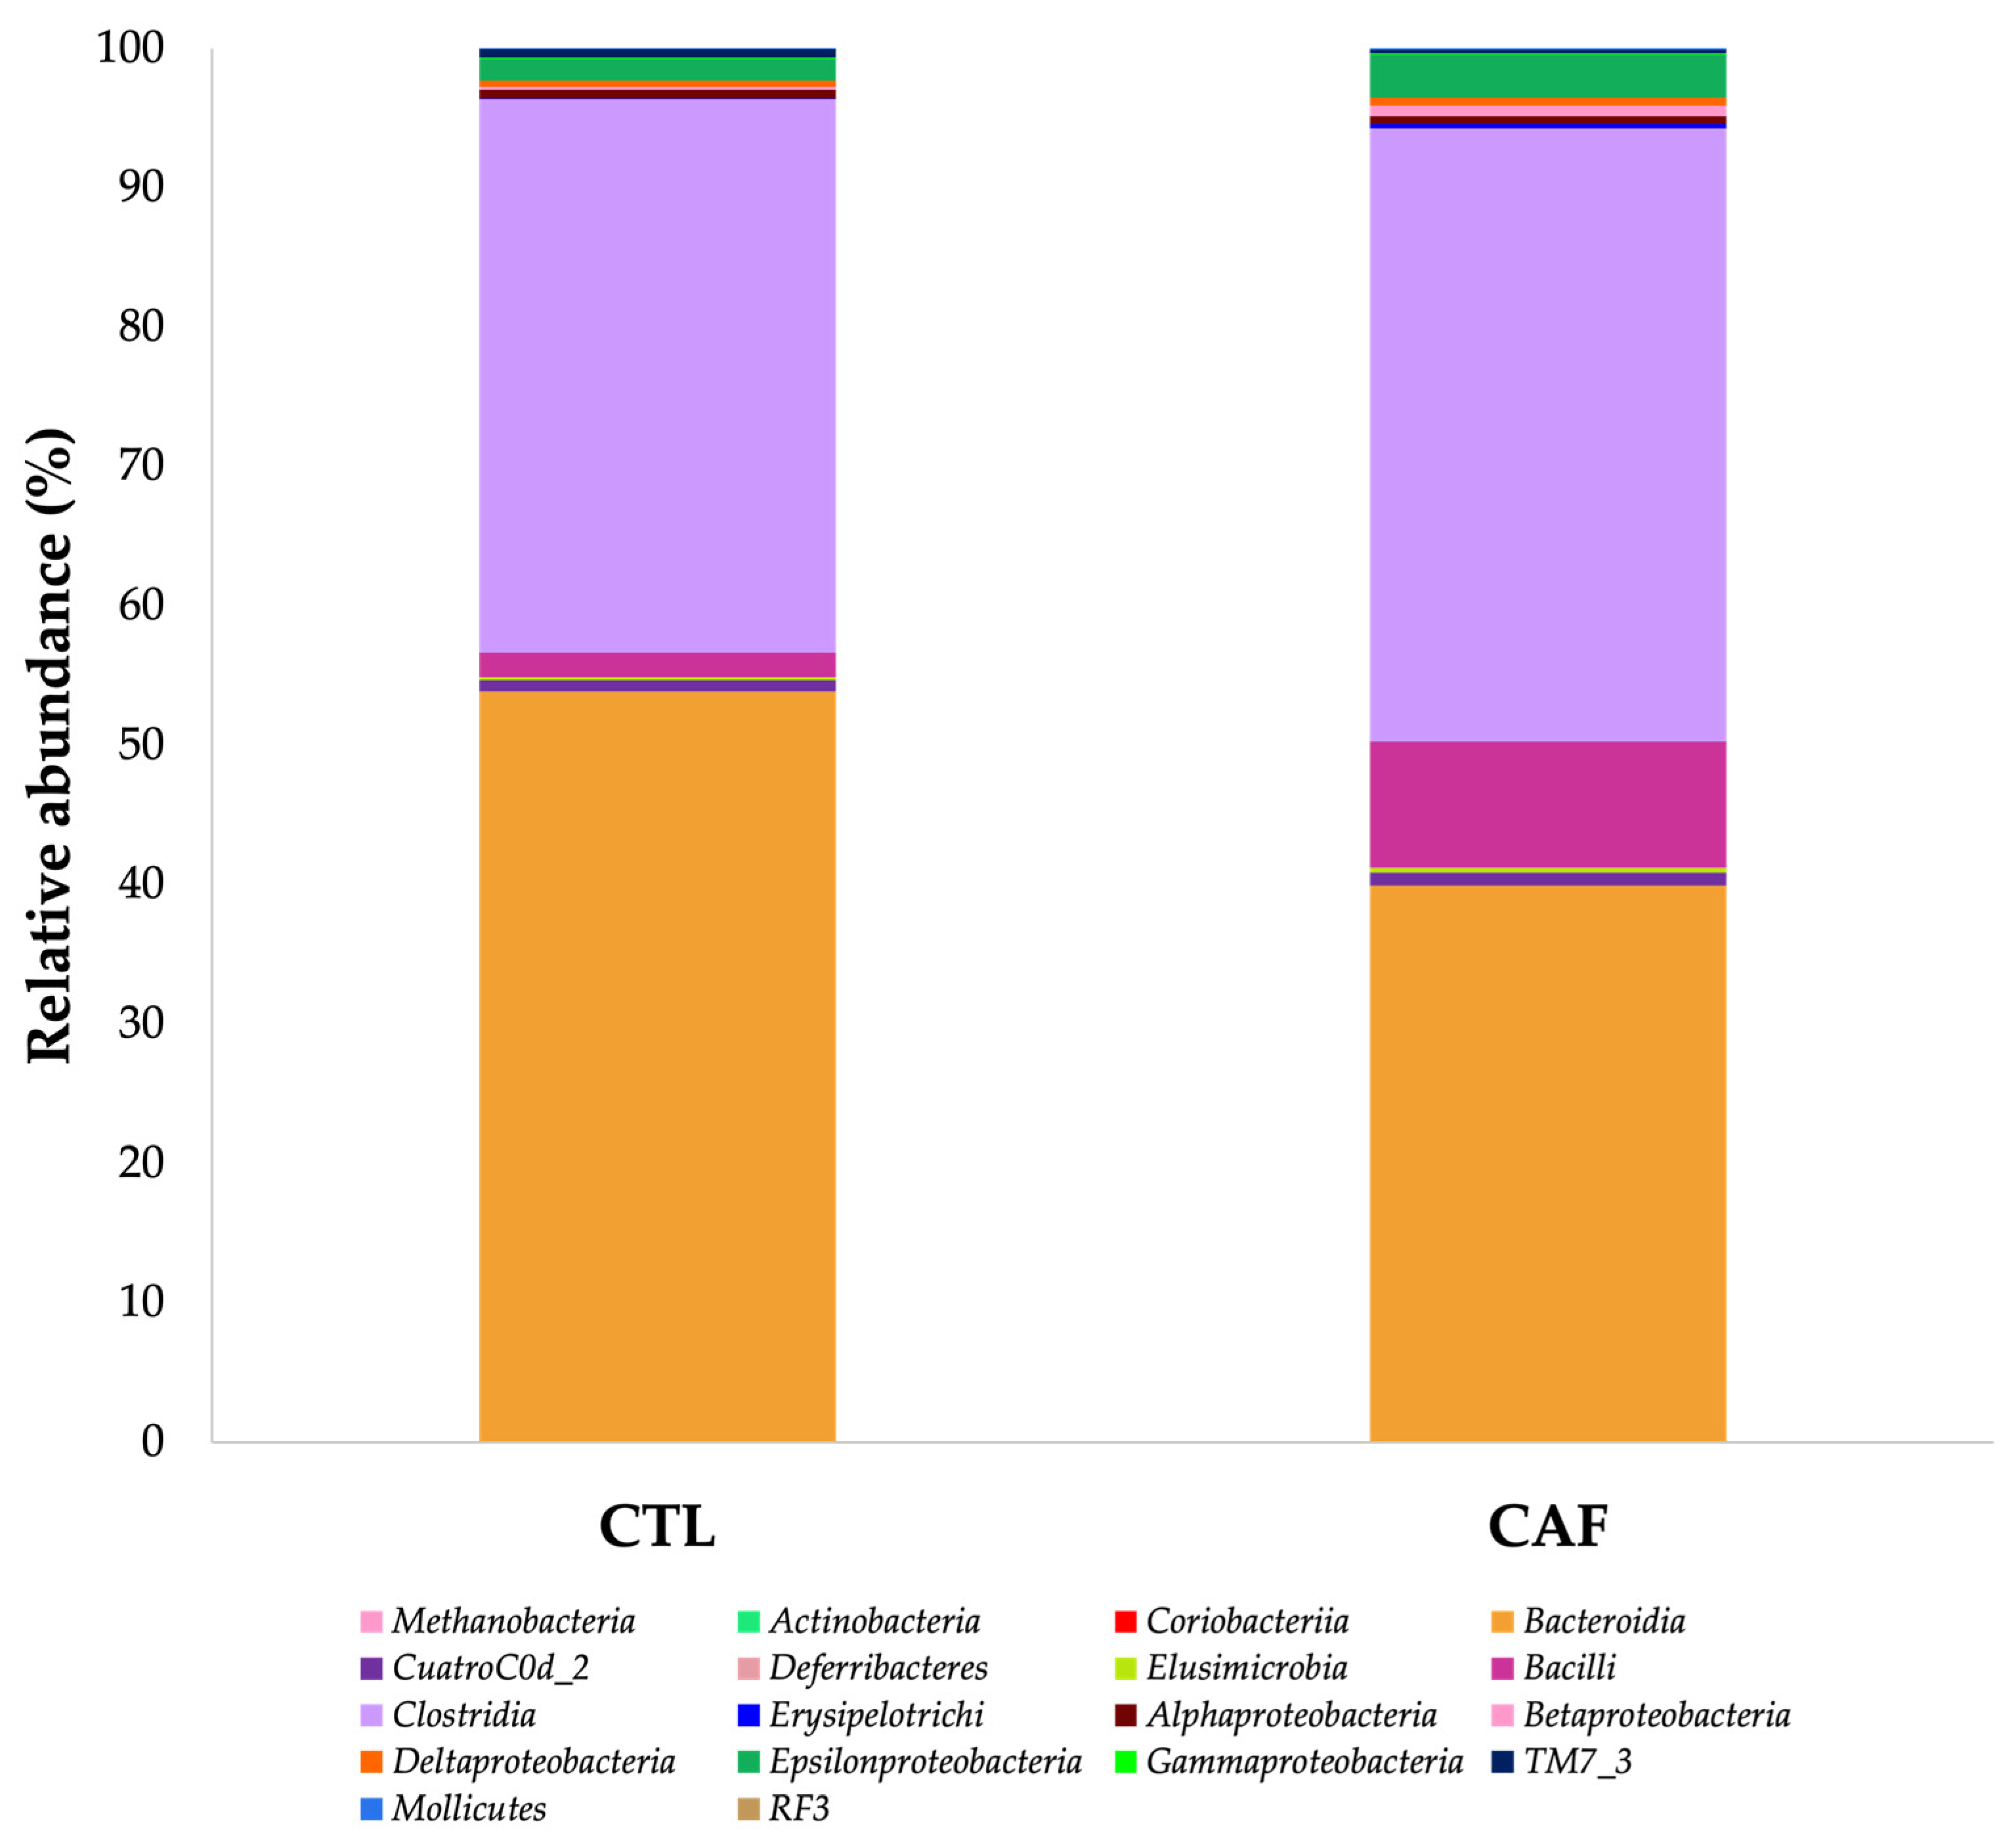
| Bacteroidales | 53.82 ± 3.68 a | 39.89 ± 3.54 b |
| Cyanobacteria | ||
| YS2 | 0.80 ± 0.18 a | 0.92 ± 0.40 a |
| Elusimicrobia | ||
| Elusimicrobiales | 0.21 ± 0.07 a | 0.34 ± 0.15 a |
| Firmicutes | ||
| Clostridiales * | 45.65 (23.47–45.87) a | 48.09 (28.72–53.56) a |
| Erysipelotrichales * | 0.04 (0.02–0.09) a | 0.25 (0.18–0.61) b |
| Lactobacillales | 1.48 ± 0.43 a | 8.82 ± 1.58 b |
| Turicibacterales | 0.27 ± 0.11 a | 0.24 ± 0.07 a |
| Proteobacteria | ||
| Burkholderiales * | 0.22 (0.20–0.27) a | 0.60 (0.50–1.09) b |
| Campylobacterales * | 1.18 (0.89–3.47) a | 1.90 (0.21–9.24) a |
| Desulfovibrionales * | 0.43 (0.11–1.02) a | 0.29 (0.08–1.99) a |
| Enterobacterales * | 0.03 (0.01–0.07) a | 0.27 (0.00–0.35) a |
| Pasteurellales | 0.05 ± 0.01 a | 0.02 ± 0.01 b |
| RF32 | 0.61 ± 0.33 a | 0.54 ± 0.20 a |
| Saccharibacteria (TM7) | ||
| CW040 | 0.64 ± 0.05 a | 0.26 ± 0.03 b |
| Tenericutes | ||
| ML615J-28 | 0.01 ± 0.01 a | 0.00 ± 0.00 a |
| RF39 * | 0.00 (0.00–0.01) a | 0.00 (0.00–0.24) a |
| Phylum/Family | ||
| Actinobacteria | ||
| Bifidobacteriaceae | 0.00 ± 0.00 a | 0.01 ± 0.01 a |
| Coriobacteriaceae | 0.02 ± 0.01 a | 0.03 ± 0.02 a |
| Micrococcaceae | 0.01 ± 0.00 a | 0.00 ± 0.00 a |
| Bacteroidetes | ||
| Bacteroidaceae | 6.43 ± 0.70 a | 8.43 ± 0.49 b |
| Barnesiellaceae | 0.00 ± 0.00 a | 0.01 ± 0.01 b |
| Dehalobacteriaceae | 0.22 ± 0.04 a | 0.19 ± 0.07 a |
| Odoribacteraceae | 0.17 ± 0.03 a | 0.25 ± 0.05 a |
| Paraprevotellaceae | 9.41 ± 1.79 a | 8.54 ± 1.92 a |
| Porphyromonadaceae | 1.60 ± 0.29 a | 2.28 ± 0.18 a |
| Prevotellaceae * | 18.86 (7.37–19.91) a | 6.80 (2.49–12.39) b |
| Rikenellaceae | 1.07 ± 0.21 a | 0.46 ± 0.08 b |
| S24-7 (Muribaculaceae) * | 21.64 (20.48–36.65) a | 20.14 (14.95–20.92) b |
| Elusimicrobia | ||
| Elusimicrobiaceae | 0.24 ± 0.08 a | 0.39 ± 0.17 a |
| Euryarchaeota | ||
| Methanobacteriaceae | 0.03 ± 0.03 a | 0.02 ± 0.01 a |
| Firmicutes | ||
| Christensenellaceae | 0.07 ± 0.01 a | 0.16 ± 0.05 a |
| Clostridiaceae | 1.75 ± 0.74 a | 1.29 ± 0.24 a |
| Erysipelotrichaceae * | 0.04 (0.02–0.10) a | 0.28 (0.19–0.71) b |
| Lachnospiraceae | 7.97 ± 1.63 a | 6.22 ± 0.60 a |
| Lactobacillaceae | 1.65 ± 0.47 a | 9.91 ± 1.70 b |
| Mogibacteriaceae | 0.26 ± 0.03 a | 0.27 ± 0.05 a |
| Peptococcaceae | 0.08 ± 0.03 a | 0.16 ± 0.03 a |
| Ruminococcaceae | 23.45 ± 2.11 a | 30.17 ± 4.81 a |
| Streptococcaceae | 0.00 ± 0.00 a | 0.01 ± 0.01 a |
| Turicibacteraceae | 0.30 ± 0.13 a | 0.27 ± 0.08 a |
| Veillonellaceae | 0.03 ± 0.01 a | 0.01 ± 0.00 a |
| Proteobacteria | ||
| Alcaligenaceae | 0.26 ± 0.01 a | 0.87 ± 0.16 b |
| Desulfovibrionaceae * | 0.50 (0.12–1.18) a | 0.31 (0.09–2.27) a |
| Enterobacteriaceae * | 0.03 (0.01–0.07) a | 0.03 (0.00–0.38) a |
| Helicobacteraceae | 1.76 ± 0.57 a | 3.50 ± 1.82 a |
| Pasteurellaceae | 0.06 ± 0.01 a | 0.02 ± 0.01 b |
| Saccharibacteria (TM7) | ||
| F16 | 0.72 ± 0.05 a | 0.30 ± 0.03 b |
| Phylum/Genus | ||
| Actinobacteria | ||
| Adlercreutzia | 0.01 ± 0.00 a | 0.01 ± 0.00 a |
| Bifidobacterium | 0.00 ± 0.00 a | 0.02 ± 0.01 a |
| Rothia | 0.01 ± 0.00 a | 0.01 ± 0.00 a |
| Bacteroidetes | ||
| Bacteroides | 11.75 ± 1.70 a | 14.05 ± 0.65 a |
| Butyricimonas | 0.29 ± 0.05 a | 0.42 ± 0.07 a |
| CF231 | 16.91 ± 3.21 a | 14.26 ± 3.44 a |
| Parabacteroides | 2.88 ± 0.56 a | 3.83 ± 0.35 a |
| Prevotella * | 32.99 (14.91–35.32) a | 12.44 (4.13–22.16) b |
| Prevotella_2 | 0.02 ± 0.01 a | 0.01 ± 0.01 a |
| Firmicutes | ||
| Allobaculum * | 0.02 (0.00–0.14) a | 0.35 (0.23–1.24) b |
| Anaerostipes * | 0.02 (0.01–0.13) a | 0.00 (0.00–0.03) b |
| Anaerotruncus * | 0.00 (0.00–0.01) a | 0.04 (0.03–0.06) b |
| Blautia | 0.75 ± 0.35 a | 1.67 ± 0.39 a |
| Butyricicoccus * | 0.04 (0.01–1.26) a | 0.32 (0.11–0.48) a |
| Clostridium | 2.39 ± 1.16 a | 1.18 ± 0.26 a |
| Clostridium_2 * | 0.10 (0.00–0.53) a | 0.00 (0.00–0.01) b |
| Coprococcus | 2.71 ± 0.58 a | 1.34 ± 0.46 a |
| Dehalobacterium | 0.39 ± 0.08 a | 0.33 ± 0.12 a |
| Dorea | 0.82 ± 0.65 a | 0.72 ± 0.15 a |
| Eubacterium | 0.00 ± 0.00 a | 0.02 ± 0.01 b |
| Faecalibacterium | 0.17 ± 0.06 a | 1.87 ± 0.91 b |
| Lactobacillus | 2.97 ± 0.86 a | 16.21 ± 2.29 b |
| Oscillospira | 16.46 ± 2.15 a | 7.98 ± 1.09 b |
| Roseburia | 0.21 ± 0.10 a | 0.37 ± 0.17 a |
| Ruminococcus * | 0.24 (0.16–0.43) a | 0.05 (0.01–1.26) a |
| Ruminococcus_2 | 8.97 ± 1.22 a | 19.53 ± 4.72 a |
| SMB53 | 0.66 ± 0.40 a | 0.83 ± 0.27 a |
| Streptococcus | 0.01 ± 0.00 a | 0.02 ± 0.01 a |
| Turicibacter | 0.57 ± 0.26 a | 0.47 ± 0.15 a |
| Veillonella | 0.05 ± 0.01 a | 0.02 ± 0.01 a |
| Proteobacteria | ||
| Aggregatibacter | 0.11 ± 0.02 a | 0.03 ± 0.01 b |
| Desulfovibrio | 0.10 ± 0.04 a | 0.11 ± 0.03 a |
| Escherichia * | 0.06 (0.03–0.14) a | 0.03 (0.00–0.06) a |
| Helicobacter | 0.07 ± 0.07 a | 0.00 ± 0.00 a |
| Sutterella | 0.46 ± 0.02 a | 1.45 ± 0.28 b |
| Fatty Acids | CTL (%) * | CAF (%) * |
|---|---|---|
| Total saturated fatty acids (SFA) | 56.61 ± 0.89 a | 57.73 ± 1.52 a |
| Caprylic acid C8:0 | 2.71 ± 0.39 a | 4.16 ± 0.75 a |
| Capric acid C10:0 | 1.64 ± 0.54 a | 1.58 ± 0.80 a |
| Lauric acid C12:0 | 1.83 ± 0.53 a | 2.46 ± 0.43 a |
| Myristic acid C14:0 | 0.85 ± 0.13 a | 1.26 ± 0.24 a |
| Pentadecanoic acid C15:0 | 0.42 ± 0.12 a | 0.36 ± 0.15 a |
| Palmitic acid C16:0 | 25.32 ± 1.54 a | 23.72 ± 1.17 a |
| Stearic acid C18:0 | 22.53 ± 0.83 a | 22.39 ± 1.15 a |
| Araquidic acid C20:0 | 0.18 ± 0.02 a | 0.25 ± 0.07 a |
| Behenic acid C22:0 | 0.28 ± 0.01 a | 0.35 ± 0.04 a |
| Lignoceric acid C24:0 | 0.84 ± 0.12 a | 1.20 ± 0.20 a |
| Total monounsaturated fatty acids (MUFA) | 6.08 ± 0.77 a | 5.74 ± 0.72 a |
| Palmitoleic acid C16:1 n-7 | 0.43 ± 0.11 a | 0.31 ± 0.06 a |
| Oleic acid C18:1 n-9 | 3.41 ± 0.66 a | 4.07 ± 0.65 a |
| Vaccenic acid C18:1 n-7 | 1.85 ± 0.09 a | 0.79 ± 0.03 b |
| Nervonic acid C24:1 n-9 | 0.39 ± 0.03 a | 0.50 ± 0.08 b |
| Total polyunsaturated fatty acids (PUFA) | 37.31 ± 1.58 a | 36.53 ± 0.99 a |
| Linoleic acid C18:2 n-6 | 8.92 ± 0.46 a | 9.11 ± 0.80 a |
| γ-linolenic acid (GLA) C18:3 n-6 | 1.71 ± 0.37 a | 2.39 ± 0.43 a |
| α-linolenic acid (ALA) C18:3 n-3 | 0.23 ± 0.03 a | 0.15 ± 0.03 b |
| Eicosadienoic acid C20:2 n-6 | 0.35 ± 0.07 a | 0.20 ± 0.02 b |
| Dihomo-γ-linoleic acid C20:3 n-6 | 0.36 ± 0.06 a | 1.91 ± 0.38 b |
| Arachidonic acid C20:4 n-6 | 18.68 ± 0.98 a | 17.11 ± 1.00 a |
| Eicosapentaenoic acid C20:5 n-3 | 0.69 ± 0.18 a | 1.30 ± 0.12 b |
| Docosapentaenoic acid C22:5 n-3 | 0.78 ± 0.10 a | 1.47 ± 0.07 b |
| Docosahexanoic acid C22:6 n-3 | 5.58 ± 1.19 a | 2.87 ± 0.18 b |
| Total n-3 | 7.28 ± 1.37 a | 5. 80 ± 0.27 a |
| Total n-6 | 30.02 ± 1.63 a | 30.73 ± 0.81 a |
| Total n-7 | 2.27 ± 0.14 a | 1.09 ± 0.08 b |
| Total n-9 | 3.80 ± 0.66 a | 4.64 ± 0.70 a |
| n-6/n-3 ratio | 4.61 ± 0.69 a | 5.34 ± 0.22 a |
| Fatty Acids | CTL (%) * | CAF (%) * |
|---|---|---|
| Total saturated fatty acids (SFA) | 51.33 ± 2.07 a | 52.24 ± 4.08 a |
| Caprylic acid C8:0 | 6.66 ± 1.24 a | 7. 30 ± 1.09 a |
| Capric acid C10:0 | 9.08 ± 0.85 a | 4.34 ± 0.45 b |
| Lauric acid C12:0 | 8.67 ± 0.83 a | 5.55 ± 0.87 b |
| Myristic acid C14:0 | 0.81 ± 0.06 a | 0.63 ± 0.06 a |
| Palmitic acid C16:0 | 14.70 ± 1.86 a | 18.57 ± 2.69 a |
| Stearic acid C18:0 | 11.38 ± 1.60 a | 15.85 ± 3.35 a |
| Total monounsaturated fatty acids (MUFA) | 11.10 ± 0.20 a | 13.28 ± 2.26 a |
| Myristotelic acid C14:1 n-5 | 1.68 ± 0.45 a | 1.13 ± 0.31 a |
| Palmitoleic acid C16:1 n-7 | 1.25 ± 0.08 a | 0.76 ± 0.11 b |
| Oleic acid C18:1 n-9 | 6.59 ± 0.67 a | 10.52 ± 1.83 b |
| Vaccenic acid C18:1 n-7 | 1.58 ± 0.20 a | 0.89 ± 0.05 b |
| Total polyunsaturated fatty acids (PUFA) | 37.57 ± 2.02 a | 34.48 ± 1.96 a |
| Linoleic acid C18:2 n-6 | 9.66 ± 2.08 a | 16.96 ± 2.16 b |
| α-linolenic acid (ALA) C18:3 n-3 | 1.00 ± 0.14 a | 0.37 ± 0.08 b |
| Dihomo-γ-linoleic acid C20:3 n-6 | 3.86 ± 1.46 a | 0.42 ± 0.05 b |
| Arachidonic acid C20:4 n-6 | 22.48 ± 1.57 a | 16.32 ± 0.96 b |
| Eicosapentaenoic acid C20:5 n-3 | 0.56 ± 0.07 a | 0.40 ± 0.10 a |
| Total n-3 | 1.56 ± 0.19 a | 0.77 ± 0.17 b |
| Total n-6 | 36.00 ± 1.97 a | 33.70 ± 1.82 a |
| Total n-7 | 2.82 ± 0.25 a | 1.63 ± 0.15 b |
| Total n-9 | 6.59 ± 0.67 a | 10.52 ± 1.83 a |
| n-6/n-3 ratio | 24.93 ± 3.88 a | 56.37 ± 15.80 a |
Disclaimer/Publisher’s Note: The statements, opinions and data contained in all publications are solely those of the individual author(s) and contributor(s) and not of MDPI and/or the editor(s). MDPI and/or the editor(s) disclaim responsibility for any injury to people or property resulting from any ideas, methods, instructions or products referred to in the content. |
© 2022 by the authors. Licensee MDPI, Basel, Switzerland. This article is an open access article distributed under the terms and conditions of the Creative Commons Attribution (CC BY) license (https://creativecommons.org/licenses/by/4.0/).
Share and Cite
de la Garza, A.L.; Martínez-Tamez, A.M.; Mellado-Negrete, A.; Arjonilla-Becerra, S.; Peña-Vázquez, G.I.; Marín-Obispo, L.M.; Hernández-Brenes, C. Characterization of the Cafeteria Diet as Simulation of the Human Western Diet and Its Impact on the Lipidomic Profile and Gut Microbiota in Obese Rats. Nutrients 2023, 15, 86. https://doi.org/10.3390/nu15010086
de la Garza AL, Martínez-Tamez AM, Mellado-Negrete A, Arjonilla-Becerra S, Peña-Vázquez GI, Marín-Obispo LM, Hernández-Brenes C. Characterization of the Cafeteria Diet as Simulation of the Human Western Diet and Its Impact on the Lipidomic Profile and Gut Microbiota in Obese Rats. Nutrients. 2023; 15(1):86. https://doi.org/10.3390/nu15010086
Chicago/Turabian Stylede la Garza, Ana Laura, Alejandra Mayela Martínez-Tamez, Anael Mellado-Negrete, Sofía Arjonilla-Becerra, Gloria Itzel Peña-Vázquez, Luis Martín Marín-Obispo, and Carmen Hernández-Brenes. 2023. "Characterization of the Cafeteria Diet as Simulation of the Human Western Diet and Its Impact on the Lipidomic Profile and Gut Microbiota in Obese Rats" Nutrients 15, no. 1: 86. https://doi.org/10.3390/nu15010086
APA Stylede la Garza, A. L., Martínez-Tamez, A. M., Mellado-Negrete, A., Arjonilla-Becerra, S., Peña-Vázquez, G. I., Marín-Obispo, L. M., & Hernández-Brenes, C. (2023). Characterization of the Cafeteria Diet as Simulation of the Human Western Diet and Its Impact on the Lipidomic Profile and Gut Microbiota in Obese Rats. Nutrients, 15(1), 86. https://doi.org/10.3390/nu15010086


