
Eating Patterns during Pregnancy and Postpartum and Their Association with Diet Quality and Energy Intake


Abstract
:1. Introduction
2. Materials and Methods
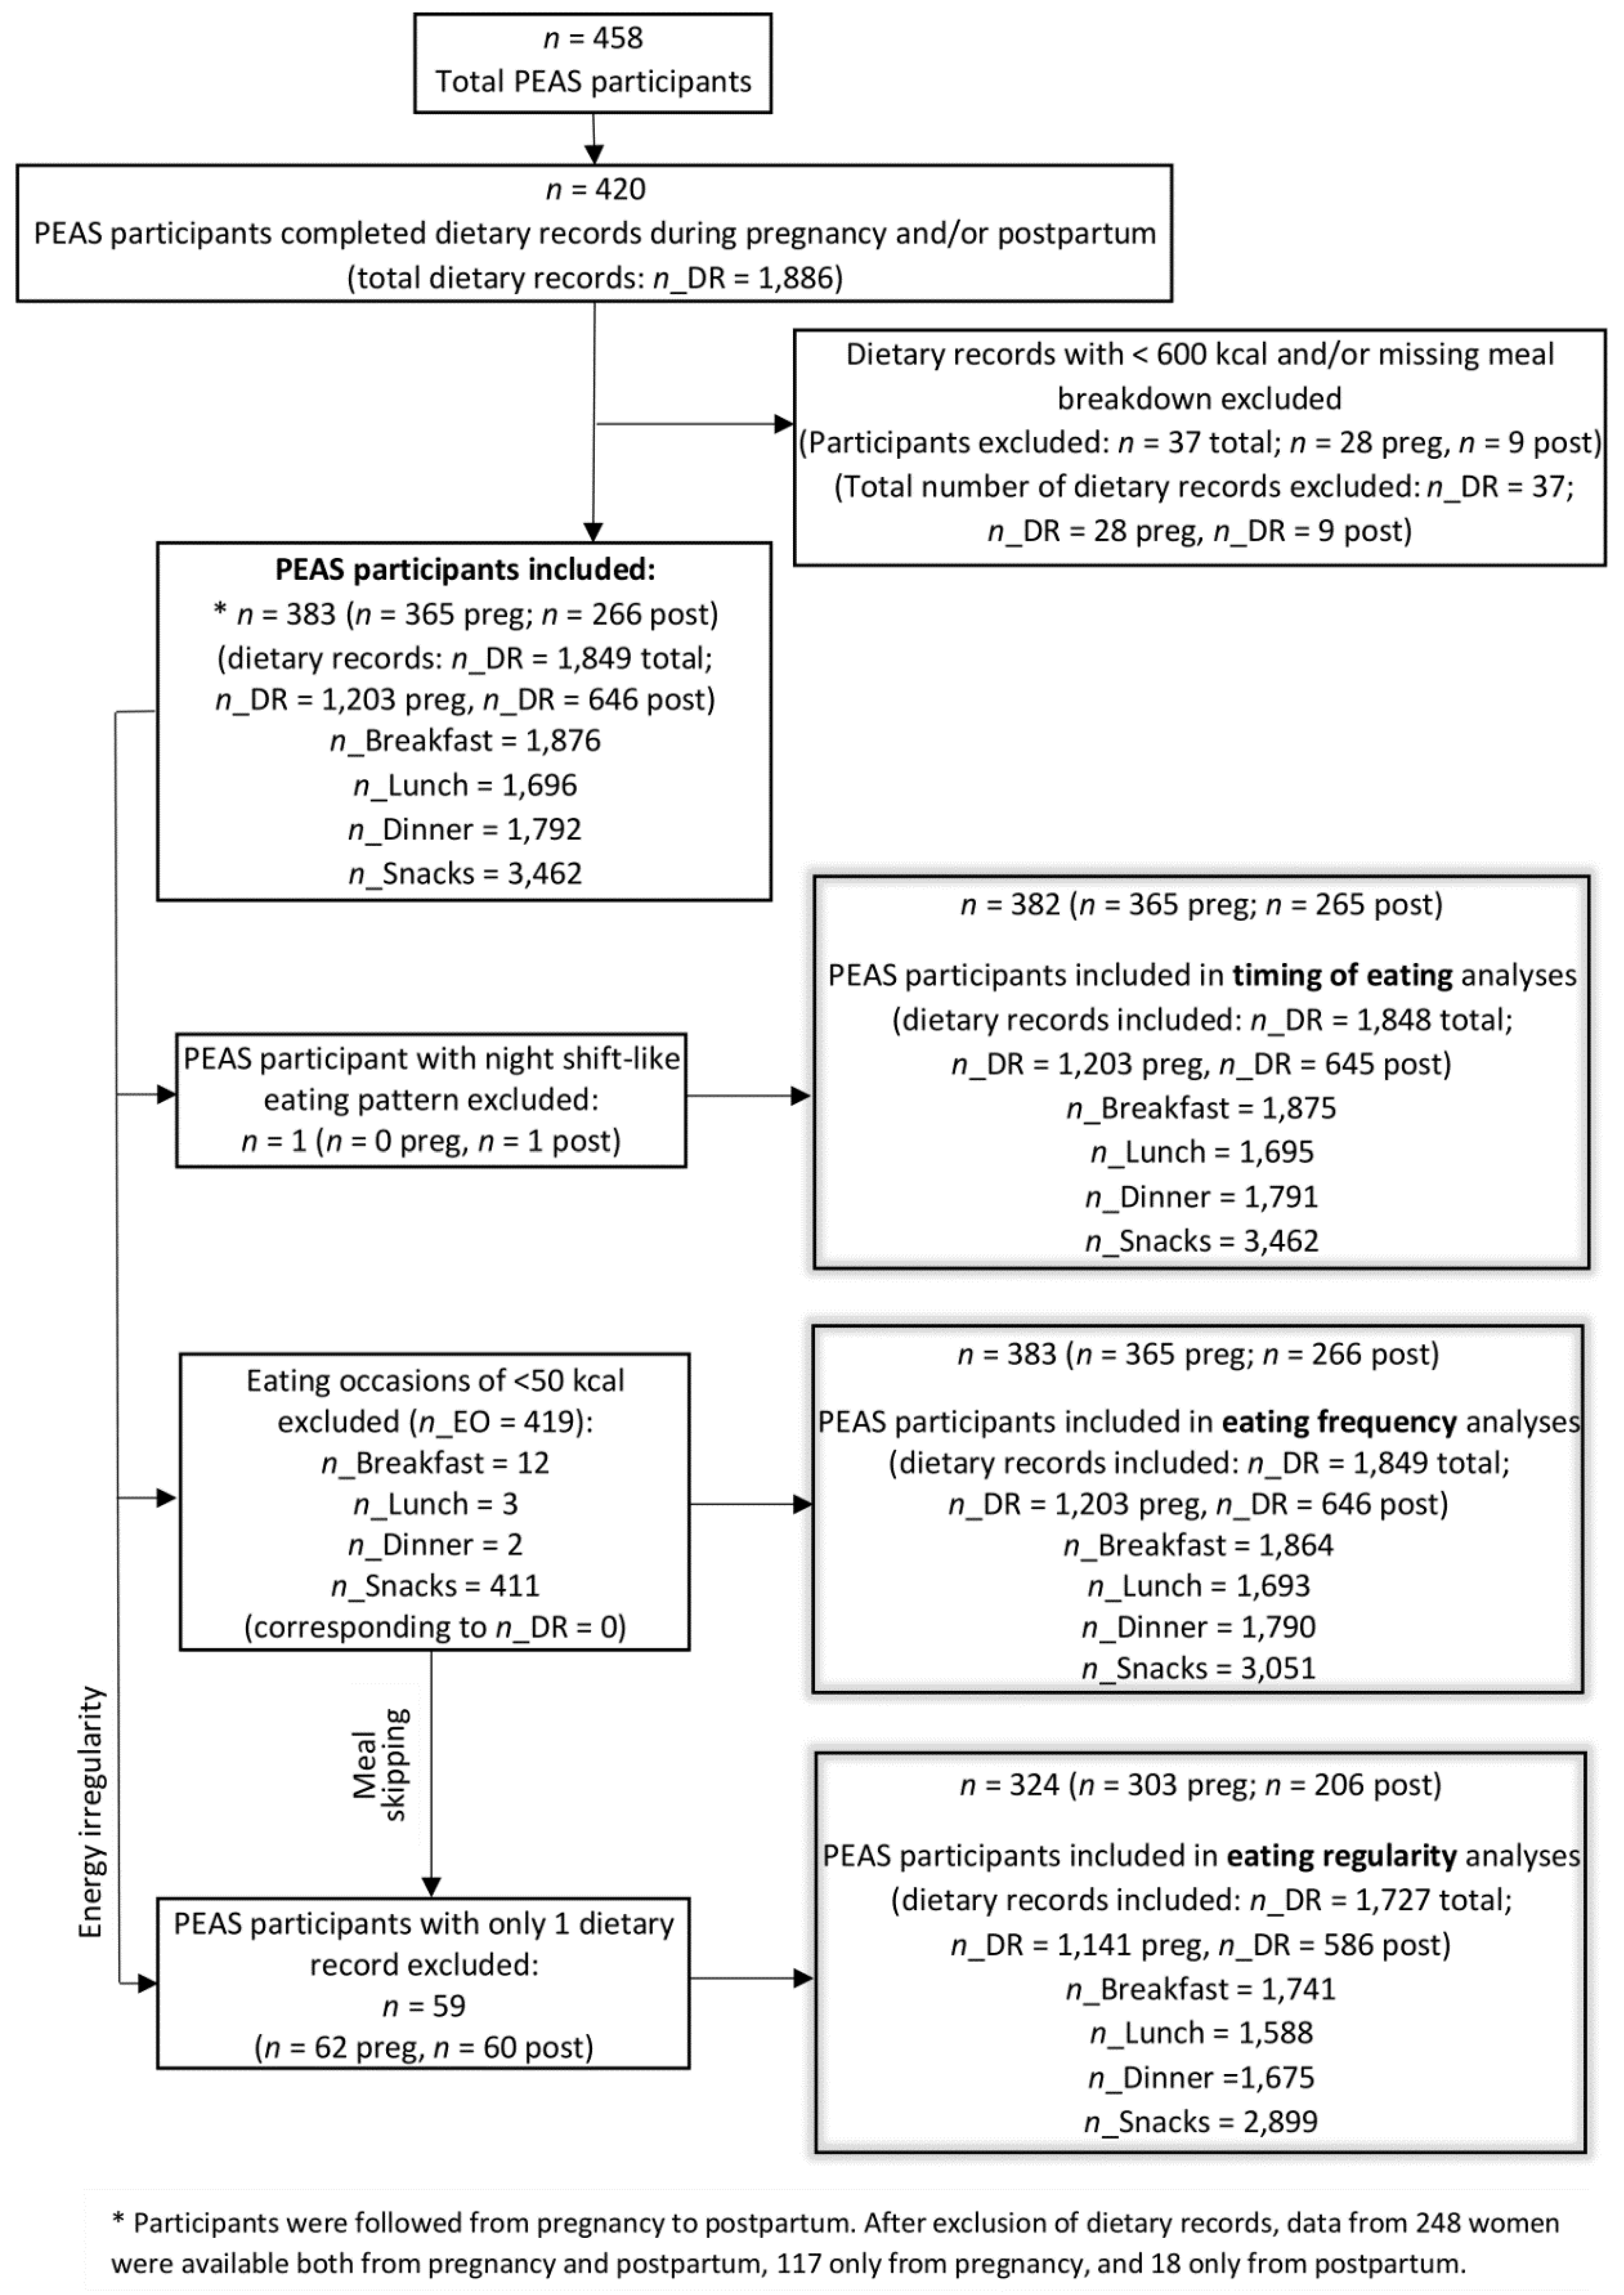
2.1. Design and Participants
2.2. Measures
2.2.1. Dietary Intake
2.2.2. Demographic, Medical, and Lifestyle Data
2.3. Statistical Analysis
2.3.1. Eating Frequency
2.3.2. Eating Regularity
2.3.3. Intake Timing
3. Results
3.1. Eating Frequency
3.1.1. Daily Energy Intake
3.1.2. Daily HEI
3.2. Eating Regularity
3.2.1. Mean Energy Intake
3.2.2. Overall HEI
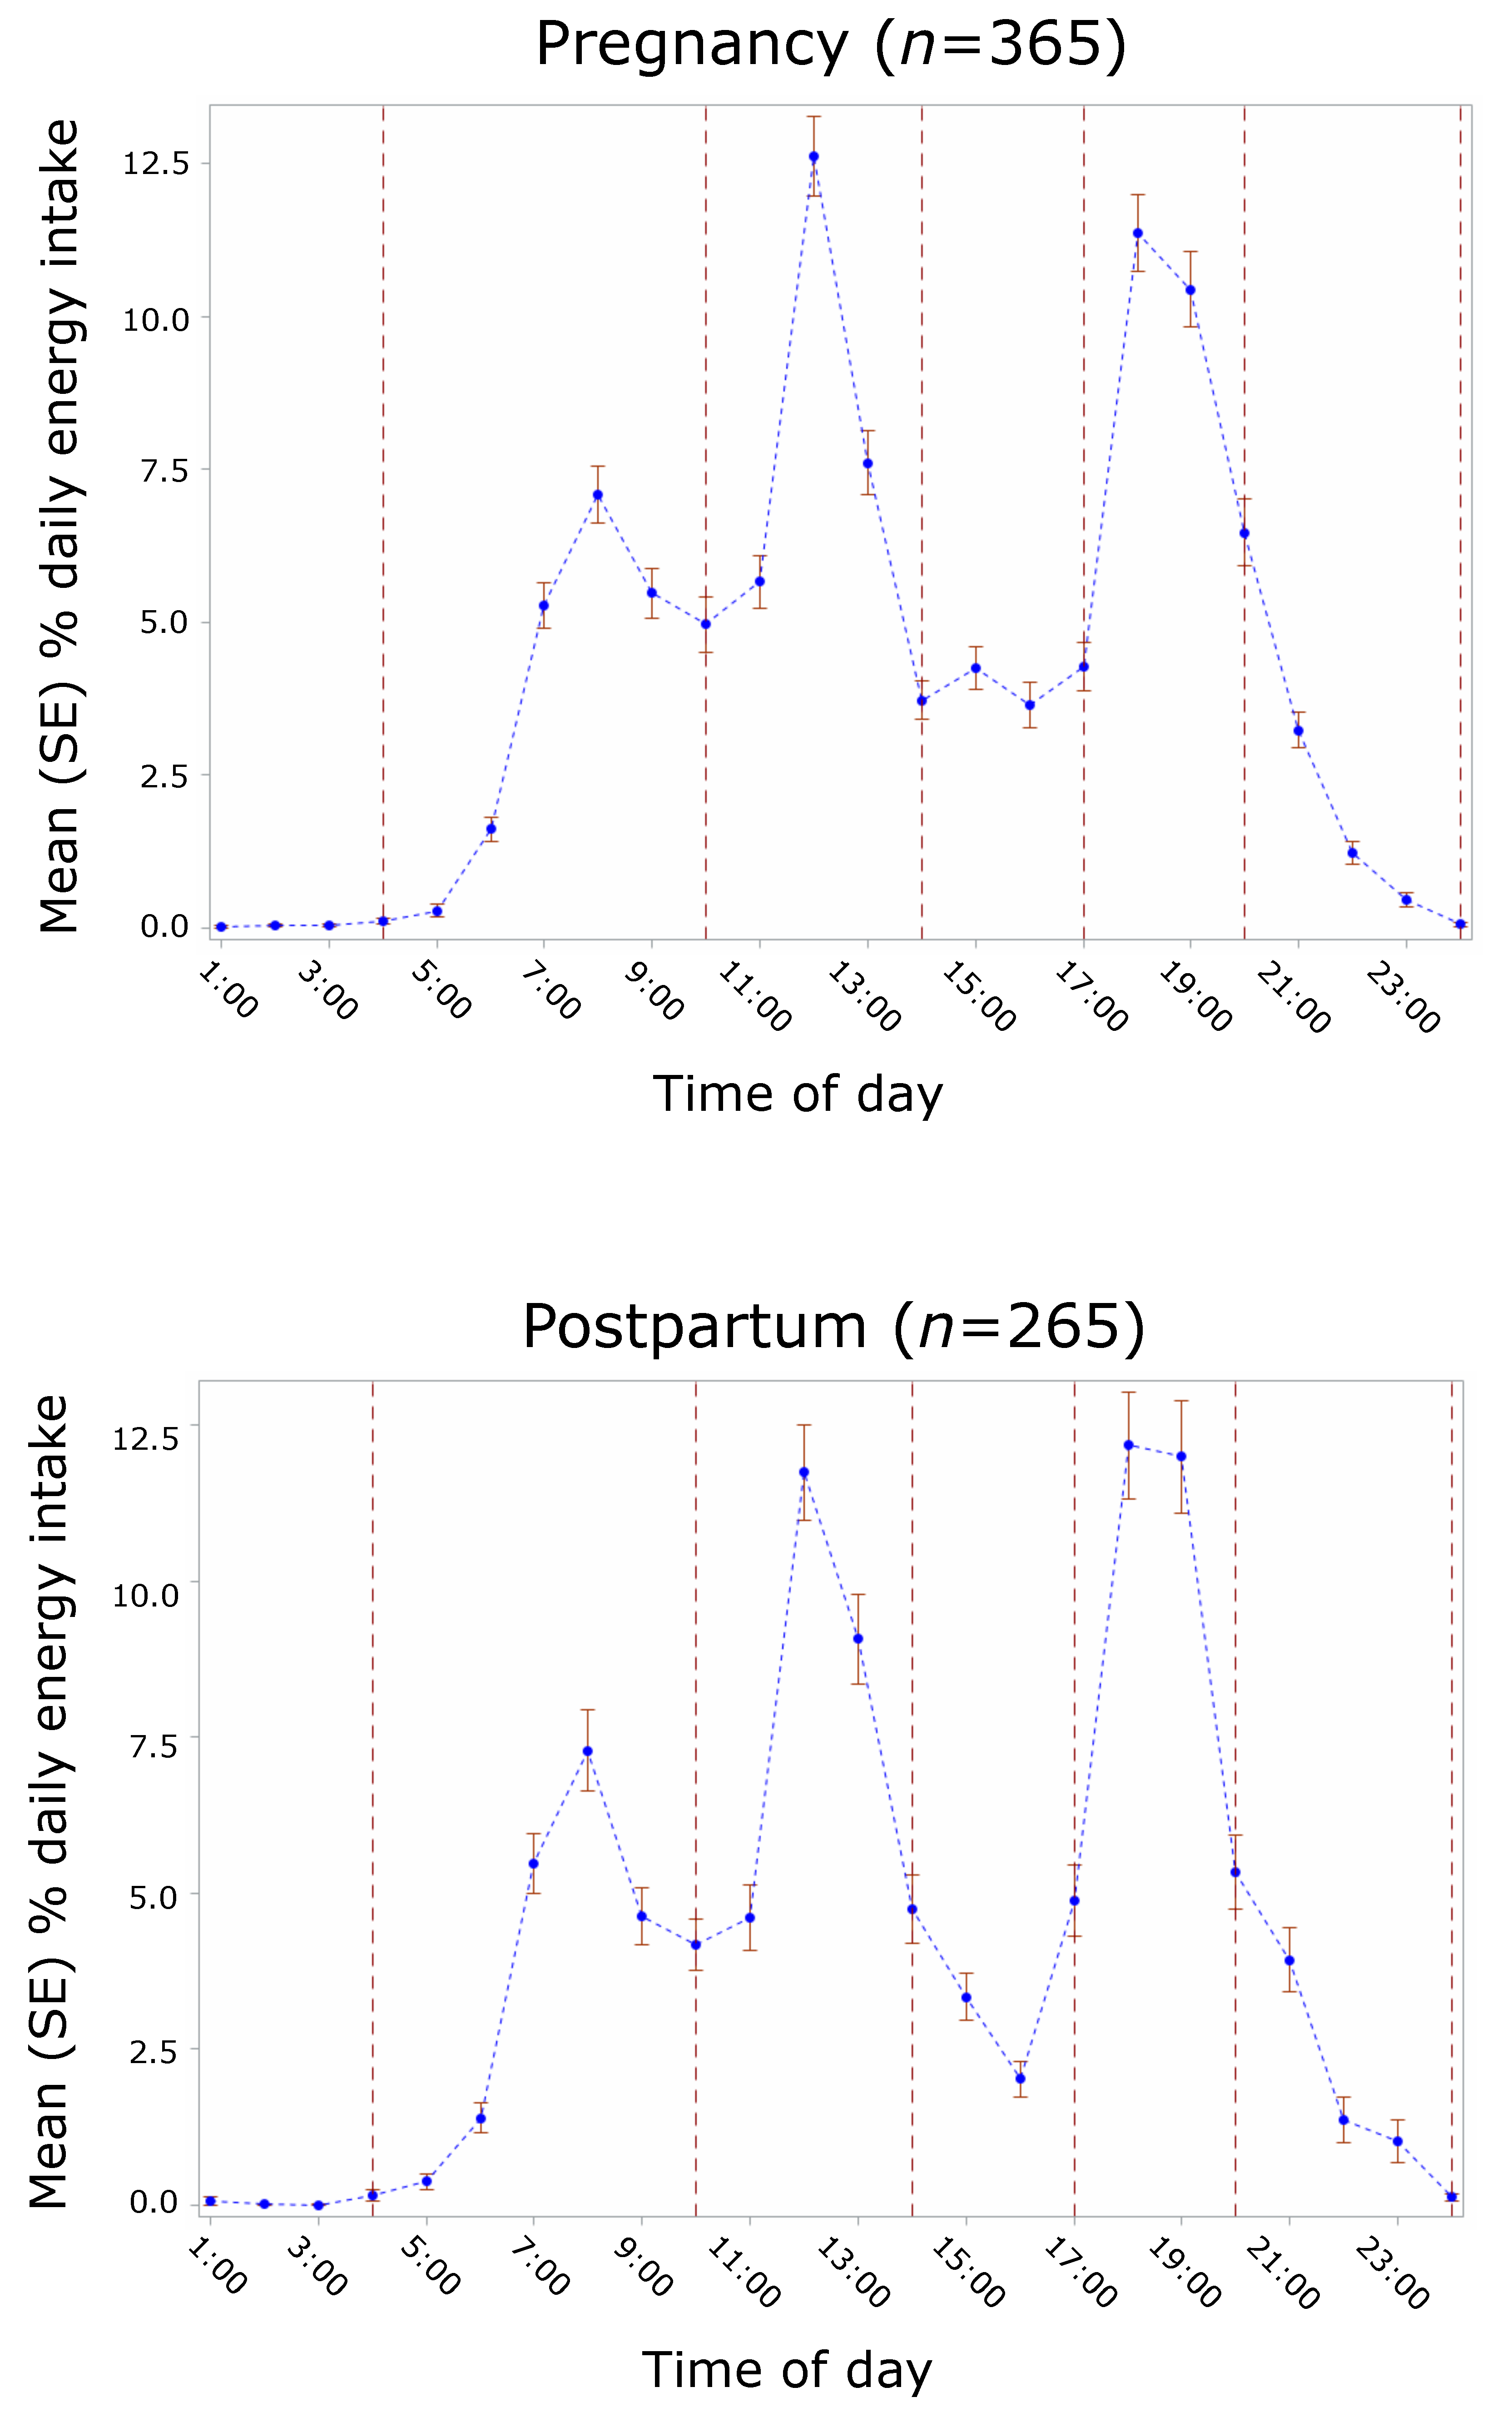
3.3. Intake Timing
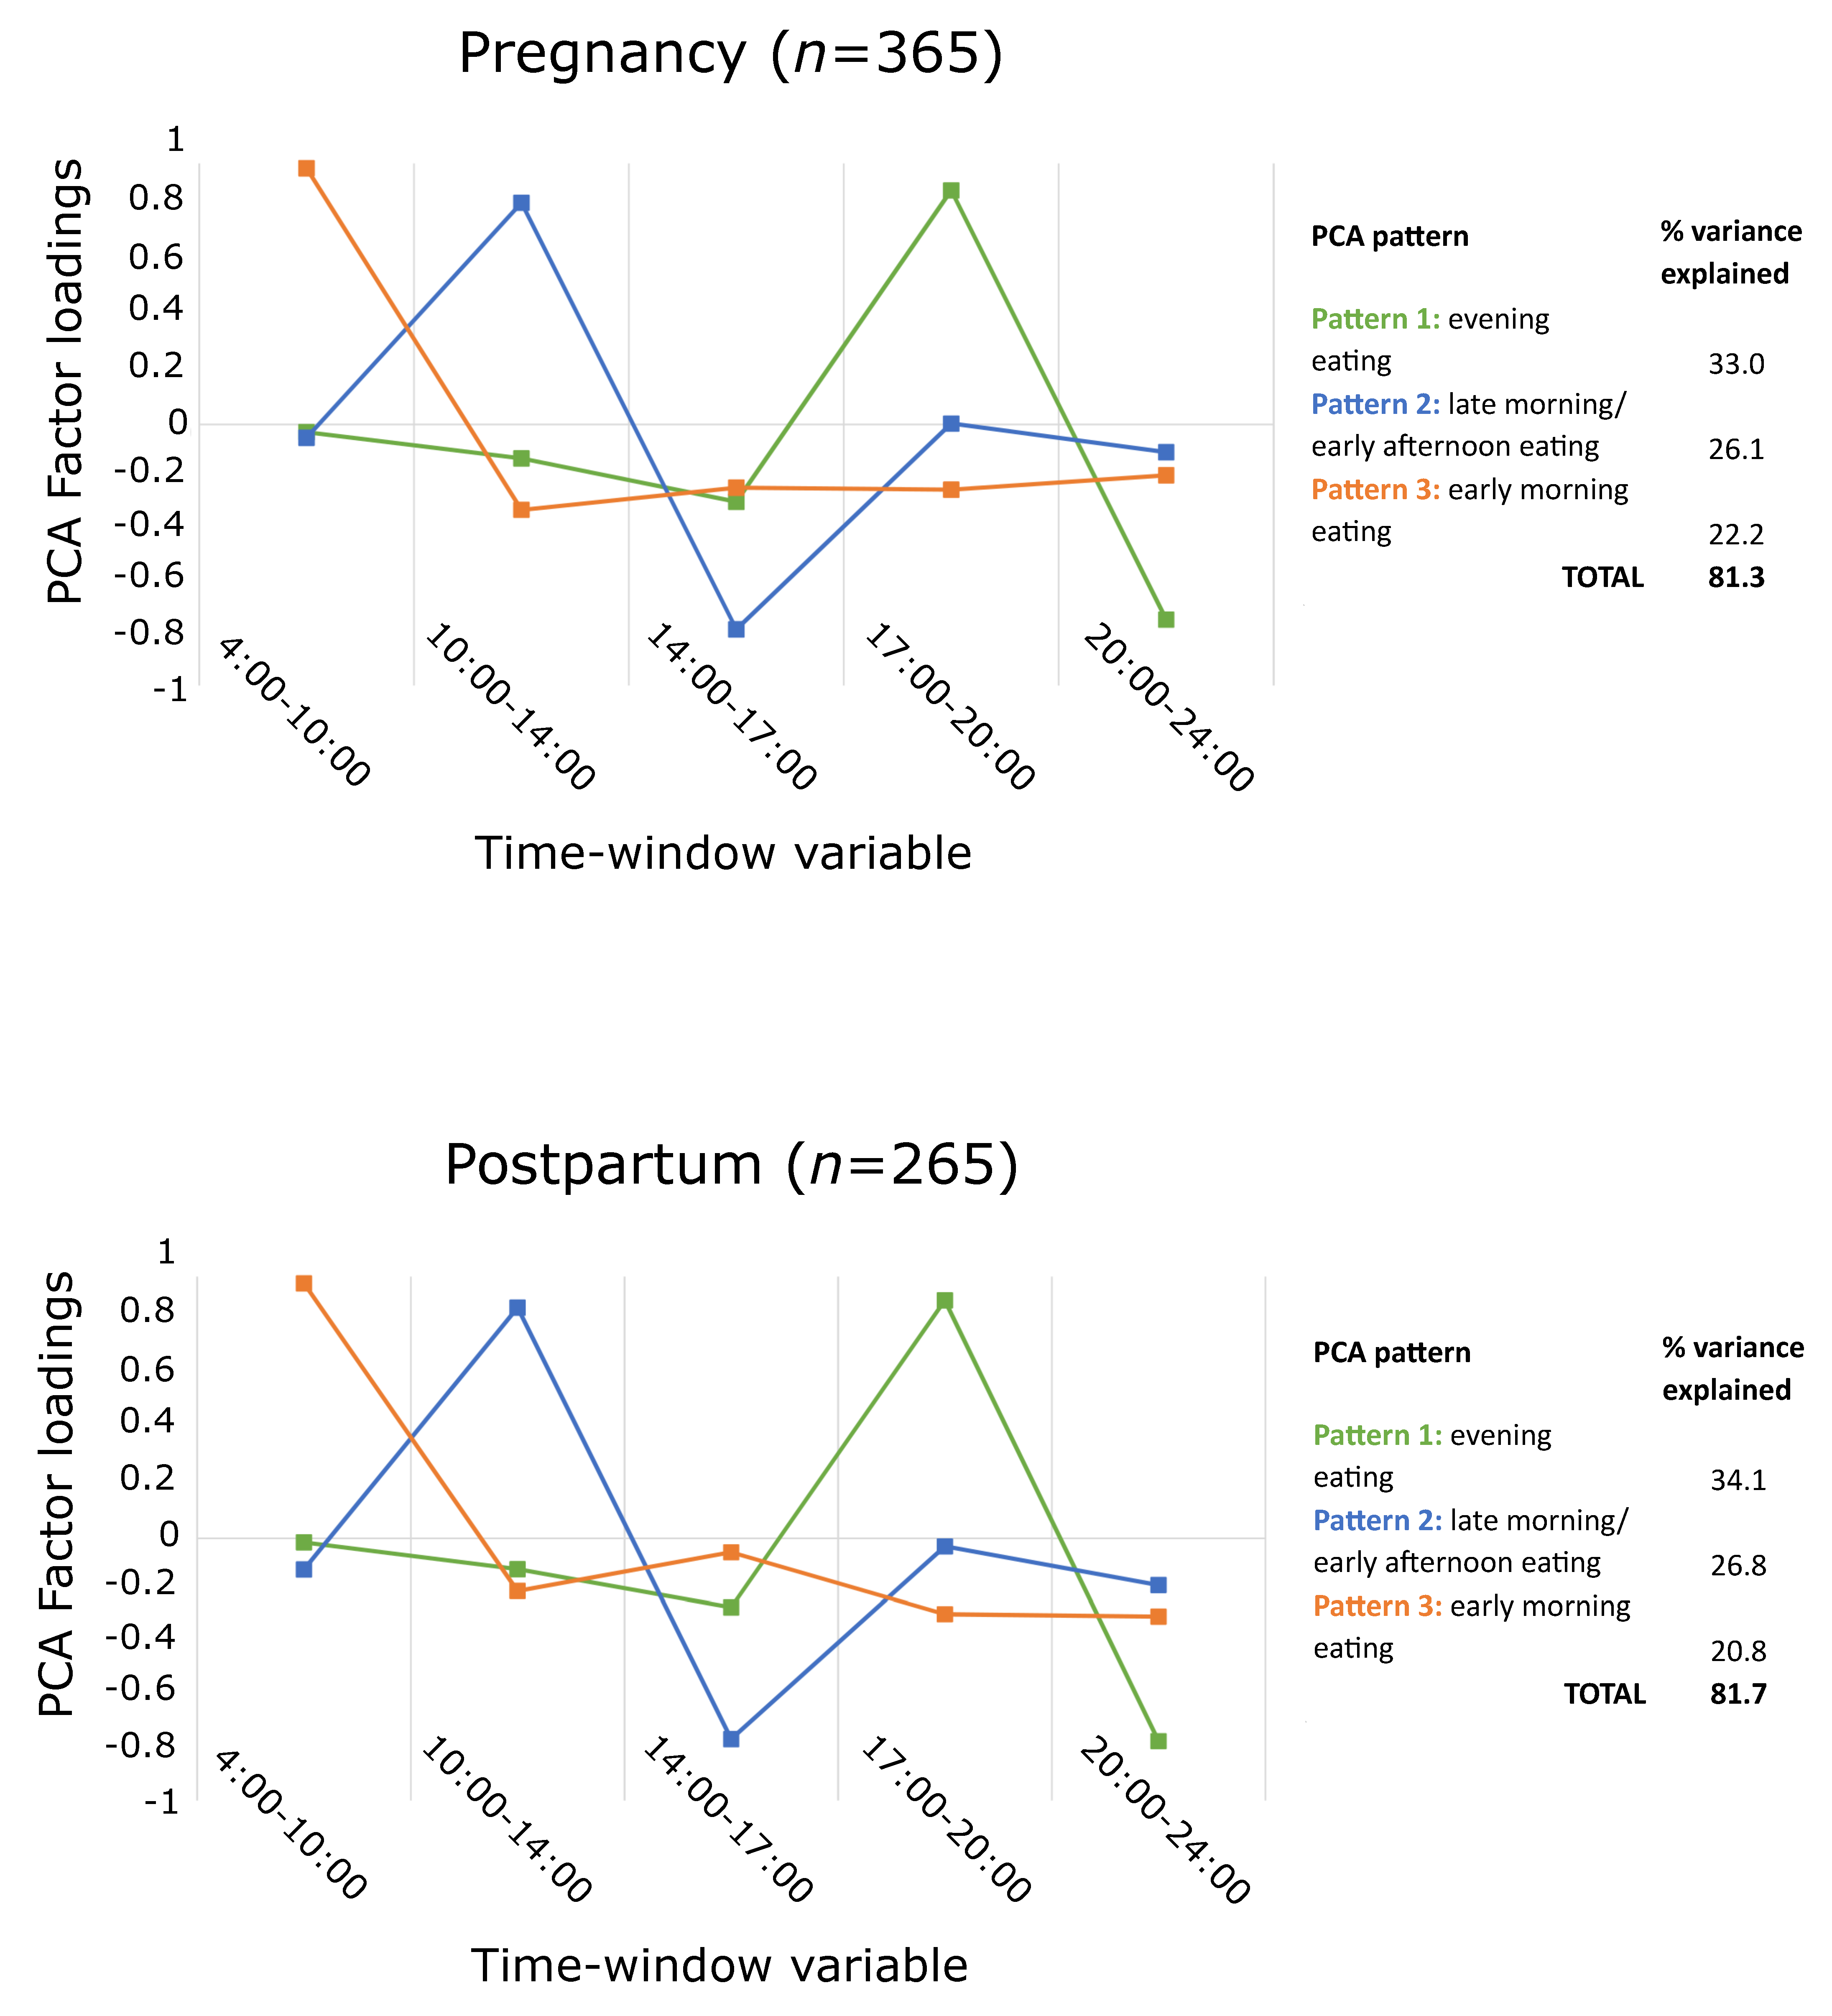
3.3.1. PCA Patterns
3.3.2. Mean Energy Intake
3.3.3. Overall HEI
4. Discussion
5. Conclusions
Author Contributions
Funding
Institutional Review Board Statement
Informed Consent Statement
Data Availability Statement
Acknowledgments
Conflicts of Interest
Abbreviations
References
- Bodnar, L.M.; Siega-Riz, A.M. A Diet Quality Index for Pregnancy detects variation in diet and differences by sociodemographic factors. Public Health Nutr. 2002, 5, 801–809. [Google Scholar] [CrossRef] [PubMed] [Green Version]
- Bodnar, L.M.; Simhan, H.N.; Parker, C.B.; Meier, H.; Mercer, B.M.; Grobman, W.A.; Haas, D.M.; Wing, D.A.; Hoffman, M.K.; Parry, S.; et al. Racial or Ethnic and Socioeconomic Inequalities in Adherence to National Dietary Guidance in a Large Cohort of US Pregnant Women. J. Acad. Nutr. Diet. 2017, 117, 867–877.e3. [Google Scholar] [CrossRef] [PubMed]
- Hill, A.M.; Nunnery, D.L.; Ammerman, A.; Dharod, J.M. Racial/Ethnic Differences in Diet Quality and Eating Habits Among WIC Pregnant Women: Implications for Policy and Practice. Am. J. Health Promot. 2019, 34, 169–176. [Google Scholar] [CrossRef] [PubMed]
- Rifas-Shiman, S.L.; Rich-Edwards, J.W.; Kleinman, K.P.; Oken, E.; Gillman, M.W. Dietary Quality during Pregnancy Varies by Maternal Characteristics in Project Viva: A US Cohort. J. Am. Diet. Assoc. 2009, 109, 1004–1011. [Google Scholar] [CrossRef] [Green Version]
- Durham, H.A.; Lovelady, C.A.; Brouwer, R.J.N.; Krause, K.M.; Østbye, T. Comparison of Dietary Intake of Overweight Postpartum Mothers Practicing Breastfeeding or Formula Feeding. J. Am. Diet. Assoc. 2011, 111, 67–74. [Google Scholar] [CrossRef] [Green Version]
- Dudenhausen, J.W.; Grünebaum, A.; Kirschner, W. Prepregnancy body weight and gestational weight gain—recommendations and reality in the USA and in Germany. Am. J. Obstet. Gynecol. 2015, 213, 591–592. [Google Scholar] [CrossRef]
- Ketterl, T.G.; Dundas, N.J.; Roncaioli, S.A.; Littman, A.J.; Phipps, A.I. Association of Pre-pregnancy BMI and Postpartum Weight Retention Before Second Pregnancy, Washington State, 2003–2013. Matern. Child Health J. 2018, 22, 1339–1344. [Google Scholar] [CrossRef]
- Shapiro, A.L.B.; Kaar, J.L.; Crume, T.L.; Starling, A.P.; Siega-Riz, A.M.; Ringham, B.M.; Glueck, D.H.; Norris, J.M.; Barbour, L.A.; Friedman, J.E.; et al. Maternal diet quality in pregnancy and neonatal adiposity: The Healthy Start Study. Int. J. Obes. 2016, 40, 1056–1062. [Google Scholar] [CrossRef] [Green Version]
- Brantsæter, A.L.; Haugen, M.; Samuelsen, S.O.; Torjusen, H.; Trogstad, L.; Alexander, J.; Magnus, P.; Meltzer, H.M. A Dietary Pattern Characterized by High Intake of Vegetables, Fruits, and Vegetable Oils Is Associated with Reduced Risk of Preeclampsia in Nulliparous Pregnant Norwegian Women. J. Nutr. 2009, 139, 1162–1168. [Google Scholar] [CrossRef] [Green Version]
- Jacka, F.N.; Ystrom, E.; Brantsaeter, A.L.; Karevold, E.; Roth, C.; Haugen, M.; Meltzer, H.M.; Schjolberg, S.; Berk, M. Maternal and Early Postnatal Nutrition and Mental Health of Offspring by Age 5 Years: A Prospective Cohort Study. J. Am. Acad. Child Adolesc. Psychiatry 2013, 52, 1038–1047. [Google Scholar] [CrossRef]
- Vesco, K.K.; Dietz, P.M.; Rizzo, J.; Stevens, V.J.; Perrin, N.A.; Bachman, D.J.; Callaghan, W.M.; Bruce, F.C.; Hornbrook, M.C. Excessive Gestational Weight Gain and Postpartum Weight Retention Among Obese Women. Obstet. Gynecol. 2009, 114, 1069–1075. [Google Scholar] [CrossRef] [Green Version]
- Siega-Riz, A.M.; Viswanathan, M.; Moos, M.-K.; Deierlein, A.; Mumford, S.; Knaack, J.; Thieda, P.; Lux, L.J.; Lohr, K.N. A systematic review of outcomes of maternal weight gain according to the Institute of Medicine recommendations: Birthweight, fetal growth, and postpartum weight retention. Am. J. Obstet. Gynecol. 2009, 201, 339.e1–339.e14. [Google Scholar] [CrossRef]
- Endres, L.K.; Straub, H.; McKinney, C.; Plunkett, B.; Minkovitz, C.S.; Schetter, C.D.; Ramey, S.; Wang, C.; Hobel, C.; Raju, T.; et al. Community Child Health Network of the Eunice Kennedy Shriver National Institute of Child Health and Human Development. Postpartum weight retention risk factors and relationship to obesity at 1 year. Obstet. Gynecol. 2015, 125, 144–152. [Google Scholar] [CrossRef] [Green Version]
- Leech, R.M.; Worsley, A.; Timperio, A.; McNaughton, S.A. Understanding meal patterns: Definitions, methodology and impact on nutrient intake and diet quality. Nutr. Res. Rev. 2015, 28, 1–21. [Google Scholar] [CrossRef] [Green Version]
- Aljuraiban, G.S.; Chan, Q.; Oude Griep, L.M.; Brown, I.J.; Daviglus, M.L.; Stamler, J.; Van Horn, L.; Elliott, P.; Frost, G.S. The Impact of Eating Frequency and Time of Intake on Nutrient Quality and Body Mass Index: The INTERMAP Study, a Population-Based Study. J. Acad. Nutr. Diet. 2015, 115, 528–536.e1. [Google Scholar] [CrossRef] [Green Version]
- Bellisle, F. Meals and snacking, diet quality and energy balance. Physiol. Behav. 2014, 134, 38–43. [Google Scholar] [CrossRef]
- Ohkawara, K.; Cornier, M.-A.; Kohrt, W.M.; Melanson, E.L. Effects of increased meal frequency on fat oxidation and perceived hunger. Obesity 2013, 21, 336–343. [Google Scholar] [CrossRef] [Green Version]
- Speechly, D.P.; Buffenstein, R. Greater Appetite Control Associated with an Increased Frequency of Eating in Lean Males. Appetite 1999, 33, 285–297. [Google Scholar] [CrossRef]
- Berg, C.; Forslund, H.B. The Influence of Portion Size and Timing of Meals on Weight Balance and Obesity. Curr. Obes. Rep. 2015, 4, 11–18. [Google Scholar] [CrossRef]
- Chaput, J.-P. Sleep patterns, diet quality and energy balance. Physiol. Behav. 2014, 134, 86–91. [Google Scholar] [CrossRef]
- Murakami, K.; Livingstone, M.B.E. Associations between Meal and Snack Frequency and Diet Quality in US Adults: National Health and Nutrition Examination Survey 2003–2012. J. Acad. Nutr. Diet. 2016, 116, 1101–1113. [Google Scholar] [CrossRef]
- Zhu, Y.; Hollis, J.H. Associations between eating frequency and energy intake, energy density, diet quality and body weight status in adults from the USA. Br. J. Nutr. 2016, 115, 2138–2144. [Google Scholar] [CrossRef] [Green Version]
- Leech, R.M.; Worsley, A.; Timperio, A.; McNaughton, S.A. Temporal eating patterns: A latent class analysis approach. Int. J. Behav. Nutr. Phys. Act. 2017, 14, 3. [Google Scholar] [CrossRef] [Green Version]
- Jayedi, A.; Lesani, A.; Akbarzadeh, Z.; Djafarian, K.; Shab-Bidar, S. Irregular daily energy intake and diet quality in Iranian adults. Br. J. Nutr. 2021, 126, 401–408. [Google Scholar] [CrossRef] [PubMed]
- Deshmukh-Taskar, P.R.; Radcliffe, J.D.; Liu, Y.; Nicklas, T.A. Do Breakfast Skipping and Breakfast Type Affect Energy Intake, Nutrient Intake, Nutrient Adequacy, and Diet Quality in Young Adults? NHANES 1999–2002. J. Am. Coll. Nutr. 2010, 29, 407–418. [Google Scholar] [CrossRef] [PubMed]
- Mekary, R.A.; Giovannucci, E.; Cahill, L.; Willett, W.C.; van Dam, R.M.; Hu, F.B. Eating patterns and type 2 diabetes risk in older women: Breakfast consumption and eating frequency. Am. J. Clin. Nutr. 2013, 98, 436–443. [Google Scholar] [CrossRef] [PubMed]
- Smith, K.J.; McNaughton, S.A.; Cleland, V.J.; Crawford, D.; Ball, K. Health, Behavioral, Cognitive, and Social Correlates of Breakfast Skipping among Women Living in Socioeconomically Disadvantaged Neighborhoods. J. Nutr. 2013, 143, 1774–1784. [Google Scholar] [CrossRef] [PubMed] [Green Version]
- Kerver, J.M.; Yang, E.J.; Obayashi, S.; Bianchi, L.; Song, W.O. Meal and Snack Patterns Are Associated with Dietary Intake of Energy and Nutrients in US Adults. J. Am. Diet. Assoc. 2006, 106, 46–53. [Google Scholar] [CrossRef]
- Farshchi, H.R.; Taylor, M.A.; Macdonald, I.A. Beneficial metabolic effects of regular meal frequency on dietary thermogenesis, insulin sensitivity, and fasting lipid profiles in healthy obese women. Am. J. Clin. Nutr. 2005, 81, 16–24. [Google Scholar] [CrossRef]
- Baron, K.G.; Reid, K.J.; Kern, A.S.; Zee, P.C. Role of Sleep Timing in Caloric Intake and BMI. Obesity 2011, 19, 1374–1381. [Google Scholar] [CrossRef]
- De Castro, J.M. The Time of Day of Food Intake Influences Overall Intake in Humans. J. Nutr. 2004, 134, 104–111. [Google Scholar] [CrossRef]
- Sebastian, R.; Enns, C.W.; Goldman, J.; Murayi, T.; Moshfegh, A. Late Evening Food Patterns of U.S. Adults Are Differentially Associated with Total Energy Intake and Diet Quality: Results from What We Eat in America, NHANES 2013–2016. Curr. Dev. Nutr. 2020, 4 (Suppl. S2), 564–564. [Google Scholar] [CrossRef]
- Loy, S.L.; Loo, R.S.; Godfrey, K.M.; Chong, Y.-S.; Shek, L.P.; Tan, K.H.; Chong, M.F.; Chan, J.K.; Yap, F. Chrononutrition during Pregnancy: A Review on Maternal Night-Time Eating. Nutrients 2020, 12, 2783. [Google Scholar] [CrossRef]
- Flanagan, E.W.; Most, J.; Broskey, N.T.; Altazan, A.D.; Beyl, R.A.; Keadle, S.K.; Drews, K.L.; Singh, P.; Redman, L.M. Identification of changes in sleep across pregnancy and the impact on cardiometabolic health and energy intake in women with obesity. Sleep Med. 2021, 77, 120–127. [Google Scholar] [CrossRef]
- Faria-Schützer, D.B.; Surita, F.G.; Rodrigues, L.; Turato, E.R. Eating Behaviors in Postpartum: A Qualitative Study of Women with Obesity. Nutrients 2018, 10, 885. [Google Scholar] [CrossRef] [Green Version]
- Forbes, L.E.; Graham, J.E.; Berglund, C.; Bell, R.C. Dietary Change during Pregnancy and Women’s Reasons for Change. Nutrients 2018, 10, 1032. [Google Scholar] [CrossRef] [Green Version]
- Versele, V.; Debekker, P.; Stok, F.M.; Aerenhouts, D.; Clarys, P.; Deforche, B.; D’Hondt, E.; Devlieger, R.; Bogaerts, A.; Deliens, T. Relative Importance of Determinants of Changes in Eating Behavior during the Transition to Parenthood: Priorities for Future Research and Interventions. Nutrients 2021, 13, 2429. [Google Scholar] [CrossRef]
- Siega-Riz, A.M.; Herrmann, T.S.; Savitz, D.A.; Thorp, J.M. Frequency of Eating During Pregnancy and Its Effect on Preterm Delivery. Am. J. Epidemiol. 2001, 153, 647–652. [Google Scholar] [CrossRef]
- Huseinovic, E.; Winkvist, A.; Bertz, F.; Bertéus Forslund, H.; Brekke, H.K. Eating frequency, energy intake and body weight during a successful weight loss trial in overweight and obese postpartum women. Eur. J. Clin. Nutr. 2014, 68, 71–76. [Google Scholar] [CrossRef]
- Ainscough, K.M.; Kennelly, M.A.; Lindsay, K.L.; O’Brien, E.C.; O’Sullivan, E.J.; Mehegan, J.; Gibney, E.R.; McAuliffe, F.M. An observational analysis of meal patterns in overweight and obese pregnancy: Exploring meal pattern behaviours and the association with maternal and fetal health measures. Ir. J. Med. Sci. 2020, 189, 585–594. [Google Scholar] [CrossRef] [Green Version]
- Araújo, G.C.; Tibiletti, B.L.C.; Pereira, T.G.; Makin, F.W.; Aparecida, C.C.; de Paiva, M.Y.C. A higher energy intake at night-time impacts daily energy distribution and contributes to excessive weight gain during pregnancy. Nutrition 2020, 74, 110–756. [Google Scholar]
- Fowles, E.R.; Stang, J.; Bryant, M.; Kim, S. Stress, Depression, Social Support, and Eating Habits Reduce Diet Quality in the First Trimester in Low-Income Women: A Pilot Study. J. Acad. Nutr. Diet. 2012, 112, 1619–1625. [Google Scholar] [CrossRef] [Green Version]
- Nansel, T.R.; Lipsky, L.M.; Siega-Riz, A.M.; Burger, K.; Faith, M.; Liu, A. Pregnancy eating attributes study (PEAS): A cohort study examining behavioral and environmental influences on diet and weight change in pregnancy and postpartum. BMC Nutr. 2016, 2, 45. [Google Scholar] [CrossRef] [Green Version]
- Subar, A.F.; Kirkpatrick, S.I.; Mittl, B.; Zimmerman, T.P.; Thompson, F.E.; Bingley, C.; Willis, G.; Islam, N.G.; Baranowski, T.; McNutt, S.; et al. The Automated Self-Administered 24-Hour Dietary Recall (ASA24): A Resource for Researchers, Clinicians, and Educators from the National Cancer Institute. J. Acad. Nutr. Diet. 2012, 112, 1134–1137. [Google Scholar] [CrossRef] [Green Version]
- USDA Food and Nutrient Database for Dietary Studies; Food Surveys Research Group: Beltsville, MD, USA. Available online: https://www.ars.usda.gov/nea/bhnrc/fsrg (accessed on 2 March 2022).
- U.S. Department of Health and Human Services and US Department of Agriculture. 2015–2020 Dietary Guidelines for Americans, 8th ed. December 2015. Available online: https://health.gov/our-work/food-nutrition/previous-dietary-guidelines/2015 (accessed on 2 March 2022).
- National Cancer Institute Division of Cancer Control and Population Sciences. Developing the Healthy Eating Index. Available online: https://epi.grants.cancer.gov/hei/developing.html (accessed on 30 October 2019).
- Rifas-Shiman, S.L.; Rich-Edwards, J.W.; Willett, W.C.; Kleinman, K.P.; Oken, E.; Gillman, M.W. Changes in dietary intake from the first to the second trimester of pregnancy. Paediatr. Perinat. Epidemiol. 2006, 20, 35–42. [Google Scholar] [CrossRef] [Green Version]
- Savard, C.; Lemieux, S.; Carbonneau, É.; Provencher, V.; Gagnon, C.; Robitaille, J.; Morisset, A.-S. Trimester-Specific Assessment of Diet Quality in a Sample of Canadian Pregnant Women. Int. J. Environ. Res. Public Health 2019, 16, 311. [Google Scholar] [CrossRef] [Green Version]
- National Cancer Institute Division of Cancer Control & Population Sciences Epidemiology and Genomics Research Program. Healthy Eating Index SAS Code. Available online: https://epi.grants.cancer.gov/hei/sas-code.html (accessed on 14 July 2020).
- U.S. Census Bureau Current Population Survey: Subject Definitions. Available online: https://www.census.gov/programs-surveys/cps/technical-documentation/subject-definitions.html (accessed on 30 October 2019).
- Ainsworth, B.E.; Haskell, W.L.; Leon, A.S.; Jacobs, D.R.; Montoye, H.J.; Sallis, J.F.; Paffenbarger, R.S. Compendium of physical activities: Classification of energy costs of human physical activities. Med. Sci. Sports Exerc. 1993, 25, 71–80. [Google Scholar] [CrossRef]
- Ainsworth, B.E.; Haskell, W.L.; Whitt, M.C.; Irwin, M.L.; Swartz, A.M.; Strath, S.J.; O’Brien, W.L.; Bassett, D.R.; Schmitz, K.H.; Emplaincourt, P.O.; et al. Compendium of Physical Activities: An update of activity codes and MET intensities. Med. Sci. Sports Exerc. 2000, 32 (Suppl. S1), S498–S504. [Google Scholar] [CrossRef] [Green Version]
- Pot, G.K.; Hardy, R.; Stephen, A.M. Irregular consumption of energy intake in meals is associated with a higher cardiometabolic risk in adults of a British birth cohort. Int. J. Obes. 2014, 38, 1518–1524. [Google Scholar] [CrossRef] [Green Version]
- Schwedhelm, C.; Iqbal, K.; Knüppel, S.; Schwingshackl, L.; Boeing, H. Contribution to the understanding of how principal component analysis–derived dietary patterns emerge from habitual data on food consumption. Am. J. Clin. Nutr. 2018, 107, 227–235. [Google Scholar] [CrossRef] [Green Version]
- Heinze, G.; Wallisch, C.; Dunkler, D. Variable selection—A review and recommendations for the practicing statistician. Biom. J. 2018, 60, 431–449. [Google Scholar] [CrossRef] [PubMed] [Green Version]
- Araújo Gontijo, C.; Macedo Cabral, B.B.; Tibiletti Balieiro, L.C.; Pereira Teixeira, G.; Makin Fahmy, W.; de Paiva Maia, Y.C.; Aparecida Crispim, C. Time-related eating patterns and chronotype are associated with diet quality in pregnant women. Chronobiol. Int. 2019, 36, 75–84. [Google Scholar] [CrossRef] [PubMed]
- Mie, S.; Megumi, H.; Masayo, M. Effects of skipping breakfast on dietary intake and circulating and urinary nutrients during pregnancy. Asia Pac. J. Clin. Nutr. 2019, 28, 99–105. [Google Scholar]
- Hunter, L.P.; Rychnovsky, J.D.; Yount, S.M. A Selective Review of Maternal Sleep Characteristics in the Postpartum Period. J. Obstet. Gynecol. Neonatal Nurs. 2009, 38, 60–68. [Google Scholar] [CrossRef] [PubMed]
- Worthington-Roberts, B.; Little, R.E.; Lambert, M.D.; Wu, R. Dietary cravings and aversions in the postpartum period1. J. Am. Diet. Assoc. 1989, 89, 647–648. [Google Scholar] [CrossRef]
- Avery, A.; Hillier, S.; Pallister, C.; Barber, J.; Lavin, J. Factors influencing engagement in postnatal weight management and weight and wellbeing outcomes. Br. J. Midwifery 2016, 24, 806–812. [Google Scholar] [CrossRef]
- Koleilat, M.; Kim, L.P.; Cortes, B.; Kodjebacheva, G.D. Perceived Motivators, Barriers and Intervention Strategies Related to Weight Loss After Childbirth Among WIC Participants in Southern California. Am. J. Health Promot. 2019, 34, 294–302. [Google Scholar] [CrossRef]
- Loy, S.L.; Cheng, T.S.; Colega, M.T.; Cheung, Y.B.; Godfrey, K.M.; Gluckman, P.D.; Kwek, K.; Saw, S.M.; Chong, Y.-S.; Padmapriya, N.; et al. Predominantly night-time feeding and maternal glycaemic levels during pregnancy. Br. J. Nutr. 2016, 115, 1563–1570. [Google Scholar] [CrossRef] [Green Version]
- Englund-Ögge, L.; Birgisdottir, B.E.; Sengpiel, V.; Brantsæter, A.L.; Haugen, M.; Myhre, R.; Meltzer, H.M.; Jacobsson, B. Meal frequency patterns and glycemic properties of maternal diet in relation to preterm delivery: Results from a large prospective cohort study. PLoS ONE 2017, 12, e0172896. [Google Scholar]


| Subject Characteristics | Mean ± SD or N (%) | ||
|---|---|---|---|
| Overall n = 383 1 | Pregnancy n = 365 | Postpartum n = 266 | |
| Sociodemographic | |||
| Age, y | 30.8 ± 4.6 | 30.8 ± 4.6 | 30.9 ± 4.3 |
| Baseline BMI group | |||
| Normal weight, 18.5 ≤ BMI < 25 | 191 (49.9) | 186 (51.0) | 133 (50) |
| Overweight, 25 ≤ BMI < 30 | 99 (25.9) | 97 (26.6) | 71 (26.7) |
| Obese, 30 ≤ BMI | 93 (24.3) | 82 (22.5) | 62 (23.3) |
| Married/living with partner | 322 (91.7) | 315 (92.1) | 237 (94.1) |
| Income-poverty ratio | 3.9 ± 1.9 | 3.9 ± 1.9 | 4.1 ± 1.9 |
| Education | |||
| High school or less | 29 (8.3) | 27 (7.9) | 16 (6.4) |
| Some college | 36 (10.3) | 35 (10.2) | 18 (7.1) |
| Associate’s degree | 29 (8.3) | 28 (8.2) | 19 (7.5) |
| Bachelor’s degree or higher | 257 (73.2) | 252 (73.7) | 199 (79.0) |
| Race/Ethnicity | |||
| White, non-Hispanic | 251 (68.8) | 247 (71.0) | 184 (71.0) |
| Black, non-Hispanic | 53 (14.5) | 45 (12.9) | 31 (12.0) |
| Hispanic or Latino | 29 (8.0) | 26 (7.5) | 22 (8.5) |
| Asian, other or multi-race | 32 (8.8) | 30 (8.6) | 22 (8.5) |
| Dietary intake | |||
| Number of dietary records per participant | - | 3.3 (1.7) | 2.4 (1.0) |
| Total daily energy intake, kcal/d | - | 2047.2 (657.4) | 1995.9 (642.5) |
| Daily HEI score (0–100) 2 | - | 54.7 (11.2) | 55.8 (12.2) |
| Eating frequency, main meals/d 3 | - | 2.9 (0.3) | 2.8 (0.3) |
| Eating frequency, all eating occasions/d 4 | - | 4.6 (1.2) | 4.3 (1.0) |
| Meal regularity, meal skipping pattern 5 | - | 102 (33.7) | 57 (27.7) |
| Energy irregularity score | - | 16.7 (8.9) | 16.0 (9.9) |
| Percent daily energy intake at predefined time windows | - | ||
| 04:00–10:00 h | - | 23.0 (10.8) | 22.0 (10.4) |
| 10:00–14:00 h | - | 30.2 (11.6) | 30.1 (12.6) |
| 14:00–17:00 h | - | 10.8 (10.0) | 8.9 (9.5) |
| 17:00–20:00 h | - | 28.8 (12.1) | 30.5 (14.6) |
| 20:00–24:00 h | - | 7.1 (9.2) | 8.2 (13.1) |
| Daily Energy Intake, kcal 1 | Daily HEI, Total Score 1 | ||||
|---|---|---|---|---|---|
| Mean | 95% CI | Mean | 95% CI | ||
| Pregnancy | Main meals | ||||
| Unadjusted model | 210.9 | 132.6; 289.2 * | 2.9 | 1.4; 4.4 * | |
| Adjusted model | 300.7 | 199.3; 402.0 * | 2.9 | 0.8; 5.0 * | |
| Eating occasions | |||||
| Unadjusted model | 138.2 | 111.2; 165.3 * | 1.8 | 1.3; 2.4 * | |
| Adjusted model | 161.6 | 129.6; 193.5 * | 1.9 | 1.2; 2.5 * | |
| Postpartum | Main meals | ||||
| Unadjusted model | 212.1 | 91.6; 332.6 * | 3.9 | 1.7; 6.2 * | |
| Adjusted model | 243.3 | 86.1; 400.6 * | 3.1 | −0.1; 6.2 | |
| Eating occasions | |||||
| Unadjusted model | 169.6 | 125.5; 213.8 * | 2.8 | 2.0; 3.6 * | |
| Adjusted model | 146.4 | 91.4; 201.4 * | 2.5 | 1.4; 3.6 * | |
| Mean Energy Intake, kcal/d1 | Overall HEI, Total Score1 | ||||
| Mean | 95% CI | Mean | 95% CI | ||
| Pregnancy | Meal skipping (ref = regular meal eating) | ||||
| Unadjusted model | −190.0 | −341.3; −38.6 * | −5.6 | −8.3; −2.9 * | |
| Adjusted model | −243.4 | −384.4; −102.3 * | −4.2 | −6.7; −1.6 * | |
| Energy irregularity score (1 SD change) | |||||
| Unadjusted model | 24.8 | −47.4; 97.1 | −1.5 | −2.9; −0.3 * | |
| Adjusted model | 4.3 | −64.1; 72.5 | −0.9 | −2.1; 0.3 | |
| Postpartum | Meal skipping (ref = regular meal eating) | ||||
| Unadjusted model | −173.8 | −358.1; 10.5 | −7.6 | −11.2; −4.0 * | |
| Adjusted model | −150.0 | −327.3; 27.3 | −6.2 | −9.7; −2.7 * | |
| Energy irregularity score (1 SD change) | |||||
| Unadjusted model | 4.3 | −79.1; 87.6 | −2.4 | −4.1; −0.7 * | |
| Adjusted model | 1.3 | −80.1; 82.7 | −1.6 | −3.2; 0.1 | |
| Mean Energy Intake, kcal/d 1 | Overall HEI, Total Score 1 | ||||
|---|---|---|---|---|---|
| Mean | 95% CI | Mean | 95% CI | ||
| Pregnancy | Evening eating pattern | ||||
| Unadjusted model | −0.6 | −1.7 to 0.6 | 0.3 | −0.9 to 1.4 | |
| Adjusted model | −0.3 | −1.4 to 0.8 | 0.3 | −0.8 to 1.4 | |
| Late morning/early afternoon eating pattern | |||||
| Unadjusted model | −0.3 | −1.4 to 0.9 | −0.1 | −1.3 to 1.0 | |
| Adjusted model | −0.2 | −1.3 to 1.0 | −0.7 | −1.8 to 0.5 | |
| Early morning eating pattern | |||||
| Unadjusted model | −1.5 | −2.6 to −0.4 * | 1.1 | −0.0 to 2.2 | |
| Adjusted model | −1.4 | −2.5 to −0.3 * | 1.0 | −0.1 to 2.1 | |
| Postpartum | Evening eating pattern | ||||
| Unadjusted model | −0.7 | −2.4 to 1.0 | 2.4 | 0.7–4.0 * | |
| Adjusted model | 0.2 | −1.6 to 1.9 | 1.2 | −0.5 to 2.9 | |
| Late morning/early afternoon eating pattern | |||||
| Unadjusted model | 0.2 | −1.2 to 1.6 | 0.4 | −0.9 to 1.8 | |
| Adjusted model | 0.6 | −0.8 to 1.9 | −0.3 | −1.6 to 1.0 | |
| Early morning eating pattern | |||||
| Unadjusted model | −0.8 | −2.1 to 0.5 | 1.4 | 0.1–2.7 * | |
| Adjusted model | −0.7 | −2.0 to 0.6 | 1.4 | 0.2–2.6 * | |
Publisher’s Note: MDPI stays neutral with regard to jurisdictional claims in published maps and institutional affiliations. |
© 2022 by the authors. Licensee MDPI, Basel, Switzerland. This article is an open access article distributed under the terms and conditions of the Creative Commons Attribution (CC BY) license (https://creativecommons.org/licenses/by/4.0/).
Share and Cite
Schwedhelm, C.; Lipsky, L.M.; Temmen, C.D.; Nansel, T.R. Eating Patterns during Pregnancy and Postpartum and Their Association with Diet Quality and Energy Intake. Nutrients 2022, 14, 1167. https://doi.org/10.3390/nu14061167
Schwedhelm C, Lipsky LM, Temmen CD, Nansel TR. Eating Patterns during Pregnancy and Postpartum and Their Association with Diet Quality and Energy Intake. Nutrients. 2022; 14(6):1167. https://doi.org/10.3390/nu14061167
Chicago/Turabian StyleSchwedhelm, Carolina, Leah M. Lipsky, Chelsie D. Temmen, and Tonja R. Nansel. 2022. "Eating Patterns during Pregnancy and Postpartum and Their Association with Diet Quality and Energy Intake" Nutrients 14, no. 6: 1167. https://doi.org/10.3390/nu14061167
APA StyleSchwedhelm, C., Lipsky, L. M., Temmen, C. D., & Nansel, T. R. (2022). Eating Patterns during Pregnancy and Postpartum and Their Association with Diet Quality and Energy Intake. Nutrients, 14(6), 1167. https://doi.org/10.3390/nu14061167