
Milk and Fermented Milk Consumption and Risk of Stroke: Longitudinal Study


Abstract
:1. Introduction
2. Materials and Methods
2.1. Study Population
2.2. Ethical Compliance Statement
2.3. Exposure Assessment
2.4. Ascertainment of Stroke, Cerebral Infarction, and Hemorrhagic Stroke
2.5. Statistical Analysis
3. Results
3.1. Characteristics of the Study Population
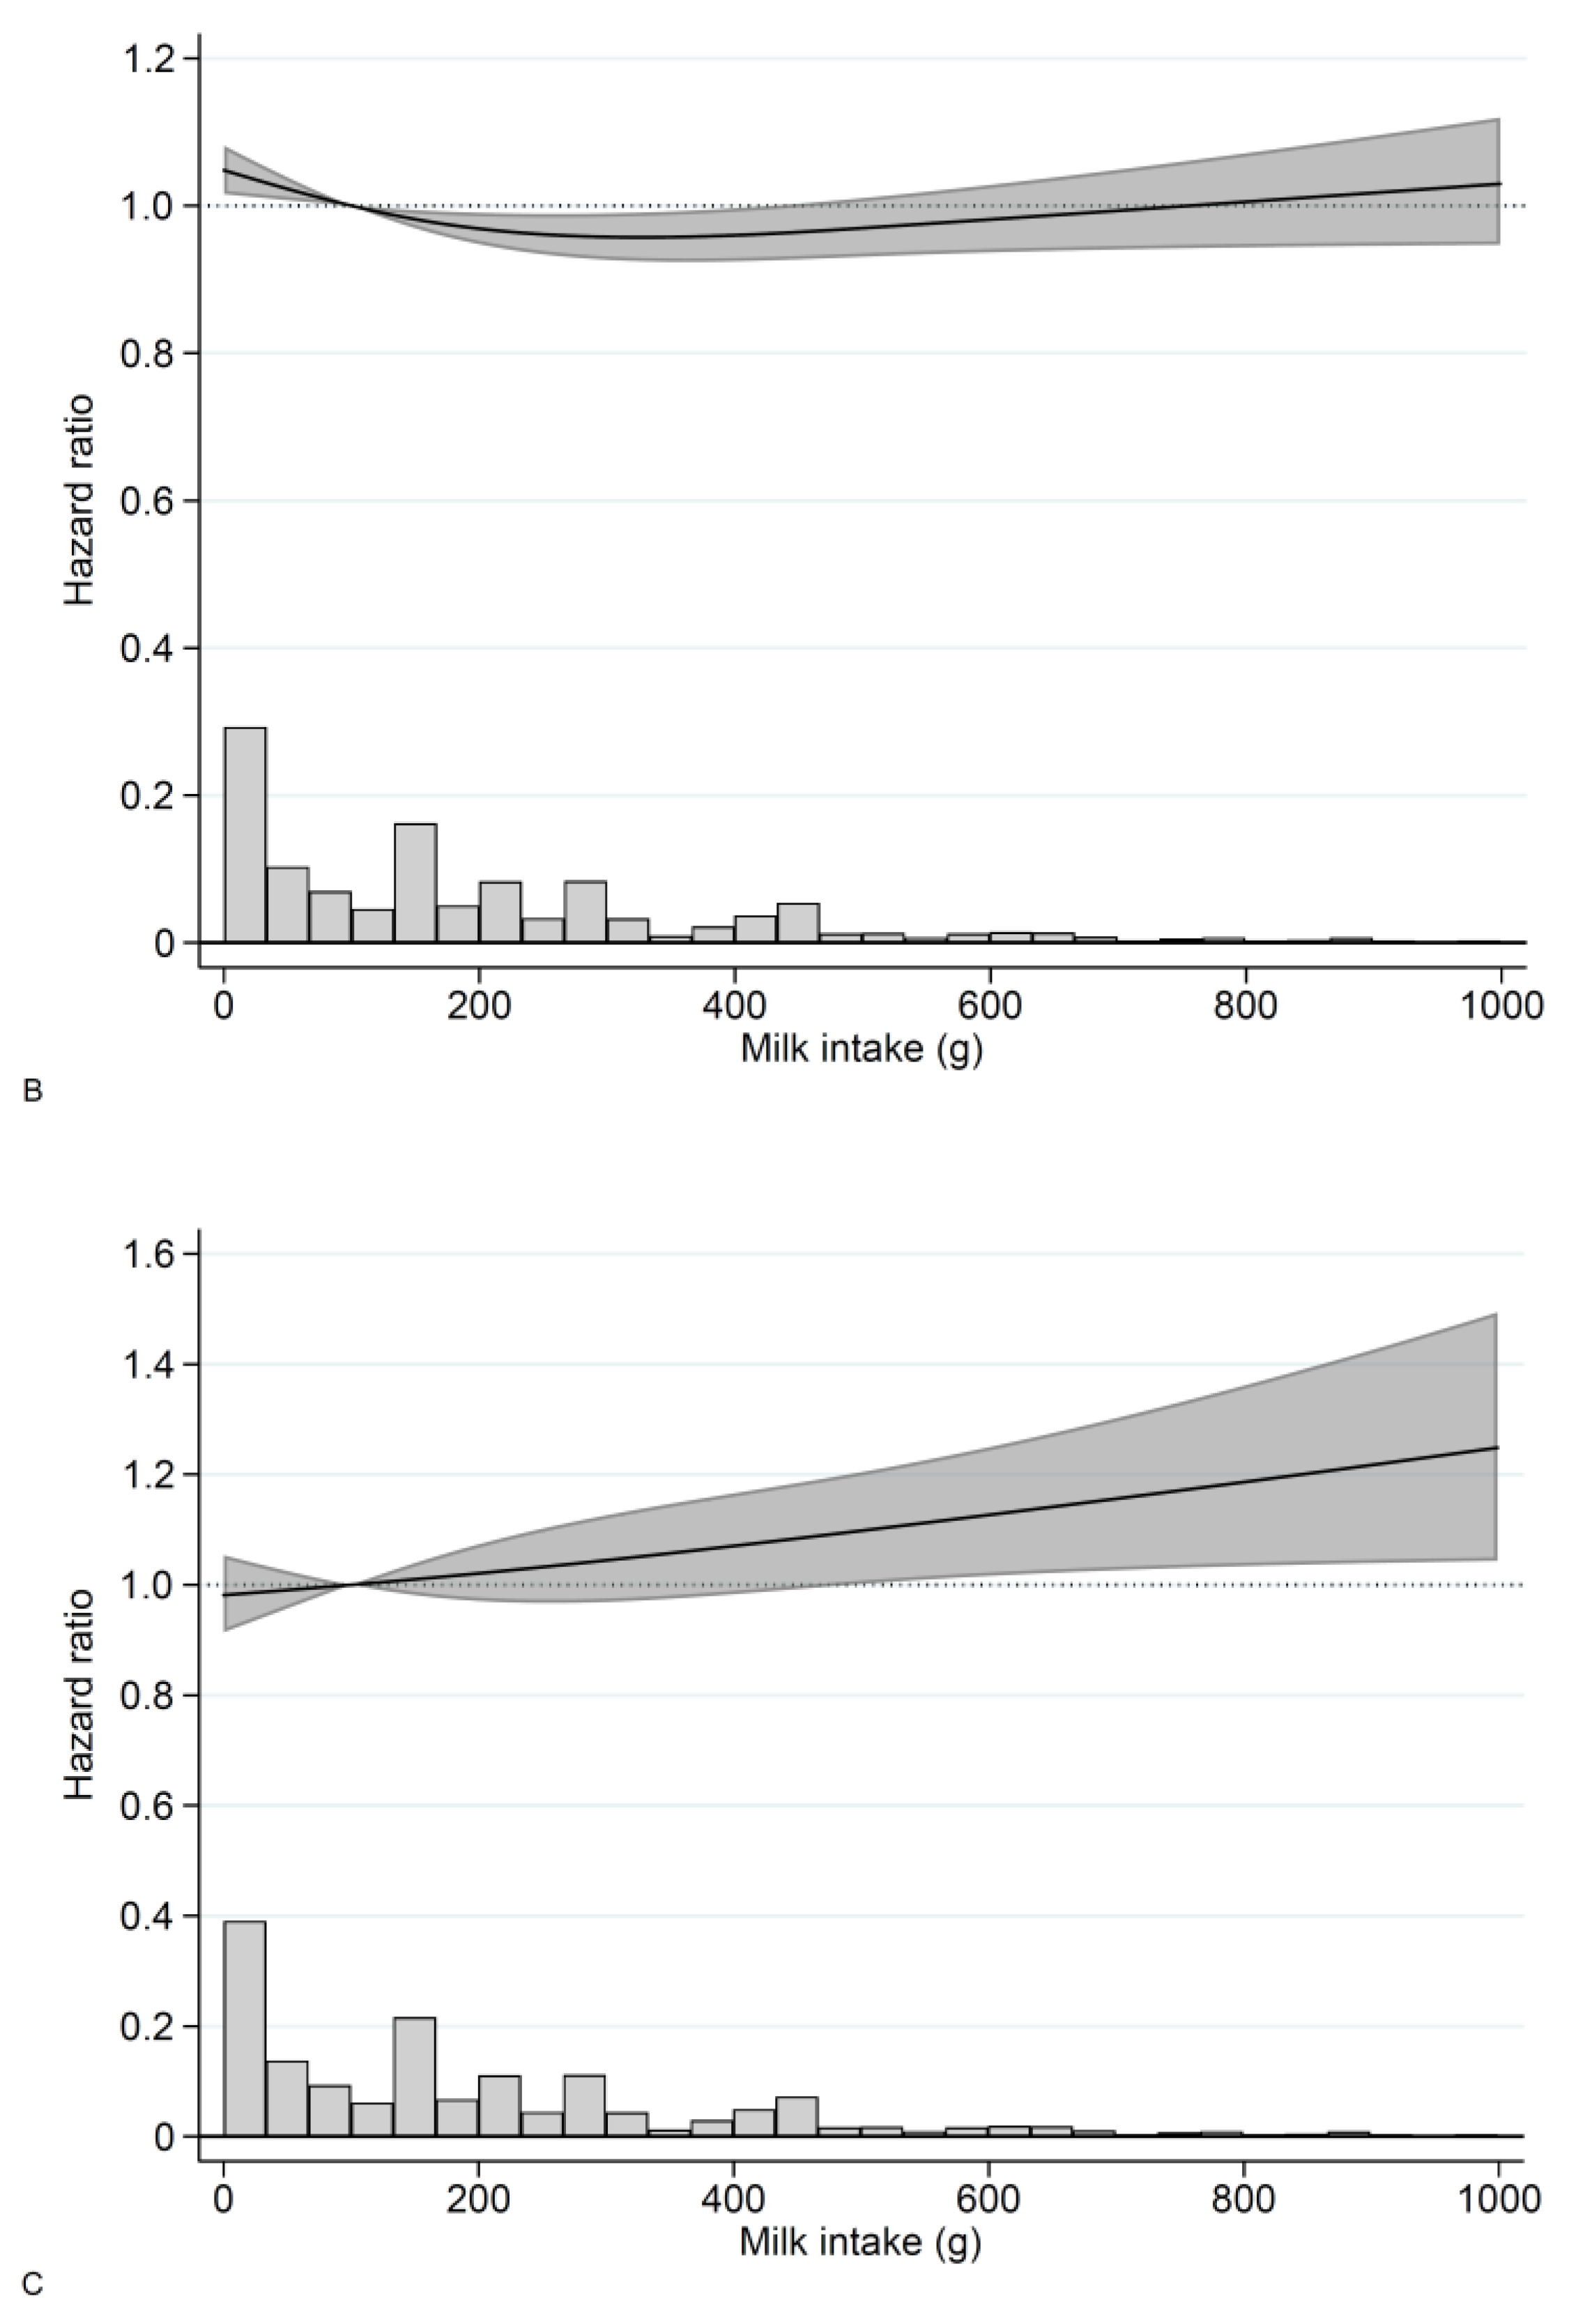
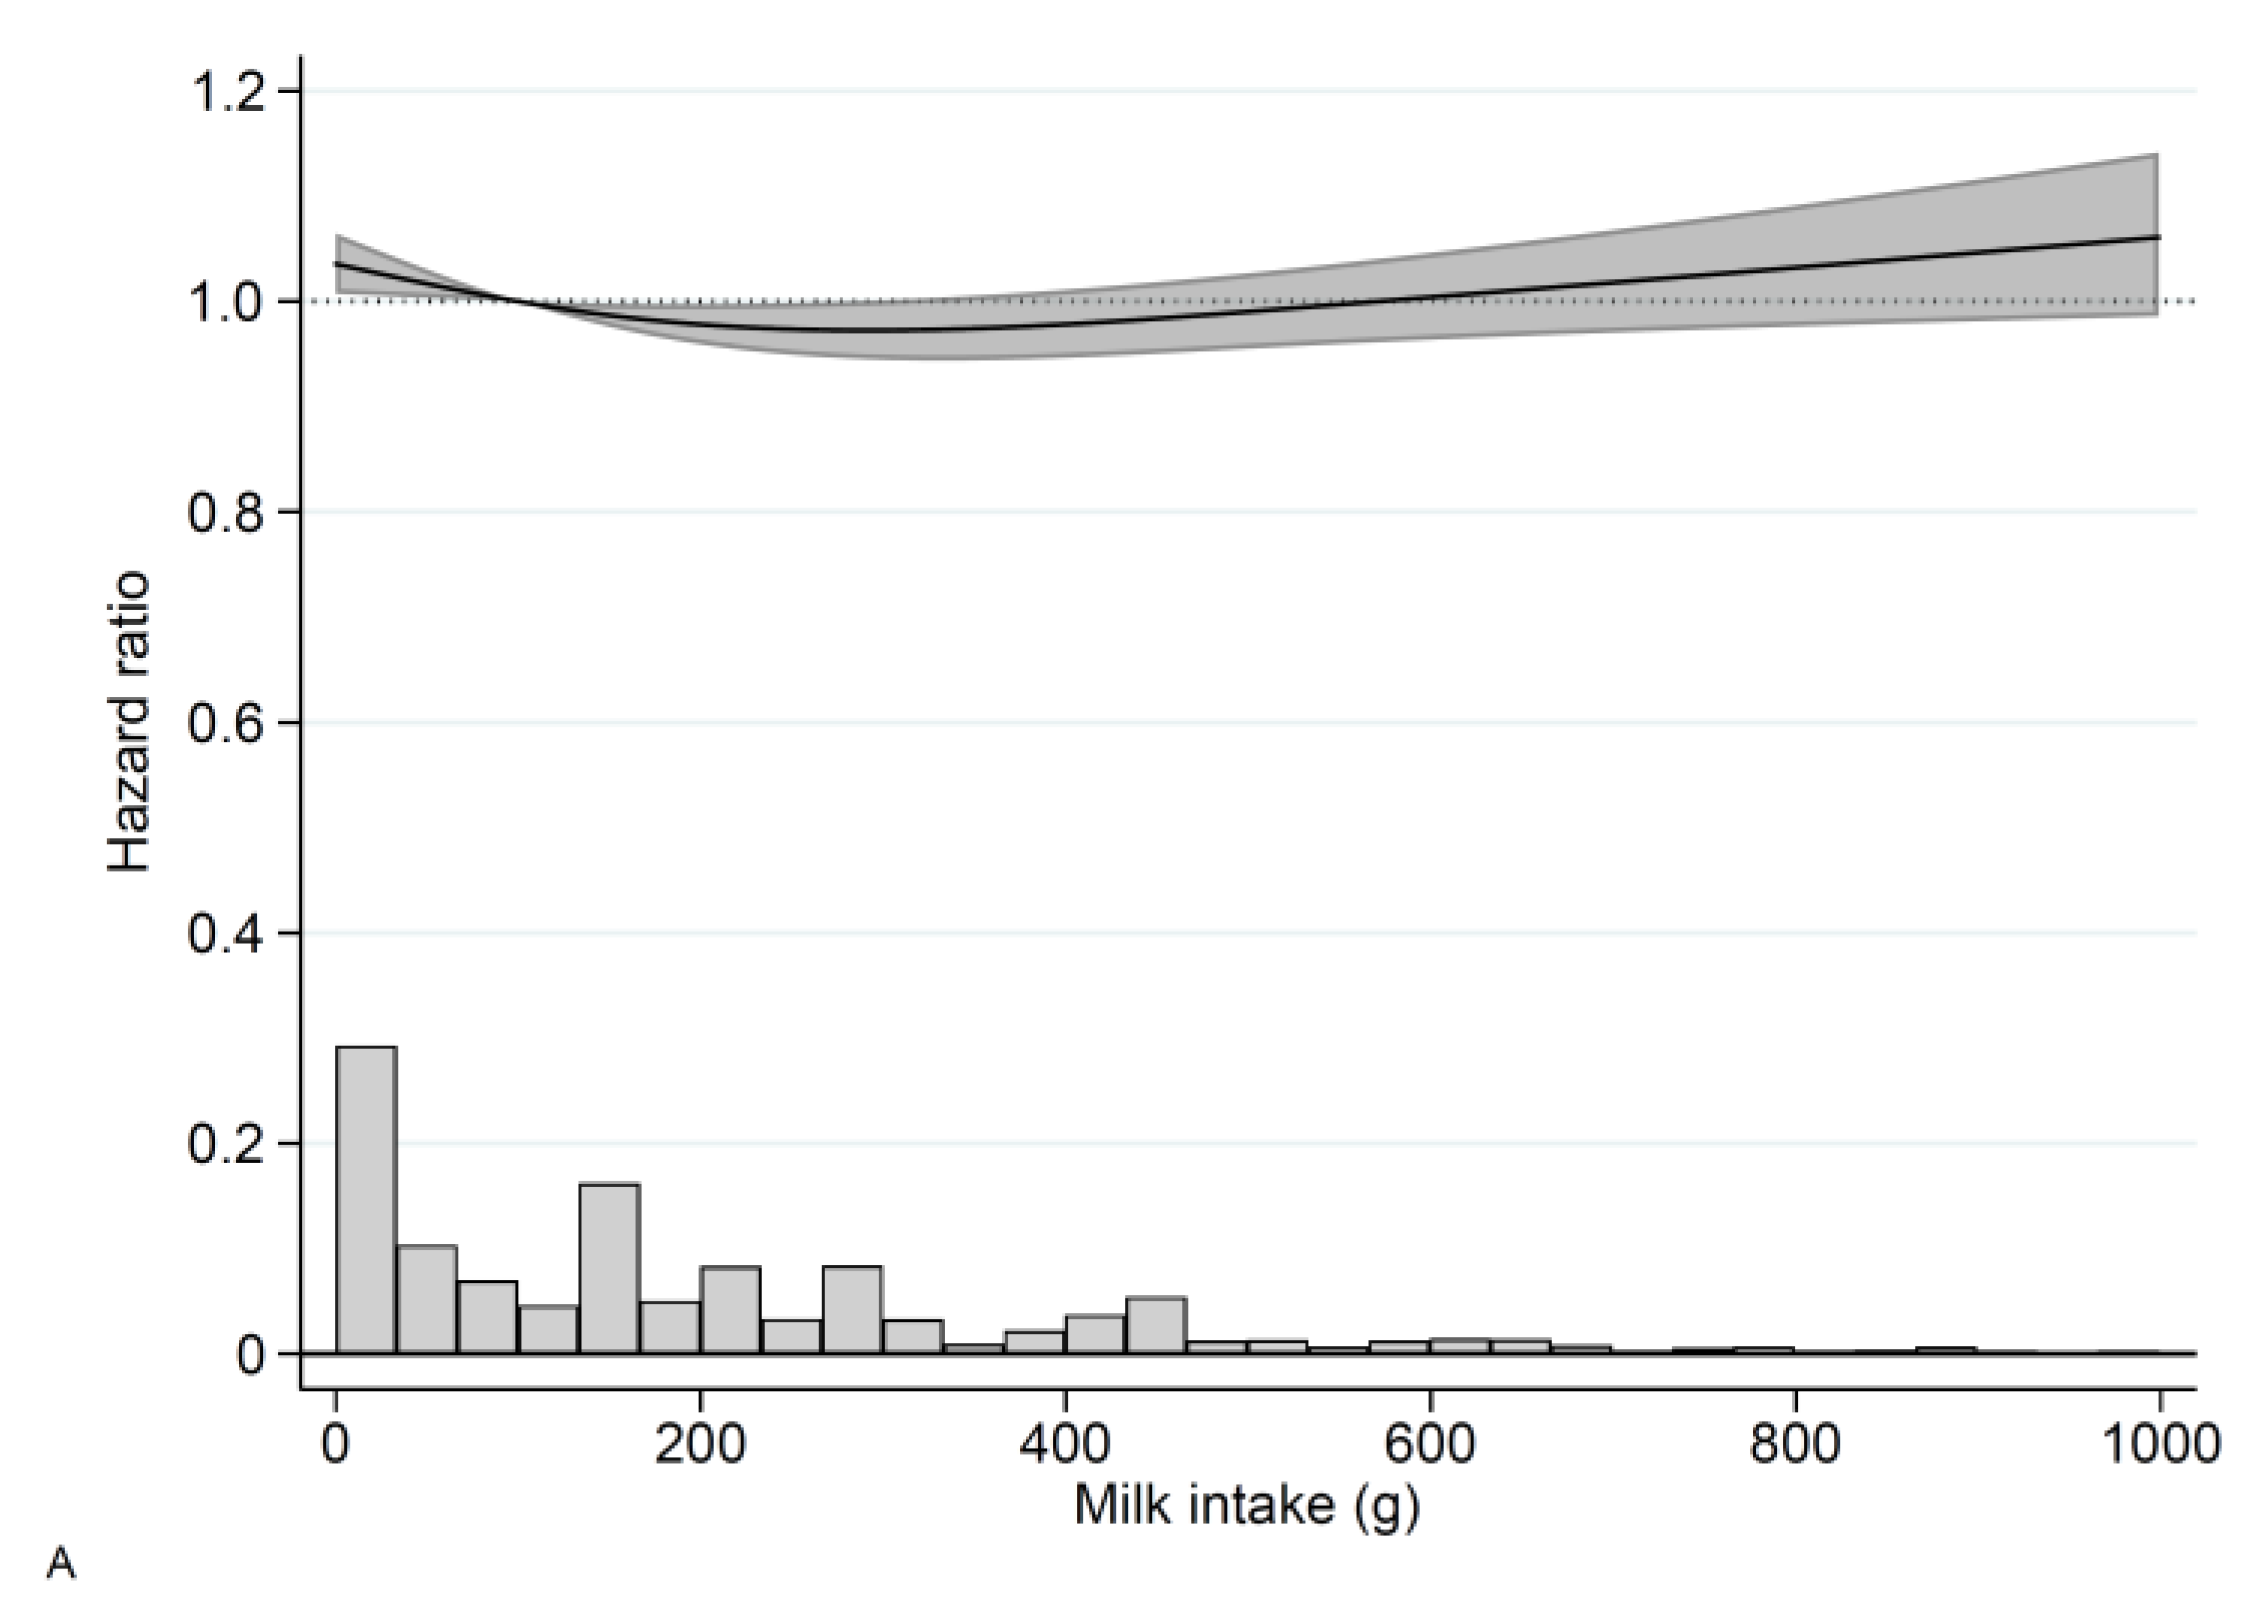
3.2. Milk
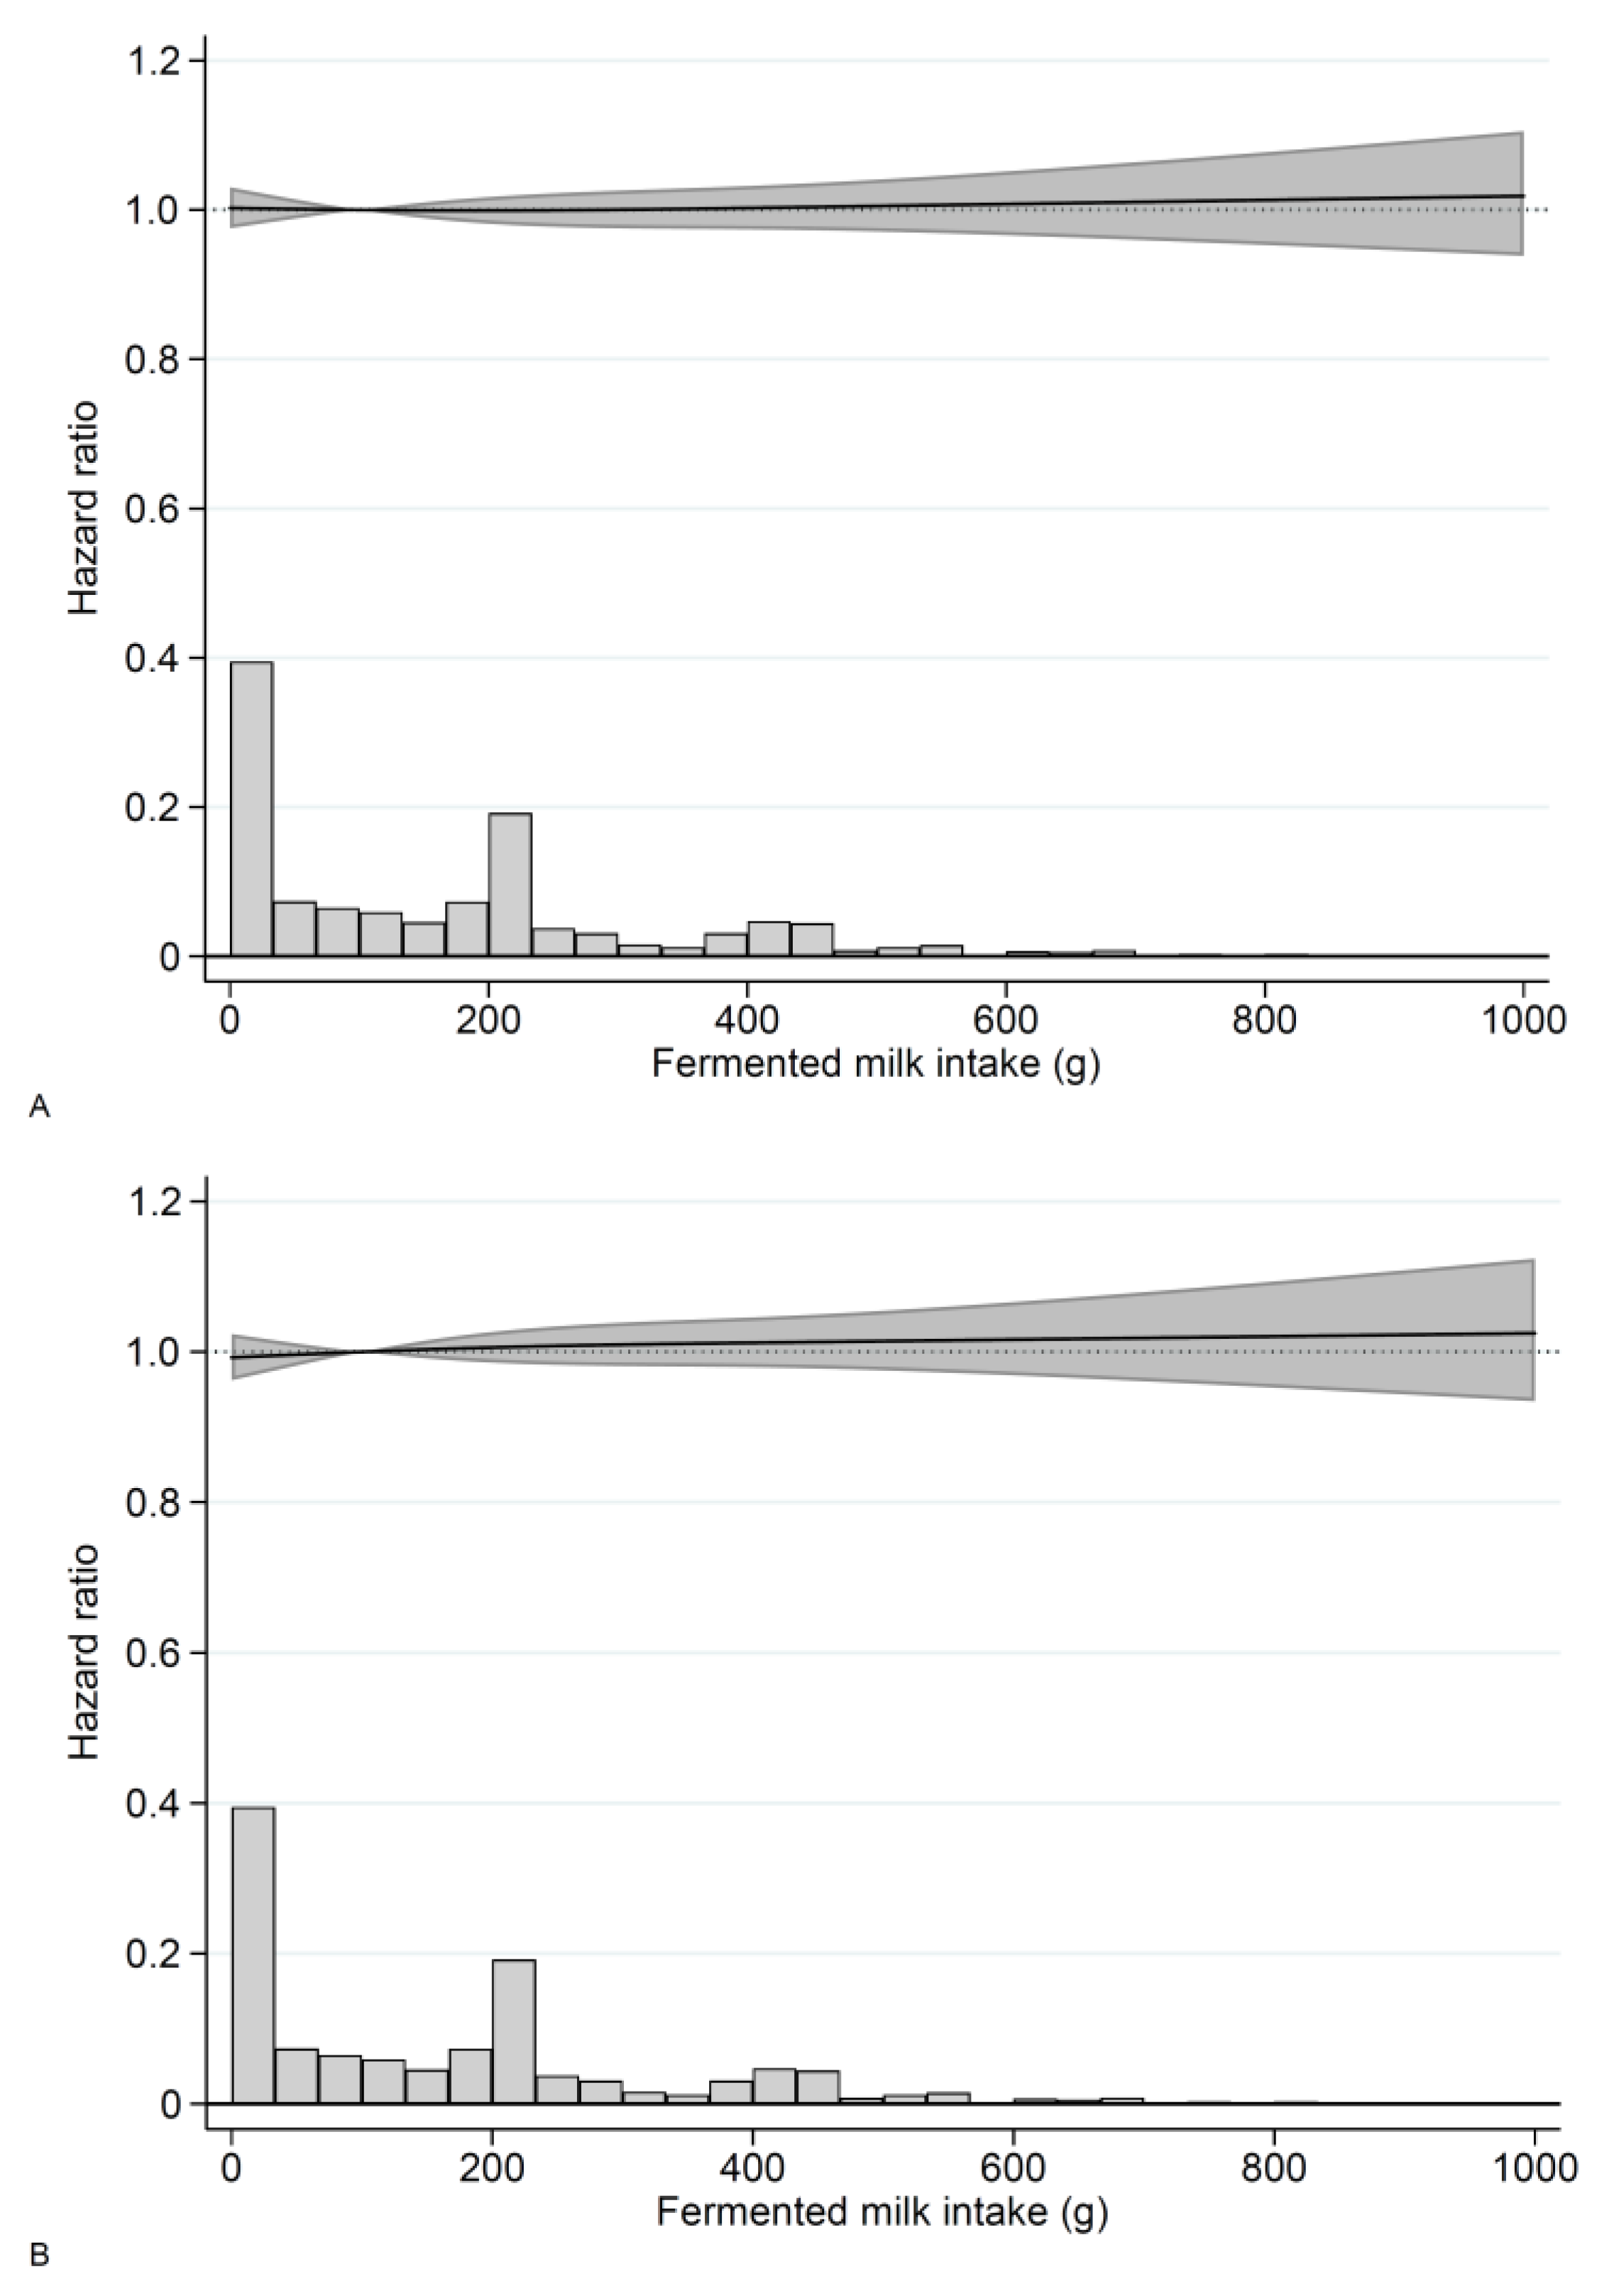
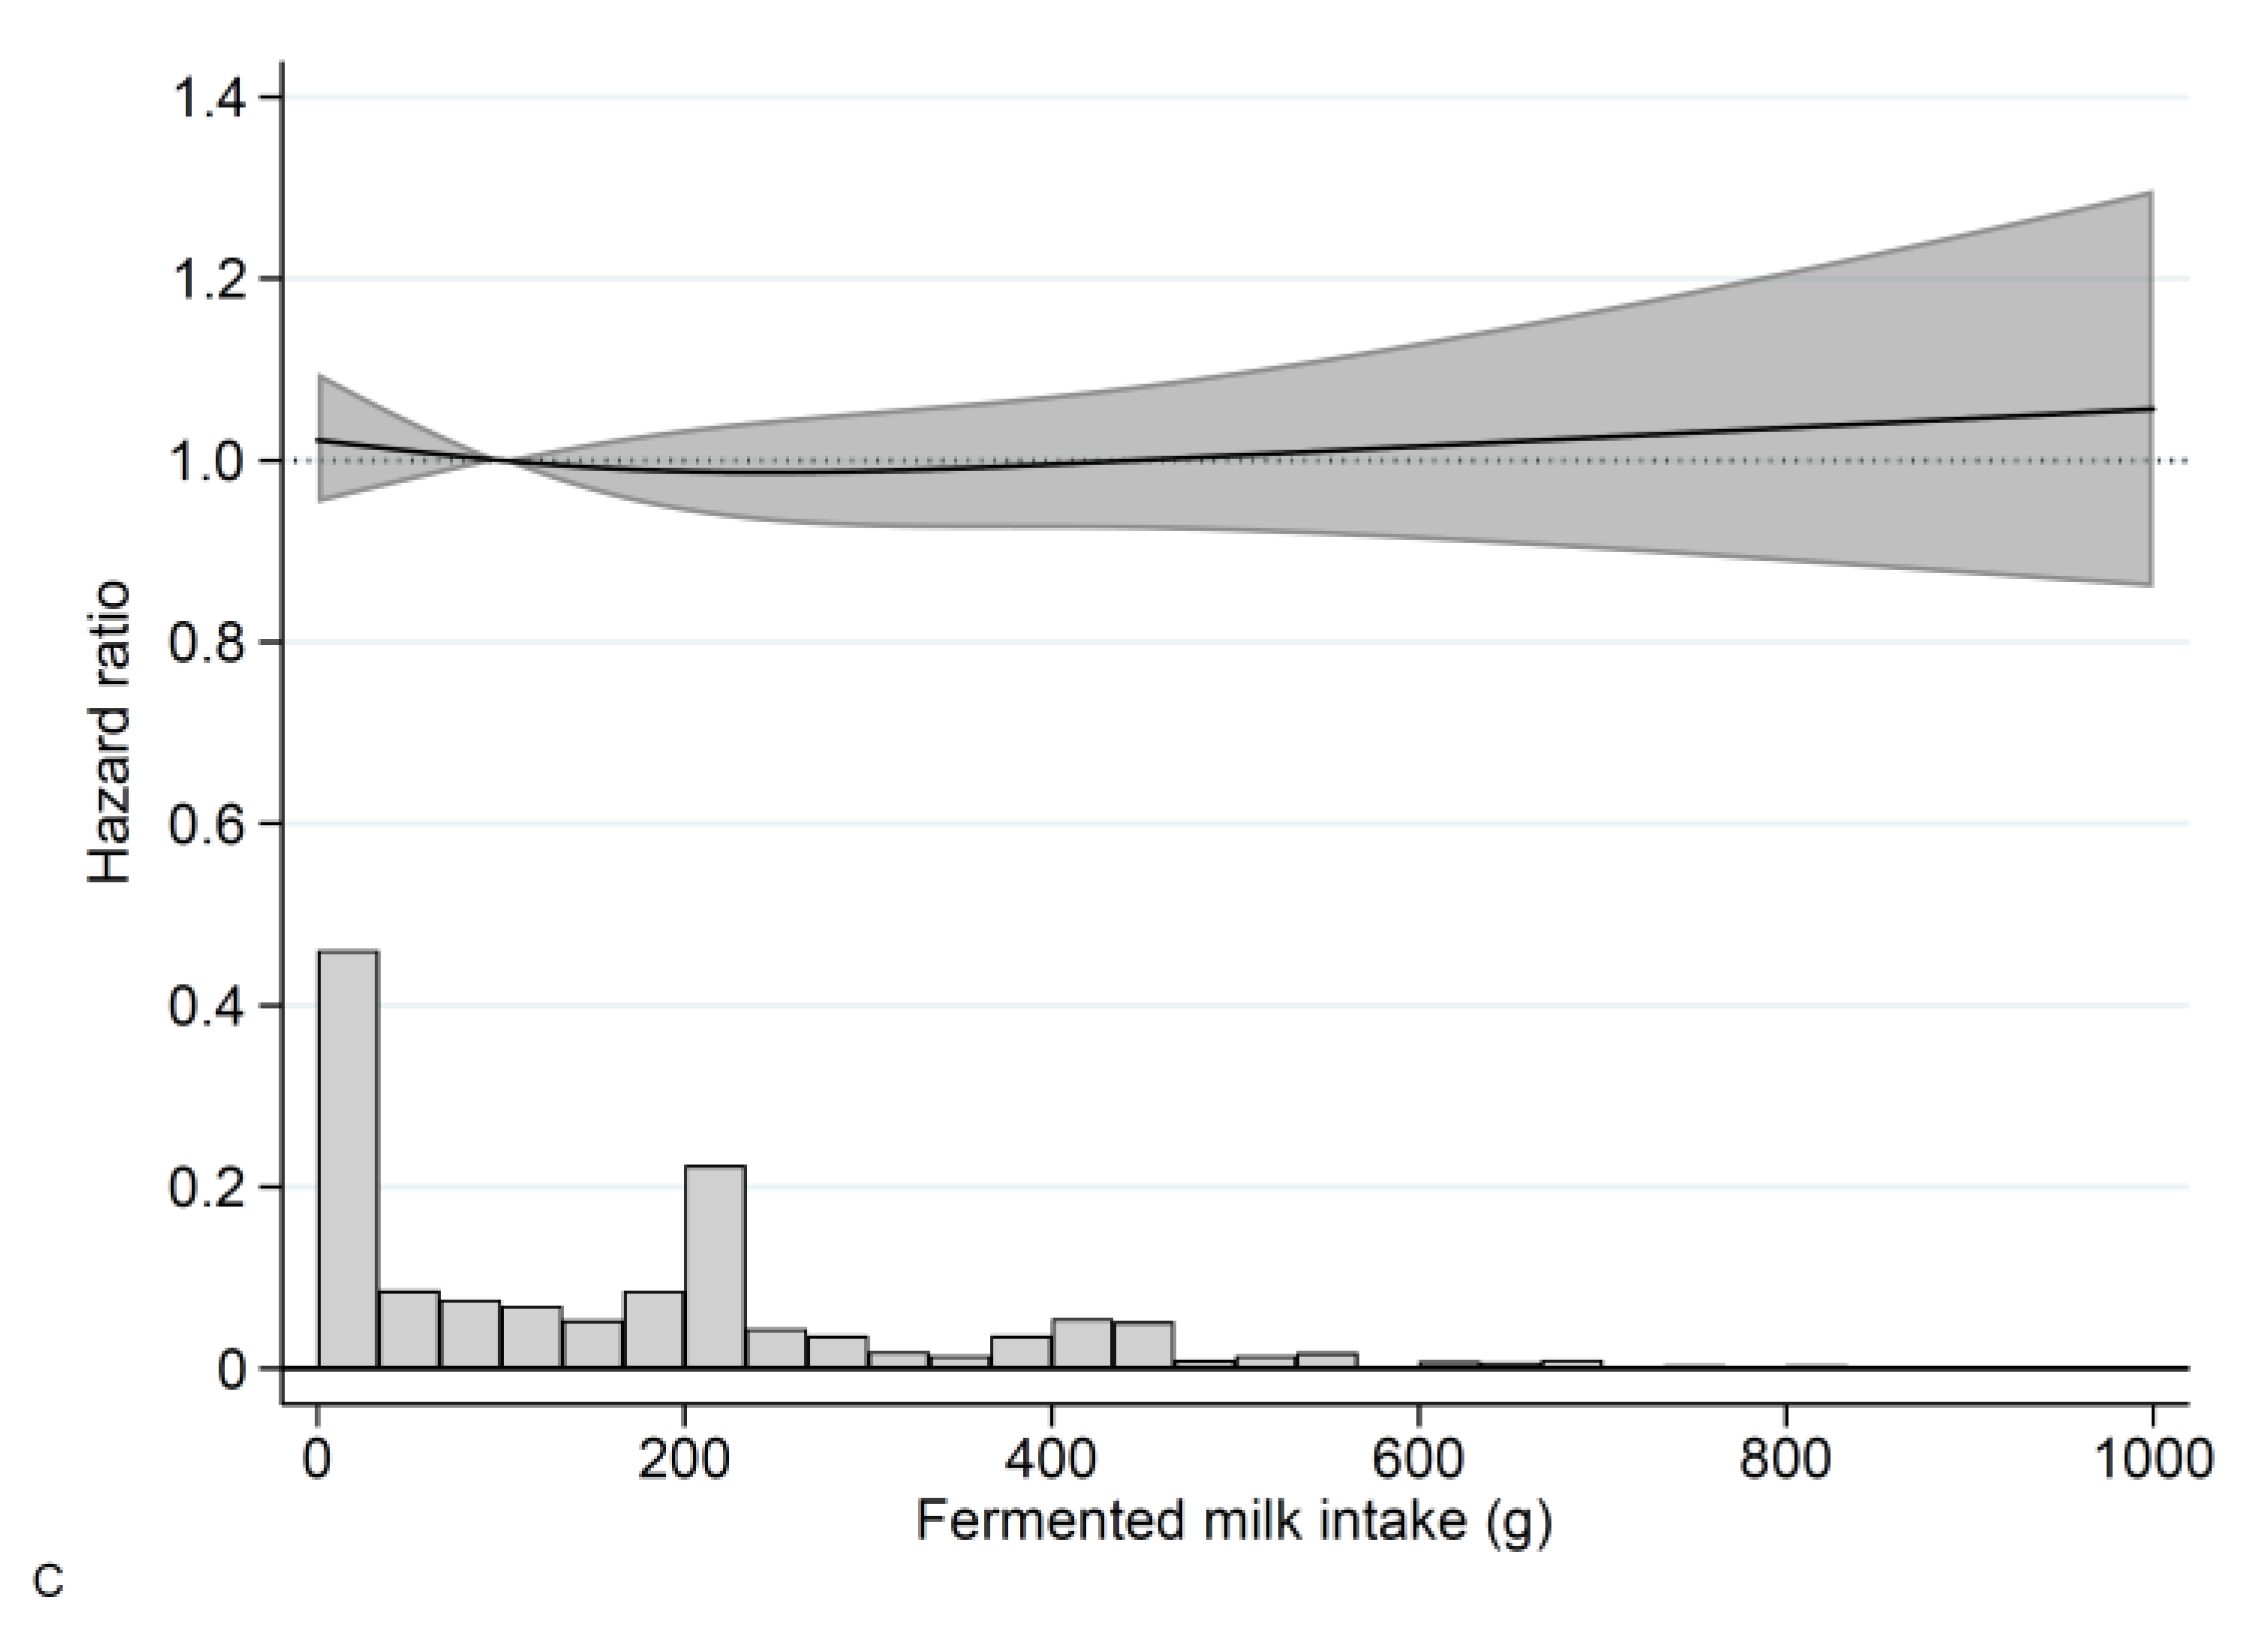
3.3. Fermented Milk
4. Discussion
5. Conclusions
Supplementary Materials
Author Contributions
Funding
Institutional Review Board Statement
Informed Consent Statement
Data Availability Statement
Acknowledgments
Conflicts of Interest
References
- Soedamah-Muthu, S.S.; de Goede, J. Dairy Consumption and Cardiometabolic Diseases: Systematic Review and Updated Meta-Analyses of Prospective Cohort Studies. Curr. Nutr. Rep. 2018, 7, 171–182. [Google Scholar] [CrossRef] [PubMed] [Green Version]
- Fontecha, J.; Calvo, M.V.; Juarez, M.; Gil, A.; Martinez-Vizcaino, V. Milk and Dairy Product Consumption and Cardiovascular Diseases: An Overview of Systematic Reviews and Meta-Analyses. Adv. Nutr. 2019, 10, S164–S189. [Google Scholar] [CrossRef] [PubMed]
- Mullie, P.; Pizot, C.; Autier, P. Daily milk consumption and all-cause mortality, coronary heart disease and stroke: A systematic review and meta-analysis of observational cohort studies. BMC Public Health 2016, 16, 1236. [Google Scholar] [CrossRef] [PubMed] [Green Version]
- Dehghan, M.; Mente, A.; Rangarajan, S.; Sheridan, P.; Mohan, V.; Iqbal, R.; Gupta, R.; Lear, S.; Wentzel-Viljoen, E.; Avezum, A.; et al. Association of dairy intake with cardiovascular disease and mortality in 21 countries from five continents (PURE): A prospective cohort study. Lancet 2018, 392, 2288–2297. [Google Scholar] [CrossRef]
- de Goede, J.; Soedamah-Muthu, S.S.; Pan, A.; Gijsbers, L.; Geleijnse, J.M. Dairy Consumption and Risk of Stroke: A Systematic Review and Updated Dose-Response Meta-Analysis of Prospective Cohort Studies. J. Am. Heart Assoc. 2016, 5, e002787. [Google Scholar] [CrossRef] [Green Version]
- Talaei, M.; Koh, W.P.; Yuan, J.M.; Pan, A. The association between dairy product intake and cardiovascular disease mortality in Chinese adults. Eur. J. Nutr. 2017, 56, 2343–2352. [Google Scholar] [CrossRef]
- Tong, T.Y.N.; Appleby, P.N.; Key, T.J.; Dahm, C.C.; Overvad, K.; Olsen, A.; Tjonneland, A.; Katzke, V.; Kuhn, T.; Boeing, H.; et al. The associations of major foods and fibre with risks of ischaemic and haemorrhagic stroke: A prospective study of 418 329 participants in the EPIC cohort across nine European countries. Eur. Heart J. 2020, 41, 2632–2640. [Google Scholar] [CrossRef]
- Harris, H.; Håkansson, N.; Olofsson, C.; Stackelberg, O.; Julin, B.; Åkesson, A.; Wolk, A. The Swedish mammography cohort and the cohort of Swedish men: Study design and characteristics of two population-based longitudinal cohorts. OA Epidemiol. 2013, 1, 16. [Google Scholar] [CrossRef] [Green Version]
- Michaëlsson, K.; Baron, J.A.; Byberg, L.; Höijer, J.; Larsson, S.C.; Svennblad, B.; Melhus, H.; Wolk, A.; Warensjö Lemming, E. Combined associations of body mass index and adherence to a Mediterranean-like diet with all-cause and cardiovascular mortality: A cohort study. PLoS Med. 2020, 17, e1003331. [Google Scholar] [CrossRef]
- Larsson, S.C.; Bergkvist, L.; Wolk, A. Long-term dietary calcium intake and breast cancer risk in a prospective cohort of women. Am. J. Clin. Nutr. 2009, 89, 277–282. [Google Scholar] [CrossRef] [Green Version]
- Larsson, S.C.; Andersson, S.O.; Johansson, J.E.; Wolk, A. Cultured milk, yogurt, and dairy intake in relation to bladder cancer risk in a prospective study of Swedish women and men. Am. J. Clin. Nutr. 2008, 88, 1083–1087. [Google Scholar] [CrossRef] [PubMed] [Green Version]
- Messerer, M.; Johansson, S.E.; Wolk, A. The validity of questionnaire-based micronutrient intake estimates is increased by including dietary supplement use in Swedish men. J. Nutr. 2004, 134, 1800–1805. [Google Scholar] [CrossRef] [PubMed]
- Michaelsson, K.; Wolk, A.; Melhus, H.; Byberg, L. Milk, Fruit and Vegetable, and Total Antioxidant Intakes in Relation to Mortality Rates: Cohort Studies in Women and Men. Am. J. Epidemiol. 2017, 185, 345–361. [Google Scholar] [CrossRef] [PubMed] [Green Version]
- Hansson, L.M.; Galanti, M.R. Diet-associated risks of disease and self-reported food consumption: How shall we treat partial nonresponse in a food frequency questionnaire? Nutr. Cancer 2000, 36, 1–6. [Google Scholar] [CrossRef] [PubMed]
- Michaelsson, K.; Wolk, A.; Langenskiold, S.; Basu, S.; Warensjo Lemming, E.; Melhus, H.; Byberg, L. Milk intake and risk of mortality and fractures in women and men: Cohort studies. BMJ 2014, 349, g6015. [Google Scholar] [CrossRef] [PubMed] [Green Version]
- Michaelsson, K.; Wolk, A.; Lemming, E.W.; Melhus, H.; Byberg, L. Intake of Milk or Fermented Milk Combined With Fruit and Vegetable Consumption in Relation to Hip Fracture Rates: A Cohort Study of Swedish Women. J. Bone Miner. Res. 2018, 33, 449–457. [Google Scholar] [CrossRef]
- Bergström, L.; Kylberg, E.; Hagman, U.; Eriksson, H.; Bruce, Å. The food composition database KOST: The National Food Administration’s information system for nutritive values of food. Vår Föda 1991, 43, 439–447. (In Swedish) [Google Scholar]
- VanderWeele, T.J.; Hernan, M.A.; Robins, J.M. Causal directed acyclic graphs and the direction of unmeasured confounding bias. Epidemiology 2008, 19, 720–728. [Google Scholar] [CrossRef] [Green Version]
- Ludvigsson, J.F.; Appelros, P.; Askling, J.; Byberg, L.; Carrero, J.J.; Ekstrom, A.M.; Ekstrom, M.; Smedby, K.E.; Hagstrom, H.; James, S.; et al. Adaptation of the Charlson Comorbidity Index for Register-Based Research in Sweden. Clin. Epidemiol. 2021, 13, 21–41. [Google Scholar] [CrossRef]
- Johansson, I.; Esberg, A.; Nilsson, L.M.; Jansson, J.H.; Wennberg, P.; Winkvist, A. Dairy Product Intake and Cardiometabolic Diseases in Northern Sweden: A 33-Year Prospective Cohort Study. Nutrients 2019, 11, 284. [Google Scholar] [CrossRef] [Green Version]
- Byberg, L.; Warensjö Lemming, E. Milk Consumption for the Prevention of Fragility Fractures. Nutrients 2020, 12, 2720. [Google Scholar] [CrossRef] [PubMed]
- Sonestedt, E.; Wirfalt, E.; Wallstrom, P.; Gullberg, B.; Orho-Melander, M.; Hedblad, B. Dairy products and its association with incidence of cardiovascular disease: The Malmo diet and cancer cohort. Eur. J. Epidemiol. 2011, 26, 609–618. [Google Scholar] [CrossRef] [PubMed]
- Jakobsen, M.U.; Trolle, E.; Outzen, M.; Mejborn, H.; Gronberg, M.G.; Lyndgaard, C.B.; Stockmarr, A.; Veno, S.K.; Bysted, A. Intake of dairy products and associations with major atherosclerotic cardiovascular diseases: A systematic review and meta-analysis of cohort studies. Sci. Rep. 2021, 11, 1303. [Google Scholar] [CrossRef] [PubMed]
- Elwood, P.C.; Strain, J.J.; Robson, P.J.; Fehily, A.M.; Hughes, J.; Pickering, J.; Ness, A. Milk consumption, stroke, and heart attack risk: Evidence from the Caerphilly cohort of older men. J. Epidemiol. Community Health 2005, 59, 502–505. [Google Scholar] [CrossRef] [PubMed] [Green Version]
- Larsson, S.C.; Mannisto, S.; Virtanen, M.J.; Kontto, J.; Albanes, D.; Virtamo, J. Dairy foods and risk of stroke. Epidemiology 2009, 20, 355–360. [Google Scholar] [CrossRef] [PubMed] [Green Version]
- Kinjo, Y.; Beral, V.; Akiba, S.; Key, T.; Mizuno, S.; Appleby, P.; Yamaguchi, N.; Watanabe, S.; Doll, R. Possible protective effect of milk, meat and fish for cerebrovascular disease mortality in Japan. J. Epidemiol. 1999, 9, 268–274. [Google Scholar] [CrossRef] [Green Version]
- Dalmeijer, G.W.; Struijk, E.A.; van der Schouw, Y.T.; Soedamah-Muthu, S.S.; Verschuren, W.M.; Boer, J.M.; Geleijnse, J.M.; Beulens, J.W. Dairy intake and coronary heart disease or stroke—A population-based cohort study. Int. J. Cardiol. 2013, 167, 925–929. [Google Scholar] [CrossRef] [Green Version]
- Larsson, S.C.; Virtamo, J.; Wolk, A. Dairy consumption and risk of stroke in Swedish women and men. Stroke 2012, 43, 1775–1780. [Google Scholar] [CrossRef] [Green Version]
- Sun, L.; Clarke, R.; Bennett, D.; Guo, Y.; Walters, R.G.; Hill, M.; Parish, S.; Millwood, I.Y.; Bian, Z.; Chen, Y.; et al. Causal associations of blood lipids with risk of ischemic stroke and intracerebral hemorrhage in Chinese adults. Nat. Med. 2019, 25, 569–574. [Google Scholar] [CrossRef]
- Falcone, G.J.; Kirsch, E.; Acosta, J.N.; Noche, R.B.; Leasure, A.; Marini, S.; Chung, J.; Selim, M.; Meschia, J.F.; Brown, D.L.; et al. Genetically Elevated LDL Associates with Lower Risk of Intracerebral Hemorrhage. Ann. Neurol. 2020, 88, 56–66. [Google Scholar] [CrossRef]
- Smedman, A.E.; Gustafsson, I.B.; Berglund, L.G.; Vessby, B.O. Pentadecanoic acid in serum as a marker for intake of milk fat: Relations between intake of milk fat and metabolic risk factors. Am. J. Clin. Nutr. 1999, 69, 22–29. [Google Scholar] [CrossRef] [PubMed] [Green Version]
- Vimaleswaran, K.S.; Zhou, A.; Cavadino, A.; Hyppönen, E. Evidence for a causal association between milk intake and cardiometabolic disease outcomes using a two-sample Mendelian Randomization analysis in up to 1,904,220 individuals. Int. J. Obes. 2021, 45, 1751–1762. [Google Scholar] [CrossRef] [PubMed]
- Ceapa, C.; Wopereis, H.; Rezaiki, L.; Kleerebezem, M.; Knol, J.; Oozeer, R. Influence of fermented milk products, prebiotics and probiotics on microbiota composition and health. Best Pract. Res. Clin. Gastroenterol. 2013, 27, 139–155. [Google Scholar] [CrossRef] [PubMed]
- Sommer, F.; Backhed, F. The gut microbiota—masters of host development and physiology. Nat. Rev. Microbiol. 2013, 11, 227–238. [Google Scholar] [CrossRef]
- Shuai, M.; Zuo, L.S.; Miao, Z.; Gou, W.; Xu, F.; Jiang, Z.; Ling, C.W.; Fu, Y.; Xiong, F.; Chen, Y.M.; et al. Multi-omics analyses reveal relationships among dairy consumption, gut microbiota and cardiometabolic health. EBioMedicine 2021, 66, 103284. [Google Scholar] [CrossRef]
- Melnik, B.C.; Schmitz, G. Pasteurized non-fermented cow’s milk but not fermented milk is a promoter of mTORC1-driven aging and increased mortality. Ageing Res. Rev. 2021, 67, 101270. [Google Scholar] [CrossRef]
- Charidimou, A.; Gang, Q.; Werring, D.J. Sporadic cerebral amyloid angiopathy revisited: Recent insights into pathophysiology and clinical spectrum. J. Neurol. Neurosurg. Psychiatry 2012, 83, 124–137. [Google Scholar] [CrossRef]
- Viswanathan, A.; Greenberg, S.M. Cerebral amyloid angiopathy in the elderly. Ann. Neurol. 2011, 70, 871–880. [Google Scholar] [CrossRef] [Green Version]
- Jolink, W.M.T.; Wiegertjes, K.; Rinkel, G.J.E.; Algra, A.; de Leeuw, F.E.; Klijn, C.J.M. Location-specific risk factors for intracerebral hemorrhage: Systematic review and meta-analysis. Neurology 2020, 95, e1807–e1818. [Google Scholar] [CrossRef]


| Grams of Milk per Day | |||||
|---|---|---|---|---|---|
| Variable | Unit or Level | 0–199 | 200–399 | 400–599 | ≥600 |
| Number | 45,578 | 17,513 | 9274 | 7253 | |
| Women, n (%) | 26,073 (57) | 7115 (40.6) | 2079 (22) | 625 (8.6) | |
| Age, mean (SD), years | 60.8 (9.3) | 62.3 (9.7) | 61.8 (9.6) | 60.6 (9.5) | |
| Education level, n (%) | ≤9 years | 29,973 (66.0) | 12,395 (71.2) | 6859 (74.4) | 5537 (76.9) |
| 10–12 years | 6225 (13.7) | 2218 (12.7) | 1039 (11.3) | 764 (10.6) | |
| >12 years | 9183 (20.2) | 2804 (16.1) | 1316 (14.3) | 898 (12.5) | |
| Body mass index, mean (SD), kg/m2 | 25.2 (3.6) | 25.5 (3.6) | 25.8 (3.6) | 26.3 (3.6) | |
| Living alone, n (%) | yes | 8416 (20.1) | 3308 (20.0) | 1719 (19.2) | 1468 (20.6) |
| Smoking status, n (%) | Current | 10,422 (23.2) | 3988 (23.1) | 2402 (26.3) | 2057 (28.8) |
| Former | 14,145 (31.5) | 5243 (30.4) | 2970 (32.6) | 2541 (35.6) | |
| Never | 20,281 (45.2) | 8035 (46.5) | 3748 (41.1) | 2547 (35.6) | |
| Walking or cycling, n (%) | Never/Seldom | 4883 (11.7) | 1915 (11.9) | 1128 (13.3) | 890 (13.7) |
| <20 min/d | 8972 (21.5) | 3506 (21.8) | 1881 (22.1) | 1535 (23.6) | |
| 20–40 min/d | 13,682 (32.8) | 5033 (31.3) | 2506 (29.5) | 1780 (27.3) | |
| 40–60 min/d | 7171 (17.2) | 2743 (17.1) | 1393 (16.4) | 960 (14.7) | |
| 1–1.5 h/d | 3957 (9.5) | 1567 (9.8) | 826 (9.7) | 628 (9.6) | |
| >1.5 h/d | 3010 (7.2) | 1306 (8.1) | 759 (8.9) | 725 (11.1) | |
| Exercise, n (%) | <1 h/w | 8377 (20.5) | 3091 (19.7) | 1734 (20.9) | 1534 (24.1) |
| 1 h/w | 8993 (22.0) | 3218 (20.5) | 1671 (20.2) | 1150 (18.1) | |
| 2–3 h/w | 13,410 (32.8) | 5203 (33.2) | 2625 (31.7) | 1894 (29.8) | |
| 4–5 h/w | 4977 (12.2) | 1984 (12.6) | 1071 (12.9) | 768 (12.1) | |
| >5 h/w | 5117 (12.5) | 2193 (14.0) | 1185 (14.3) | 1007 (15.9) | |
| Energy intake, mean (SD), kJ/day | 8522 (3199) | 9552 (3257) | 10,825 (3391) | 12,819 (3884) | |
| Energy intake, mean (SD), kcal/day | 2036.9 (765) | 2283 (779) | 2587.3 (811) | 3064 (929) | |
| Alcohol, mean (SD), g/day | 7.8 (9.2) | 7.1 (8.5) | 7.4 (8.7) | 7.6 (9.8) | |
| Coffee, mean (SD), cups/day | 3.2 (1.9) | 3.3 (1.9) | 3.6 (2.0) | 3.9 (2.3) | |
| Milk, mean (SD), g/day | 71 (64) | 271 (51) | 467 (53.2) | 910 (368) | |
| Milk categories, n (%) | 0–199 | 45,578 (100) | 0 (0) | 0 (0) | 0 (0) |
| 200–399 | 0 (0) | 17,513 (100) | 0 (0) | 0 (0) | |
| 400–599 | 0 (0) | 0 (0) | 9274 (100) | 0 (0) | |
| ≥600 | 0 (0) | 0 (0) | 0 (0) | 7253 (100) | |
| Milk missing, n (%) | yes | 9839 (21.6) | 0 (0) | 0 (0) | 0 (0) |
| Fermented milk, mean (SD) | 177 (213) | 173 (217) | 181 (247) | 193 (300) | |
| Fermented milk categories, n (%) | 0 | 12,541 (27.5) | 5762 (32.9) | 3572 (38.5) | 3149 (43.4) |
| 1–199 | 15,439 (33.9) | 5030 (28.7) | 2229 (24.0) | 1556 (21.5) | |
| 200–399 | 12,061 (26.5) | 4367 (24.9) | 1945 (21.0) | 1260 (17.4) | |
| ≥400 | 5537 (12.1) | 2354 (13.4) | 1528 (16.5) | 1288 (17.8) | |
| Fermented milk missing, n (%) | yes | 10,105 (22.2) | 5075 (29.0) | 3143 (33.9) | 2772 (38.2) |
| Fruit and vegetables, mean (SD), servings/day | 4.7 (2.8) | 4.4 (2.6) | 4.0 (2.4) | 3.6 (2.4) | |
| Processed meat, mean (SD), servings/day | 0.7 (0.6) | 0.7 (0.6) | 0.8 (0.6) | 0.8 (0.7) | |
| Soft drinks and Juice, mean (SD), servings/day | 0.8 (1.1) | 0.8 (1.1) | 0.9 (1.2) | 1.1 (1.5) | |
| Energy adjusted total fat, mean (SD), g/day | 73 (19) | 77 (20) | 82 (19) | 86 (18) | |
| Energy adjusted saturated fat, mean (SD), g/day | 33 (10) | 35 (10) | 38 (11) | 41 (11) | |
| Vitamin and supplement use, n (%) | yes | 19,065 (44.9) | 6681 (41.2) | 3128 (36.6) | 2164 (32.3) |
| Hypertension, n (%) | yes | 9551 (21.0) | 4201 (24.0) | 2202 (23.7) | 1760 (24.3) |
| Hypercholesterolemia, n (%) | yes | 5275 (11.6) | 2388 (13.6) | 1314 (14.2) | 1101 (15.2) |
| Diabetes mellitus, n (%) | yes | 2552 (5.6) | 1389 (7.9) | 826 (8.9) | 668 (9.2) |
| Charlson’s weighted comorbidity index | 0 | 40,054 (87.9) | 14,998 (85.6) | 7934 (85.6) | 6133 (84.6) |
| 1 | 3966 (8.7) | 1744 (10.0) | 945 (10.2) | 783 (10.8) | |
| 2+ | 1558 (3.4) | 771 (4.4) | 395 (4.3) | 337 (4.6) | |
| Coronary heart disease, n (%) | 1 | 2649 (5.8) | 1418 (8.1) | 775 (8.4) | 629 (8.7) |
| Atrial fibrillation, n (%) | 1 | 878 (1.9) | 481 (2.7) | 228 (2.5) | 188 (2.6) |
| Transient ischemic attack, n (%) | 1 | 267 (0.6) | 139 (0.8) | 82 (0.9) | 59 (0.8) |
Publisher’s Note: MDPI stays neutral with regard to jurisdictional claims in published maps and institutional affiliations. |
© 2022 by the authors. Licensee MDPI, Basel, Switzerland. This article is an open access article distributed under the terms and conditions of the Creative Commons Attribution (CC BY) license (https://creativecommons.org/licenses/by/4.0/).
Share and Cite
Olsson, E.; Larsson, S.C.; Höijer, J.; Kilander, L.; Byberg, L. Milk and Fermented Milk Consumption and Risk of Stroke: Longitudinal Study. Nutrients 2022, 14, 1070. https://doi.org/10.3390/nu14051070
Olsson E, Larsson SC, Höijer J, Kilander L, Byberg L. Milk and Fermented Milk Consumption and Risk of Stroke: Longitudinal Study. Nutrients. 2022; 14(5):1070. https://doi.org/10.3390/nu14051070
Chicago/Turabian StyleOlsson, Erika, Susanna C. Larsson, Jonas Höijer, Lena Kilander, and Liisa Byberg. 2022. "Milk and Fermented Milk Consumption and Risk of Stroke: Longitudinal Study" Nutrients 14, no. 5: 1070. https://doi.org/10.3390/nu14051070
APA StyleOlsson, E., Larsson, S. C., Höijer, J., Kilander, L., & Byberg, L. (2022). Milk and Fermented Milk Consumption and Risk of Stroke: Longitudinal Study. Nutrients, 14(5), 1070. https://doi.org/10.3390/nu14051070