
Antidiabetic Effects of Pediococcus acidilactici pA1c on HFD-Induced Mice

 , , , and
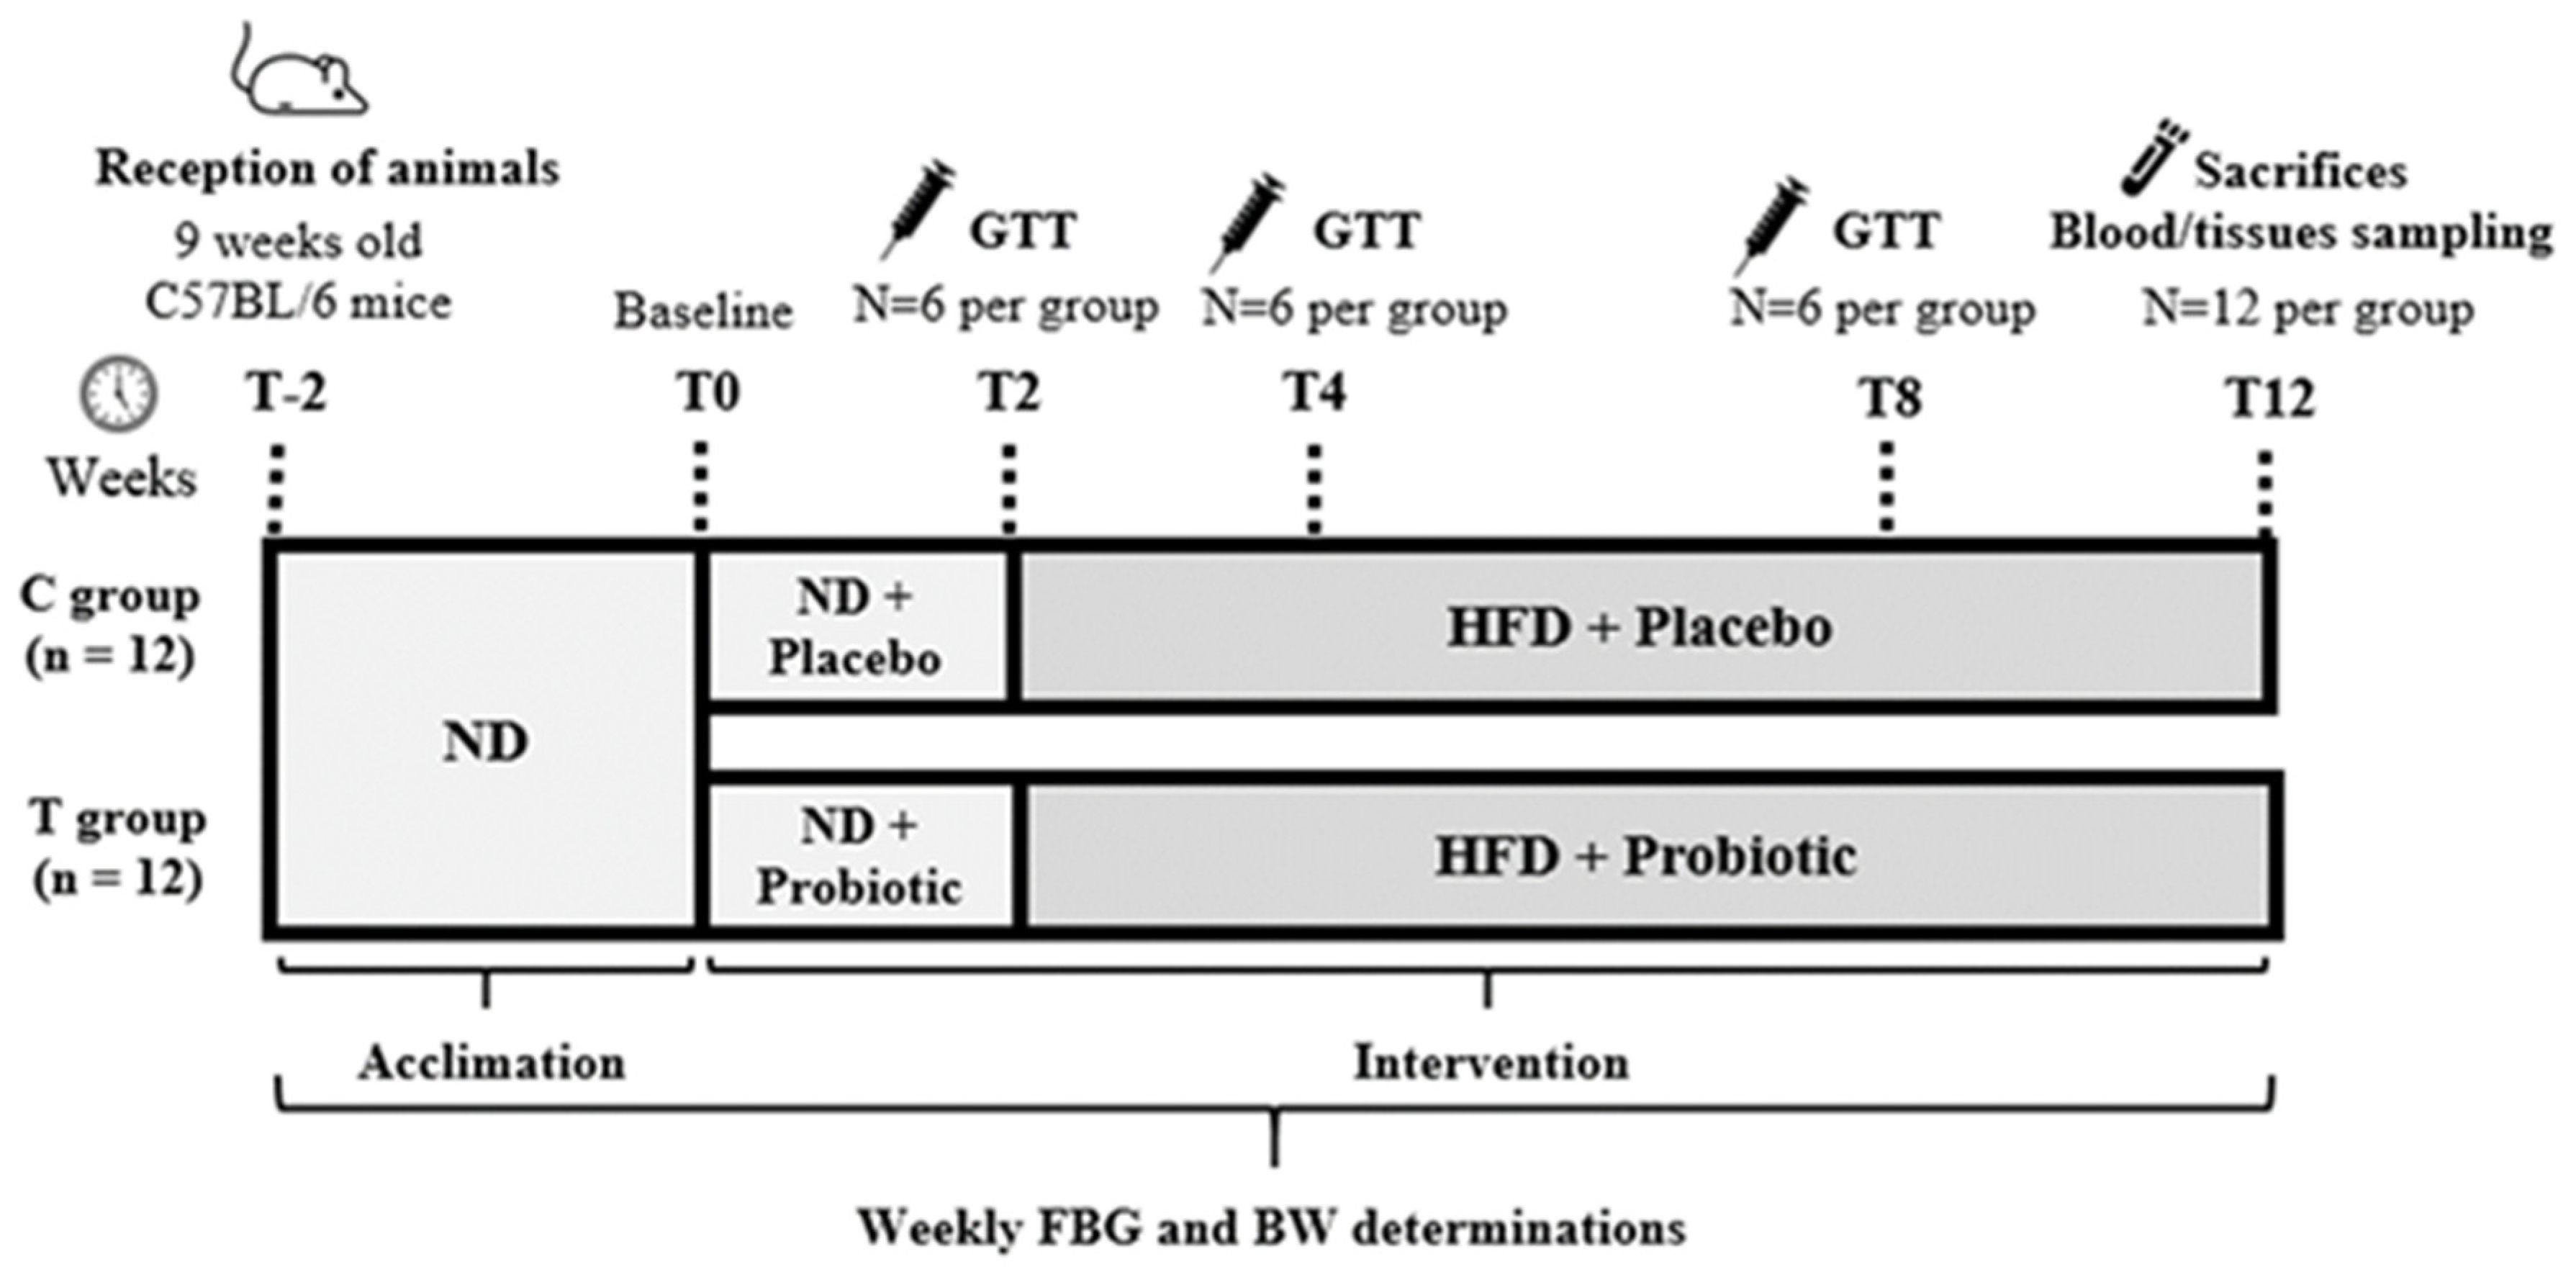
Abstract
1. Introduction
2. Materials and Methods
2.1. Experimental Design
2.2. Experimental Diets
2.3. Body Weight, Fasting Blood Glucose and Glucose Tolerance Test
2.4. Serum Biochemical Analysis
2.5. C-Peptide, GLP-1 and Leptin Analysis
2.6. Tissue Collection and Histological Analysis
2.7. Quantitative Real-Time PCR (RT-qPCR)
2.8. Statistical Analysis
3. Results
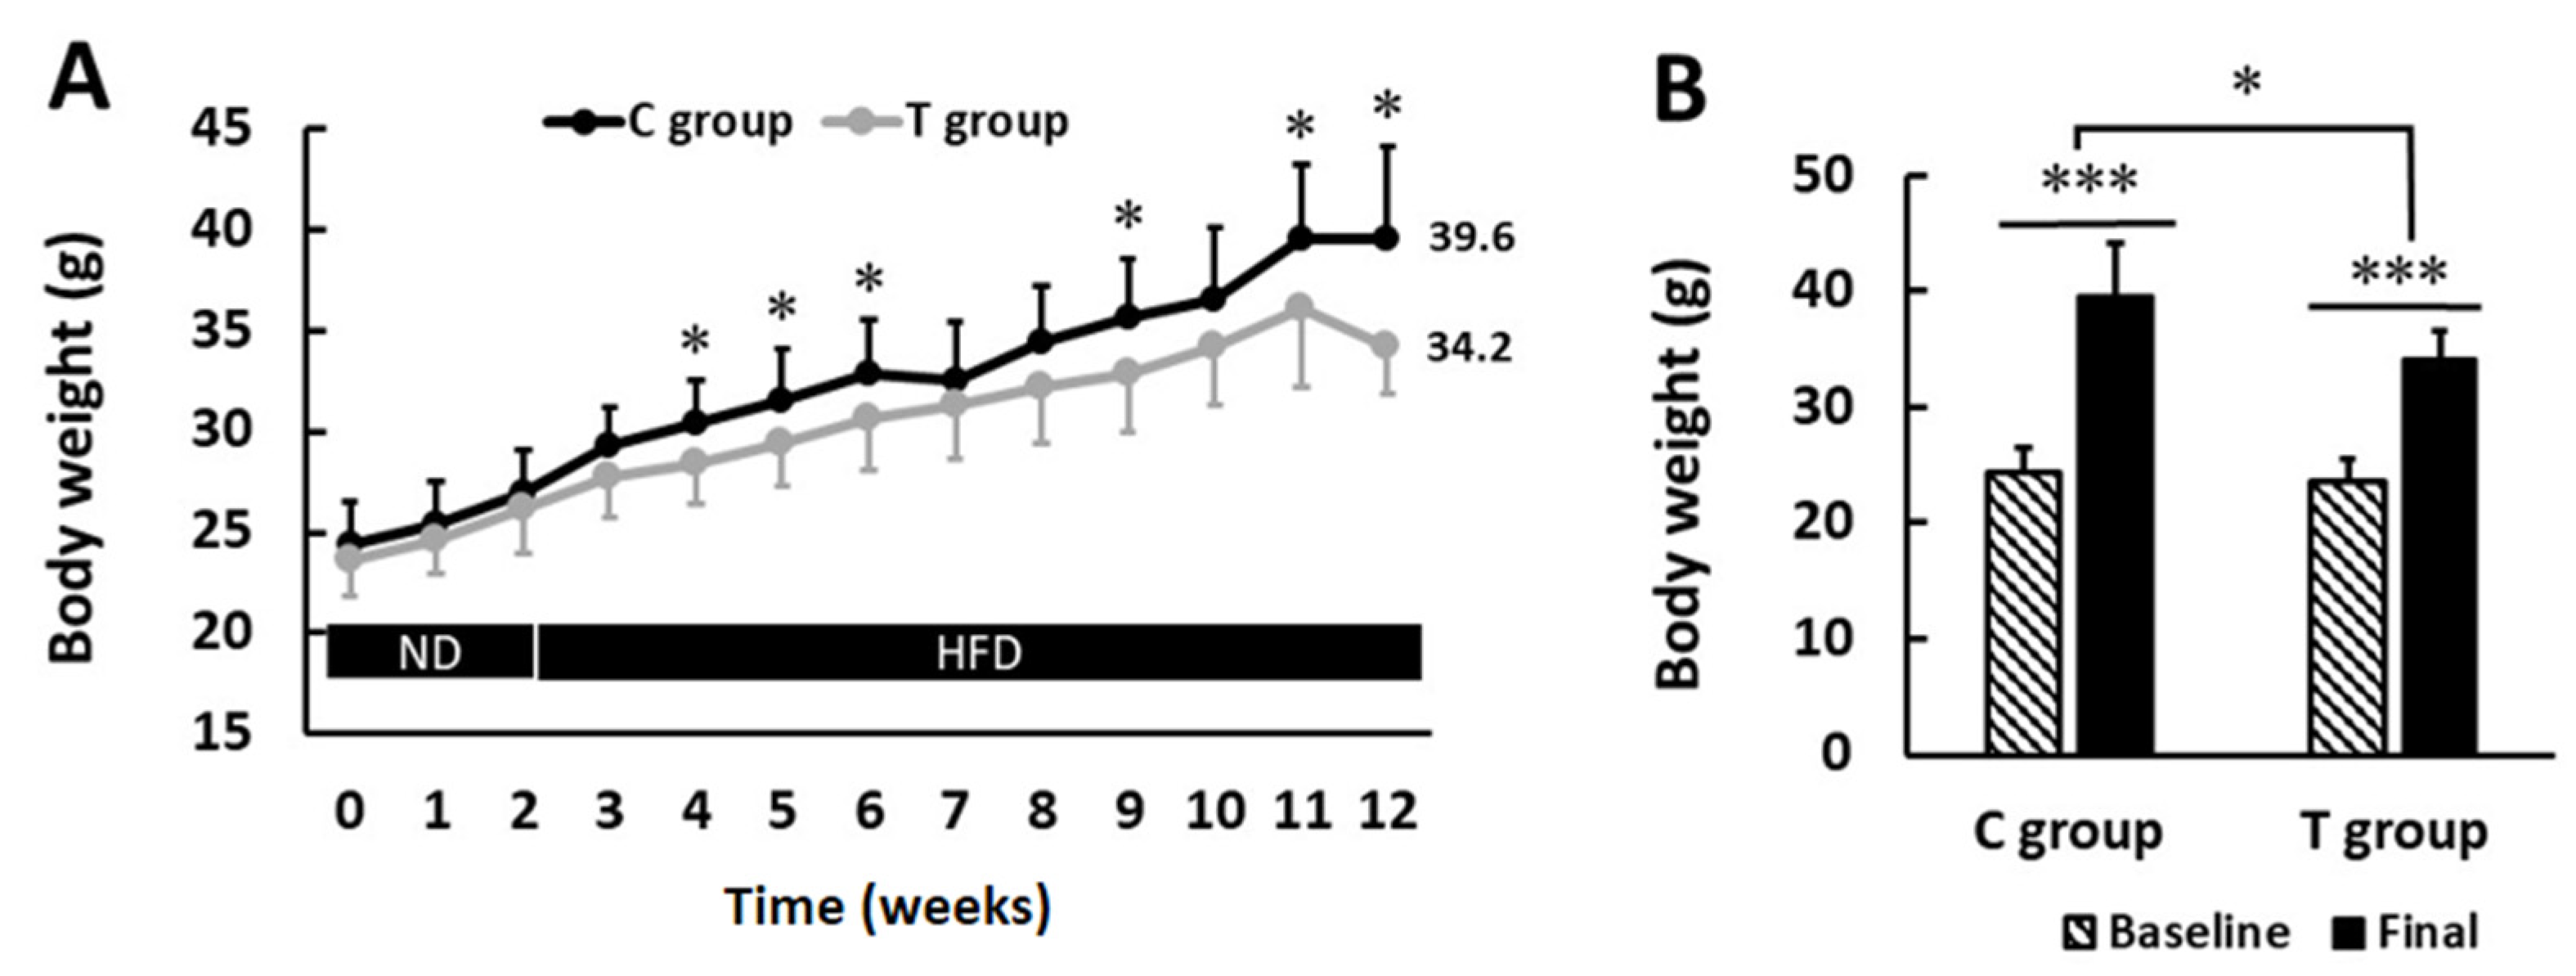
3.1. pA1c Supplementation Attenuates Body Weight Gain
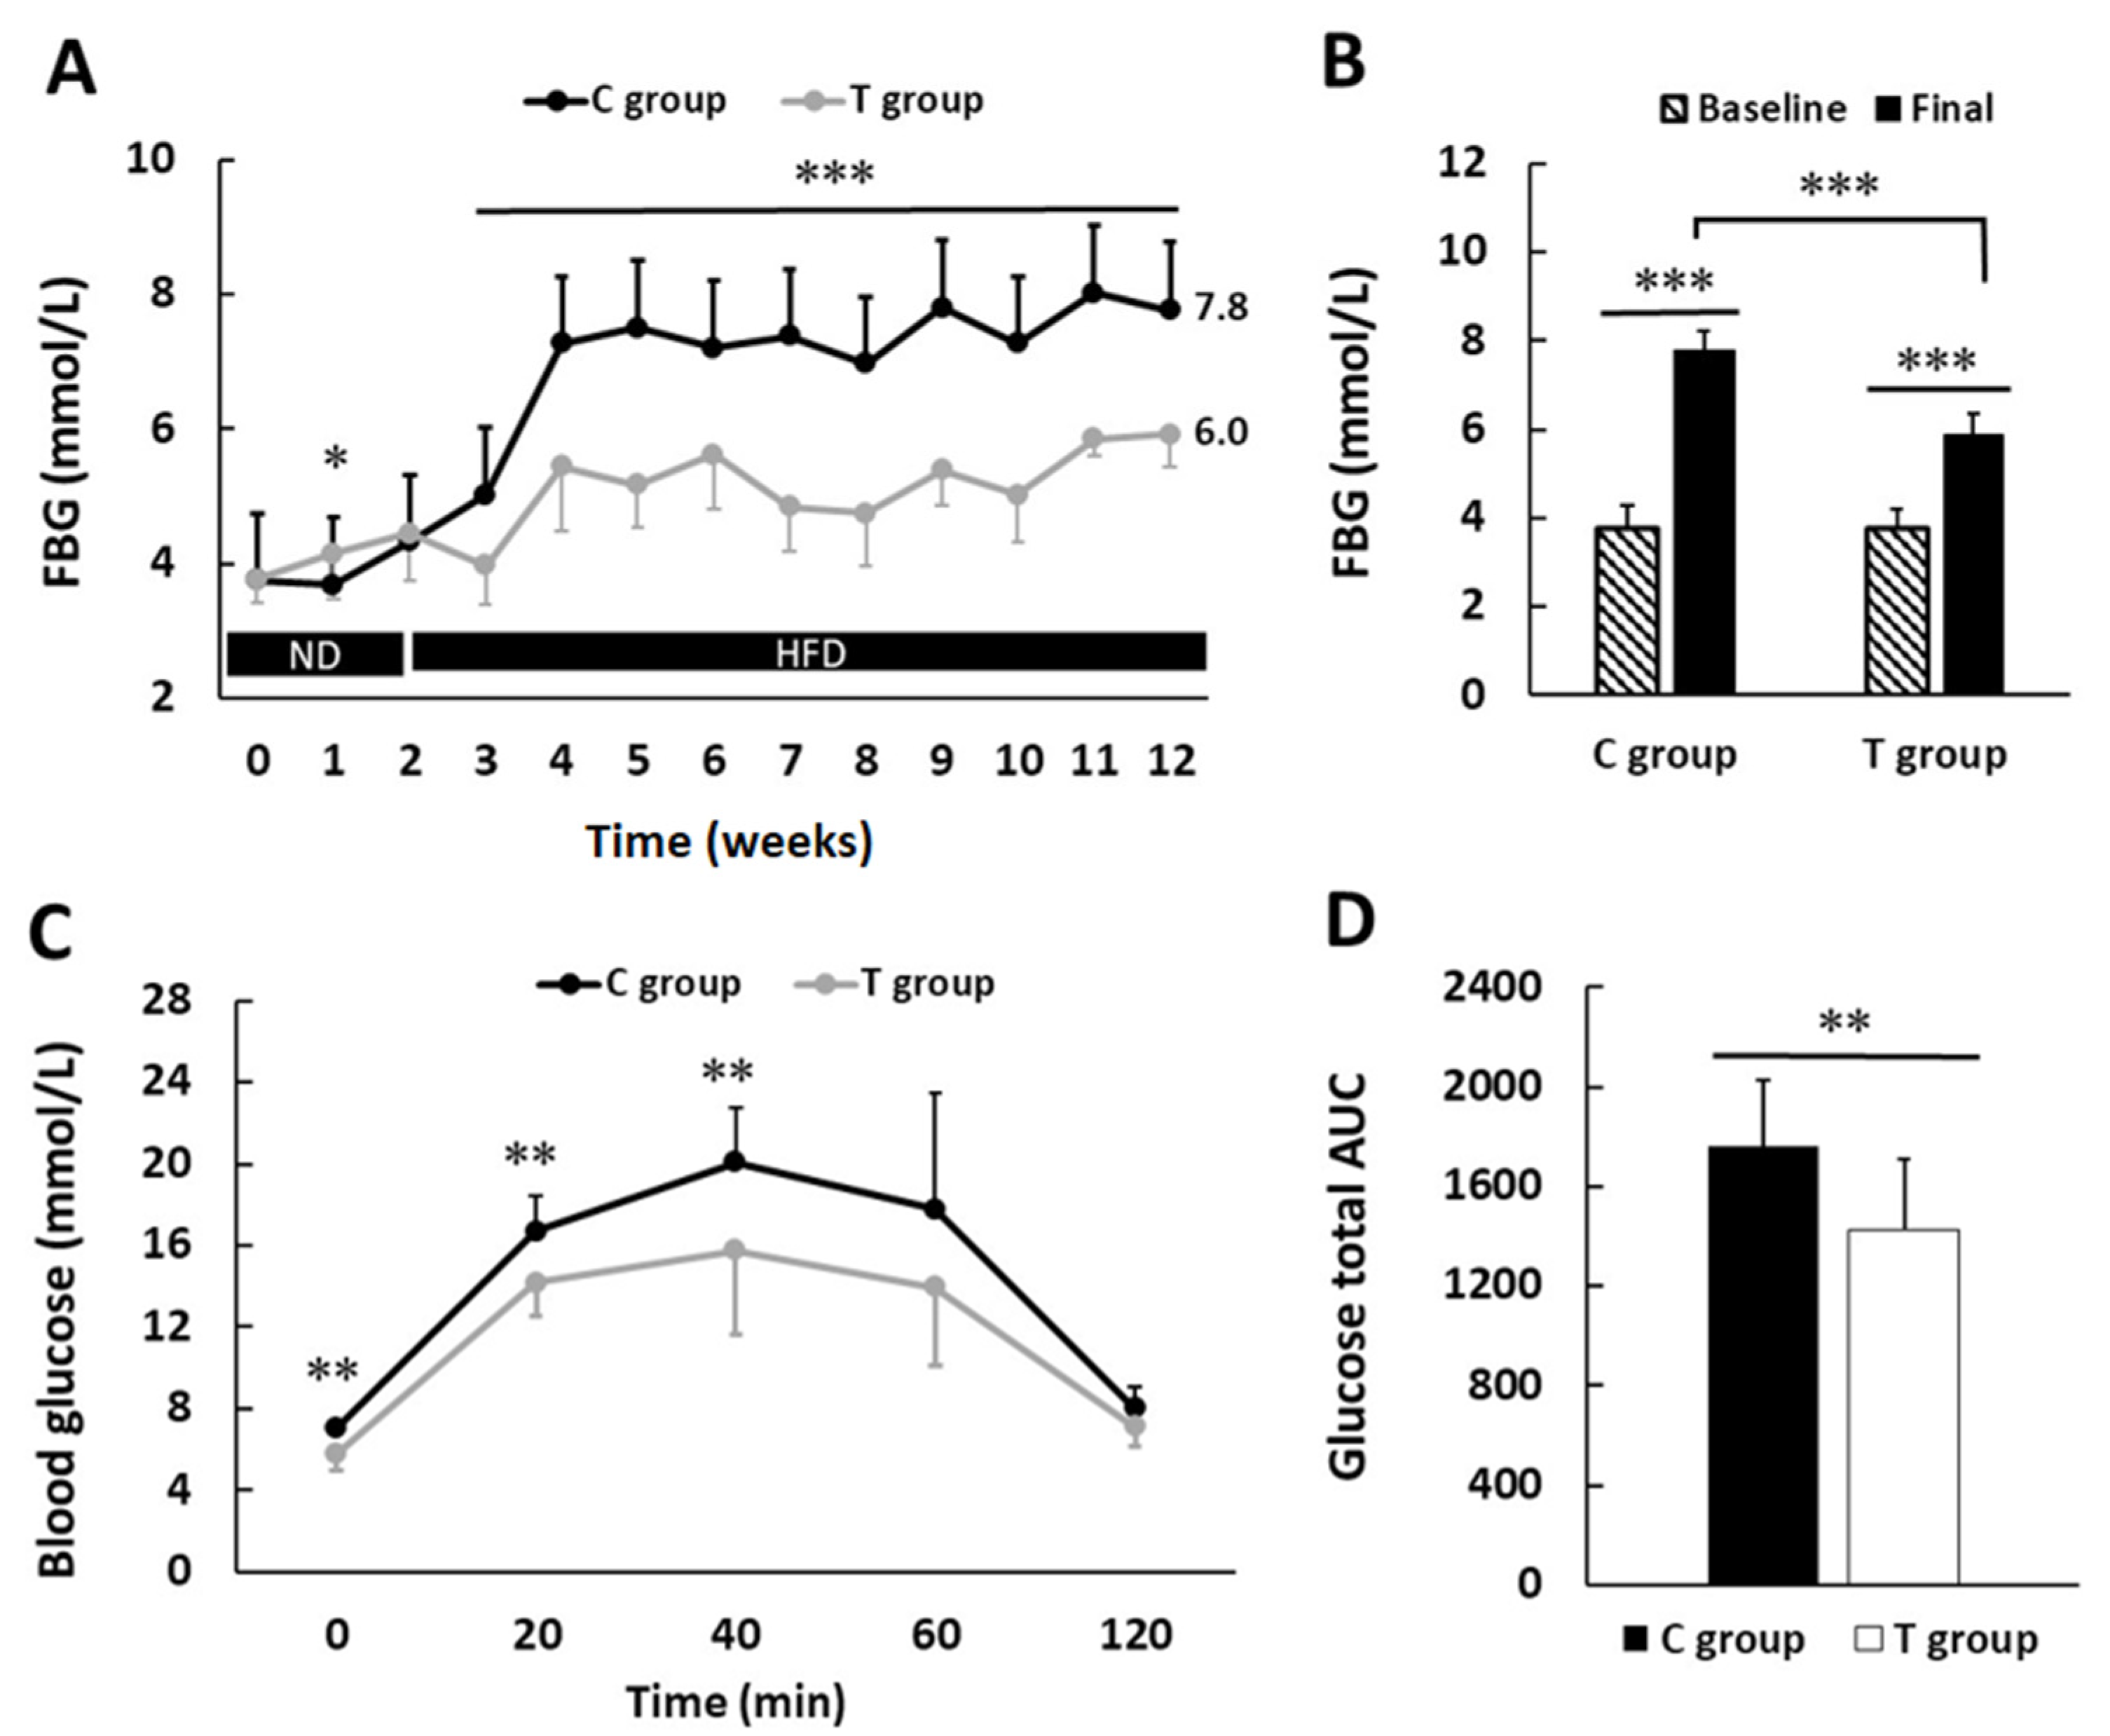
3.2. pA1c Improves Fasting Blood Glucose Levels and Glucose Tolerance Test
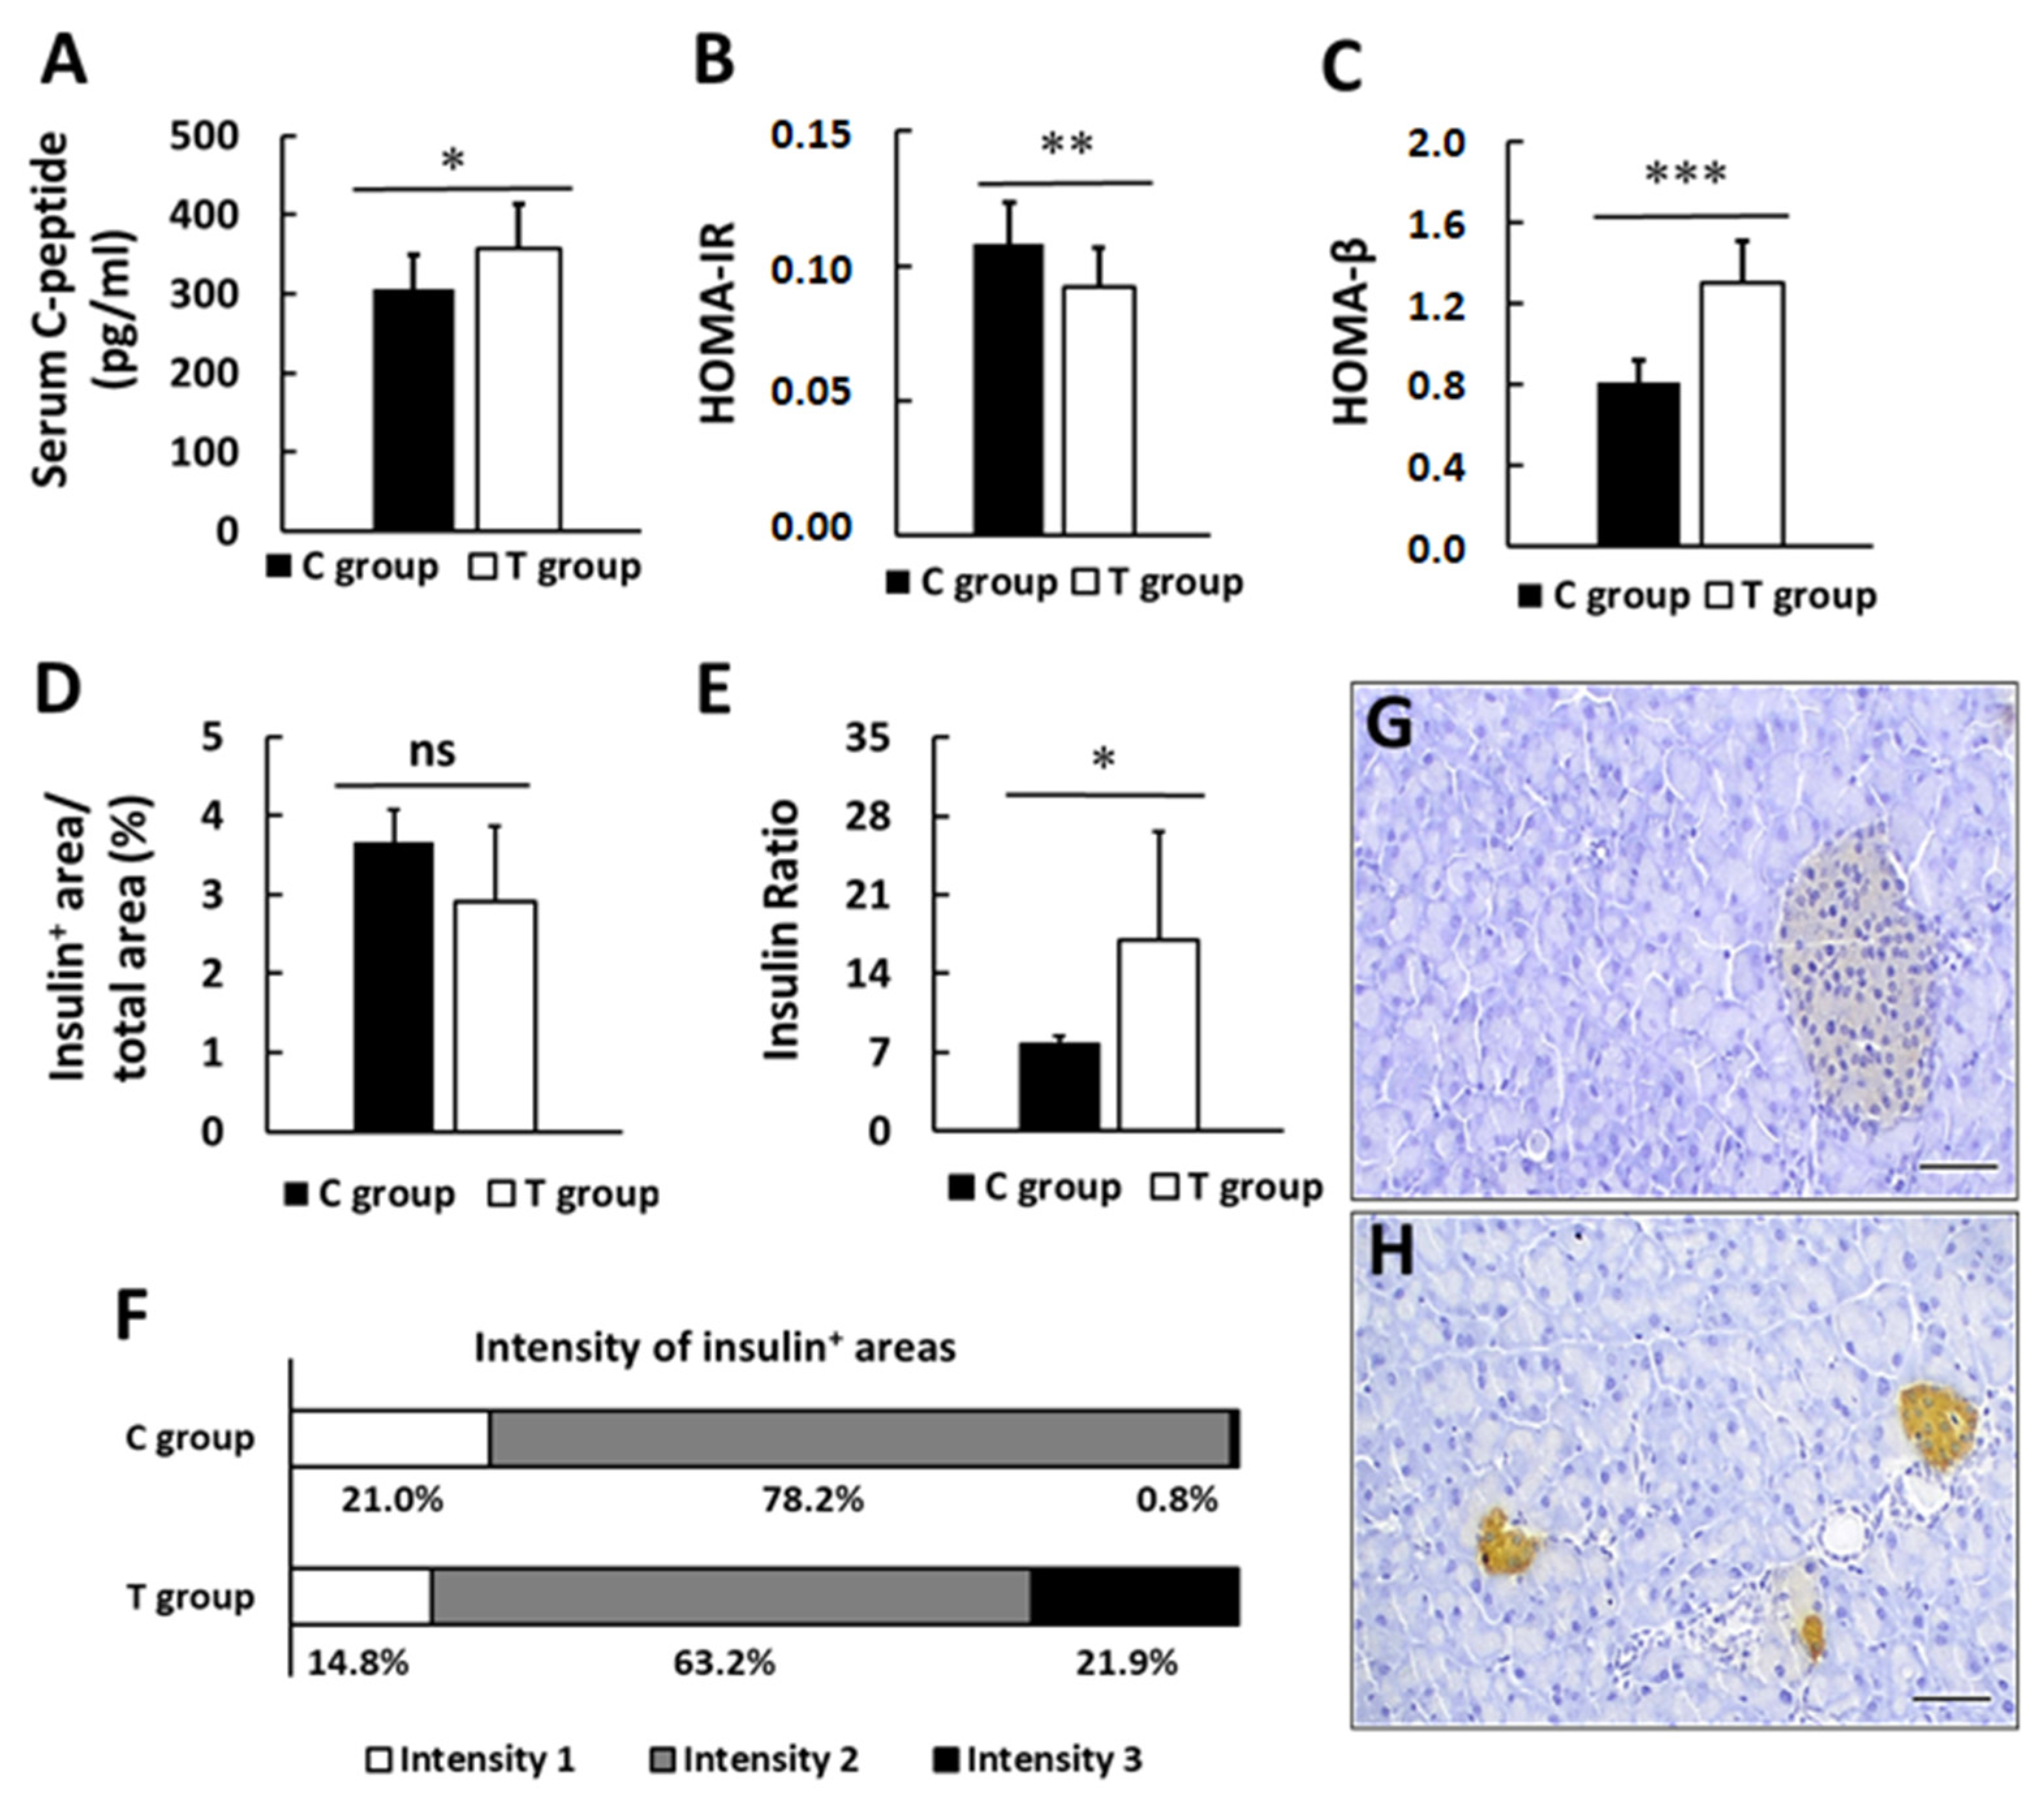
3.3. pA1c Promotes Insulin Secretion and Preserves β-pancreatic Islets Function
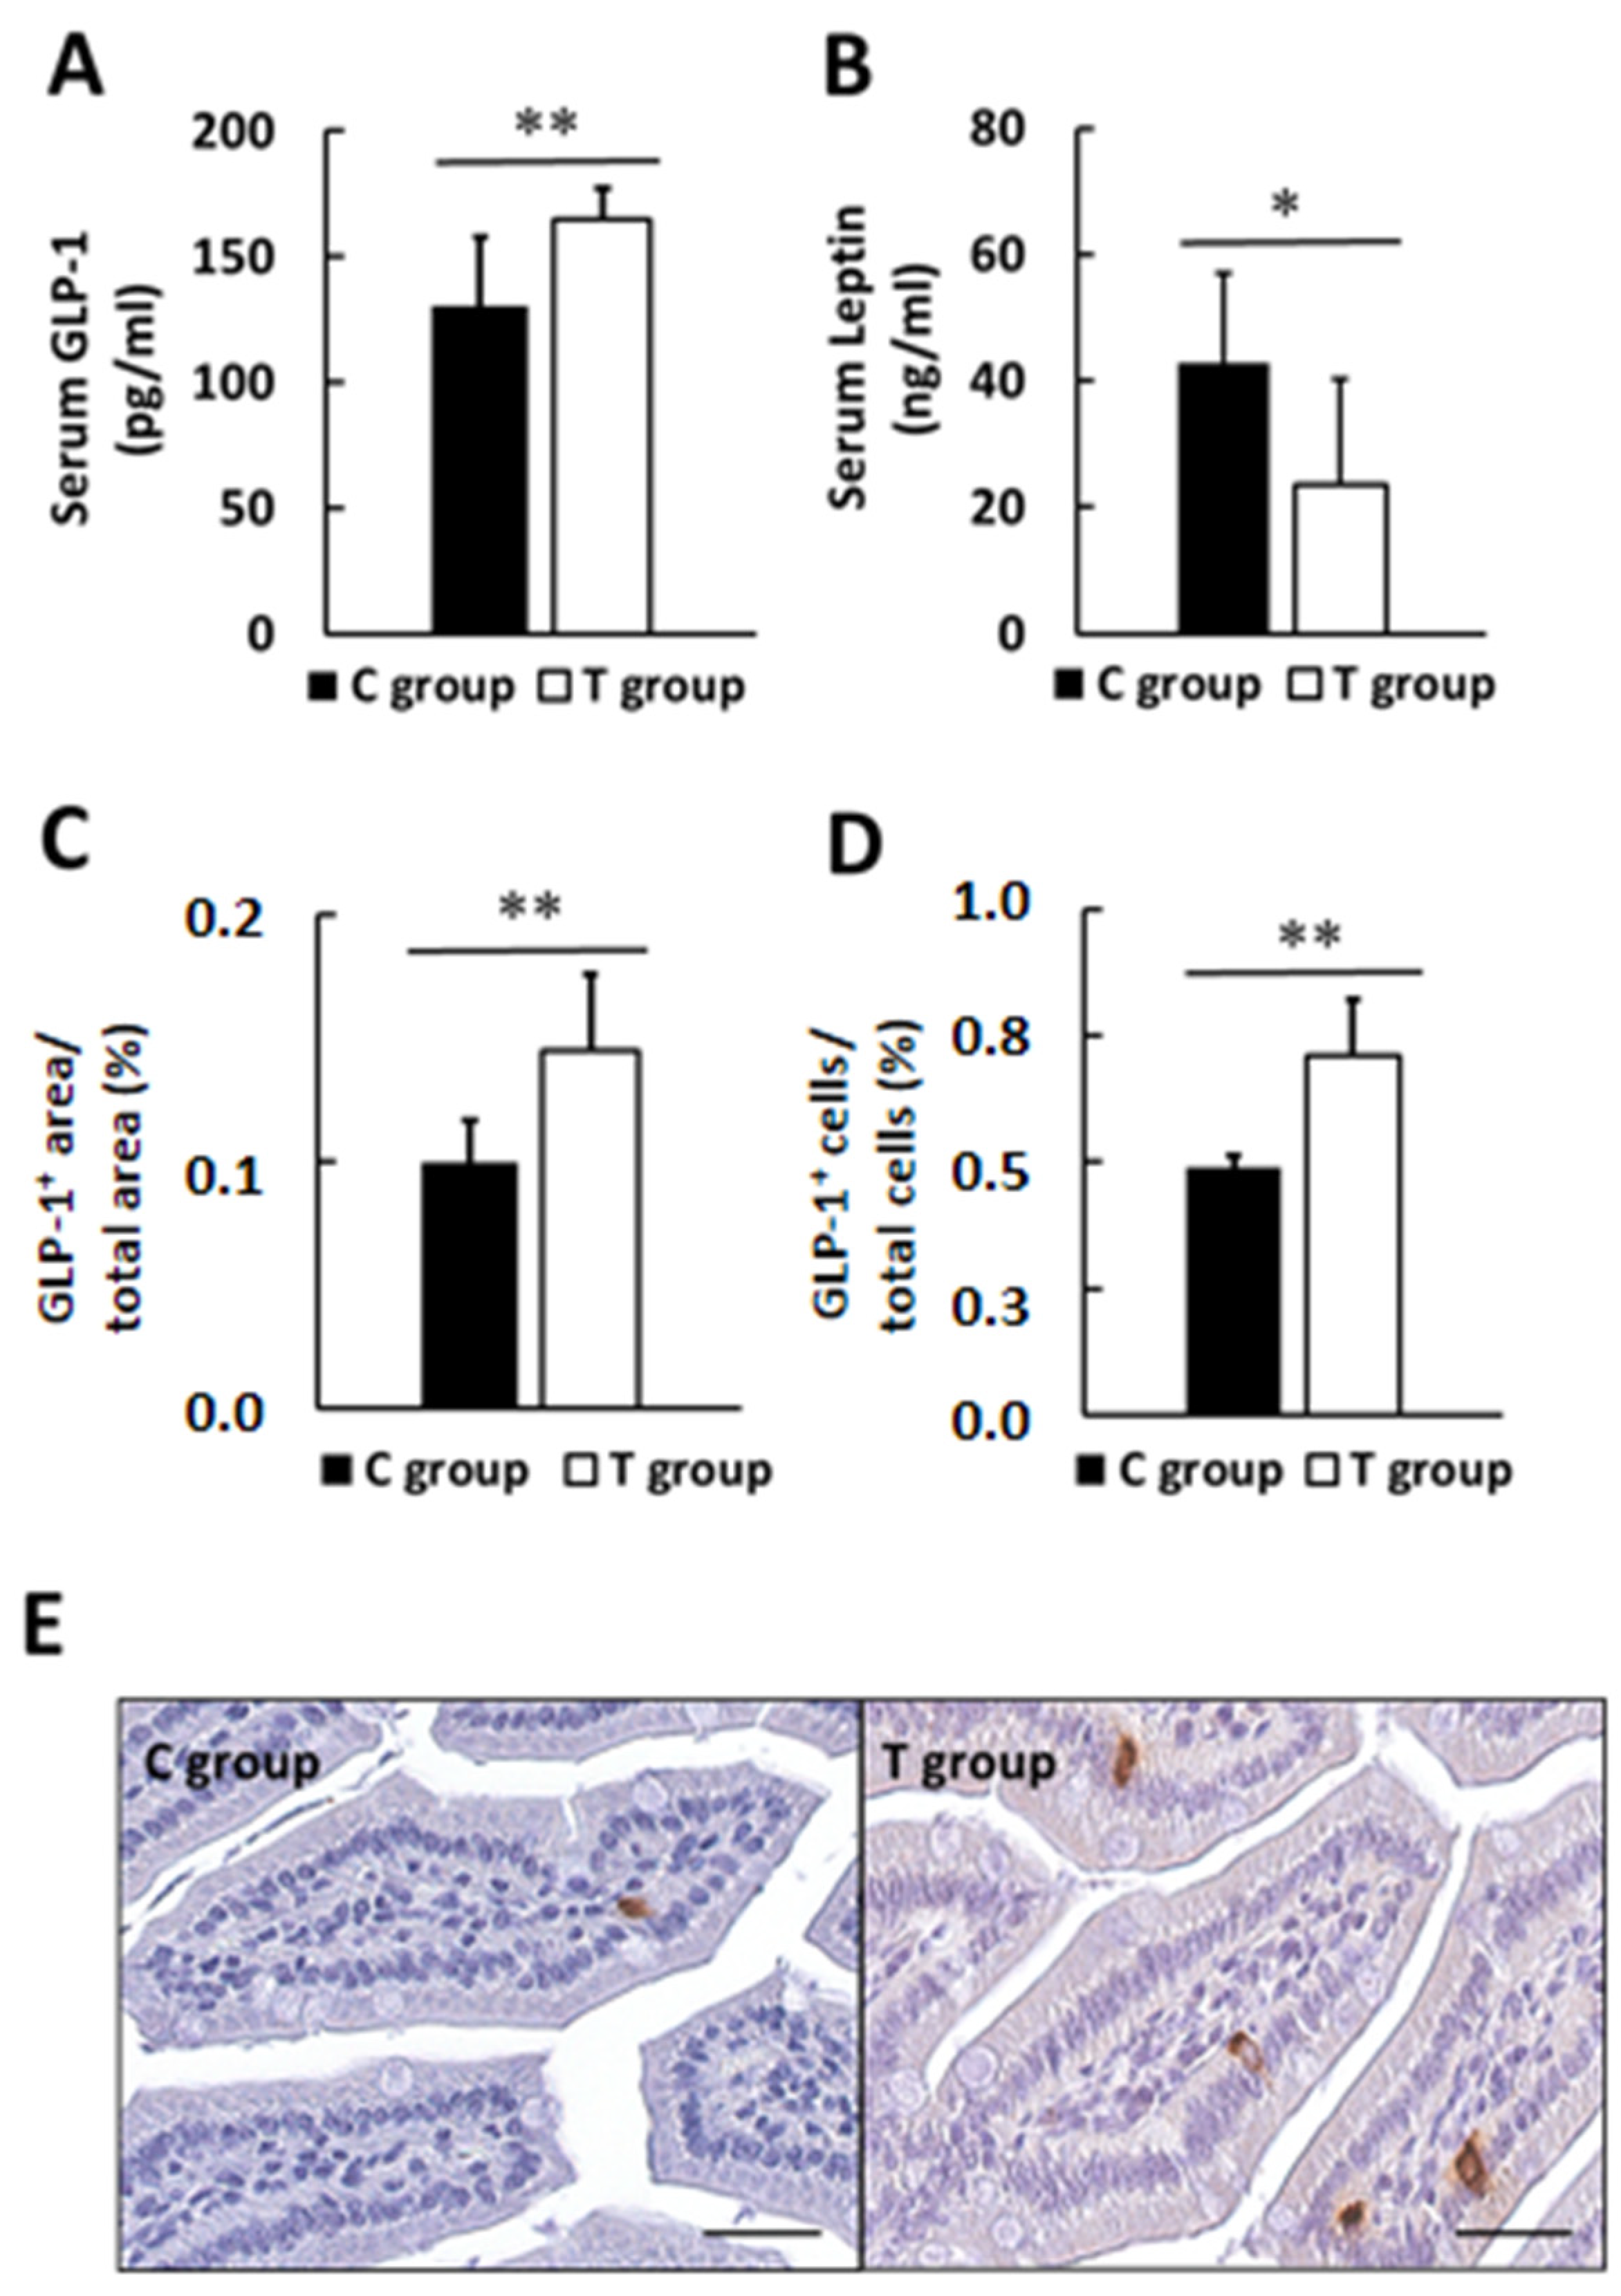
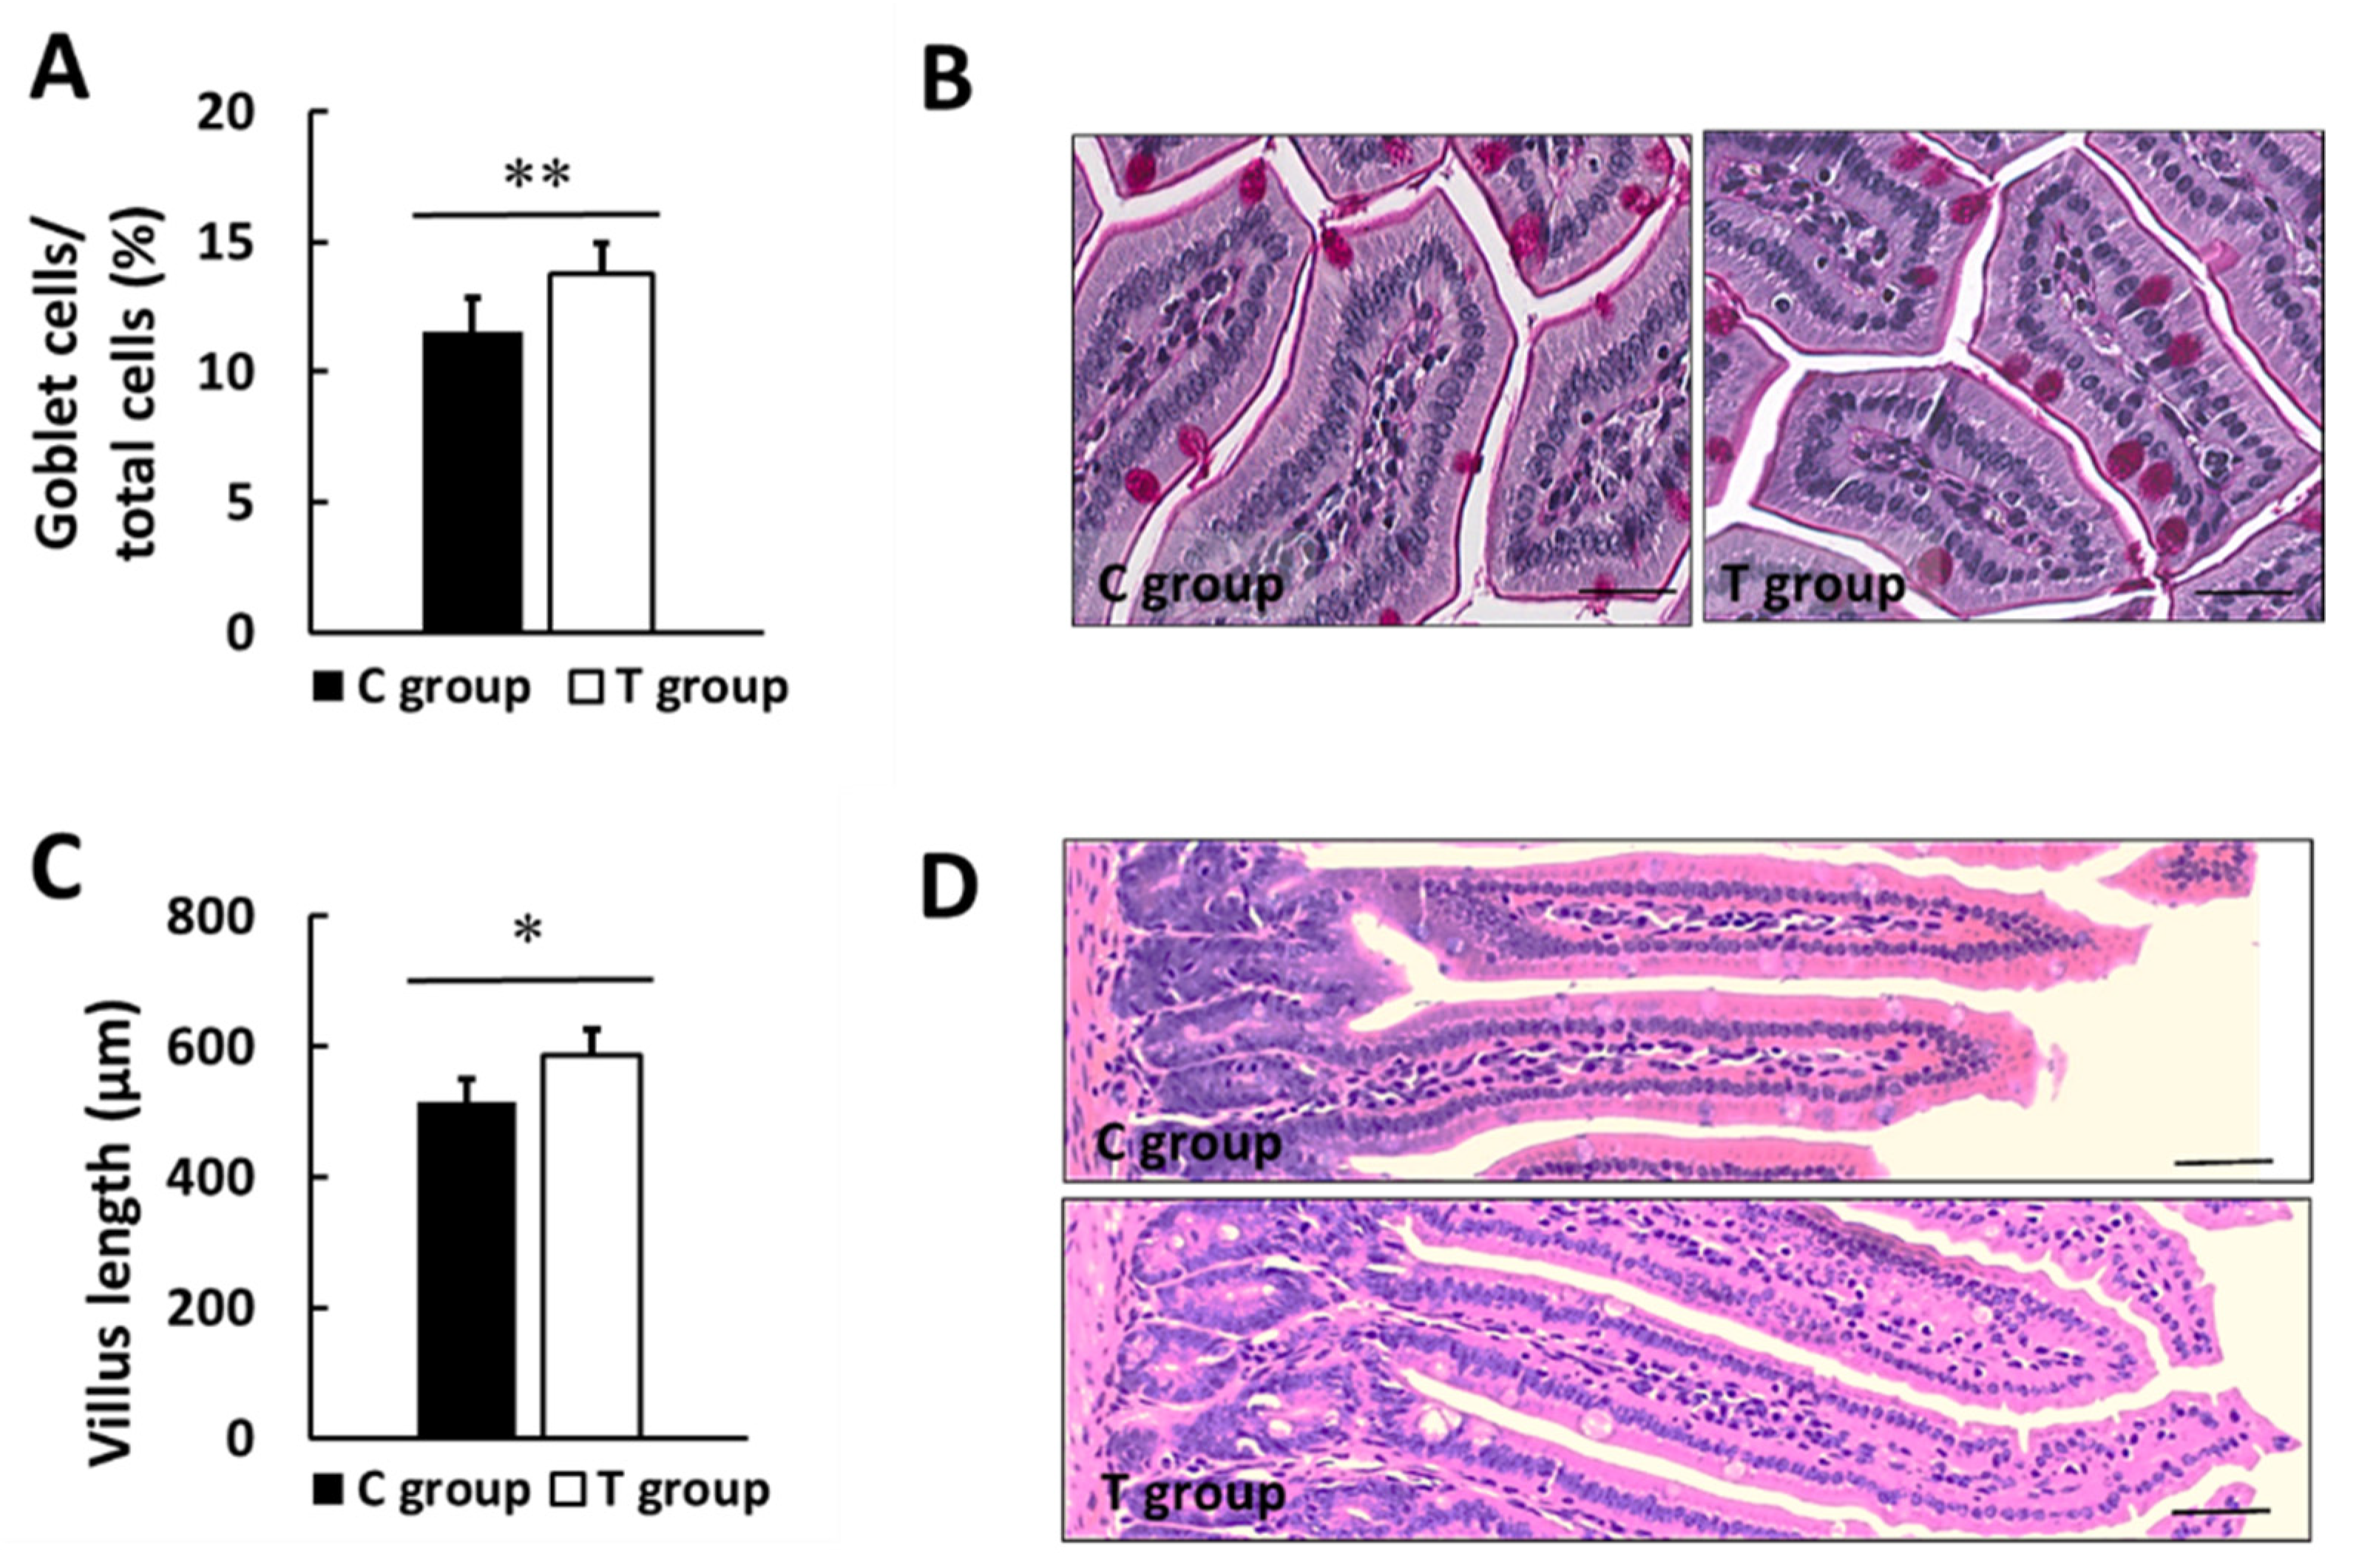
3.4. Effects of pA1c on GLP-1, Leptin, Biochemical Markers in Serum and Intestinal Histology
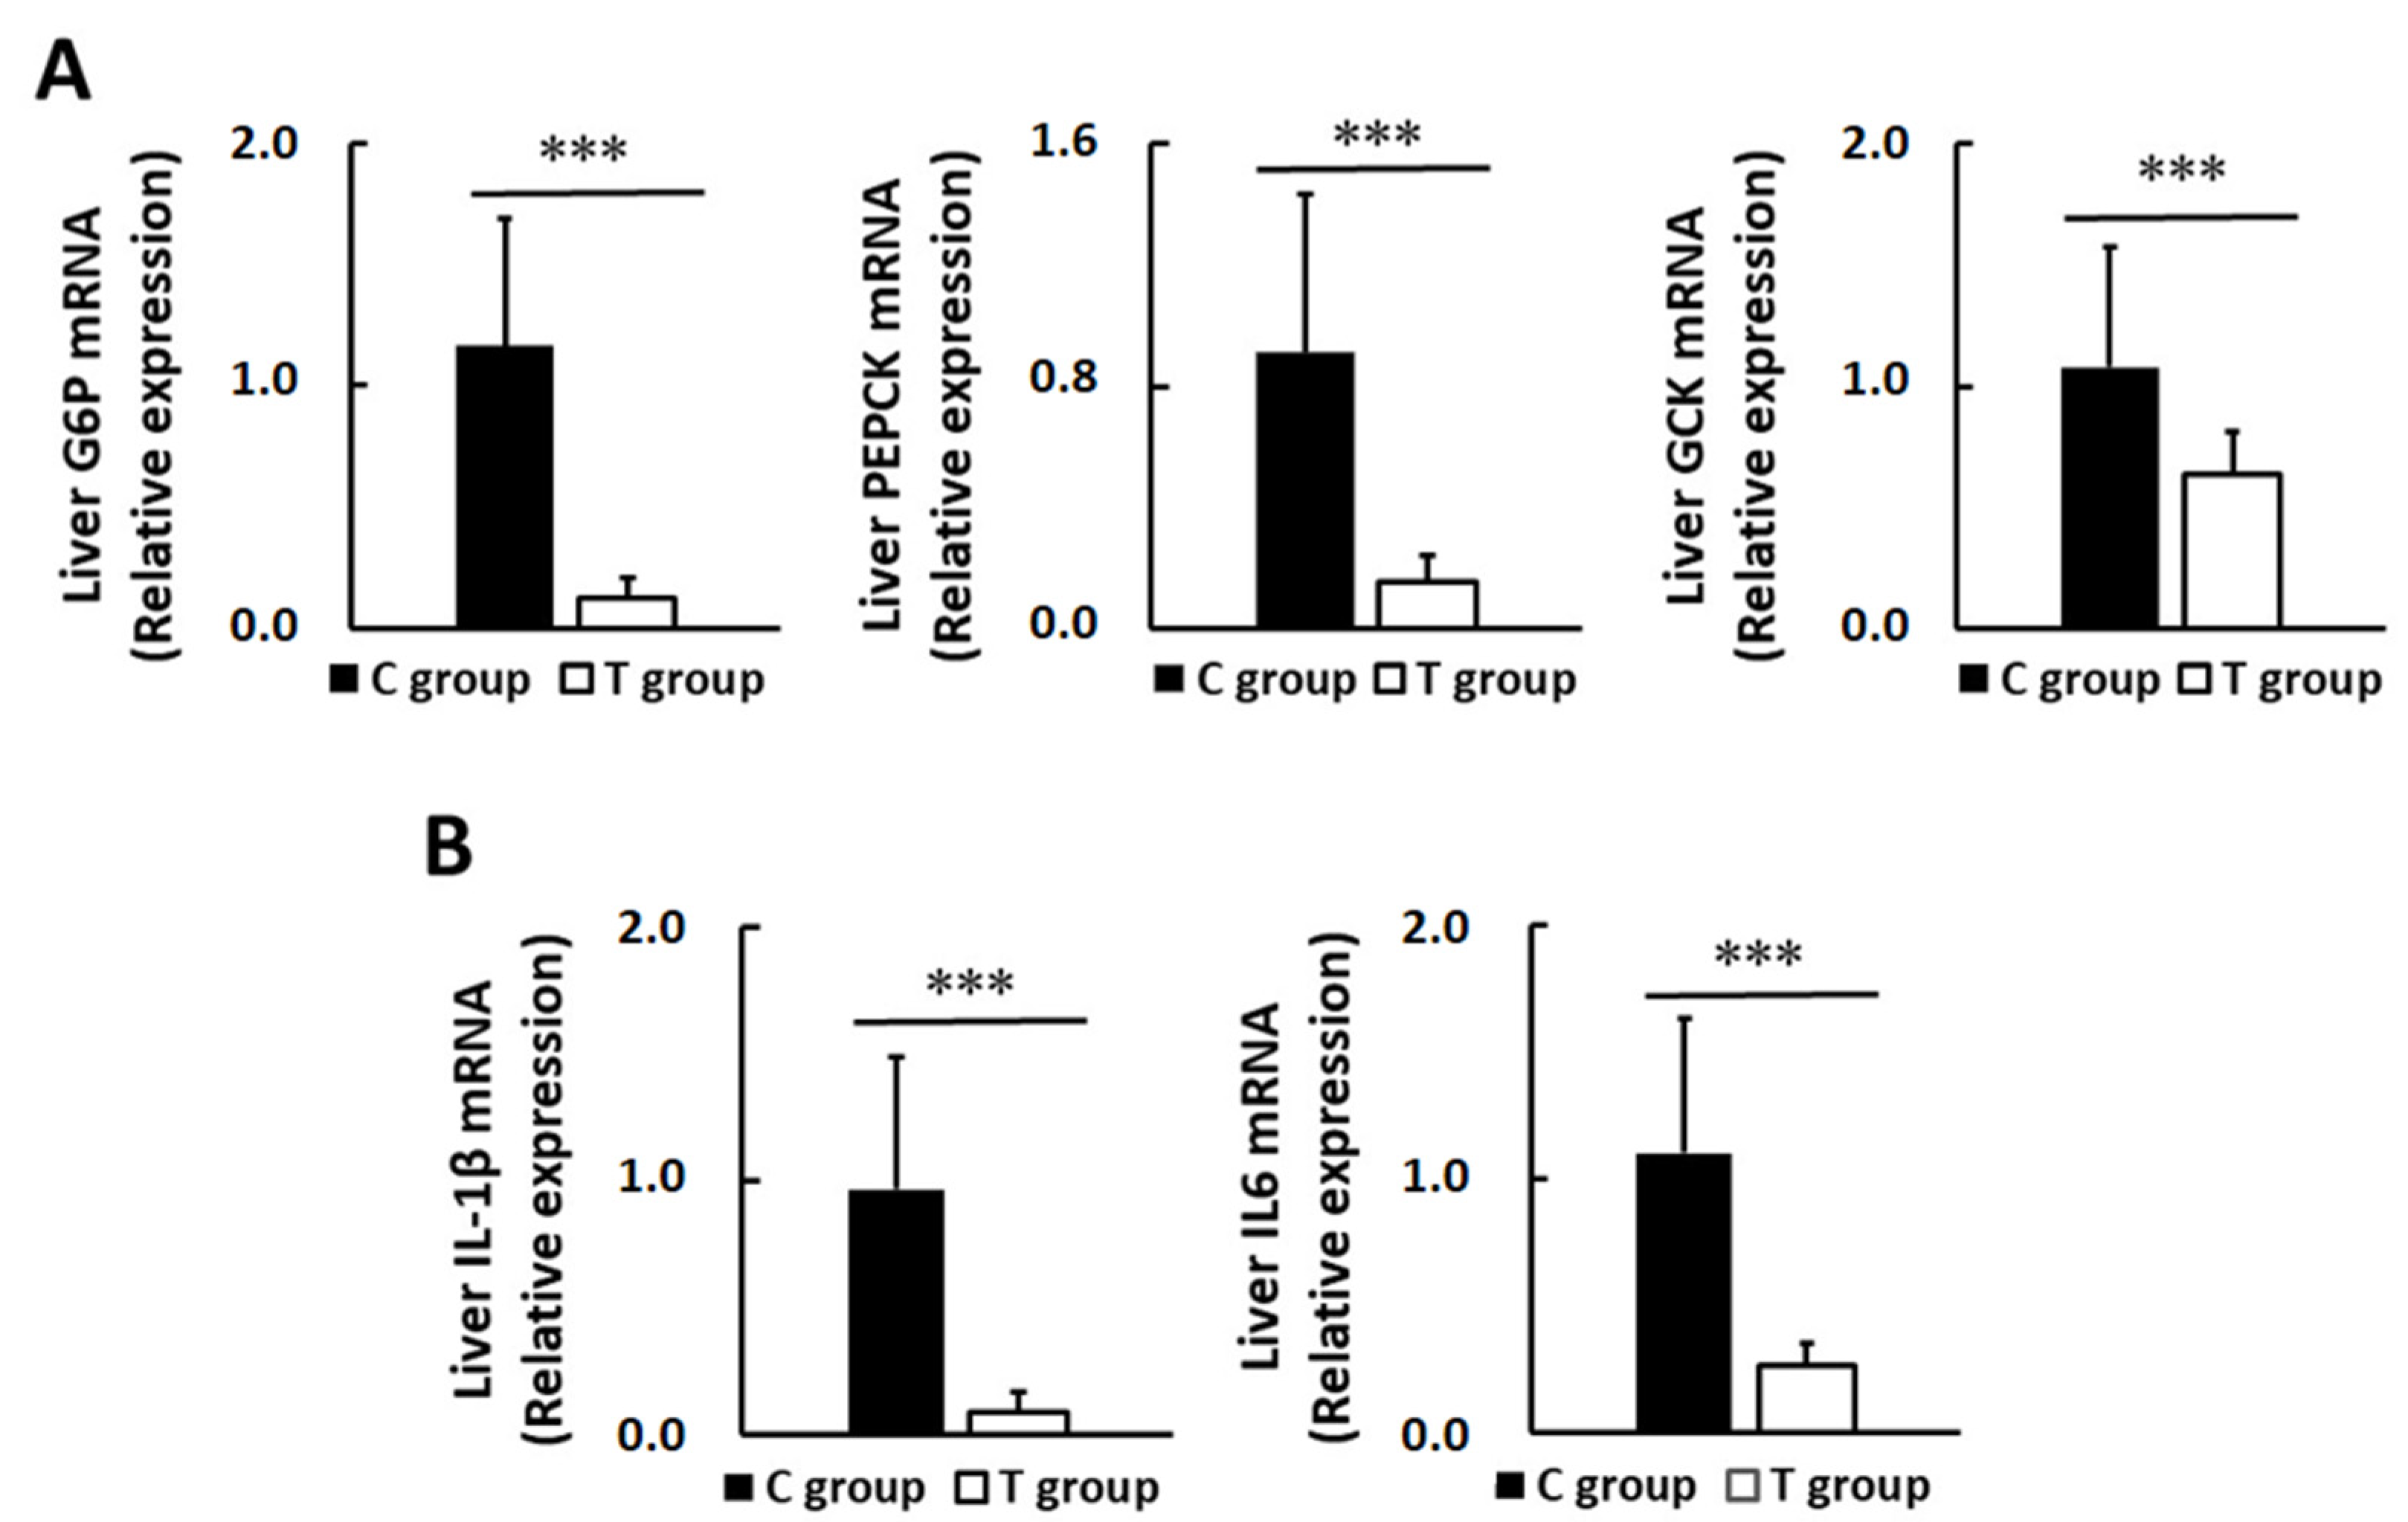
3.5. Effects of pA1c on Hepatic Glucose-Regulating Enzymes and Inflammatory Markers
3.6. The Association between Variation of Glucose Control and Other Biochemical and Histological Parameters
4. Discussion
5. Conclusions
6. Patents
Supplementary Materials
Author Contributions
Funding
Institutional Review Board Statement
Informed Consent Statement
Data Availability Statement
Acknowledgments
Conflicts of Interest
References
- Rett, K.; Gottwald-Hostalek, U. Understanding prediabetes: Definition, prevalence, burden and treatment options for an emerging disease. Curr. Med. Res. Opin. 2019, 35, 1529–1534. [Google Scholar] [CrossRef] [PubMed]
- Brannick, B.; Dagogo-Jack, S. Prediabetes and Cardiovascular Disease: Pathophysiology and Interventions for Prevention and Risk Reduction. Endocrinol. Metab. Clin. N. Am. 2018, 47, 33–50. [Google Scholar] [CrossRef] [PubMed]
- ADA. Classification and Diagnosis of Diabetes: Standards of Medical Care in Diabetes-2020. Diabetes Care 2020, 43, S14–S31. [Google Scholar] [CrossRef] [PubMed]
- Carris, N.W.; Magness, R.R.; Labovitz, A.J. Prevention of Diabetes Mellitus in Patients with Prediabetes. Am. J. Cardiol. 2019, 123, 507–512. [Google Scholar] [CrossRef]
- Zheng, Y.; Ley, S.H.; Hu, F.B. Global aetiology and epidemiology of type 2 diabetes mellitus and its complications. Nat. Rev. Endocrinol. 2018, 14, 88–98. [Google Scholar] [CrossRef]
- Wang, X.; Yang, J.; Qiu, X.; Wen, Q.; Liu, M.; Zhou, D.; Chen, Q. Probiotics, Pre-biotics and Synbiotics in the Treatment of Pre-diabetes: A Systematic Review of Randomized Controlled Trials. Front. Public Health 2021, 26, 645035. [Google Scholar] [CrossRef]
- Jayashree, B.; Bibin, Y.S.; Prabhu, D.; Shanthirani, C.S.; Gokulakrishnan, K.; Lakshmi, B.S.; Mohan, V.; Balasubramanyam, M. Increased circulatory levels of lipopolysaccharide (LPS) and zonulin signify novel biomarkers of proinflammation in patients with type 2 diabetes. Mol. Cell Biochem. 2014, 388, 203–210. [Google Scholar] [CrossRef]
- Cani, P.D.; Amar, J.; Iglesias, M.A.; Poggi, M.; Knauf, C.; Bastelica, D.; Neyrinck, A.M.; Fava, F.; Tuohy, K.M.; Chabo, C.; et al. Metabolic Endotoxemia Initiates Obesity and Insulin Resistance. Diabetes 2007, 56, 1761–1772. [Google Scholar] [CrossRef]
- Gurung, M.; Li, Z.; You, H.; Rodrigues, R.; Jump, D.B.; Morgun, A.; Shulzhenko, N. Role of gut microbiota in type 2 diabetes pathophysiology. EBioMedicine 2020, 51, 102590. [Google Scholar] [CrossRef]
- Delzenne, N.M.; Cani, P.D.; Everard, A.; Neyrinck, A.M.; Bindels, L.B. Gut microorganisms as promising targets for the management of type 2 diabetes. Diabetologia 2015, 58, 2206–2217. [Google Scholar] [CrossRef]
- Khan, M.T.; Nieuwdorp, M.; Bäckhed, F. Microbial modulation of insulin sensitivity. Cell Metab. 2014, 20, 753–760. [Google Scholar] [CrossRef] [PubMed]
- Wang, L.; Yu, X.; Xu, X.; Ming, J.; Wang, Z.; Gao, B.; Xing, Y.; Zhou, J.; Fu, J.; Liu, T.; et al. The Fecal Microbiota Is Already Altered in Normoglycemic Individuals Who Go on to Have Type 2 Diabetes. Front. Cell Infect. Microbiol. 2021, 11, 1. [Google Scholar] [CrossRef] [PubMed]
- Zhang, Z.; Tian, T.; Chen, Z.; Liu, L.; Luo, T.; Dai, J. Characteristics of the gut microbiome in patients with prediabetes and type 2 diabetes. PeerJ 2021, 24, e10952. [Google Scholar] [CrossRef]
- Vallianou, N.G.; Stratigou, T.; Tsagarakis, S. Metformin and gut microbiota: Their interactions and their impact on diabetes. Hormones 2019, 18, 141–144. [Google Scholar] [CrossRef] [PubMed]
- Brunkwall, L.; Orho-Melander, M. The gut microbiome as a target for prevention and treatment of hyperglycaemia in type 2 diabetes: From current human evidence to future possibilities. Diabetologia 2017, 60, 943–951. [Google Scholar] [CrossRef] [PubMed]
- Chávez-Carbajal, A.; Pizano-Zárate, M.L.; Hernández-Quiroz, F.; Ortiz-Luna, G.F.; Morales-Hernández, R.M.; De Sales-Millán, A.; Hernández-Trejo, M.; García-Vite, A.; Beltrán-Lagunes, L.; Hoyo-Vadillo, C.; et al. Characterization of the gut microbiota of individuals at different T2D stages reveals a complex relationship with the host. Microorganisms 2020, 8, 94. [Google Scholar] [CrossRef]
- David, L.A.; Maurice, C.F.; Carmody, R.N.; Gootenberg, D.B.; Button, J.E.; Wolfe, B.E.; Ling, A.V.; Sloan Devlin, A.; Varma, Y.; Fischbach, M.A.; et al. Diet rapidly and reproducibly alters the human gut microbiome. Nature 2014, 505, 559–563. [Google Scholar] [CrossRef]
- Cabello-Olmo, M.; Oneca, M.; Torre, P.; Sainz, N.; Moreno-aliaga, M.J.; Guruceaga, E.; Díaz, J.V.; Encio, I.J.; Barajas, M.; Araña, M. A fermented food product containing lactic acid bacteria protects ZDF rats from the development of type 2 diabetes. Nutrients 2019, 11, 2530. [Google Scholar] [CrossRef]
- Sivamaruthi, B.S.; Kesika, P.; Prasanth, M.I.; Chaiyasut, C. A Mini Review on Antidiabetic Properties of Fermented Foods. Nutrients 2018, 10, 1973. [Google Scholar] [CrossRef]
- Sikand, G.; Kris-Etherton, P.; Boulos, N.M. Impact of Functional Foods on Prevention of Cardiovascular Disease and Diabetes. Curr. Cardiol. Rep. 2015, 17, 39. [Google Scholar] [CrossRef]
- Cabello-Olmo, M.; Araña, M.; Urtasun, R.; Encio, I.J.; Barajas, M. Role of postbiotics in diabetes mellitus: Current knowledge and future perspectives. Foods 2021, 10, 1590. [Google Scholar] [CrossRef] [PubMed]
- Sun, J.; Buys, N.J. Glucose- and glycaemic factor-lowering effects of probiotics on diabetes: A meta-analysis of randomised placebo-controlled trials. Br. J. Nutr. 2016, 115, 1167–1177. [Google Scholar] [CrossRef] [PubMed]
- Wang, X.; Juan, Q.-F.F.; He, Y.-W.W.; Zhuang, L.; Fang, Y.-Y.Y.; Wang, Y.-H.H. Multiple effects of probiotics on different types of diabetes: A systematic review & meta-analysis of randomized, placebo-controlled trials. J. Pediatr. Endocrinol. Metab. 2017, 30, 611–622. [Google Scholar] [CrossRef] [PubMed]
- Hill, C.; Guarner, F.; Reid, G.; Gibson, G.R.; Merenstein, D.J.; Pot, B.; Morelli, L.; Canani, R.B.; Flint, H.J.; Salminen, S.; et al. The International Scientific Association for Probiotics and Prebiotics consensus statement on the scope and appropriate use of the term probiotic. Nat. Rev. Gastroenterol. Hepatol. 2014, 11, 506–514. [Google Scholar] [CrossRef] [PubMed]
- Rondanelli, M.; Faliva, M.A.; Perna, S.; Giacosa, A.; Peroni, G.; Castellazzi, A.M. Using probiotics in clinical practice: Where are we now? A review of existing meta-analyses. Gut. Microbes 2017, 8, 521–543. [Google Scholar] [CrossRef] [PubMed]
- Bermudez-Brito, M.; Plaza-Díaz, J.; Muñoz-Quezada, S.; Gómez-Llorente, C.; Gil, A. Probiotic mechanisms of action. Ann. Nutr. Metab. 2012, 61, 160–174. [Google Scholar] [CrossRef]
- Sanders, M.E.; Merenstein, D.; Merrifield, C.A.; Hutkins, R. Probiotics for human use. Nutr. Bull. 2018, 43, 212–225. [Google Scholar] [CrossRef]
- Vandenplas, Y.; Huys, G.; Daube, G.; Vandenplasa, Y.; Huys, G.; Daube, G. Probiotics: An update. J. Pediatr. 2015, 91, 6–21. [Google Scholar] [CrossRef]
- Jafarabadi, M.A.; Dehghani, A.; Khalili, L.; Barzegar, A.; Mesrizad, M.; Hassanalilou, T. A Meta-analysis of Randomized Controlled Trials of the Effect of Probiotic Food or Supplement on Glycemic Response and Body Mass Index in Patients with Type 2 Diabetes, Updating the Evidence. Curr. Diabetes Rev. 2020, 17, 356–364. [Google Scholar] [CrossRef]
- Hampe, C.S.; Roth, C.L. Probiotic strains and mechanistic insights for the treatment of type 2 diabetes. Endocrine 2017, 58, 207–227. [Google Scholar] [CrossRef]
- Salles, B.I.M.; Cioffi, D.; Ferreira, S.R.G. Probiotics supplementation and insulin resistance: A systematic review. Diabetol. Metab. Syndr. 2020, 12, 98. [Google Scholar] [CrossRef] [PubMed]
- Akbari, V.; Hendijani, F. Effects of probiotic supplementation in patients with type 2 diabetes: Systematic review and meta-analysis. Nutr. Rev. 2016, 74, 774–784. [Google Scholar] [CrossRef] [PubMed]
- Rittiphairoj, T.; Pongpirul, K.; Janchot, K.; Mueller, N.T.; Li, T. Probiotics Contribute to Glycemic Control in Patients with Type 2 Diabetes Mellitus: A Systematic Review and Meta-Analysis. Adv. Nutr. 2021, 12, 722–734. [Google Scholar] [CrossRef] [PubMed]
- Kumar, R.; Bansal, P.; Singh, J.; Dhanda, S.; Bhardwaj, J.K. Aggregation, adhesion and efficacy studies of probiotic candidate Pediococcus acidilactici NCDC 252: A strain of dairy origin. World J. Microbiol. Biotechnol. 2020, 36, 10. [Google Scholar] [CrossRef]
- Vasiee, A.; Falah, F.; Behbahani, B.A.; Tabatabaee-yazdi, F. Probiotic characterization of Pediococcus strains isolated from Iranian cereal-dairy fermented product: Interaction with pathogenic bacteria and the enteric cell line Caco-2. J. Biosci. Bioeng. 2020, 130, 471–479. [Google Scholar] [CrossRef] [PubMed]
- Todorov, S.D.; Furtado, D.N.; Saad, S.M.I.; Tome, E.; Franco, B.D.G.M. Potential beneficial properties of bacteriocin-producing lactic acid bacteria isolated from smoked salmon. J. Appl. Microbiol. 2011, 110, 971–986. [Google Scholar] [CrossRef]
- Kheadr, E.; Zihler, A.; Dabour, N.; Lacroix, C.; Le Blay, G.; Fliss, I. Study of the physicochemical and biological stability of pediocin PA-1 in the upper gastrointestinal tract conditions using a dynamic in vitro model. J. Appl. Microbiol. 2010, 109, 54–64. [Google Scholar] [CrossRef]
- Balgir, P.P.; Kaur, B.; Kaur, T.; Daroch, N.; Kaur, G. n Vitro and In Vivo Survival and Colonic Adhesion of Pediococcus acidilactici MTCC5101 in Human Gut. Biomed. Res. Int. 2013, 2013, 583850. [Google Scholar] [CrossRef]
- Noohi, N.; Ebrahimipour, G.; Rohani, M.; Talebi, M.; Pourshafie, M.R. Evaluation of potential probiotic characteristics and antibacterial effects of strains of Pediococcus species isolated from broiler chickens. Br. Poult. Sci. 2016, 57, 317–323. [Google Scholar] [CrossRef]
- Fernandez, B.; Le Lay, C.; Jean, J.; Fliss, I. Growth, acid production and bacteriocin production by probiotic candidates under simulated colonic conditions. J. Appl. Microbiol. 2013, 114, 877–885. [Google Scholar] [CrossRef]
- Qiao, Y.; Qiu, Z.; Tian, F.; Yu, L.; Zhao, J.; Zhang, H.; Zhai, Q.; Chen, W. Pediococcus acidilactici Strains Improve Constipation Symptoms and Regulate Intestinal Flora in Mice. Front. Cell Infect. Microbiol. 2021, 11, 655258. [Google Scholar] [CrossRef]
- Choi, M.K.; Choi, S.S. In vitro and in vivo anti-clostridial activity of newly isolated Pediococcus acidilactici SPM138 against Clostridium difficile. Anaerobe 2020, 61, 102146. [Google Scholar] [CrossRef]
- Lorén, V.; Manyé, J.; Fuentes, M.C.; Cabré, E.; Ojanguren, I.; Espadaler, J. Comparative Effect of the I3.1 Probiotic Formula in Two Animal Models of Colitis. Probiotics Antimicrob. Proteins 2017, 9, 71–80. [Google Scholar] [CrossRef] [PubMed]
- Jeong, D.Y.; Ryu, M.S.; Yang, H.J.; Jeong, S.Y.; Zhang, T.; Yang, H.J.; Kim, M.J.; Park, S. Pediococcus acidilactici intake decreases the clinical severity of atopic dermatitis along with increasing mucin production and improving the gut microbiome in Nc/Nga mice. Biomed. Pharm. 2020, 129, 110488. [Google Scholar] [CrossRef] [PubMed]
- Ricci, A.; Allende, A.; Bolton, D.; Chemaly, M.; Davies, R.; Girones, R.; Koutsoumanis, K.; Lindqvist, R.; Nørrung, B.; Robertson, L.; et al. Update of the list of QPS-recommended biological agents intentionally added to food or feed as notified to EFSA 6: Suitability of taxonomic units notified to EFSA until March 2017. EFSA J. 2017, 15, 1–43. [Google Scholar] [CrossRef]
- Urtasun, R.; Díaz-Gómez, J.; Araña, M.; Pajares, M.J.; Oneca, M.; Torre, P.; Jiménez, M.; Munilla, G.; Barajas, M.; Encío, I. A Combination of Apple Vinegar Drink with Bacillus coagulans Ameliorates High Fat Diet-Induced Body Weight Gain, Insulin Resistance and Hepatic Steatosis. Nutrients 2020, 12, 2504. [Google Scholar] [CrossRef]
- Sallar, A.; Dagogo-Jack, S. Regression from prediabetes to normal glucose regulation: State of the science. Exp. Biol. Med. 2020, 245, 889–896. [Google Scholar] [CrossRef]
- Fujiwara, M.; Kuwahara, D.; Hayashi, M.; Zendo, T.; Sato, M.; Nakayama, J.; Nakayama, J.; Sonomoto, K. Lowering effect of viable Pediococcus pentosaceus QU 19 on the rise in postprandial glucose. Biosci. Microbiota Food Health 2020, 39, 57–64. [Google Scholar] [CrossRef]
- Balakumar, M.; Prabhu, D.; Sathishkumar, C.; Prabu, P.; Rokana, N.; Kumar, R.; Raghavan, S.; Soundarajan, A.; Grover, S.; Batish, V.K.; et al. Improvement in glucose tolerance and insulin sensitivity by probiotic strains of Indian gut origin in high-fat diet-fed C57BL/6J mice. Eur. J. Nutr. 2018, 57, 279–295. [Google Scholar] [CrossRef]
- Tian, P.; Li, B.; He, C.; Song, W.; Hou, A.; Tian, S.; Meng, X.; Lia, K.; Shan, Y. Antidiabetic (type 2) effects of Lactobacillus G15 and Q14 in rats through regulation of intestinal permeability and microbiota. Food Funct. 2016, 7, 3789–3797. [Google Scholar] [CrossRef]
- Ueda, T.; Tategaki, A.; Hamada, K.; Kishida, H.; Hosoe, K.; Morikawa, H.; Nakagawa, K. Effects of pediococcus acidilactici R037 on serum triglyceride levels in mice and rats after oral administration. J. Nutr. Sci. Vitam. 2018, 64, 41–47. [Google Scholar] [CrossRef] [PubMed]
- Mandaliya, D.K.; Seshadri, S. Short Chain Fatty Acids, pancreatic dysfunction and type 2 diabetes. Pancreatology 2019, 19, 280–284. [Google Scholar] [CrossRef] [PubMed]
- Lee, E.; Jung, S.R.; Lee, S.Y.; Lee, N.K.; Paik, H.D.; Lim, S., II. Lactobacillus plantarum strain ln4 attenuates diet-induced obesity, insulin resistance, and changes in hepatic mRNA levels associated with glucose and lipid metabolism. Nutrients. 2018, 10, 643. [Google Scholar] [CrossRef] [PubMed]
- Wei, M.; Gu, E.; Luo, J.; Zhang, Z.; Xu, D.; Tao, X.; Shah, P.N.; Wei, H. Enterococcus hirae WEHI01 isolated from a healthy Chinese infant ameliorates the symptoms of type 2 diabetes by elevating the abundance of Lactobacillales in rats. J. Dairy Sci. 2020, 103, 2969–2981. [Google Scholar] [CrossRef] [PubMed]
- Jia, L.; Li, D.; Feng, N.; Shamoon, M.; Sun, Z.; Ding, L.; Zhang, H.; Chen, W.; Sun, J.; Chen, Y.Q. Anti-diabetic Effects of Clostridium butyricum CGMCC0313.1 through Promoting the Growth of Gut Butyrate-producing Bacteria in Type 2 Diabetic Mice. Sci. Rep. 2017, 7, 7046. [Google Scholar] [CrossRef]
- Da Poian, A.T.; Castanho, M.A.R.B. Integrative Human Biochemistry A Textbook for Medical Biochemistry; Springer: Berlin/Heidelberg, Germany, 2015; p. 433. [Google Scholar]
- Chung, S.I.; Rico, C.W.; Kang, M.Y. Comparative study on the hypoglycemic and antioxidative effects of fermented paste (Doenjang) prepared from soybean and brown rice mixed with rice bran or red ginseng marc in mice fed with high fat diet. Nutrients 2014, 6, 4610–4624. [Google Scholar] [CrossRef]
- Nakamura, A.; Omori, K.; Terauchi, Y. Glucokinase activation or inactivation: Which will lead to the treatment of type 2 diabetes? Diabetes Obes. Metab. 2021, 23, 2199–2206. [Google Scholar] [CrossRef]
- Doyle, M.E.; Egan, J.M. Mechanisms of action of glucagon-like peptide 1 in the pancreas. Pharmacol. Ther. 2007, 113, 546–593. [Google Scholar] [CrossRef]
- Yadav, R.; Dey, D.K.; Vij, R.; Meena, S.; Kapila, R.; Kapila, S. Evaluation of anti-diabetic attributes of Lactobacillus rhamnosus MTCC: 5957, Lactobacillus rhamnosus MTCC: 5897 and Lactobacillus fermentum MTCC: 5898 in streptozotocin induced diabetic rats. Microb. Pathog. 2018, 125, 454–462. [Google Scholar] [CrossRef]
- Hu, R.; Zeng, F.; Wu, L.; Wan, X.; Chen, Y.; Zhang, J.; Liu, B. Fermented carrot juice attenuates type 2 diabetes by mediating gut microbiota in rats. Food Funct. 2019, 10, 2935–2946. [Google Scholar] [CrossRef]
- Qu, L.; Ren, J.; Huang, L.; Pang, B.; Liu, X.X.; Liu, X.X.; Liu, X.; Li, B.; Shan, Y. Antidiabetic Effects of Lactobacillus casei Fermented Yogurt through Reshaping Gut Microbiota Structure in Type 2 Diabetic Rats. J. Agric. Food Chem. 2018, 66, 12696–12705. [Google Scholar] [CrossRef] [PubMed]
- Everard, A.; Belzer, C.; Geurts, L.; Ouwerkerk, J.P.; Druart, C.; Bindels, L.B.; Guiot, Y.; Derrien, M.; Muccioli, G.G.; Delzenne, N.M.; et al. Cross-talk between Akkermansia muciniphila and intestinal epithelium controls diet-induced obesity. Proc. Natl. Acad. Sci. USA 2013, 110, 9066–9071. [Google Scholar] [CrossRef] [PubMed]
- Wang, Y.; Su, N.; Hou, G.; Li, J.; Ye, M. Hypoglycemic and hypolipidemic effects of a polysaccharide fromLachnumYM240 and itsderivatives in mice, induced by a high fat diet andlow dose STZ.pdf. Med. Chem. Commun. 2017, 8, 964–974. [Google Scholar] [CrossRef] [PubMed]
- Vilsbøll, T.; Krarup, T.; Deacon, C.F.; Madsbad, S.; Holst, J.J. Reduced Postprandial Concentrations of Intact Biologically Active Glucagon-Like Peptide 1 in Type 2 Diabetic Patients. Diabetes 2001, 50, 609–613. [Google Scholar] [CrossRef] [PubMed]
- Romaní-Pérez, M.; López-Almela, I.; Bullich-Vilarrubias, C.; Rueda-Ruzafa, L.; Gómez Del Pulgar, E.M.; Benítez-Páez, A.; Liebisch, G.; Lamas, J.A.; Sanz, Y. Holdemanella biformis improves glucose tolerance and regulates GLP-1 signaling in obese mice. FASEB J. 2021, 35, e21734. [Google Scholar] [CrossRef]
- Wang, G.; Li, X.; Zhao, J.; Zhang, H.; Chen, W. Lactobacillus casei CCFM419 attenuates type 2 diabetes via a gut microbiota dependent mechanism. Food Funct. 2017, 8, 3155–3164. [Google Scholar] [CrossRef]
- Aoki, R.; Kamikado, K.; Suda, W.; Takii, H.; Mikami, Y.; Suganuma, N.; Hattori, M.; Koga, Y. A proliferative probiotic Bifidobacterium strain in the gut ameliorates progression of metabolic disorders via microbiota modulation and acetate elevation. Sci. Rep. 2017, 7, 43522. [Google Scholar] [CrossRef] [PubMed]
- Bagarolli, R.A.; Tobar, N.; Oliveira, A.G.; Araújo, T.G.; Carvalho, B.M.; Rocha, G.Z.; Vecina, J.F.; Calisto, K.; Guadagnini, D.; Prada, P.O.; et al. Probiotics modulate gut microbiota and improve insulin sensitivity in DIO mice. J. Nutr. Biochem. 2017, 50, 16–25. [Google Scholar] [CrossRef]
- Kazafeos, K. Incretin effect: GLP-1, GIP, DPP4. Diabetes Res. Clin. Pract. 2011, 93 (Suppl. S1), S32–S36. [Google Scholar] [CrossRef]
- Buddington, R. Using Probiotics and Prebiotics to Manage the Gastrointestinal Tract Ecosystem. Prebiotics Probiotics Sci. Technol. 2009, 1, 1–32. [Google Scholar]
- Alexiadou, K.; Tan, T.M.M. Gastrointestinal Peptides as Therapeutic Targets to Mitigate Obesity and Metabolic Syndrome. Curr. Diab. Rep. 2020, 20, 1–7. [Google Scholar] [CrossRef] [PubMed]
- Brandt, S.J.; Götz, A.; Tschöp, M.H.; Müller, T.D. Gut hormone polyagonists for the treatment of type 2 diabetes. Peptides 2018, 100, 190–201. [Google Scholar] [CrossRef] [PubMed]
- Chen, C.; Cohrs, C.M.; Stertmann, J.; Bozsak, R.; Speier, S. Human beta cell mass and function in diabetes: Recent advances in knowledge and technologies to understand disease pathogenesis. Mol. Metab. 2017, 6, 943–957. [Google Scholar] [CrossRef] [PubMed]
- Mohammed, A.; Mahmoud, M.; Murugesan, R.; Cheng, H.W. Effect of a Synbiotic Supplement on Fear Response and Memory Assessment of Broiler Chickens Subjected to Heat Stress. Animals 2021, 11, 427. [Google Scholar] [CrossRef]
- Keenan, M.J.; Marco, M.L.; Ingram, D.K.; Martin, R.J. Improving healthspan via changes in gut microbiota and fermentation. Age 2015, 37, 98. [Google Scholar] [CrossRef] [PubMed]
- Canfora, E.E.; Jocken, J.W.; Blaak, E.E. Short-chain fatty acids in control of body weight and insulin sensitivity. Nat. Rev. Endocrinol. 2015, 11, 577–591. [Google Scholar] [CrossRef]
- Tolhurst, G.; Heffron, H.; Lam, Y.S.; Parker, H.E.; Habib, A.M.; Diakogiannaki, E.; Cameron, J.; Grosse, J.; Reimann, F.; Gribble, F.M. Short-chain fatty acids stimulate glucagon-like peptide-1 secretion via the G-protein-coupled receptor FFAR2. Diabetes 2012, 61, 364–371. [Google Scholar] [CrossRef]
- Christiansen, C.B.; Gabe, M.B.N.; Svendsen, B.; Dragsted, L.O.; Rosenkilde, M.M.; Holst, J.J. The impact of short-chain fatty acids on glp-1 and pyy secretion from the isolated perfused rat colon. Am. J. Physiol. Gastrointest Liver Physiol. 2018, 315, G53–G65. [Google Scholar] [CrossRef]
- Psichas, A.; Sleeth, M.L.; Murphy, K.G.; Brooks, L.; Bewick, G.A.; Hanyaloglu, A.C.; Ghatei, M.A.; Bloom, S.R.; Frost, G. The short chain fatty acid propionate stimulates GLP-1 and PYY secretion via free fatty acid receptor 2 in rodents. Int. J. Obes. 2015, 39, 424–429. [Google Scholar] [CrossRef]
- Chambers, E.S.; Viardot, A.; Psichas, A.; Morrison, D.J.; Murphy, K.G.; Zac-Varghese, S.E.K.; MacDougall, K.; Preston, T.; Tedford, C.; Finlayson, G.S.; et al. Effects of targeted delivery of propionate to the human colon on appetite regulation, body weight maintenance and adiposity in overweight adults. Gut 2015, 64, 1744–1754. [Google Scholar] [CrossRef]
- Tomaro-Duchesneau, C.; LeValley, S.L.; Roeth, D.; Sun, L.; Horrigan, F.T.; Kalkum, M.; Hyser, J.M.; Britton, R.A. Discovery of a bacterial peptide as a modulator of GLP-1 and metabolic disease. Sci Rep. 2020, 10, 4922. [Google Scholar] [CrossRef] [PubMed]
- Flint, A.; Raben, A.; Astrup, A.; Holst, J.J. Glucagon-like peptide 1 promotes satiety and suppresses energy intake in humans. J. Clin. Investig. 1998, 101, 515–520. [Google Scholar] [CrossRef] [PubMed]
- Kemp, D.M. Type 2 Diabetes: Disease Overview. In New Therapeutic Strategies for Type 2 Diabetes: Small Molecule Approaches; Jones, R.M., Ed.; Royal Society of Chemistry: Rahway, NJ, USA, 2012; pp. 1–14. [Google Scholar]
- Kassaian, N.; Feizi, A.; Aminorroaya, A.; Jafari, P.; Ebrahimi, M.T.; Amini, M. The effects of probiotics and synbiotic supplementation on glucose and insulin metabolism in adults with prediabetes: A double-blind randomized clinical trial. Acta Diabetol. 2018, 55, 1019–1028. [Google Scholar] [CrossRef] [PubMed]
- Naito, E.; Yoshida, Y.; Kunihiro, S.; Makino, K.; Kasahara, K.; Kounoshi, Y.; Aida, M.; Hoshi, R.; Watanabe, O.; Igarashi, T.; et al. Effect of Lactobacillus casei strain Shirota-fermented milk on metabolic abnormalities in obese prediabetic Japanese men: A randomised, double-blind, placebo-controlled trial. Biosci. Microb. Food Health 2018, 37, 9–18. [Google Scholar] [CrossRef] [PubMed]
- Niibo, M.; Shirouchi, B.; Umegatani, M.; Morita, Y.; Ogawa, A.; Sakai, F.; Kadooka, Y.; Sato, M. Probiotic Lactobacillus gasseri SBT2055 improves insulin secretion in a diabetic rat model. J. Dairy Sci. 2019, 102, 997–1006. [Google Scholar] [CrossRef]
- Terayama, Y.; Matsuura, T.; Uchida, M.; Narama, I.; Ozaki, K. Probiotic (yogurt) containing Lactobacillus gasseri OLL2716 is effective for preventing Candida albicans-induced mucosal inflammation and proliferation in the forestomach of diabetic rats. Histol. Histopathol. 2016, 31, 689–697. [Google Scholar]
- Toshimitsu, T.; Gotou, A.; Furuichi, K.; Hachimura, S.; Asami, Y. Effects of 12-wk Lactobacillus plantarum OLL2712 treatment on glucose metabolism and chronic inflammation in prediabetic individuals: A single-arm pilot study. Nutrition 2019, 58, 175–180. [Google Scholar] [CrossRef]
- Wang, B.; Chandrasekera, P.; Pippin, J. Leptin- and Leptin Receptor-Deficient Rodent Models: Relevance for Human Type 2 Diabetes. Curr. Diabetes Rev. 2014, 10, 131–145. [Google Scholar] [CrossRef]
- Heydemann, A. An Overview of Murine High Fat Diet as a Model for Type 2 Diabetes Mellitus. J. Diabetes Res. 2016, 2016, 2902351. [Google Scholar] [CrossRef]
- Le Roy, T.; de Hase, E.M.; Van Hul, M.; Paquot, A.; Pelicaen, R.; Régnier, M.; Depommier, C.; Druart, C.; Everard, A.; Maiter, D.; et al. Dysosmobacter welbionis is a newly isolated human commensal bacterium preventing diet-induced obesity and metabolic disorders in mice. Gut 2021, 1–10. [Google Scholar] [CrossRef]
- Moya-Pérez, A.; Neef, A.; Sanz, Y. Bifidobacterium pseudocatenulatum CECT 7765 reduces obesity-associated inflammation by restoring the lymphocyte-macrophage balance and gut microbiota structure in high-fat diet-fed mice. PLoS ONE. 2015, 10, e0126976. [Google Scholar] [CrossRef] [PubMed]
- Plows, J.F.; Ramos Nieves, J.M.; Budin, F.; Mace, K.; Reynolds, C.M.; Vickers, M.H.; Silva-Zolezzi, I.; Baker, P.N.; Stanley, J.L. The effects of myo-inositol and probiotic supplementation in a high-fat-fed preclinical model of glucose intolerance in pregnancy. Br. J. Nutr. 2020, 123, 516–528. [Google Scholar] [CrossRef] [PubMed]
- Rouhani, M.H.; Hadi, A.; Ghaedi, E.; Salehi, M.; Mahdavi, A.; Mohammadi, H. Do probiotics, prebiotics and synbiotics affect adiponectin and leptin in adults? A systematic review and meta-analysis of clinical trials. Clin. Nutr. 2019, 38, 2031–2037. [Google Scholar] [CrossRef] [PubMed]
- Anini, Y.; Brubaker, P.L. Role of Leptin in the Regulation of Glucagon-Like Peptide-1 Secretion. Diabetes 2003, 52, 252–259. [Google Scholar] [CrossRef]
- Allen, J.M.; Berg Miller, M.E.; Pence, B.D.; Whitlock, K.; Nehra, V.; Gaskins, H.R.; White, B.A.; Fryer, J.D.; Woods, J.A. Voluntary and forced exercise differentially alters the gut microbiome in C57BL/6J mice. J. Appl. Physiol. 2015, 118, 1059–1066. [Google Scholar] [CrossRef]
- Mack, D.R.; Michail, S.; Wei, S.H.U.; McDougall, L.; Hollingsworth, M.A. Probiotics inhibit enteropathogenic E. coli adherence in vitro by inducing intestinal mucin gene expression. Am. J. Physiol. 1999, 276, 941–950. [Google Scholar]
- Nakata, K.; Sugi, Y.; Narabayashi, H.; Kobayakawa, T.; Nakanishi, Y.; Tsuda, M.; Hosono, A.; Kaminogawa, S.; Hanazawa, S.; Takahashi, K. Commensal microbiota-induced microRNA modulates intestinal epithelial permeability through the small GTPase ARF4. J. Biol. Chem. 2017, 292, 15426–15433. [Google Scholar] [CrossRef]
- Tlaskalová-Hogenová, H.; Tpánková, R.; Kozáková, H.; Hudcovic, T.; Vannucci, L.; Tuková, L.; Rossmann, P.; Hrnčíř, T.; Kverka, M.; Zákostelská, Z.; et al. The role of gut microbiota (commensal bacteria) and the mucosal barrier in the pathogenesis of inflammatory and autoimmune diseases and cancer: Contribution of germ-free and gnotobiotic animal models of human diseases. Cell Mol. Immunol. 2011, 8, 110–120. [Google Scholar] [CrossRef]
- Johansson, M.E.V.; Sjövall, H.; Hansson, G.C. The gastrointestinal mucus system in health and disease. Nat. Rev. Gastroenterol. Hepatol. 2013, 10, 352–361. [Google Scholar] [CrossRef]
- Fischer, F.M.; Silva-Costa, A.; Griep, R.H.; Smolensky, M.H.; Bohle, P.; Rotenberg, L. Working Time Society consensus statements: Psychosocial stressors relevant to the health and wellbeing of night and shift workers. Ind. Health 2019, 57, 175–183. [Google Scholar] [CrossRef]
- Spiegel, K.; Leproult, R.; Van Cauter, E. Impact of sleep debt on metabolic and endocrine function. Lancet 1999, 354, 1435–1439. [Google Scholar] [CrossRef]
- Jin, S.G.; Chau, J.F.L.; Chi, H.C.; Koo, M.W.L. Partial sleep deprivation compromises gastric mucosal integrity in rats. Life Sci. 2005, 77, 220–229. [Google Scholar]
- Caspary, W.F.; Stein, J. Diseases of the small intestine. Eur. J. Gastroenterol. Hepatol. 1999, 11, 21–25. [Google Scholar] [CrossRef]
- Joysowal, M.; Saikia, B.N.; Dowarah, R.; Tamuly, S.; Kalita, D.; Dev Choudhury, K.B. Effect of probiotic Pediococcus acidilactici FT28 on growth performance, nutrient digestibility, health status, meat quality, and intestinal morphology in growing pigs. Vet. World 2018, 11, 1669–1676. [Google Scholar] [CrossRef]
- Sikalidis, A.K.; Maykish, A. The Gut Microbiome and Type 2 Diabetes Mellitus: Discussing a Complex Relationship. Biomedicines 2020, 8, 8. [Google Scholar] [CrossRef]
- Guo, S.; Gillingham, T.; Guo, Y.; Meng, D.; Zhu, W.; Allen Walker, W.; Ganguli, K. Secretions of Bifidobacterium infantis and Lactobacillus acidophilus Protect Intestinal Epithelial Barrier Function. J. Pediatr. Gastroenterol. Nutr. 2017, 64, 404–412. [Google Scholar] [CrossRef]
- Rohr, M.W.; Narasimhulu, C.A.; Rudeski-Rohr, T.A.; Parthasarathy, S. Negative Effects of a High-Fat Diet on Intestinal Permeability: A Review. Adv. Nutr. 2020, 11, 77–91. [Google Scholar] [CrossRef]
- Everard, A.; Geurts, L.; Caesar, R.; Van Hul, M.; Matamoros, S.; Duparc, T.; Denis, R.G.P.; Cochez, P.; Pierard, F.; Castel, J.; et al. Intestinal epithelial MyD88 is a sensor switching host metabolism towards obesity according to nutritional status. Nat. Commun. 2014, 5, 5648. [Google Scholar] [CrossRef]
- Aw, W.; Fukuda, S. Understanding the role of the gut ecosystem in diabetes mellitus. J. Diabetes Investig. 2018, 9, 5–12. [Google Scholar] [CrossRef]
- Roselli, M.; Finamore, A.; Hynönen, U.; Palva, A.; Mengheri, E. Differential protection by cell wall components of Lactobacillus amylovorus DSM 16698 T against alterations of membrane barrier and NF-kB activation induced by enterotoxigenic F4 + Escherichia coli on intestinal cells. BMC Microbiol. 2016, 16, 226. [Google Scholar] [CrossRef]
- Sánchez, B.; Urdaci, M.C.; Margolles, A. Extracellular proteins secreted by probiotic bacteria as mediators of effects that promote mucosa-bacteria interactions. Microbiology 2010, 156, 3232–3242. [Google Scholar] [CrossRef] [PubMed]
- Pinna, N.K.; Anjana, R.M.; Saxena, S.; Dutta, A.; Gnanaprakash, V.; Rameshkumar, G.; Aswath, S.; Raghavan, S.; Rani, C.S.S.; Radha, V.; et al. Trans-ethnic gut microbial signatures of prediabetic subjects from India and Denmark. Genome Med. 2021, 13, 36. [Google Scholar] [CrossRef] [PubMed]
- He, J.; Zhang, P.; Shen, L.; Niu, L.; Tan, Y.; Chen, L.; Zhao, Y.; Bai, L.; Hao, X.; Li, X.; et al. Short-Chain Fatty Acids and Their Association with Signalling Pathways in Inflammation, Glucose and Lipid Metabolism. Int. J. Mol. Sci. 2020, 21, 6356. [Google Scholar] [CrossRef] [PubMed]
- Yokota, A.; Fukiya, S.; Ooka, T.; Ogura, Y.; Hayashi, T.; Ishizuka, S. Is bile acid a determinant of the gut microbiota on a high-fat diet? Gut Microb. 2012, 3, 455–459. [Google Scholar] [CrossRef]
- Fernandez, B.; Savard, P.; Fliss, I. Survival and Metabolic Activity of Pediocin Producer Pediococcus acidilactici UL5: Its Impact on Intestinal Microbiota and Listeria monocytogenes in a Model of the Human Terminal Ileum. Microb. Ecol. 2016, 72, 931–942. [Google Scholar] [CrossRef]
- Plovier, H.; Everard, A.; Druart, C.; Depommier, C.; Van Hul, M.; Geurts, L.; Chilloux, J.; Ottman, N.; Duparc, T.; Lichtenstein, L.; et al. A purified membrane protein from Akkermansia muciniphila or the pasteurized bacterium improves metabolism in obese and diabetic mice. Nat. Med. 2017, 23, 107–113. [Google Scholar] [CrossRef]
- Almada, C.N.; Almada-Érix, C.N.; Roquetto, A.R.; Santos-Junior, V.A.; Cabral, L.; Noronha, M.F.; Gonçalves, A.E.S.S.; Santos, P.; Santos, A.D.; Martinez, J.; et al. Paraprobiotics obtained by six different inactivation processes: Impacts on the biochemical parameters and intestinal microbiota of Wistar male rats. Int. J. Food Sci. Nutr. 2021, 72, 1057–1070. [Google Scholar] [CrossRef]
- Salminen, S.; Collado, M.C.; Endo, A.; Hill, C.; Lebeer, S.; Quigley, E.M.M.; Sanders, M.E.; Shamir, R.; Swann, J.R.; Szajewska, H.; et al. The International Scientific Association of Probiotics and Prebiotics (ISAPP) consensus statement on the definition and scope of postbiotics. Nat. Rev. Gastroenterol. Hepatol. 2021, 18, 649–667. [Google Scholar] [CrossRef]
- Tsilingiri, K.; Barbosa, T.; Penna, G.; Caprioli, F.; Sonzogni, A.; Viale, G.; Rescigno, M. Probiotic and postbiotic activity in health and disease: Comparison on a novel polarised ex-vivo organ culture model. Gut 2012, 61, 1007–1015. [Google Scholar] [CrossRef]
- Żółkiewicz, J.; Marzec, A.; Ruszczyński, M.; Feleszko, W. Postbiotics—A step beyond pre- and probiotics. Nutrients 2020, 12, 2189. [Google Scholar] [CrossRef]


Publisher’s Note: MDPI stays neutral with regard to jurisdictional claims in published maps and institutional affiliations. |
© 2022 by the authors. Licensee MDPI, Basel, Switzerland. This article is an open access article distributed under the terms and conditions of the Creative Commons Attribution (CC BY) license (https://creativecommons.org/licenses/by/4.0/).
Share and Cite
Cabello-Olmo, M.; Oneca, M.; Pajares, M.J.; Jiménez, M.; Ayo, J.; Encío, I.J.; Barajas, M.; Araña, M. Antidiabetic Effects of Pediococcus acidilactici pA1c on HFD-Induced Mice. Nutrients 2022, 14, 692. https://doi.org/10.3390/nu14030692
Cabello-Olmo M, Oneca M, Pajares MJ, Jiménez M, Ayo J, Encío IJ, Barajas M, Araña M. Antidiabetic Effects of Pediococcus acidilactici pA1c on HFD-Induced Mice. Nutrients. 2022; 14(3):692. https://doi.org/10.3390/nu14030692
Chicago/Turabian StyleCabello-Olmo, Miriam, María Oneca, María José Pajares, Maddalen Jiménez, Josune Ayo, Ignacio J. Encío, Miguel Barajas, and Miriam Araña. 2022. "Antidiabetic Effects of Pediococcus acidilactici pA1c on HFD-Induced Mice" Nutrients 14, no. 3: 692. https://doi.org/10.3390/nu14030692
APA StyleCabello-Olmo, M., Oneca, M., Pajares, M. J., Jiménez, M., Ayo, J., Encío, I. J., Barajas, M., & Araña, M. (2022). Antidiabetic Effects of Pediococcus acidilactici pA1c on HFD-Induced Mice. Nutrients, 14(3), 692. https://doi.org/10.3390/nu14030692