Plant-Based Alternative Products: Are They Healthy Alternatives? Micro- and Macronutrients and Nutritional Scoring


Abstract
:1. Introduction
2. Materials and Methods
2.1. Online Market Analysis
2.2. Data of Animal Foods from Databases
2.3. Nutri-Score
2.4. Sample Material
2.5. Mineral and Vitamin Analysis
2.6. Statistical Analysis
3. Results
3.1. Market Analysis
3.2. Nutrients and Nutri-Score
3.3. Minerals
3.4. Vitamins
4. Discussion
4.1. Market Analysis
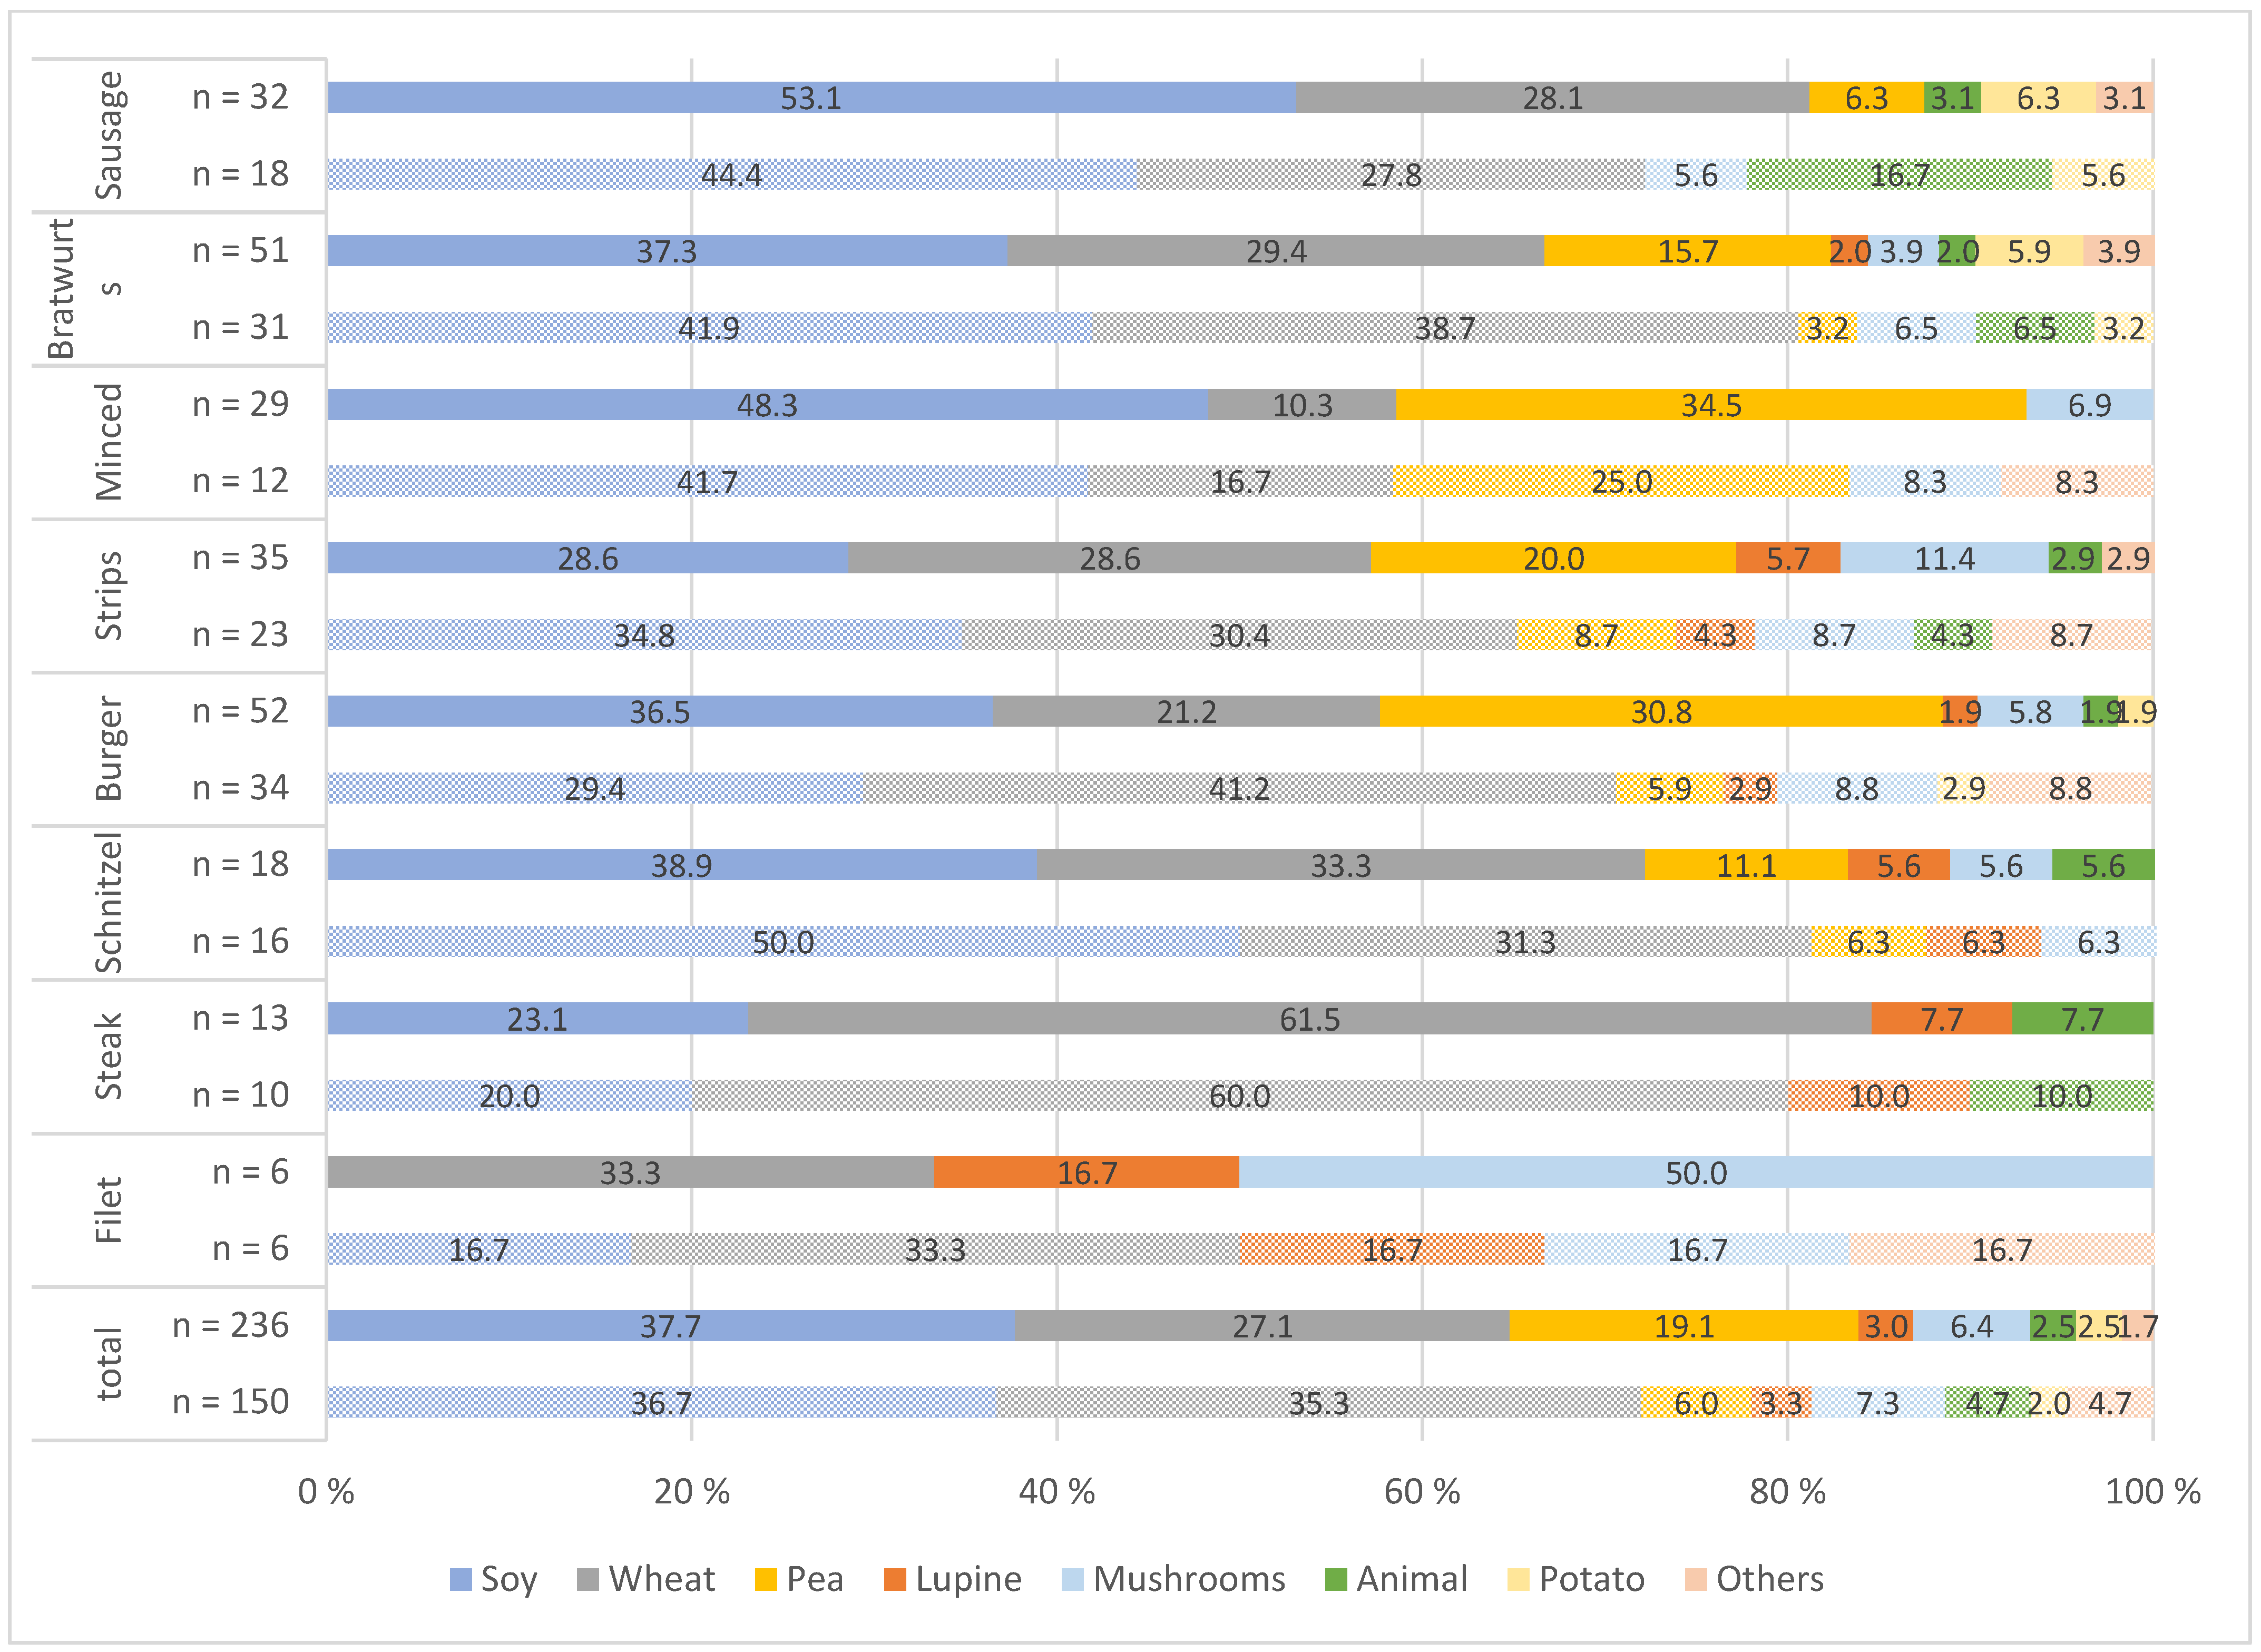
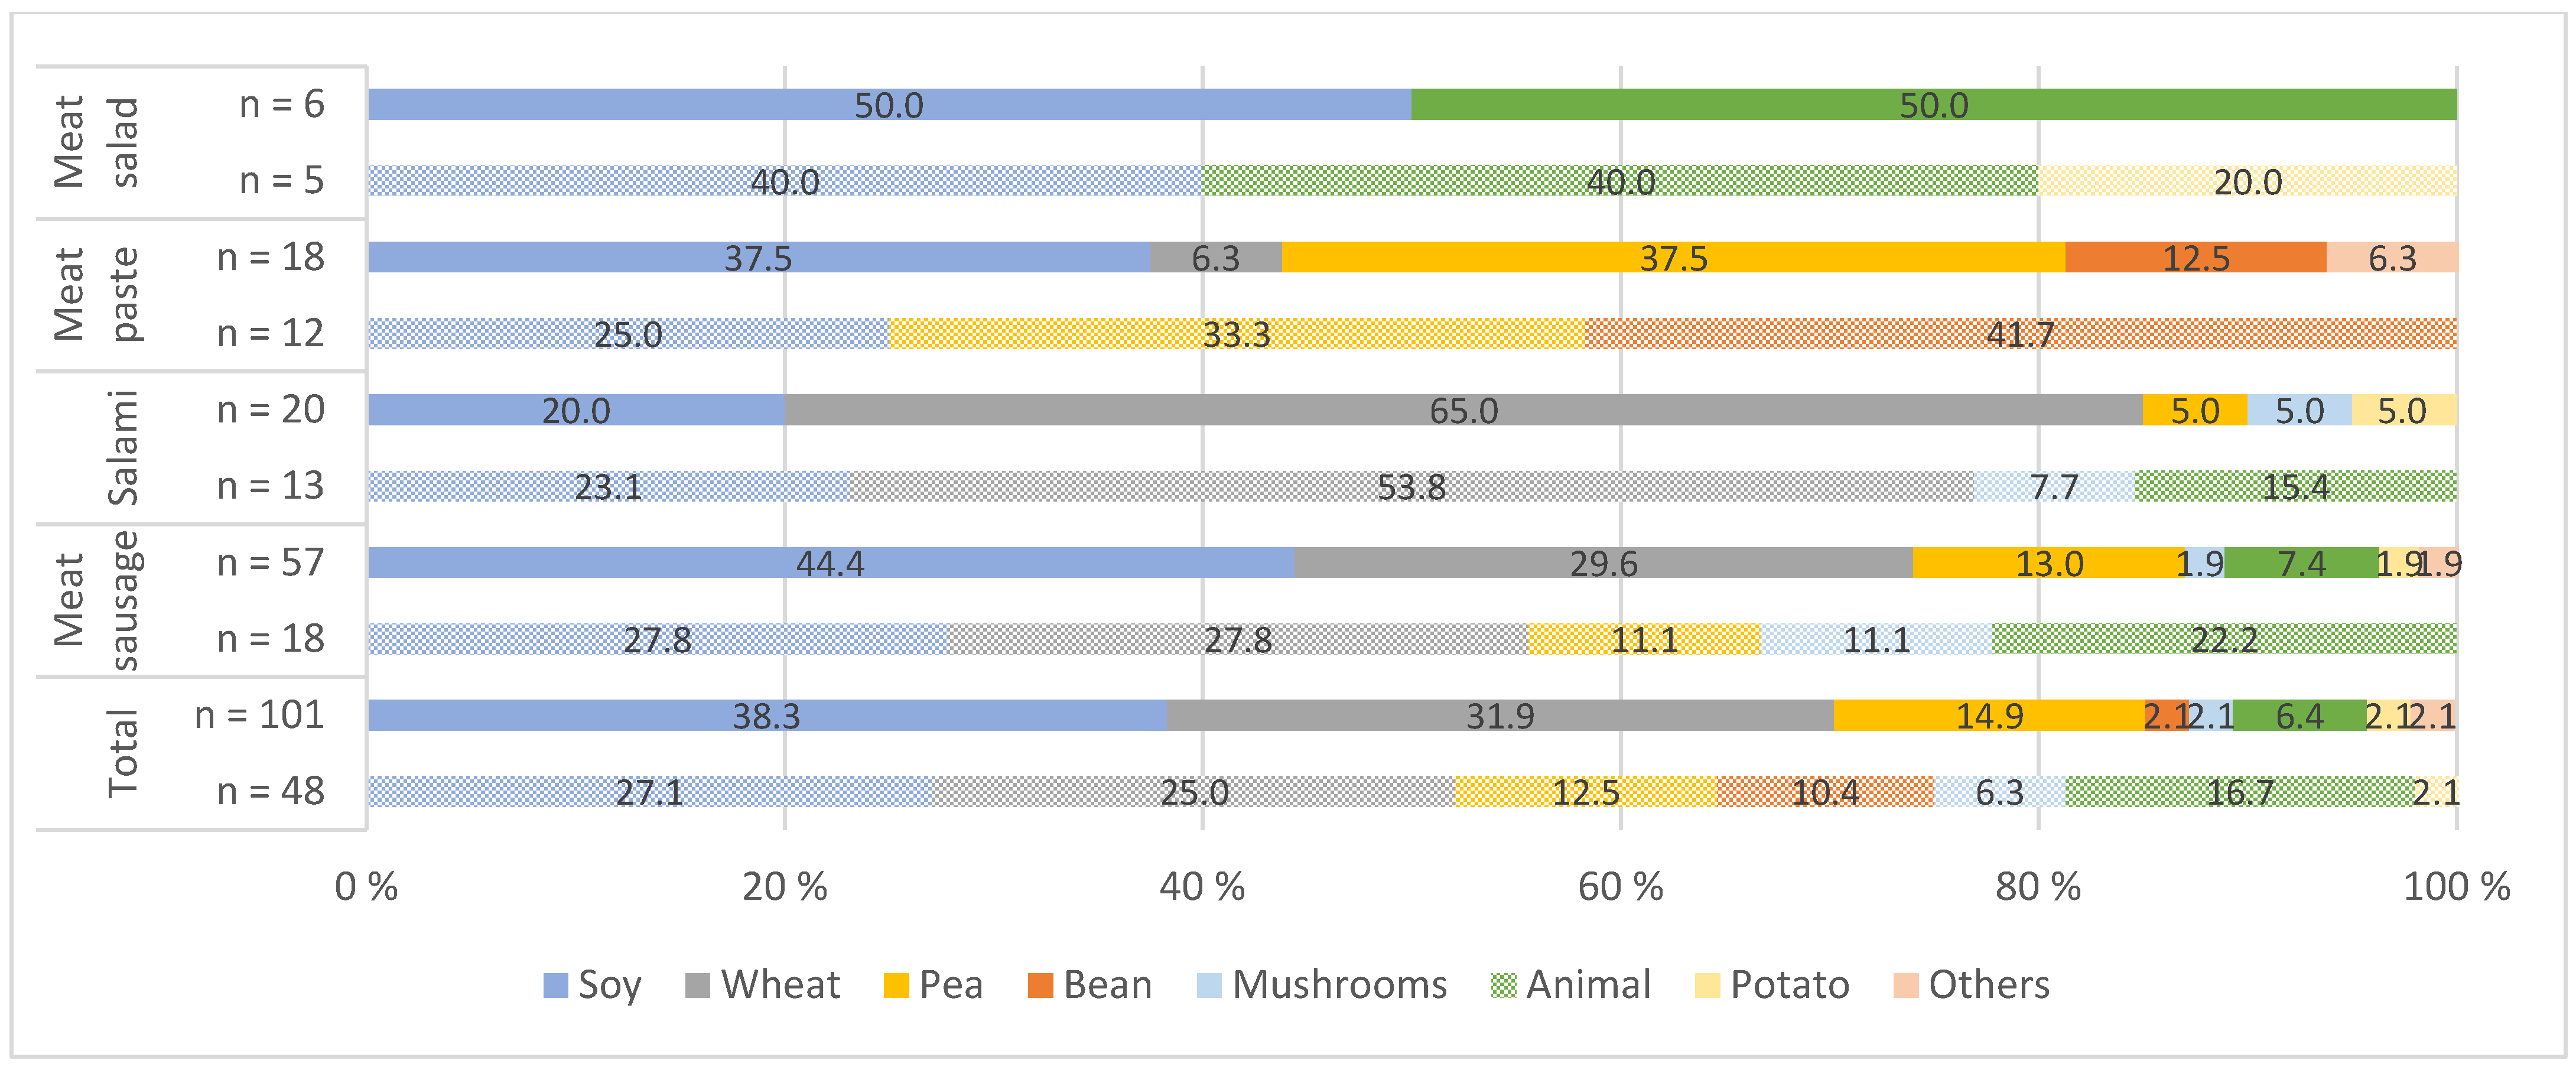
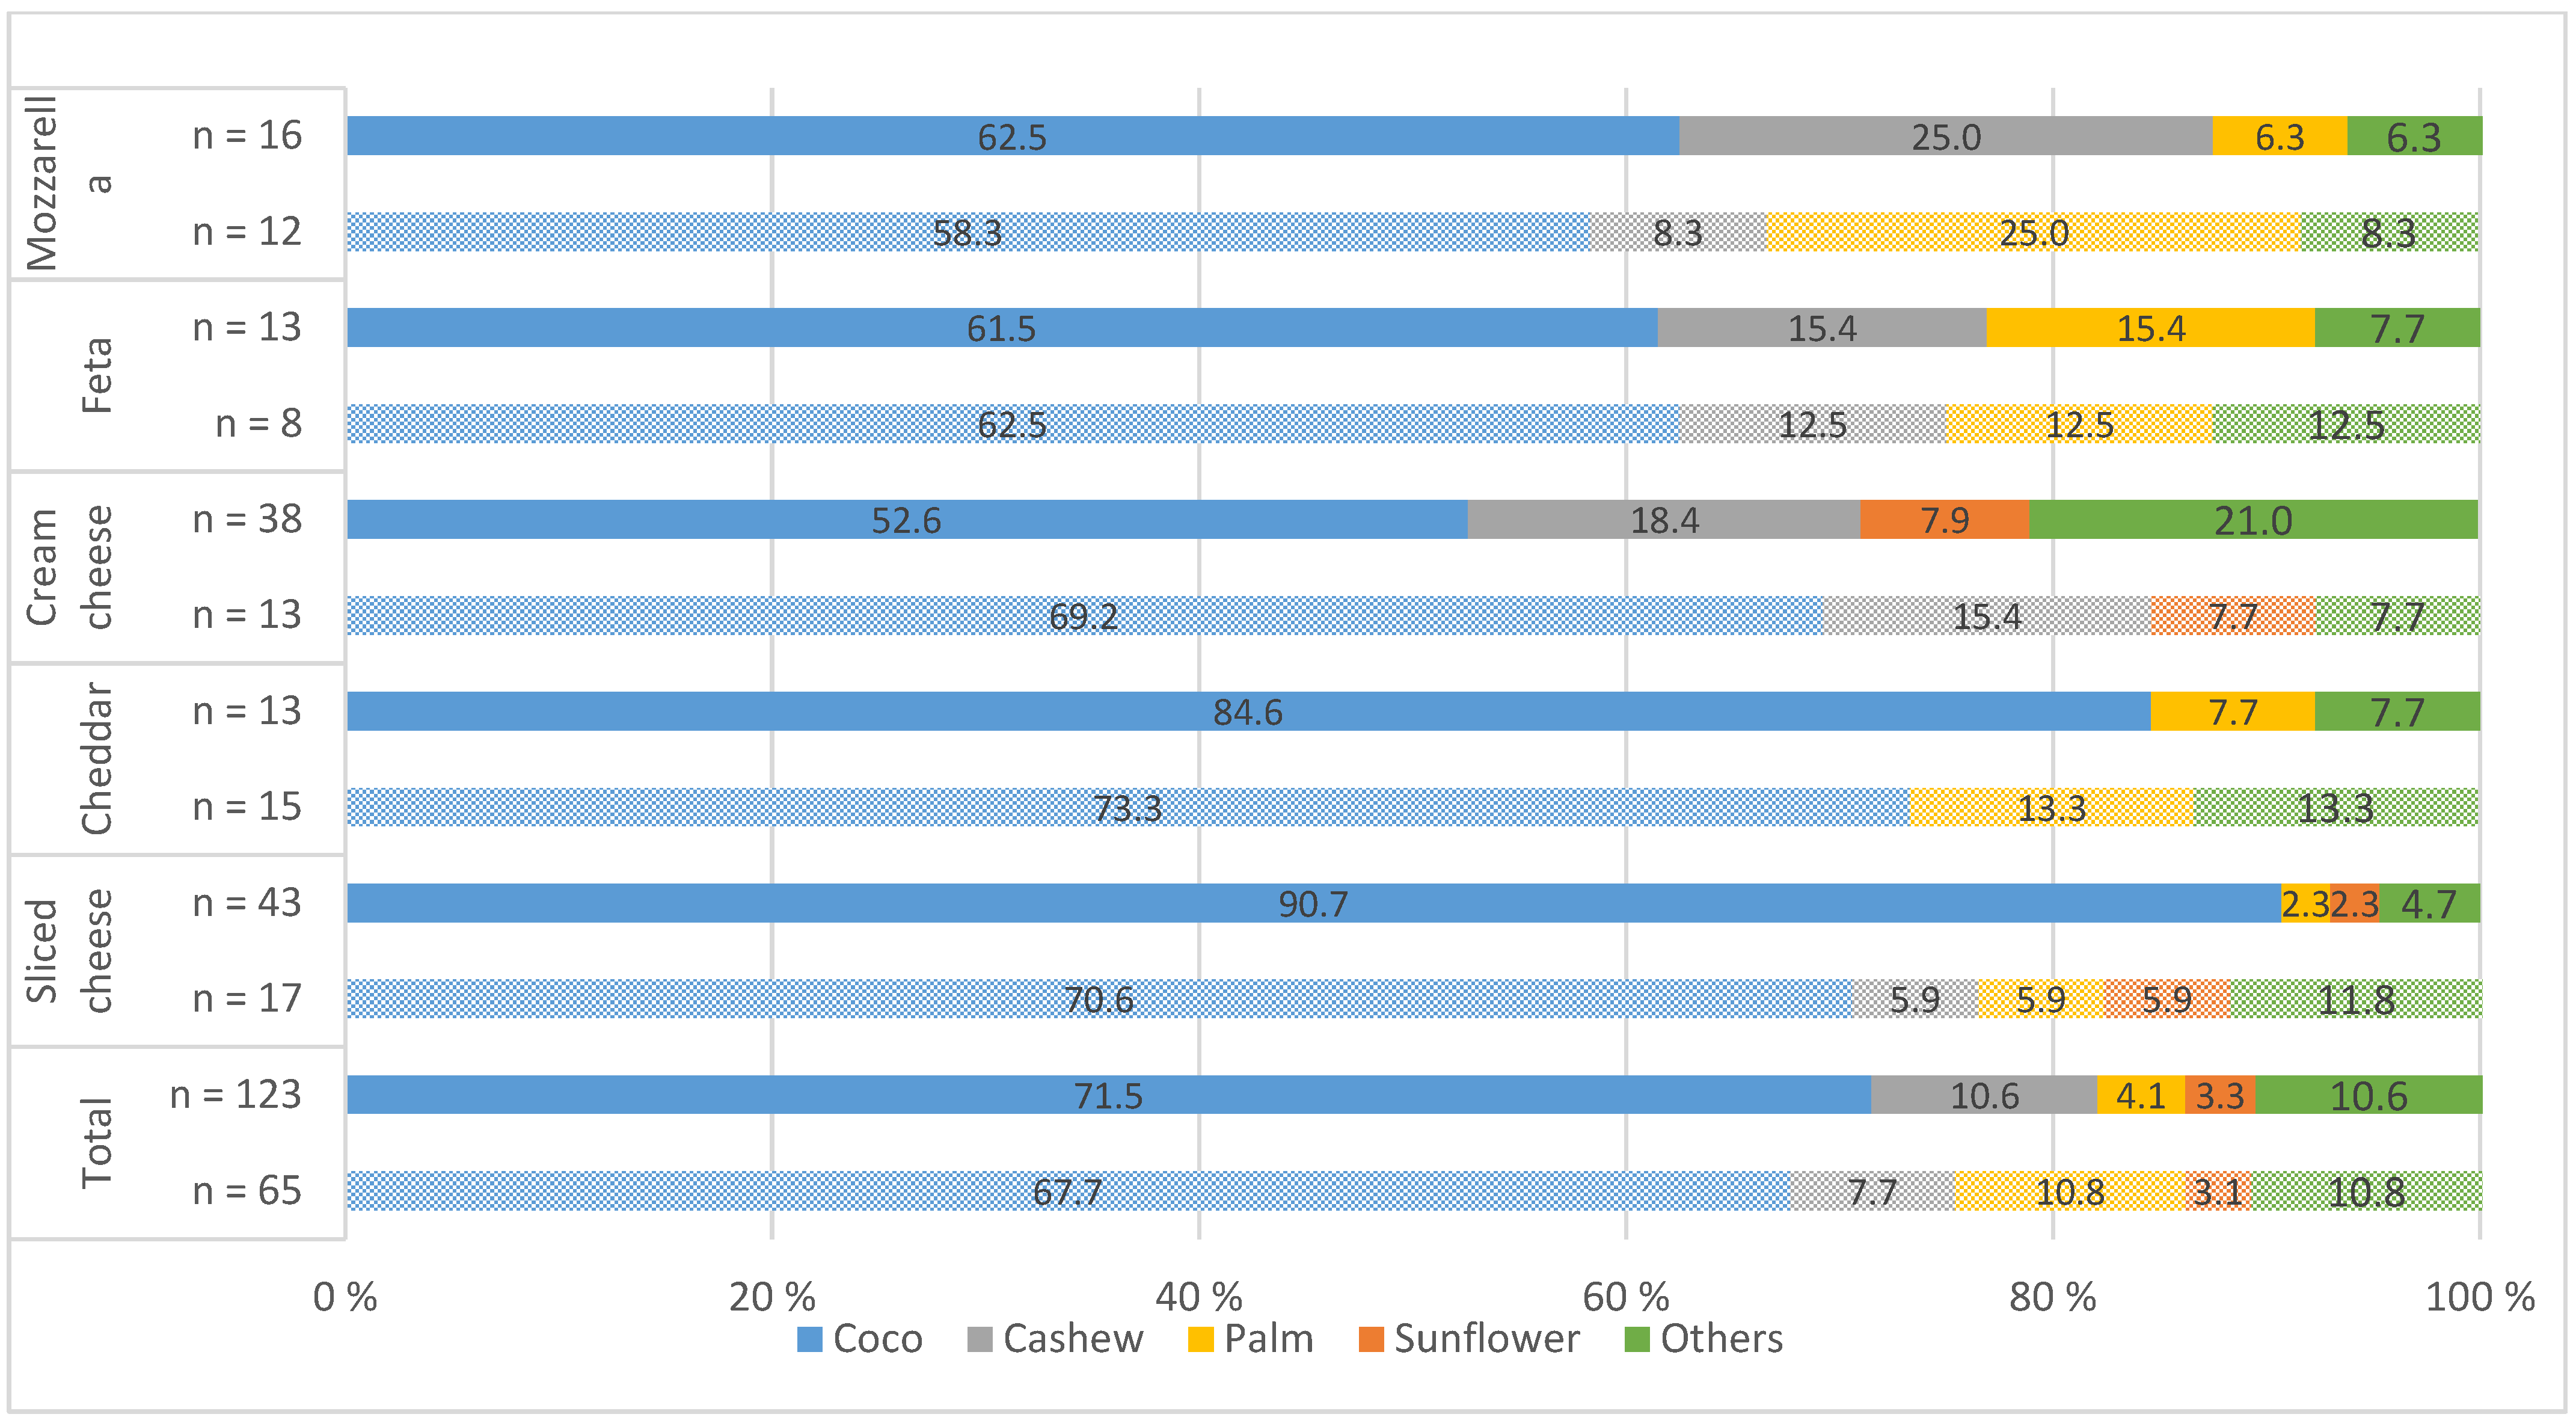
4.2. The “Big 7” of the Plant-Based Alternative Products
4.3. Nutri-Score
4.4. Micronutrients of the Plant-Based Alternative Products
5. Conclusions
Author Contributions
Funding
Institutional Review Board Statement
Informed Consent Statement
Data Availability Statement
Acknowledgments
Conflicts of Interest
References
- Vegconomist the Vegan Business Magazine. Deutschland: Readly Studie Liefert Erkenntnisse Über Motivation, Sich Fleischlos zu Ernähren. Available online: https://vegconomist.de/studien-und-zahlen/deutschland-readly-studie-liefert-erkenntnisse-ueber-motivation-sich-fleischlos-zu-ernaehren/ (accessed on 1 November 2021).
- Willett, W.; Rockström, J.; Loken, B.; Springmann, M.; Lang, T.; Vermeulen, S.; Garnett, T.; Tilman, D.; DeClerck, F.; Wood, A.; et al. Food in the Anthropocene: The EAT–Lancet Commission on healthy diets from sustainable food systems. Lancet 2019, 393, 447–492. [Google Scholar] [CrossRef]
- OECD/FAO. OECD-FAO Agricultural Outlook 2021–2030; OECD Publishing: Paris, France, 2021. [Google Scholar] [CrossRef]
- Plant-Based Foods in Europe: How Big Is the Market? Smart Protein. Plant-Based Food Sector Report by Smart Protein Project, European. Union’s Horizon 2020 Research and Innovation Programme (No 862957). Available online: https://smartproteinproject.eu/plant-based-food-sector-report (accessed on 1 November 2021).
- Joshi, V.; Kumar, S. Meat analogues: Plant based alternatives to meat products—A review. Int. J. Food Ferment. Technol. 2015, 5, 107. [Google Scholar] [CrossRef]
- Asgar, M.A.; Fazilah, A.; Huda, N.; Bhat, R.; Karim, A.A. Nonmeat protein alternatives as meat extenders and meat analogs. Compr. Rev. Food Sci. Food Saf. 2010, 9, 513–529. [Google Scholar] [CrossRef] [PubMed]
- Caporgno, M.P.; Böcker, L.; Müssner, C.; Stirnemann, E.; Haberkorn, I.; Adelmann, H.; Handschin, S.; Windhab, E.J.; Mathys, A. Extruded meat analogues based on yellow, heterotrophically cultivated Auxenochlorella protothecoides microalgae. Innov. Food Sci. Emerg. Technol. 2020, 59, 102275. [Google Scholar] [CrossRef]
- Graf, G.; Dittrich, N.; Mühleisen, I.; Clausen, A. Vegetarische und vegane Ersatzprodukte. Fleisch-, Wurst- und Käsealternativen. Ernähr. Umsch. 2017, 7, M382–M389. [Google Scholar] [CrossRef]
- House, J. Consumer acceptance of insect-based foods in the Netherlands: Academic and commercial implications. Appetite 2016, 107, 47–58. [Google Scholar] [CrossRef] [PubMed] [Green Version]
- Hartmann, C.; Shi, J.; Giusto, A.; Siegrist, M. The psychology of eating insects: A cross-cultural comparison between Germany and China. Food Qual. Prefer. 2015, 44, 148–156. [Google Scholar] [CrossRef]
- Tan, H.S.G.; Fischer, A.R.H.; van Trijp, H.C.M.; Stieger, M. Tasty but nasty? Exploring the role of sensory-liking and food appropriateness in the willingness to eat unusual novel foods like insects. Food Qual. Prefer. 2016, 48, 293–302. [Google Scholar] [CrossRef]
- Cunha, C.R.; Dias, A.I.; Viotto, W.H. Microstructure, texture, colour and sensory evaluation of a spreadable processed cheese analogue made with vegetable fat. Food Res. Int. 2010, 43, 723–729. [Google Scholar] [CrossRef]
- Masotti, F.; Cattaneo, S.; Stuknytė, M.; De Noni, I. Status and developments in analogue cheese formulations and functionalities. Trends Food Sci. Technol. 2018, 74, 158–169. [Google Scholar] [CrossRef]
- Regulation (EU) No 1169/2011 of the European Parliament and of the Council of 25 October 2011. Current Consolidated Version: 01/01/2018. Available online: http://data.europa.eu/eli/reg/2011/1169/oj (accessed on 1 November 2021).
- De Temmerman, J.; Heeremans, E.; Slabbinck, H.; Vermeir, I. The impact of the Nutri-Score nutrition label on perceived healthiness and purchase intentions. Appetite 2021, 157, 104995. [Google Scholar] [CrossRef] [PubMed]
- Folkvord, F.; Bergmans, N.; Pabian, S. The effect of the Nutri-Score label on consumer’s attitudes, taste perception and purchase intention: An experimental pilot study. Food Qual. Prefer. 2021, 94, 104303. [Google Scholar] [CrossRef]
- Emrich, T.E.; Qi, Y.; Lou, W.Y.; L’Abbe, M.R. Traffic-light labels could reduce population intakes of calories, total fat, saturated fat, and sodium. PLoS ONE 2017, 12, e0171188. [Google Scholar] [CrossRef] [PubMed]
- Egnell, M.; Ducrot, P.; Touvier, M.; Allès, B.; Hercberg, S.; Kesse-Guyot, E.; Julia, C. Objective understanding of Nutri-Score front-of-package nutrition label according to individual characteristics of subjects: Comparisons with other format labels. PLoS ONE 2018, 13, e0202095. [Google Scholar] [CrossRef] [Green Version]
- Busch, G.; Bayer, E.; Iweala, S.; Mehlhose, C.; Rubach, C.; Schütz, A.; Ullmann, K.; Spiller, A. Einkaufs- und Ernährungsverhalten sowie Resilienz des Enährungssystems aus Sicht der Bevölkerung: Eine Studie Während der Corona-Pandemie im Juni 2020. Ergebnisse der Zweiten Befragungswelle; Diskussionsbeitrag Nr. 2004; Department für Agrarökonomie und Rurale Entwicklung, Georg-August-Universität Göttingen: Göttingen, Germany, 2020. [Google Scholar]
- Spalding, N.; Figueiras, S.; Alessandra, A.; Perez, A.; Green Queen Media. The APAC Alternative Protein Industry Report 2021. 2021. Available online: https://www.greenqueen.com.hk/apac-alt-protein-report-2021/ (accessed on 1 December 2021).
- The Vegan Society. Changing Diets During the COVID-19 Pandemic. 2021. Available online: https://www.vegansociety.com/sites/default/files/uploads/downloads/Changing%20Diets%20During%20the%20Covid-19%20Pandemic.pdf (accessed on 1 December 2021).
- Regulation (EU) 2018/848 of the European Parliament and of the Council of 30 May 2018 on Organic Production and Labeling of Organic Products and Repealing Council Regulation (EC) No 834/2007. Current Consolidated Version: 14/11/2020. Available online: http://data.europa.eu/eli/reg/2018/848/oj (accessed on 1 November 2021).
- Monteiro, C.A.; Cannon, G.; Lawrence, M.; Costa Louzada, M.L.; Pereira Machado, P. Ultra-Processed Foods, Diet Quality, and Health Using the NOVA Classification System; FAO: Rome, Italy, 2019. [Google Scholar]
- AUSNUT (AUStralian Food and NUTrient Database) 2011-13. Food Standards Australia New Zealand (FSANZ). Available online: https://data.gov.au/data/dataset/6b22884e-aab5-49d0-af5b-9d62285bd6e6 (accessed on 1 November 2021).
- National Institute for Health and Welfare, Public Health Promotion Unit. Fineli. Finnish Food Composition Database. Release 20. Helsinki 2019. Available online: www.fineli.fi (accessed on 1 November 2021).
- U.S. Department of Agriculture (USDA) FoodData Central Data. Food and Nutrient Database for Dietary Studies 2017–2018 (FNDDS 2017–2018). Available online: https://fdc.nal.usda.gov/ (accessed on 1 November 2021).
- Max Rubner-Institute, Federal Research Institute of Nutrition and Food, Bundeslebensmittelschlüssel (BLS) Version 3.02. Available online: https://www.blsdb.de/ (accessed on 1 November 2021).
- Szabo de Edelenyi, F.; Egnell, M.; Galan, P.; Druesne-Pecollo, N.; Hercberg, S.; Julia, C. Ability of the Nutri-Score front-of-pack nutrition label to discriminate the nutritional quality of foods in the German food market and consistency with nutritional recommendations. Arch. Public Health 2019, 77, 28. [Google Scholar] [CrossRef] [Green Version]
- Julia, C.; Hercberg, S. Nutri-Score: Evidence of the effectiveness of the French front-of-pack nutrition label. Ernähr. Umsch. 2017, 12, 158–165. [Google Scholar] [CrossRef]
- Wheal, M.S.; Fowles, T.O.; Palmer, L.T. A cost-effective acid digestion method using closed polypropylene tubes for inductively coupled plasma optical emission spectrometry (ICP-OES) analysis of plant essential elements. Anal. Methods. 2011, 3, 2854. [Google Scholar] [CrossRef]
- Hunt, J.R. Bioavailability of iron, zinc, and other trace minerals from vegetarian diets. Am. J. Clin. Nutr. 2003, 78, 633S–639S. [Google Scholar] [CrossRef]
- Klementova, M.; Thieme, L.; Haluzik, M.; Pavlovicova, R.; Hill, M.; Pelikanova, T.; Kahleova, H. A plant-based meal increases gastrointestinal hormones and satiety more than an energy- and macronutrient-matched processed-meat meal in T2D, obese, and healthy men: A three-group randomized crossover study. Nutrients 2019, 11, 157. [Google Scholar] [CrossRef] [Green Version]
- Smetana, S.; Profeta, A.; Voigt, R.; Kircher, C.; Heinz, V. Meat substitution in burgers: Nutritional scoring, sensorial testing, and life cycle assessment. Future Foods 2021, 4, 100042. [Google Scholar] [CrossRef]
- Afshin, A.; Sur, P.J.; Fay, K.A.; Cornaby, L.; Ferrara, G.; Salama, J.S.; Mullany, E.C.; Abate, K.H.; Abbafati, C.; Abebe, Z.; et al. Health effects of dietary risks in 195 countries, 1990–2017: A systematic analysis for the Global Burden of Disease Study 2017. Lancet 2019, 393, 1958–1972. [Google Scholar] [CrossRef] [Green Version]
- Fresán, U.; Sabaté, J. Vegetarian diets: Planetary health and its alignment with human health. Adv. Nutr. 2019, 10, S380–S388. [Google Scholar] [CrossRef] [PubMed] [Green Version]
- Anand, S.S.; Hawkes, C.; de Souza, R.J.; Mente, A.; Dehghan, M.; Nugent, R.; Zulyniak, M.A.; Weis, T.; Bernstein, A.M.; Krauss, R.M.; et al. Food consumption and its impact on cardiovascular disease: Importance of solutions focused on the globalized food system. J. Am. Coll. Cardiol. 2015, 66, 1590–1614. [Google Scholar] [CrossRef] [Green Version]
- Shang, X.; Scott, D.; Hodge, A.M.; English, D.R.; Giles, G.G.; Ebeling, P.R.; Sanders, K.M. Dietary protein intake and risk of type 2 diabetes: Results from the Melbourne Collaborative Cohort Study and a meta-analysis of prospective studies. Am. J. Clin. Nutr. 2016, 104, 1352–1365. [Google Scholar] [CrossRef] [PubMed]
- Song, M.; Fung, T.T.; Hu, F.B.; Willett, W.C.; Longo, V.D.; Chan, A.T.; Giovannucci, E.L. Association of animal and plant protein intake with all-cause and cause-specific mortality. JAMA Intern. Med. 2016, 176, 1453. [Google Scholar] [CrossRef] [PubMed]
- Bundesanstalt für Landwirtschaft und Ernährung (BLE). Bericht Zur Markt-Und Versorgungslage Mit Fleisch 2021; BLE: Bonn, Germany, 2021. [Google Scholar]
- Venti, C.A.; Johnston, C.S. Modified food guide pyramid for lactovegetarians and vegans. Am. Soc. Nutr. Sci. 2002, 132, 1050–1054. [Google Scholar] [CrossRef]
- Weder, S.; Schaefer, C.; Keller, M. The Gießener Vegan Food Pyramid. Ernähr. Umsch. 2018, 65, M422–M431. [Google Scholar] [CrossRef]
- Herforth, A.; Arimond, M.; Álvarez-Sánchez, C.; Coates, J.; Christianson, K.; Muehlhoff, E. A global review of food-based dietary guidelines. Adv. Nutr. 2019, 10, 590–605. [Google Scholar] [CrossRef] [Green Version]
- Helander, H.; Bruckner, M.; Leipold, S.; Petit-Boix, A.; Bringezu, S. Eating healthy or wasting less? Reducing resource footprints of food consumption. Environ. Res. Lett. 2021, 16, 054033. [Google Scholar] [CrossRef]
- Kemper, J.A.; White, S.K. Young adults’ experiences with flexitarianism: The 4Cs. Appetite 2021, 160, 105073. [Google Scholar] [CrossRef]
- Sundar, A.; Kardes, F.R. The role of perceived variability and the health halo effect in nutritional inference and consumption: Nutritional inference. Psychol. Mark. 2015, 32, 512–521. [Google Scholar] [CrossRef]
- Gehring, J.; Touvier, M.; Baudry, J.; Julia, C.; Buscail, C.; Srour, B.; Hercberg, S.; Péneau, S.; Kesse-Guyot, E.; Allès, B. Consumption of ultra-processed foods by pesco-vegetarians, vegetarians, and vegans: Associations with duration and age at diet initiation. J. Nutr. 2021, 151, 120–131. [Google Scholar] [CrossRef] [PubMed]
- Schnabel, L.; Kesse-Guyot, E.; Allès, B.; Touvier, M.; Srour, B.; Hercberg, S.; Buscail, C.; Julia, C. Association between ultraprocessed food consumption and risk of mortality among middle-aged adults in France. JAMA Intern. Med. 2019, 179, 4. [Google Scholar] [CrossRef] [PubMed]
- Weinrich, R. Opportunities for the adoption of health-based sustainable dietary patterns: A review on consumer research of meat substitutes. Sustainability 2019, 11, 4028. [Google Scholar] [CrossRef] [Green Version]
- Schösler, H.; de Boer, J.; Boersema, J.J. Can we cut out the meat of the dish? Constructing consumer-oriented pathways towards meat substitution. Appetite 2012, 58, 39–47. [Google Scholar] [CrossRef] [PubMed]
- Nath, J.; Prideaux, D. The civilised burger: Meat alternatives as a conversion aid and social instrument for Australian vegetarians and vegans. Aust. Humanit. Rev. 2011, 51, 135–151. [Google Scholar] [CrossRef]
- Elzerman, J.E.; van Boekel, M.A.J.S.; Luning, P.A. Exploring meat substitutes: Consumer experiences and contextual factors. Br. Food J. 2013, 115, 700–710. [Google Scholar] [CrossRef]
- Schusdziarra, V.; Hausmann, M.; Wiedemann, C.; Hess, J.; Barth, C.; Wagenpfeil, S.; Erdmann, J. Successful weight loss and maintenance in everyday clinical practice with an individually tailored change of eating habits on the basis of food energy density. Eur. J. Nutr. 2011, 50, 351–361. [Google Scholar] [CrossRef]
- Swinburn, B.A.; Sacks, G.; Hall, K.D.; McPherson, K.; Finegood, D.T.; Moodie, M.L.; Gortmaker, S.L. The global obesity pandemic: Shaped by global drivers and local environments. Lancet 2011, 378, 804–814. [Google Scholar] [CrossRef]
- Thomson, C.A.; Crane, T.E.; Garcia, D.O.; Wertheim, B.C.; Hingle, M.; Snetselaar, L.; Datta, M.; Rohan, T.; LeBlanc, E.; Chlebowski, R.T.; et al. Association between dietary energy density and obesity-associated cancer: Results from the Women’s Health Initiative. J. Acad. Nutr. Diet. 2018, 118, 617–626. [Google Scholar] [CrossRef]
- Lawrence, G.D. Dietary fats and health: Dietary recommendations in the context of scientific evidence. Adv. Nutr. 2013, 4, 294–302. [Google Scholar] [CrossRef] [PubMed] [Green Version]
- Jayawardena, R.; Swarnamali, H.; Lanerolle, P.; Ranasinghe, P. Effect of coconut oil on cardio-metabolic risk: A systematic review and meta-analysis of interventional studies. Diabetes Metab. Syndr. Clin. Res. Rev. 2020, 14, 2007–2020. [Google Scholar] [CrossRef] [PubMed]
- Rutherfurd, S.M.; Fanning, A.C.; Miller, B.J.; Moughan, P.J. Protein digestibility-corrected amino acid scores and digestible indispensable amino acid scores differentially describe protein quality in growing male rats. J. Nutr. 2015, 145, 372–379. [Google Scholar] [CrossRef] [PubMed] [Green Version]
- Berrazaga, I.; Micard, V.; Gueugneau, M.; Walrand, S. The role of the anabolic properties of plant- versus animal-based protein sources in supporting muscle mass maintenance: A critical review. Nutrients 2019, 11, 1825. [Google Scholar] [CrossRef] [Green Version]
- Davies, R.W.; Jakeman, P.M. Separating the wheat from the chaff: Nutritional value of plant proteins and their potential contribution to human health. Nutrients 2020, 12, 2410. [Google Scholar] [CrossRef]
- Nicholas, J.; Knowles, B.; Rayson, Z. Public Health England, Salt Reduction Targets for 2024. 2020. Available online: https://assets.publishing.service.gov.uk/government/uploads/system/uploads/attachment_data/file/915406/2024_salt_reduction_targets_070920-FINAL-1.pdf (accessed on 1 November 2021).
- Romero Ferreiro, C.; Lora Pablos, D.; Gómez de la Cámara, A. Two dimensions of nutritional value: Nutri-Score and NOVA. Nutrients 2021, 13, 2783. [Google Scholar] [CrossRef]
- Srour, B.; Fezeu, L.K.; Kesse-Guyot, E.; Allès, B.; Méjean, C.; Andrianasolo, R.M.; Chazelas, E.; Deschasaux, M.; Hercberg, S.; Galan, P.; et al. Ultra-processed food intake and risk of cardiovascular disease: Prospective cohort study (NutriNet-Santé). BMJ 2019, 365, 1451. [Google Scholar] [CrossRef] [PubMed] [Green Version]
- Adjibade, M.; Lemogne, C.; Julia, C.; Hercberg, S.; Galan, P.; Assmann, K.E.; Kesse-Guyot, E. Prospective association between adherence to dietary recommendations and incident depressive symptoms in the French NutriNet-Santé cohort. Br. J. Nutr. 2018, 120, 290–300. [Google Scholar] [CrossRef] [Green Version]
- Schnabel, L.; Buscail, C.; Sabate, J.-M.; Bouchoucha, M.; Kesse-Guyot, E.; Allès, B.; Touvier, M.; Monteiro, C.A.; Hercberg, S.; Benamouzig, R.; et al. Association between ultra-processed food consumption and functional gastrointestinal disorders: Results from the French NutriNet-Santé cohort. Am. J. Gastroenterol. 2018, 113, 1217–1228. [Google Scholar] [CrossRef]
- Harnack, L.; Mork, S.; Valluri, S.; Weber, C.; Schmitz, K.; Stevenson, J.; Pettit, J. Nutrient composition of a selection of plant-based ground beef alternative products available in the United States. J. Acad. Nutr. Diet. 2021, 121, 2401–2408. [Google Scholar] [CrossRef]
- Hurrell, R.; Egli, I. Iron bioavailability and dietary reference values. Am. J. Clin. Nutr. 2010, 91, 1461S–1467S. [Google Scholar] [CrossRef] [PubMed]
- Foster, M.; Samman, S. Vegetarian diets across the lifecycle: Impact on zinc intake and status. Adv. Food Nutr. Res. 2015, 74, 93–131. [Google Scholar] [CrossRef] [PubMed]
- The German Nutrition Society (DGE). Ausgewählte Fragen und Antworten zu Calcium. Stand 2013. Available online: https://www.dge.de/wissenschaft/weitere-publikationen/faqs/calcium/ (accessed on 1 November 2021).
- Siebert, A.-K.; Obeid, R.; Weder, S.; Awwad, H.M.; Sputtek, A.; Geisel, J.; Keller, M. Vitamin B-12–fortified toothpaste improves vitamin status in vegans: A 12-wk randomized placebo-controlled study. Am. J. Clin. Nutr. 2017, 105, 618–625. [Google Scholar] [CrossRef] [PubMed] [Green Version]
- Damayanti, D.; Jaceldo-Siegl, K.; Beeson, W.; Fraser, G.; Oda, K.; Haddad, E. Foods and supplements associated with vitamin B12 biomarkers among vegetarian and non-vegetarian participants of the Adventist Health Study-2 (AHS-2) Calibration Study. Nutrients 2018, 10, 722. [Google Scholar] [CrossRef] [PubMed] [Green Version]

| Category | Description | |
|---|---|---|
| PBMA-hot | Fillet | Either contains “tenderloin” in the product name or is a meat-free product that appears to imitate beef/pork tenderloin |
| Steak | Either contains “steak” in the product name or is a meat-free product that appears to imitate beef/pork steak | |
| Schnitzel | Either contains “schnitzel” in the product name or is a meat-free product that appears to imitate breaded meat | |
| Burger | Either contains “burger” and/or “pattie/patty” in the product name or is a meat-free product that appears to imitate beef burger | |
| Strips | Either contains “gyros”, “chunks”, and/or “strips” in the product name or is a meat-free product that appears as small thin slices or strips | |
| Minced meat | Either contains “mince” in the product name or is a meat-free product that appears to imitate minced meat | |
| Bratwurst | Either contains “bratwurst” or “barbecue sausage” in the product name or is a meat-free product that appears to imitate bratwurst | |
| Sausage | Either contains “Wiener”, “Frankfurter”, and/or “Hot Dog” in the product name or is a meat-free product that appears to imitate sausage | |
| PBMA-cold | Meat sausage | Either contains “Lyoner”, “Mortadella”, and/or “cold cuts” in the product name or is a meat-free product that appears to imitate meat sausage, which can be used in sandwiches |
| Salami | Either contains “salami” in the product name or is a meat-free product that appears to imitate salami, which can be used in sandwiches | |
| Spreading sausage | Either contains “liver sausage” and/or “pâté” in the product name or is a meat-free product that appears to imitate spreading sausage, which can be used in sandwiches | |
| Meat salad | Meat-free product that appears to imitate meat salad, which can be used in sandwiches | |
| PBCA | Sliced cheese | Either contains “Gouda” in the product name or is a dairy-free product that appears to imitate sliced cheese, which can be used in sandwiches |
| Cheddar | Either contains “Cheddar” in the product name or is a dairy-free product that appears to imitate cheddar, which can be used in sandwiches | |
| Cream cheese | Either contains “fresh” and/or “cream” in the product name or is a dairy-free product that appears to imitate cream cheese, which can be used in sandwiches | |
| Mozzarella | Either contains “mozzarella” in the product name or is a dairy-free product that appears to imitate mozzarella, which can be used in sandwiches | |
| Feta | Either contains “Greek style” in the product name or is a dairy-free product that appears to imitate brined cheese or feta, which can be used in sandwiches | |
| Category | Product Name (German Name) | Manufacturer or Distributor | ||
|---|---|---|---|---|
| PBMA-cold | Meat sausage | Vegan cold cuts | (Veganer Aufschnitt Lyoner Art) | Heirler |
| Vegan cold cuts | (Vegan Aufschnitt Natur) | Veganz | ||
| Vegan cold cuts | (Veganer Aufschnitt auf Basis von Pflanzenprotein nach Lyoner Art) | EDEKA | ||
| Vegetarian cold cuts | (Vegetarischer Schinken Spicker Mortadella) | Rügenwalder | ||
| Salami | Vegan salami | (Veganer Aufschnitt Salami Art) | Heirler | |
| Vegan salami | (Aufschnitt Rustikal nach Salami Art) | Hobelz | ||
| Vegan salami | (Veganer Aufschnitt nach Art Salami) | EDEKA | ||
| Vegetarian salami | (Vegetarische Mühlen Salami Klassisch) | Rügenwalder | ||
| PBMA-hot | Burger | Vegetarian burger patty | (Classic Burgers) (frozen) | Quorn |
| Vegan burger patty | (Incredible Burger) (chilled) | Garden Gourmet | ||
| Vegan burger patty | (Next Level Burger) (chilled) | Lidl | ||
| Vegan burger patty | (Beyond Burger) (frozen) | Beyond Meat | ||
| PBCA | Sliced cheese | Vegan cheese | (Original Geschmack Scheiben) | Violife |
| Vegan cheese | (Scheiben Classic) | Bedda | ||
| Vegan cheese | (Natur Genießerscheiben) | SimplyV | ||
| Vegan cheese | (Mr. Berta Schmelz Scheiben) | Soyatoo! | ||
| Category | Pb Products (n) | Increase from 2019 to 2021 (%) | |||||
|---|---|---|---|---|---|---|---|
| 2019 | 2021 | ||||||
| Total | Organic | Total | Organic | Total | Organic | ||
| PBMA-hot | Fillet | 6 | 4 | 6 | 4 | 0 | 0 |
| Steak | 10 | 8 | 13 | 8 | 30 | 0 | |
| Schnitzel | 16 | 6 | 18 | 2 | 13 | −67 | |
| Burger | 34 | 17 | 52 | 14 | 53 | −18 | |
| Strips | 23 | 13 | 35 | 16 | 52 | 23 | |
| Minced | 12 | 4 | 29 | 4 | 142 | 0 | |
| Bratwurst | 31 | 13 | 51 | 19 | 65 | 46 | |
| Sausage | 18 | 7 | 32 | 13 | 78 | 86 | |
| Total | 150 | 72 | 236 | 80 | 57 | 11 | |
| PBMA-cold | Meat sausage | 18 | 5 | 57 | 18 | 217 | 260 |
| Salami | 13 | 6 | 20 | 8 | 54 | 33 | |
| Spreading sausage | 12 | 6 | 18 | 7 | 50 | 17 | |
| Meat salad | 5 | 1 | 6 | 2 | 20 | 100 | |
| Total | 48 | 18 | 101 | 35 | 110 | 94 | |
| PBCA | Sliced cheese | 17 | 4 | 43 | 4 | 153 | 0 |
| Cheddar | 15 | 1 | 13 | 1 | −13 | 0 | |
| Cream cheese | 13 | 5 | 38 | 18 | 192 | 260 | |
| Mozzarella | 8 | 3 | 13 | 6 | 63 | 100 | |
| Feta | 12 | 3 | 16 | 7 | 33 | 133 | |
| Total | 65 | 15 | 123 | 36 | 89 | 140 | |
| Nutrient Criteria | Pb Fillet 2019 (n = 6) | Pb Fillet 2021 (n = 6) | Meat Fillet (n = 15) | Pb Steak 2019 (n = 10) | Pb Steak 2021 (n = 13) | Meat Steak (n = 73) | Pb Schnitzel 2019 (n = 16) | Pb Schnitzel 2021 (n = 18) | Meat Schnitzel (n = 19) | |||||||||||||||||||||||||||
| Energy (kcal) | 152.5 | ± | 75.6 | 146.5 | ± | 63.5 | 141.6 | ± | 32.6 | 188.0 | ± | 54.9 | 206.6 | ± | 54.2 | 182.4 | ± | 131.3 | 244.4 | ± | 38.8 | 240.7 | ± | 41.4 | 224.3 | ± | 42.9 | |||||||||
| Fat (g) | 5.58 | ± | 3.89 | 5.05 | ± | 3.81 | 5.74 | ± | 3.47 | 7.52 | ± | 4.79 | 9.13 | ± | 4.30 | 10.69 | ± | 16.36 | 11.98 | ± | 3.53 | 11.76 | ± | 3.95 | 10.88 | ± | 4.85 | |||||||||
| Saturated fat (g) | 0.92 | ± | 0.78 | 0.92 | ± | 0.79 | 2.14 | ± | 1.21 | 1.76 | ± | 2.28 | 2.75 | ± | 2.81 | 4.09 | ± | 6.34 | 1.78 | ± | 1.67 | a | 1.34 | ± | 0.58 | a | 3.62 | ± | 1.62 | b | ||||||
| Carbohydrate (g) | 5.67 | ± | 3.50 | b | 5.22 | ± | 2.55 | b | 0.00 | ± | 0.00 | a | 8.14 | ± | 5.98 | b | 8.17 | ± | 5.53 | b | 0.01 | ± | 0.05 | a | 15.48 | ± | 4.48 | b | 16.88 | ± | 4.78 | b | 9.13 | ± | 5.08 | a |
| Sugars (g) | 0.77 | ± | 0.75 | b | 0.88 | ± | 0.57 | b | 0.00 | ± | 0.00 | a | 1.38 | ± | 0.86 | b | 2.28 | ± | 1.81 | c | 0.00 | ± | 0.00 | a | 1.65 | ± | 0.79 | b | 1.63 | ± | 1.29 | b | 0.44 | ± | 0.32 | a |
| Protein (g) | 17.52 | ± | 9.96 | 18.00 | ± | 8.15 | 22.36 | ± | 2.02 | 20.46 | ± | 6.90 | 20.95 | ± | 6.58 | 21.61 | ± | 4.23 | 16.69 | ± | 4.58 | a | 14.68 | ± | 3.75 | a | 22.22 | ± | 2.41 | b | ||||||
| Salt (g) | 1.19 | ± | 0.45 | b | 1.22 | ± | 0.52 | b | 0.22 | ± | 0.24 | a | 1.57 | ± | 0.51 | b | 1.82 | ± | 0.35 | b | 0.21 | ± | 0.31 | a | 1.71 | ± | 0.43 | b | 1.55 | ± | 0.30 | b | 0.46 | ± | 0.27 | a |
| Nutri-Score | −2.17 | ± | 7.49 | −1.17 | ± | 9.02 | 4.33 | ± | 7.18 | 3.90 | ± | 6.84 | 8.85 | ± | 7.07 | 5.37 | ± | 7.38 | 4.88 | ± | 7.02 | a | 3.50 | ± | 5.31 | a | 10.47 | ± | 7.00 | b | ||||||
| Nutrient Criteria | Pb Burger 2019 (n = 34) | Pb Burger 2021 (n = 52) | Meat Burger (n = 26) | Pb Strips 2019 (n = 23) | Pb Strips 2021 (n = 35) | Meat Strips (n = 21) | Pb Minced 2019 (n = 12) | Pb Minced 2021 (n = 29) | Meat Minced (n = 21) | |||||||||||||||||||||||||||
| Energy (kcal) | 223.0 | ± | 55.1 | ab | 203.5 | ± | 42.5 | a | 236.2 | ± | 32.7 | b | 163.3 | ± | 68.1 | 195.2 | ± | 52.3 | 205.8 | ± | 121.1 | 173.4 | ± | 56.9 | 177.6 | ± | 41.2 | 199.4 | ± | 45.6 | ||||||
| Fat (g) | 9.90 | ± | 5.13 | a | 11.32 | ± | 4.25 | a | 14.32 | ± | 3.75 | b | 6.87 | ± | 5.45 | a | 9.33 | ± | 4.38 | ab | 13.40 | ± | 13.42 | b | 6.44 | ± | 4.84 | a | 8.59 | ± | 4.36 | a | 12.00 | ± | 4.47 | b |
| Saturated fat (g) | 2.09 | ± | 2.38 | a | 3.40 | ± | 3.65 | a | 5.51 | ± | 1.28 | b | 1.27 | ± | 1.09 | a | 1.78 | ± | 1.63 | a | 4.79 | ± | 5.76 | b | 0.98 | ± | 1.00 | a | 3.26 | ± | 3.70 | b | 4.92 | ± | 1.75 | b |
| Carbohydrate (g) | 11.42 | ± | 7.23 | 8.94 | ± | 5.83 | 7.72 | ± | 8.22 | 4.34 | ± | 2.84 | ab | 4.91 | ± | 2.28 | b | 2.56 | ± | 3.96 | a | 6.19 | ± | 4.28 | b | 7.76 | ± | 6.84 | b | 1.43 | ± | 2.61 | a | |||
| Sugars (g) | 2.07 | ± | 1.54 | 1.60 | ± | 1.54 | 1.32 | ± | 1.50 | 1.10 | ± | 1.05 | 1.40 | ± | 1.22 | 0.91 | ± | 1.51 | 1.34 | ± | 0.96 | b | 1.24 | ± | 1.28 | b | 0.23 | ± | 0.42 | a | ||||||
| Protein (g) | 17.23 | ± | 8.06 | ab | 15.28 | ± | 5.34 | a | 18.82 | ± | 4.03 | b | 19.77 | ± | 7.99 | 21.33 | ± | 6.01 | 18.43 | ± | 7.21 | 21.18 | ± | 7.88 | b | 16.73 | ± | 4.37 | a | 21.24 | ± | 2.91 | b | |||
| Salt (g) | 1.48 | ± | 0.61 | b | 1.44 | ± | 0.41 | b | 1.01 | ± | 0.49 | a | 1.16 | ± | 0.61 | ab | 1.47 | ± | 0.75 | b | 0.85 | ± | 1.20 | a | 1.25 | ± | 0.63 | b | 1.26 | ± | 0.55 | b | 0.40 | ± | 0.39 | a |
| Nutri-Score | 4.50 | ± | 5.70 | a | 5.27 | ± | 6.75 | a | 13.54 | ± | 6.37 | b | 0.61 | ± | 6.95 | a | 3.23 | ± | 7.82 | a | 8.86 | ± | 8.96 | b | −0.50 | ± | 6.30 | a | 3.03 | ± | 7.10 | a | 8.10 | ± | 5.76 | b |
| Nutrient Criteria | Pb Bratwurst 2019 (n = 31) | Pb Bratwurst 2021 (n = 51) | Meat Bratwurst (n = 28) | Pb Sausage 2019 (n = 18) | Pb Sausage 2021 (n = 32) | Meat Sausage (n = 26) | ||||||||||||||||||||||||||||||
| Energy (kcal) | 224.7 | ± | 44.1 | a | 218.6 | ± | 45.0 | a | 267.6 | ± | 41.0 | b | 229.1 | ± | 45.4 | a | 224.8 | ± | 34.8 | a | 264.0 | ± | 67.2 | b | ||||||||||||
| Fat (g) | 13.43 | ± | 5.58 | a | 13.62 | ± | 4.80 | a | 22.14 | ± | 5.00 | b | 15.98 | ± | 4.93 | a | 13.97 | ± | 3.44 | a | 21.95 | ± | 7.94 | b | ||||||||||||
| Saturated fat (g) | 2.66 | ± | 2.23 | a | 3.05 | ± | 2.87 | a | 8.84 | ± | 1.85 | b | 1.57 | ± | 0.77 | a | 2.39 | ± | 2.85 | a | 8.47 | ± | 2.97 | b | ||||||||||||
| Carbohydrate (g) | 5.41 | ± | 2.94 | b | 6.00 | ± | 2.87 | b | 2.16 | ± | 2.40 | a | 5.10 | ± | 2.53 | b | 5.32 | ± | 2.28 | b | 2.47 | ± | 2.55 | a | ||||||||||||
| Sugars (g) | 1.46 | ± | 1.42 | b | 1.42 | ± | 1.22 | b | 0.53 | ± | 0.36 | a | 1.04 | ± | 0.68 | b | 1.40 | ± | 0.90 | b | 0.52 | ± | 0.62 | a | ||||||||||||
| Protein (g) | 19.80 | ± | 6.26 | b | 17.12 | ± | 6.68 | ab | 15.08 | ± | 1.56 | a | 15.07 | ± | 6.96 | ab | 18.91 | ± | 7.50 | b | 13.24 | ± | 2.12 | a | ||||||||||||
| Salt (g) | 1.76 | ± | 0.40 | a | 1.66 | ± | 0.36 | a | 1.98 | ± | 0.37 | b | 1.75 | ± | 0.66 | 1.77 | ± | 0.85 | 1.76 | ± | 0.40 | |||||||||||||||
| Nutri-Score | 8.06 | ± | 5.13 | a | 7.45 | ± | 5.68 | a | 23.21 | ± | 4.08 | b | 7.67 | ± | 5.19 | a | 7.94 | ± | 4.72 | a | 20.04 | ± | 3.77 | b | ||||||||||||
| Nutrient Criteria | Pb Meat Sausage 2019 (n = 18) | Pb Meat Sausage 2021 (n = 57) | Meat Sausage (n = 37) | Pb Salami 2019 (n = 13) | Pb Salami 2021 (n = 20) | Meat Salami (n = 23) | Pb Spreading Sausage 2019 (n = 12) | Pb Spreading Sausage 2021 (n = 18) | Meat Spreading Sausage (n = 16) | |||||||||||||||||||||||||||
| Energy (kcal) | 185.4 | ± | 49.1 | 198.1 | ± | 45.6 | 215.6 | ± | 84.4 | 210.3 | ± | 37.7 | a | 218.3 | ± | 46.9 | a | 364.4 | ± | 75.0 | b | 280.7 | ± | 53.5 | 276.3 | ± | 43.0 | 293.1 | ± | 72.5 | ||||||
| Fat (g) | 10.82 | ± | 5.20 | a | 12.05 | ± | 4.29 | a | 16.04 | ± | 9.48 | b | 10.06 | ± | 3.03 | a | 11.83 | ± | 4.92 | a | 30.54 | ± | 8.65 | b | 24.68 | ± | 7.18 | 23.32 | ± | 5.27 | 24.40 | ± | 9.87 | |||
| Saturated fat (g) | 2.45 | ± | 2.91 | a | 1.92 | ± | 1.57 | a | 6.00 | ± | 3.57 | b | 1.67 | ± | 1.31 | a | 2.21 | ± | 2.08 | a | 11.23 | ± | 3.11 | b | 11.86 | ± | 9.10 | 9.08 | ± | 8.24 | 9.53 | ± | 4.01 | |||
| Carbohydrate (g) | 4.95 | ± | 3.48 | b | 5.21 | ± | 3.32 | b | 2.96 | ± | 2.89 | a | 6.53 | ± | 2.83 | b | 5.86 | ± | 2.12 | b | 0.97 | ± | 0.94 | a | 6.69 | ± | 3.94 | 8.11 | ± | 4.44 | 3.87 | ± | 6.57 | |||
| Sugars (g) | 1.85 | ± | 1.26 | b | 1.73 | ± | 0.94 | b | 1.73 | ± | 0.94 | a | 1.88 | ± | 0.99 | b | 2.07 | ± | 1.20 | b | 0.52 | ± | 0.42 | a | 1.91 | ± | 1.55 | b | 1.81 | ± | 0.85 | b | 0.68 | ± | 0.54 | a |
| Protein (g) | 16.19 | ± | 9.44 | 16.34 | ± | 8.94 | 14.51 | ± | 5.43 | 21.94 | ± | 9.23 | 20.44 | ± | 10.57 | 21.50 | ± | 2.56 | 6.82 | ± | 2.87 | a | 6.61 | ± | 3.64 | a | 14.69 | ± | 3.87 | b | ||||||
| Salt (g) | 1.76 | ± | 0.81 | 1.96 | ± | 0.75 | 2.23 | ± | 0.98 | 2.17 | ± | 0.74 | a | 2.25 | ± | 0.60 | a | 3.47 | ± | 0.70 | b | 1.70 | ± | 0.34 | 1.80 | ± | 0.31 | 1.71 | ± | 0.78 | ||||||
| Nutri-Score | 7.50 | ± | 8.78 | a | 8.35 | ± | 6.12 | a | 19.51 | ± | 5.02 | b | 8.85 | ± | 5.46 | a | 10.45 | ± | 3.62 | a | 25.91 | ± | 2.98 | b | 14.92 | ± | 7.2 | a | 13.56 | ± | 7.34 | a | 20.50 | ± | 2.85 | b |
| Nutrient Criteria | Pb Meat Salad 2019 (n = 5) | Pb Meat Salad 2021 (n = 6) | Meat Salad (n = 11) | |||||||||||||||||||||||||||||||||
| Energy (kcal) | 262.0 | ± | 27.1 | 274.2 | ± | 28.8 | 237.5 | ± | 77.5 | |||||||||||||||||||||||||||
| Fat (g) | 24.08 | ± | 3.71 | 24.92 | ± | 4.11 | 20.38 | ± | 9.44 | |||||||||||||||||||||||||||
| Saturated fat (g) | 2.28 | ± | 0.65 | 5.10 | ± | 6.34 | 6.30 | ± | 3.09 | |||||||||||||||||||||||||||
| Carbohydrate (g) | 5.78 | ± | 1.36 | 5.52 | ± | 0.79 | 3.14 | ± | 3.22 | |||||||||||||||||||||||||||
| Sugars (g) | 4.66 | ± | 1.10 | b | 4.70 | ± | 0.92 | b | 0.76 | ± | 0.64 | a | ||||||||||||||||||||||||
| Protein (g) | 4.56 | ± | 3.33 | a | 6.22 | ± | 3.57 | ab | 10.53 | ± | 4.22 | b | ||||||||||||||||||||||||
| Salt (g) | 1.53 | ± | 0.46 | 1.26 | ± | 0.41 | 1.74 | ± | 0.80 | |||||||||||||||||||||||||||
| Nutri-Score | 10.00 | ± | 3.67 | 10.7 | ± | 6.02 | 15.55 | ± | 5.89 | |||||||||||||||||||||||||||
| Nutrient Criteria | Pb Sliced Cheese 2019 (n = 17) | Pb Sliced Cheese 2021 (n = 43) | Sliced Cheese (n = 53) | Pb Cheddar 2019 (n = 15) | Pb Cheddar 2021 (n = 13) | Cheddar (n = 25) | Pb Cream Cheese 2019 (n = 13) | Pb Cream Cheese 2021 (n = 38) | Cream Cheese (n = 32) | |||||||||||||||||||||||||||
| Energy (kcal) | 286.2 | ± | 47.2 | a | 283.3 | ± | 13.7 | a | 339.4 | ± | 56.8 | b | 279.5 | ± | 52.5 | a | 288.2 | ± | 21.5 | ab | 329.2 | ± | 72.9 | b | 268.5 | ± | 46.7 | 267.7 | ± | 38.4 | 256.5 | ± | 73.6 | |||
| Fat (g) | 22.14 | ± | 4.60 | a | 21.62 | ± | 1.76 | a | 26.35 | ± | 6.51 | b | 20.93 | ± | 4.50 | 21.92 | ± | 2.65 | 24.49 | ± | 9.13 | 24.72 | ± | 5.62 | 24.78 | ± | 3.63 | 22.79 | ± | 9.24 | ||||||
| Saturated fat (g) | 16.27 | ± | 4.67 | 18.14 | ± | 3.04 | 16.77 | ± | 4.24 | 15.32 | ± | 5.69 | 18.05 | ± | 3.63 | 15.73 | ± | 5.71 | 15.94 | ± | 8.73 | 14.97 | ± | 8.20 | 14.45 | ± | 5.96 | |||||||||
| Carbohydrate (g) | 19.58 | ± | 4.88 | ab | 21.09 | ± | 2.06 | b | 0.78 | ± | 1.22 | a | 20.19 | ± | 4.86 | b | 20.85 | ± | 2.40 | b | 1.83 | ± | 2.02 | a | 4.45 | ± | 2.89 | 5.02 | ± | 3.25 | 3.95 | ± | 3.10 | |||
| Sugars (g) | 1.34 | ± | 4.50 | 0.30 | ± | 0.43 | 0.56 | ± | 1.05 | 1.63 | ± | 5.00 | 0.07 | ± | 0.12 | 1.44 | ± | 2.00 | 0.80 | ± | 0.50 | a | 1.18 | ± | 1.03 | a | 3.59 | ± | 2.62 | b | ||||||
| Protein (g) | 1.98 | ± | 4.09 | a | 0.86 | ± | 1.83 | a | 24.56 | ± | 3.42 | b | 1.59 | ± | 2.84 | a | 1.42 | ± | 2.95 | a | 24.81 | ± | 3.41 | b | 4.67 | ± | 3.64 | a | 5.72 | ± | 3.82 | a | 9.13 | ± | 3.33 | b |
| Salt (g) | 1.70 | ± | 0.50 | a | 2.02 | ± | 0.26 | b | 1.70 | ± | 0.53 | a | 2.06 | ± | 0.61 | 2.10 | ± | 0.36 | 2.04 | ± | 1.05 | 0.80 | ± | 0.38 | 1.08 | ± | 0.37 | 1.06 | ± | 0.67 | ||||||
| Nutri-Score | 19.06 | ± | 4.10 | b | 21.07 | ± | 1.96 | c | 15.17 | ± | 3.00 | a | 20.13 | ± | 4.27 | b | 20.38 | ± | 2.90 | b | 14.96 | ± | 3.21 | a | 11.62 | ± | 5.28 | ab | 14.13 | ± | 3.81 | b | 11.19 | ± | 3.36 | a |
| Nutrient Criteria | Pb Feta 2019 (n = 8) | Pb Feta 2021 (n = 13) | Feta (n = 16) | Pb Mozzarella 2019 (n = 12) | Pb Mozzarella 2021 (n = 16) | Mozzarella (n = 15) | ||||||||||||||||||||||||||||||
| Energy (kcal) | 276.4 | ± | 84.3 | 285.5 | ± | 91.5 | 243.6 | ± | 58.7 | 269.2 | ± | 70.4 | 249.0 | ± | 50.2 | 264.3 | ± | 43.2 | ||||||||||||||||||
| Fat (g) | 21.85 | ± | 7.66 | 24.65 | ± | 10.04 | 18.73 | ± | 7.05 | 21.11 | ± | 5.85 | 20.50 | ± | 4.13 | 19.24 | ± | 3.92 | ||||||||||||||||||
| Saturated fat (g) | 14.00 | ± | 8.71 | 16.65 | ± | 8.64 | 11.74 | ± | 4.30 | 14.90 | ± | 5.62 | 14.92 | ± | 6.30 | 12.13 | ± | 2.54 | ||||||||||||||||||
| Carbohydrate (g) | 12.70 | ± | 10.34 | b | 9.95 | ± | 5.74 | b | 1.75 | ± | 1.38 | a | 14.56 | ± | 7.09 | b | 13.74 | ± | 6.58 | b | 2.31 | ± | 2.10 | a | ||||||||||||
| Sugars (g) | 0.75 | ± | 1.09 | 0.77 | ± | 1.18 | 1.65 | ± | 1.43 | 0.31 | ± | 0.65 | 0.63 | ± | 1.02 | 1.03 | ± | 0.92 | ||||||||||||||||||
| Protein (g) | 6.84 | ± | 6.96 | a | 5.64 | ± | 5.49 | a | 16.65 | ± | 2.79 | b | 2.87 | ± | 3.14 | a | 1.99 | ± | 2.30 | a | 20.08 | ± | 5.85 | b | ||||||||||||
| Salt (g) | 1.89 | ± | 0.65 | a | 1.93 | ± | 0.52 | a | 2.50 | ± | 0.47 | b | 1.94 | ± | 1.12 | b | 1.56 | ± | 0.50 | ab | 0.96 | ± | 0.58 | a | ||||||||||||
| Nutri-Score | 16.88 | ± | 6.20 | 18.69 | ± | 5.04 | 15.44 | ± | 3.08 | 18.42 | ± | 5.73 | b | 17.25 | ± | 6.11 | b | 11.47 | ± | 2.59 | a | |||||||||||||||
| Cheese (n = 53) | Pb Cheese (n = 4) | Meat Burger (n = 26) | Pb Burger (n = 4) | Meat Salami (n = 23) | Pb Salami (n = 4) | Meat Sausage (n = 37) | Pb Sausage (n = 4) | ||||||||||||||||
|---|---|---|---|---|---|---|---|---|---|---|---|---|---|---|---|---|---|---|---|---|---|---|---|
| Mean (%) | Mean (%) | Mean (%) | Mean (%) | ||||||||||||||||||||
| D-A-CH reference values—female | AG1 1 | AG1+ 2 | AG2 3 | AG1 | AG2 | AG1 | AG1+ | AG2 | AG1 | AG2 | AG1 | AG1+ | AG2 | AG1 | AG2 | AG1 | AG1+ | AG2 | AG1 | AG2 | AG1 | AG1+ | AG2 |
| Calcium | 1000 | 76.17 | 31.93 | 3.18 | 25.14 | 1.49 | 23.35 | 2.07 | 20.71 | ||||||||||||||
| Copper | 1.25 | 3.02 | 85.94 | 7.46 | 85.43 | 6.16 | 75.63 | 8.96 | 72.35 | ||||||||||||||
| Iron | 15 | 27 | 10 | 2.08 | 3.13 | 19.53 | 10.85 | 29.29 | 12.98 | 19.46 | 29.13 | 16.18 | 43.70 | 5.65 | 8.48 | 25.82 | 14.35 | 38.73 | 11.99 | 17.98 | 42.28 | 23.49 | 63.42 |
| Potassium | 4000 | 2.31 | 1.41 | 7.87 | 11.11 | 6.05 | 9.81 | 8.03 | 8.13 | ||||||||||||||
| Magnesium | 310 | 300 | 9.21 | 9.51 | 14.51 | 14.99 | 8.48 | 8.76 | 26.48 | 27.36 | 5.51 | 5.70 | 30.73 | 31.75 | 8.29 | 8.56 | 29.24 | 30.21 | |||||
| Sodium | 1500 | 46.08 | 65.34 | 26.20 | 47.80 | 61.03 | 92.12 | 98.57 | 144.52 | ||||||||||||||
| Zinc | 8 | 12 | 43.70 | 20.49 | 13.66 | 41.95 | 49.30 | 32.87 | 18.61 | 40.40 | 26.94 | 38.59 | 34.81 | 23.21 | |||||||||
| Phosphorus | 700 | 71.38 | 15.77 | 23.76 | 42.14 | 22.75 | 40.02 | 27.82 | 38.52 | ||||||||||||||
| D-A-CH reference values—male | AG1 1 | AG1+ 2 | AG2 3 | AG1 | AG2 | AG1 | AG1+ | AG2 | AG1 | AG2 | AG1 | AG1+ | AG2 | AG1 | AG2 | AG1 | AG1+ | AG2 | AG1 | AG2 | AG1 | AG1+ | AG2 |
| Iron | 10 | 18 | 3.13 | 29.29 | 16.27 | 19.46 | 43.70 | 24.28 | 8.48 | 38.73 | 21.52 | 17.98 | 63.42 | 35.23 | |||||||||
| Magnesium | 400 | 350 | 7.13 | 8.15 | 11.24 | 12.85 | 6.57 | 7.51 | 20.52 | 23.45 | 4.27 | 4.88 | 23.82 | 27.22 | 6.42 | 7.34 | 22.66 | 25.90 | |||||
| Zinc | 14 | 21 | 24.97 | 11.71 | 7.80 | 23.97 | 28.17 | 18.78 | 10.63 | 23.09 | 15.39 | 22.05 | 19.89 | 13.26 | |||||||||
| Cheese (n = 53) | Pb Cheese (n = 4) | Meat Burger (n = 26) | Pb Burger (n = 4) | Meat Salami (n = 23) | Pb Salami (n = 4) | Meat Sausage (n = 37) | Pb Sausage (n = 4) | |||||||||||
|---|---|---|---|---|---|---|---|---|---|---|---|---|---|---|---|---|---|---|
| Mean (%) | Mean (%) | Mean (%) | Mean (%) | |||||||||||||||
| D-A-CH reference values—female | AG1 1 | AG2 2 | AG1 | AG2 | AG1 | AG2 | AG1 | AG2 | AG1 | AG2 | AG1 | AG2 | AG1 | AG2 | AG1 | AG2 | AG1 | AG2 |
| Vitamin B1 | 1 | 3.00 | 1.62 | 16.46 | 5.22 | 40.24 | 11.87 | 32.96 | 6.90 | |||||||||
| Vitamin B2 | 1.1 | 1 | 32.44 | 35.69 | 7.66 | 8.43 | 15.61 | 17.17 | 18.86 | 20.74 | 18.94 | 20.84 | 21.42 | 23.56 | 14.56 | 16.02 | 24.70 | 27.17 |
| Vitamin B3 | 13 | 11 | 1.73 | 2.05 | 1.35 | 1.60 | 40.24 | 47.56 | 14.88 | 17.59 | 46.10 | 54.48 | 12.07 | 14.27 | 37.50 | 44.32 | 7.96 | 9.40 |
| Pantothenic acid | 6 | 7.33 | 1.45 | 6.25 | 6.47 | 6.67 | 5.22 | 6.00 | 3.96 | |||||||||
| Vitamin B6 | 1.4 | 4.57 | 5.74 | 17.49 | 38.37 | 30.06 | 34.47 | 21.31 | 20.51 | |||||||||
| Folate # | 300 | 8.48 | 5.04 | 6.10 | 19.67 | 0.91 | 16.74 | 1.73 | 14.98 | |||||||||
| Biotin ## | 40 | 4.90 | 4.17 | 10.06 | 41.47 | 3.80 | 57.11 | 3.85 | 39.86 | |||||||||
| Vitamin B12 ## | 4 | 41.01 | 65.55 | 42.25 | 4.38 | 40.45 | 4.99 | 18.96 | 2.63 | |||||||||
| Vitamin C | 95 | 0.16 | 95.09 | 0.69 | 17.91 | 2.16 | nr | 3.83 | 2.21 | |||||||||
| Vitamin A # | 700 | 31.79 | 0.05 | 2.53 | 0.11 | 1.09 | 0.06 | 0.94 | nr | |||||||||
| Vitamin D ## | 20 | 1.81 | nr | 1.43 | nr | 2.21 | nr | 1.46 | nr | |||||||||
| Vitamin E | 12 | 11 | 3.42 | 3.73 | 4.92 | 5.37 | 3.64 | 3.73 | 16.50 | 5.37 | 4.02 | 4.38 | 49.63 | 54.14 | 2.90 | 3.16 | 61.91 | 67.54 |
| Vitamin K ## | 60 | 65 | 9.67 | 8.93 | 5.79 | 5.34 | 9.15 | 8.93 | 24.92 | 5.34 | 6.94 | 6.41 | 32.88 | 30.35 | 7.68 | 7.09 | 38.93 | 35.94 |
| D-A-CH reference values—male | AG1 1 | AG2 2 | AG1 | AG2 | AG1 | AG2 | AG1 | AG2 | AG1 | AG2 | AG1 | AG2 | AG1 | AG2 | AG1 | AG2 | AG1 | AG2 |
| Vitamin B1 | 1.3 | 1.1 | 2.31 | 2.72 | 1.24 | 1.68 | 12.66 | 14.97 | 4.02 | 2.91 | 30.95 | 36.58 | 9.13 | 10.80 | 25.35 | 29.96 | 5.31 | 6.28 |
| Vitamin B2 | 1.4 | 1.3 | 25.49 | 27.45 | 6.02 | 9.62 | 12.26 | 13.21 | 14.82 | 9.45 | 14.88 | 16.03 | 16.83 | 18.12 | 11.44 | 12.32 | 19.40 | 20.90 |
| Vitamin B3 | 16 | 14 | 1.41 | 1.61 | 1.10 | 2.83 | 32.70 | 37.37 | 12.09 | 15.56 | 37.46 | 42.81 | 9.81 | 11.21 | 30.47 | 34.82 | 6.46 | 7.39 |
| Vitamin B6 | 1.6 | 4.00 | 5.03 | 15.30 | 33.57 | 26.30 | 30.17 | 18.64 | 17.95 | |||||||||
| Vitamin C | 110 | 0.13 | 82.12 | 0.60 | 15.47 | 1.87 | nr | 3.31 | 1.91 | |||||||||
| Vitamin A # | 850 | 800 | 26.18 | 27.82 | 0.04 | 0.04 | 2.08 | 2.21 | 0.09 | 0.10 | 0.89 | 0.95 | 0.05 | 0.05 | 0.77 | 0.82 | nr | nr |
| Vitamin E | 15 | 12 | 2.74 | 3.42 | 3.94 | 4.92 | 2.91 | 3.64 | 13.20 | 16.50 | 3.21 | 4.02 | 39.70 | 49.63 | 2.32 | 2.90 | 49.53 | 61.91 |
| Vitamin K ## | 70 | 80 | 8.29 | 7.25 | 4.96 | 4.34 | 7.85 | 6.87 | 21.36 | 18.69 | 5.95 | 5.21 | 28.18 | 24.66 | 6.58 | 5.76 | 33.37 | 29.20 |
Publisher’s Note: MDPI stays neutral with regard to jurisdictional claims in published maps and institutional affiliations. |
© 2022 by the authors. Licensee MDPI, Basel, Switzerland. This article is an open access article distributed under the terms and conditions of the Creative Commons Attribution (CC BY) license (https://creativecommons.org/licenses/by/4.0/).
Share and Cite
Pointke, M.; Pawelzik, E. Plant-Based Alternative Products: Are They Healthy Alternatives? Micro- and Macronutrients and Nutritional Scoring. Nutrients 2022, 14, 601. https://doi.org/10.3390/nu14030601
Pointke M, Pawelzik E. Plant-Based Alternative Products: Are They Healthy Alternatives? Micro- and Macronutrients and Nutritional Scoring. Nutrients. 2022; 14(3):601. https://doi.org/10.3390/nu14030601
Chicago/Turabian StylePointke, Marcel, and Elke Pawelzik. 2022. "Plant-Based Alternative Products: Are They Healthy Alternatives? Micro- and Macronutrients and Nutritional Scoring" Nutrients 14, no. 3: 601. https://doi.org/10.3390/nu14030601
APA StylePointke, M., & Pawelzik, E. (2022). Plant-Based Alternative Products: Are They Healthy Alternatives? Micro- and Macronutrients and Nutritional Scoring. Nutrients, 14(3), 601. https://doi.org/10.3390/nu14030601