Article

Association between Fecal Microbiota, SCFA, Gut Integrity Markers and Depressive Symptoms in Patients Treated in the Past with Bariatric Surgery—The Cross-Sectional Study

by
Natalia Komorniak
1,
Alexandra Martynova-Van Kley
2,
Armen Nalian
2,
Michał Wroński
3,
Krzysztof Kaseja
4,
Bartosz Kowalewski
5,
Karolina Kaźmierczak-Siedlecka
6,
Igor Łoniewski
1,7,
Mariusz Kaczmarczyk
7,
Konrad Podsiadło
7,
Paweł Bogdański
8,
Joanna Palma
9,* and
Ewa Stachowska
1,*
1
Department of Human Nutrition and Metabolomics, Pomeranian Medical University in Szczecin, 71-460 Szczecin, Poland
2
Department of Biology, Stephen F. Austin State University, Nacogdoches, TX 75962, USA
3
Department of Psychiatry, Pomeranian Medical University in Szczecin, 71-460 Szczecin, Poland
4
Department of General Surgery and Transplantation, Pomeranian Medical University in Szczecin, 70-111 Szczecin, Poland
5
Independent Provincial Public Hospital Complex in Szczecin-Zdunowo, 70-891 Szczecin, Poland
6
Department of Medical Laboratory Diagnostics, Farhenheit Biobank BBMRI.pl. 80-214 Gdańsk, Poland
7
Sanprobi Sp.z.o.o. Sp.K., Kurza Stopka 5/C, 70-535 Szczecin, Poland
8
Department of Treatment of Obesity, Metabolic Disorders and Clinical Dietetics, Poznan University of Medical Sciences, 60-569 Poznan, Poland
9
Department of Biochemical Sciences, Pomeranian Medical University in Szczecin, 71-460 Szczecin, Poland
*
Authors to whom correspondence should be addressed.
Nutrients 2022, 14(24), 5372; https://doi.org/10.3390/nu14245372
Submission received: 22 November 2022 / Revised: 10 December 2022 / Accepted: 13 December 2022 / Published: 17 December 2022

Abstract

:
(1) Background: Depressive symptoms often appear after surgical treatment. (2) Methods: We involved 41 adults who underwent bariatric surgery a minimum of 6 months before the study and had the Beck scale ≥12. We analysed patients’ mental state, gut barrier markers, faecal short chain fatty acids, and microbiota. (3) Results: Gut microbiota composition differed significantly among patients undergoing two different types of surgery (F = 1.64, p = 0.00002). Additionally, we discovered an association between short chain fatty acids and the Beck scale (F = 1.22, p = 0.058). The rearrangement of bacterial metabolites may be due to the patients’ use of increased dietary protein, with insufficient intake of products containing vegetable fiber (Diet Quality Index (DQI-I )adequacy 22.55 (±3.46) points). (4) Conclusions: Bariatric surgery affects the gut microbiota, which may play an important role in the development of depressive and gastrointestinal symptoms in patients after bariatric surgery. Low fiber consumption and increased levels of faecal isobutyric acid may lead to intestinal inflammation. There is a need for further research on this topic including a larger sample size.

Graphical Abstract

1. Introduction

The term microbiota-gut-brain axis refers to a network of connections involving many biological systems that enable two-way communication between intestinal microorganisms and the brain [1]. This combination is crucial for maintaining the homeostasis of the central nervous system and the digestive system as well as gut microbiota [1]. This two-way communication takes place via the vagus nerve and through influence on the immune system, the hypothalamic-pituitary-adrenal axis, and the metabolism of tryptophan, along with the ability of the microbiota to synthesize a number of neurotransmitters and short-chain fatty acids (SCFA) with neuroactive properties [2].
Bariatric surgery seems to be the optimal treatment for patients suffering from morbid obesity, allowing the patient to obtain weight reduction. It also provides metabolic effects and can provide relief from a number of diseases (e.g., hypertension or diabetes). Additionally, bariatric surgery may improve quality of life and extend the term of life [3]. The most frequently performed bariatric procedures include sleeve gastrectomy (SG) (61.4%) and Roux-en-Y gastric bypass (RYGB) (17%) [4].
The exact mechanisms inducing changes in the gut microbiota after certain types of bariatric procedures have not been closely examined. Factors influencing the composition of the gut microbiota after surgery include changes in the diet and nutritional status, differences in the anatomy and pH of the gastrointestinal tract, and variable gastrointestinal transit time as well as bile acid metabolism [5]. Microbiological alterations are usually described within the first 3 months after the operation [6,7,8]. These changes include an increase in the amount of Akkermansia, Escherichia, and Klebsiella and a decrease in the amount of Lactobacillus, Bifidobacterium or Faecalibacterium prausnitzii, and Coprococcus comes [9].
Notably, depressive symptoms decrease in the majority of patients within 6, 12, and 24 months after bariatric surgery. However, an increase in depressive and anxiety symptoms is observed after 36, 48, and 60 months [10].
Numerous studies confirm that mood is influenced by the composition of the gut microbiota [11]. The occurrence of mental disorders (including depression) is associated with the gut dysbiosis [12]. Among patients with major depressive disorders, compared to the control group, the decreased amount of Firmicutes and increased amount of Bacteroidetes is noted, resulting in reduced SCFA production and deterioration of the intestinal barrier function [13,14]. In this group of patients, an increased amount of Actinobacteria, Enterobacteriaceae, and Alistipes as well as decreased amounts of Faecalibacterium were also observed. Moreover, the occurrence of Faecalibacterium is negatively correlated with the severity of depressive symptoms, while Prevotella and Klebsiella correlate positively with this phenomenon. Additionally, among patients with major depressive disorders (MDD), a decrease in the amount of Bifidobacterium and Lactobacillus is observed [15].
The primary aims of the study were to assess the gut microbiota, SCFA, and markers of intestinal barrier integrity among patients ≥6 months after bariatric surgery who suffered from depressive symptoms. The secondary aims of the study included analysis of gastrointestinal symptoms (as abdominal pain, bloating, heartburn, nausea, bowel movement problems, diarrhea, and constipation), mental state, and diet. The tested hypothesis was that gut microbiota, its metabolites, and gut barrier integrity are associated with depressive symptoms.

2. Materials and Methods

In the period from July 2018 to December 2020, 201 patients between 18 and 70 years of age who underwent bariatric surgery (SG or RYGB method) at least 6 months earlier completed the self-assessment questionnaire Beck scale used to preselection depressive symptoms. Patients scoring ≥12 points were treated as the occurrence of depressive symptoms and included to the study [16,17,18]. Out of 91 participants who obtained ≥12 points, 27 refused to participate in this study, 23 patients were assessed with exclusion criteria (intake of antibiotics, proton pump inhibitors (PPI) and probiotics during the 6 months preceding the study as well as addiction to alcohol and psychoactive substances, internal organ failure and chronic inflammatory diseases of the gastrointestinal tract), which enabled the commencement of further tests among 41 patients (Figure 1). During the visit, biological material (blood, feces) was collected from 41 patients. Anthropometric measurements, questionnaire tests, and a food diary for the past 72 h were collected. Subsequently, in patients enrolled in the study, the severity of depressive symptoms was measured using the Hamilton scale by an experienced psychiatrist.

2.1. Anthropometric Research

Body composition analysis was performed using a Jawon Medical ioi-353 brand analyzer (JAWON Medical Co., Ltd., Gyeongbuk, Republic of Korea). Height (cm) was measured with the use of a measuring rod. The waist (cm) and hip circumferences (cm) were measured with a tape measure, and then the waist-hip ratio (WHR) was calculated [19].

2.2. Survey Research

The mental state of patients was assessed using:
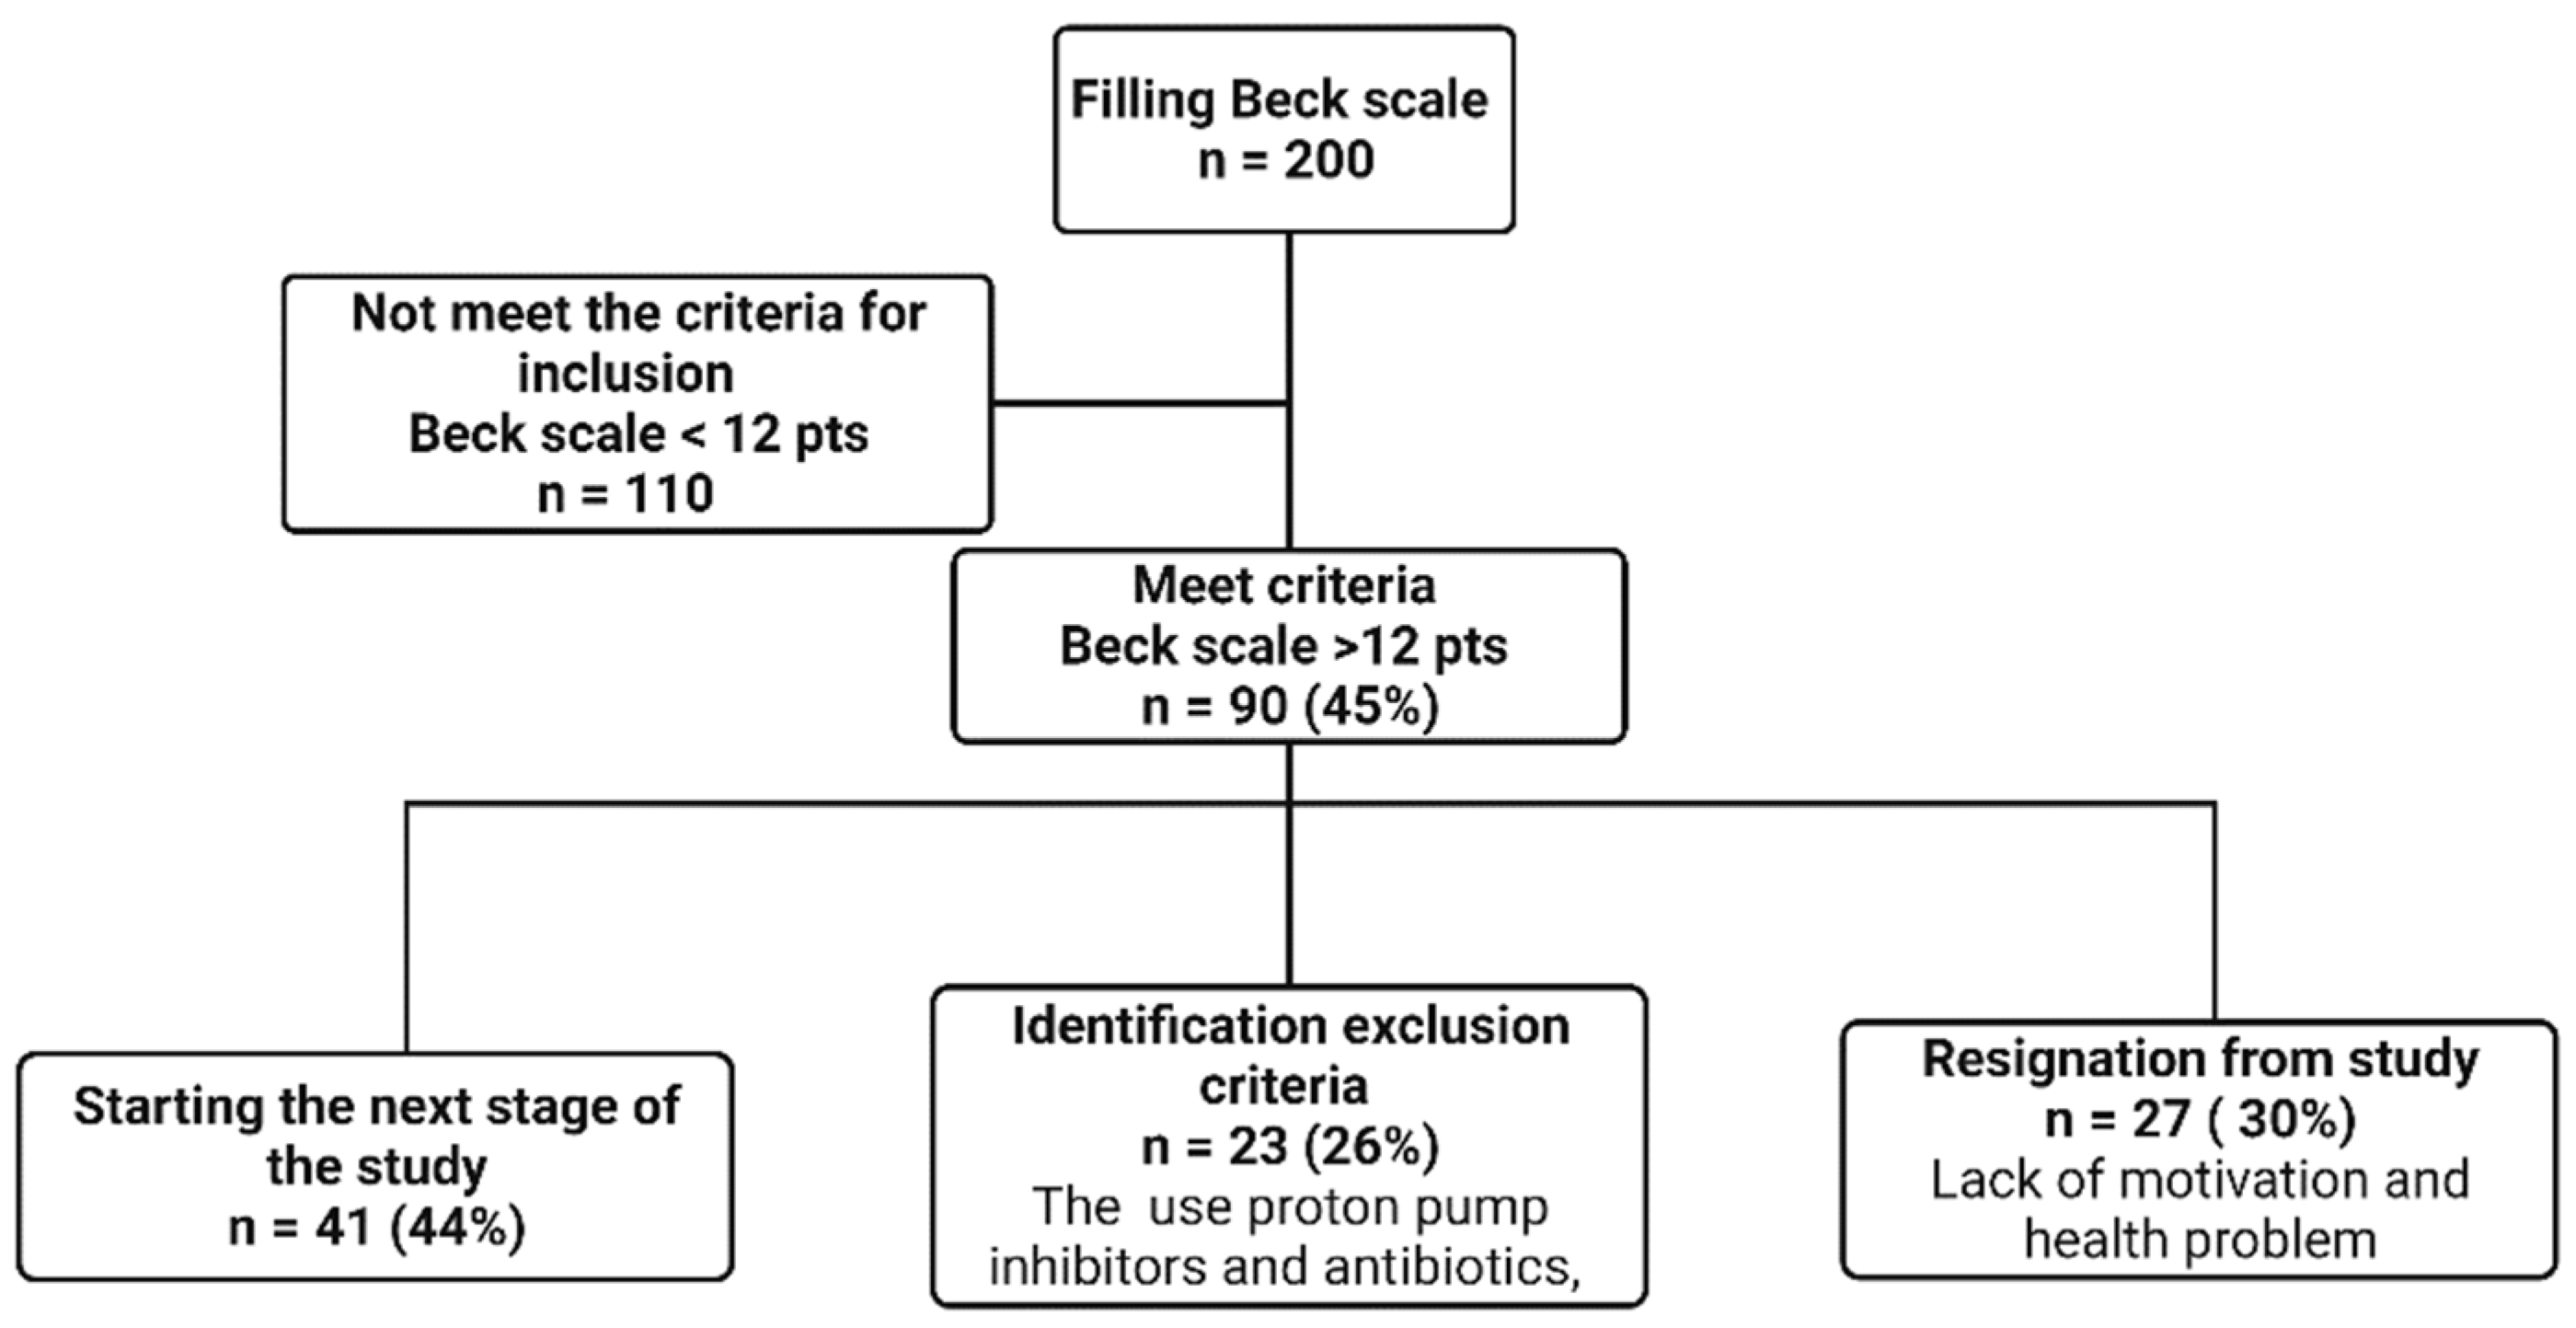
  • Beck’s Scale—a self-assessment questionnaire used to assess the occurrence and intensity of depressive symptoms. The total score ranges from 0 to 63 points, where the higher the score, the greater the severity of depressive symptoms. ≥12 points was considered to suggest the presence of depressive symptoms [16,17,18].
  • Hamilton Scale—the questionnaire was conducted by an experienced psychiatrist to objectively assess the severity of depressive symptoms. The study used a 21-point version, where a score of ≥7 points indicated the presence of depression [20,21].
  • Athenian Insomnia Scale—a scale consisting of 8 items assessing nighttime sleep patterns (falling asleep and waking up at night) as well as total sleep time, sleep quality, well-being, psychophysical fitness, and daytime sleepiness. Scores were assessed utilizing a total score of between 0 and 24 points, with a higher score representing a poorer quality of sleep. Score ≥6 points indicated insomnia [22].

2.3. Eating Habits

The patients’ eating habits were assessed using the food frequency questionnaire (FFQ). The questionnaire was supplemented with questions about the type of bariatric surgery, weight reduction after surgery, supplementation used, and the presence of post-operative complaints (i.e., abdominal pain, nausea, vomiting, heartburn, constipation, and diarrhea). During the visit, a food consumption list for the last 72 h was also collected and analyzed using the 5D Diet program (Food and Nutrition Institute, Warsaw). Based on the data collected with the above tools, the International Diet Quality Index (DQI-I) was calculated, with the total score ranging from 0 to 100 points. The higher the number of points, the better the quality of the diet [23].

2.4. Laboratory Tests

Biological material (blood, stool) was collected from the patients and then stored at −80 °C until laboratory analyses were performed. Venous blood was collected in ethylenediaminetetraacetic acid (EDTA) tubes, centrifuged (3500 rpm for 10 min), and then the plasma and morphotic parts were separated into individual Eppendorf tubes. The feces were collected using a stool sampling kit (Kałszyk, Wąchock, Poland) and then delivered by patients to the laboratory within 24 h.

2.5. The Assessment of Intestinal Barrier Integrity

Fecal zonulin level was determined using an enzyme-linked immunosorbent assay (ELISA) (Immundiagnostik AG, Bensheim, Germany) according to the manufacturer’s protocol. The absorbance was measured with a spectrophotometer (Sunrise, Tecan, Männedorf, Switzerland) at 450 nm. Serum lipopolysaccharide (LPS) and occludin concentrations were determined by ELISA (EIAAB Science Inc., Wuhan, China), and LPS binding protein (LBP) by ELISA (FineTest, Wuhan, China) according to manufacturers’ protocols. In each case, the absorbance was measured with a spectrophotometer (Sunrise, Tecan, Männedorf, Switzerland) at 450 nm.

2.6. Sequencing Analysis of the Bacterial 16S RNA Genes

DNA isolation from stools and sequencing of the V3–V4 regions of the 16S rDNA gene were performed on the Illumina MiSeq apparatus (Illumina INC, San Diego, CA, USA) at the Clinical Molecular Biology Institute of the University of Kiel (Kiel, Germany) according to their own protocol. DNA was isolated using microcentrifuge columns with silica membrane. The extracted DNA was purified using an Agencourt AMPure®XP machine (Beckman Coulter, Brea, CA, USA). The DNA was amplified using the Metagenomic Library Construction Kit 16S (V3–V4) for Next Generation Sequencing (Takara Bio Inc., Kusatsu, Japan), followed by sequencing using the Illumina MiSeq v3 2 × 250 bp kit (Illumina Inc., San Diego, CA, USA).

2.7. The Assessment of SCFA Content in Faecal Samples

The analysis was performed on 0.5 g of a faecal sample, which was then homogenized in 5 mL of water for 5 min. The pH was acidified to pH = 3 with 5M HCl and further samples were centrifuged for 20 min. The obtained samples were analyzed by gas chromatography with a flame ionization detector (FID). SCFA analysis included: acetic acid (C2: 0), propionic acid (C3: 0), isobutyric acid (C4: 0 i), butyric acid (C4: 0 n), isovaleric acid (C5: 0 i), and valeric acid (C5: 0 n). The analysis was performed using an Agilent Technologies 1260 System ( Santa Clara, USA) gas chromatograph on a DB-FFAP column, 30 m × 0.53 mm × 0.5 µm. Hydrogen was supplied as carrier gas at a flow rate of 14.4 mL/min. The starting temperature was 100 °C. It was held for 0.5 min and then raised to 180 °C at a rate of 8 °C/min and held for 1 min. The temperature was then increased to 200 °C at a rate of 20 °C/min and held at 200 °C for 5 min. The fatty acids were identified by comparing their retention times with commercially available standards.

2.8. Statistical Analysis

The statistical analysis was performed in the R environment (version 4.0.5) (Aucland Uniwersity, Auckland, New Zeland), and the statement of values and the graphical presentation were made in MS Excel. The groups were characterized for quantitative variables by presenting the values of the mean, median, standard deviation, minimum and maximum value, range and standard error.
Overlapping pairs of Illumina readings were analyzed using the (SanPANDAseq program (San Diego, USA) [24]. The assessment of the structure of the microbial ecosystem was based on the relative percentage of taxa. Sequences were initially identified taxonomically using the RDP 2.13 classifier (San Diego, USA) [25], then the taxonomy level i.e., genus, family, order, class, etc. was determined by assigning a level where confidence level for identification was ≥80. To find the correlation between the structure of the bacterial community and anthropometric factors, non-metric multidimensional scaling (NMDS) and redundancy analysis (RDA) from the vegan R package) (Aucland Uniwersity, Auckland, New Zeland) was used.
Sample size was determined for Permutational Analysis of Variance (PERMANOVA) which is used to detect the differences in microbial composition between two or more groups of individuals using the micropower R package for the weighted Jaccard distance metric. The necessary data for sample size estimation, i.e., within-group mean and standard deviation of the Jaccard distance, were determined using metagenomic gut samples from HMP (Human Microbiome Project). Based on the HMP dataset the smallest detectable effect size (ω2) assuming 80% was 0.0068 for 30 subjects per group (the ω2 values for various studies with statistically significant between-group differences ranged between 0.023 and 0.23) [26].
RDA was performed on Hellinger-transformed relative abundance data in four rounds until the final model was specified. The procedure was as follows: The first round was an univariate analysis. In the second round the most significant variable was tested with all other variables in pairs. Two variables from the most significant model were tested with all other variables in the round three. Three variables from the most significant model were tested in all other variables in the last round (four). The final model was the last most significant model. Non-metric multidimensional scaling was carried out using Bray-Curtis distances and non-transformed relative abundance tables. The regression of factors to the NMDS ordination axes was performed using the envfit function. To identify bacteria that are associated with factor variables we performed species indicator analysis using the multipath function from the indiscpecies package. All permutation tests were performed with 100,000 permutations. The lattice (R 3.5.1) and ggplot2 packages) (Aucland Uniwersity, Auckland, New Zeland) [27] were used to prepare the graphs. Rarefaction curves were generated using the indicspecies package) (Aucland Uniwersity, Auckland, New Zeland) [28].

3. Results

The mean age in the study group of 41 patients was 44.12 (±10.31) years. Even though the patients were, on average, 3 years post surgery, they still suffered from abdominal obesity. The anthropometric measurements are presented in Supplementary Table S1.

3.1. Mental State

The evaluation of the mental state of the patients showed the presence of mild depressive symptoms in most of them—the mean value of the Beck scale was 18.42 (±7.63) points. The presence of depressive symptoms was also confirmed by the Hamilton scale, the mean value of which was 12.94 (±4.7) points. Additionally, sleep disorders were reported among the studied patients through the Athenian Insomnia Scale (the result of which was 10.11 (±4) points). Detailed information is presented in Table 1 and Supplementary Table S1.

3.2. Gastrointestinal Symptoms, Endotoxaemia Parameters and Other Biochemical Results

The most common symptom reported by patients was problems with defecation, which affected 67.5% of participants. Additionally, 40% of patients suffered from constipation and 30% had diarrhea. Flatulence (7.5%) was the least common symptom in this group of participants. A summary of all reported complaints is presented in Figure 2.
The analysis of endotoxemia parameters showed that the mean blood level of LBP in patients was 594.09 (±196.81) ng/mL, LPS 102.09 (±34.66) pg/mL, occludin 13.77 (±3.41) ng/mL, and faecal zonulin concentration 137.05 (±73.54) ng/mL. Detailed results of the performed laboratory tests are presented in Supplementary Table S1.

3.3. The Analysis of Diet

The analysis of participants’ diet showed that the patients consumed protein consistent with postoperative recommendations [29]. The amount of protein was 65.2 g (±16.2 g) per day. The most frequently chosen sources of protein were poultry and dairy products with a low consumption of fish and legume seeds (DQI-I diversity 9.9 (±4.72) points). Additionally, the diet of the participants was low in grains and vegetables, which translated into a low dietary fiber content—15.5 (±6.4) g (DQI-I adequacy 22.55 (±3.46) points). In addition, the patients’ diet was not satisfactory due to the relatively high consumption of SCFA (10.8% (±3.9%) of the total daily energy of the diet) and products providing so-called empty calories (mainly sweets). All these aspects contributed to the score of 47.45 (±8.32) DQI-I points (Supplementary Table S1).

3.4. The Composition of Gut Microbiota

The taxonomic composition of the gut microbiota obtained from all participants was expressed in terms of operational taxonomic units (OTUs) (Figure 3).
In RDS, gut microbiota composition differed significantly among patients undergoing two different types of surgery (F = 1.64, p = 0.00002). Also, we found an association with short-chain fatty acids (SCFAC2, F = 1.68, p = 0.00003; SCFAC3, F = 1.39, p = 0.002; SCFAC4i, F = 1.51, p = 0.0003; SCFAC4n, F = 1.26, p = 0.020); and borderline significant association with the Beck scale (F = 1.22, p = 0.058). The final model was constructed after four rounds of model fitting with one, two, three, and four variables, (see Methods) and included SCFAC2, SCFAC4i, and Beck scale (Figure 4). The models tested in all rounds of variable selection process and the significance of variables are shown in Supplementary Table S2. This model suggests that the composition of the microbiota is related to the concentration of isobutyric acid and acetic acid in the stool. From the ordination plot with surfaces for each variable (Figure 4) we can conclude that a worsening of depressive symptoms is associated with a decrease in isobutyric acid concentration and an increase in faecal acetate concentration.
In addition to RDA, a non-metric multidimensional scaling (NMDS) was performed using Bray-Curtis distances calculated on relative abundances. To visualize the underlying trends in microbial composition, environmental variables were overlayed onto ordination plot by using regression of environmental variables on NMDS ordination scores (with envfit function). Two variables were significant: SCFAC4i R2 = 0.40, p = 0.020 and the presence of digestive symptoms (i.e., nausea, diarrhea, constipation, flatulence, and abdominal pain, R2 = 0.22, p = 0.0098). As these variables were co-varying with the community composition, they could possibly cause a change in the compositional pattern of this community (Figure 5). Total output of the envfit regression is shown in Supplementary Table S3. Interestingly, the presence of digestive symptoms was also associated with increased isobutyric acid levels in the feces of these patients. The examination of bacterial patterns revealed the bacteria associated with each group (Figure 5 ). Patients who did not report any complaints had significantly higher fecal content of Oxalobacteraceae, Faecalibacterium, or Megamonas (Figure 5 and Figure 6).

4. Discussion

To the best of our knowledge, this is the first study dedicated to investigating the relationship between the gut microbiota, the intestinal barrier markers, diet, and the occurrence of depressive symptoms among patients after surgical treatment of morbid obesity using RYGB and SG methods.
Numerous studies indicate an improvement in the mental health of patients after bariatric surgeries, including improvement of the quality of life, increased self-esteem, improved body image, or a reduction in the severity of depressive symptoms and anxiety among patients [30,31,32,33,34]. However, the results of some studies indicated a deterioration in the quality of life of patients after bariatric surgeries, which is reflected in an increase in the percentage of self-harm, depression, and alcohol abuse in this group of patients [35,36,37,38]. A 12-year cohort study showed that bariatric surgery is significantly associated with an increased risk of developing major depressive disorder. After an initial significant improvement in mental functioning, an increased risk of major depressive disorder is noted over 4 years after surgery [39]. In the study, among 200 surveyed patients (on average 3 years after bariatric surgery), as many as 45% met the criteria for the diagnosis of depressive disorders expressed by the Beck self-assessment scale. A study by Ribeiro et al. [40] showed that after the initial post-operative improvement in mental functioning (reduction of depression and anxiety symptoms in the first 23 months after RYGB), there was a gradual deterioration of the mental state of patients. Five years after the operation, depression was reported in 35% of patients, and anxiety disorders in 40% [40].
Chronic inflammation is associated with obesity. Moreover, patients with obesity are more likely to develop depression than the general population, suggesting the importance of the microbiota-gut-brain axis [41,42]. In a systematic review by Cheung et al. [43], it has been shown that the microbiota of MDD patients is depleted in microorganisms with a high ability to metabolize carbohydrates (Bifidobacterium, Faecalibacterium, and Ruminococcus). At the same time, the authors indicated that patients with MDD had an increased number of Anaerostipes, Blautia, and Clostridium (which can also metabolize carbohydrates), as well as bacteria with a high ability to metabolize proteins and amino acids (Clostridium, Klebsiella, Parabacteroides, Streptococcus, and Oscillibacter, Alistipes) [43]. Additionally, it has been shown that an increased concentration of intestinal dysbiosis markers significantly correlates with the severity of depressive symptoms. In the meta-analysis by Safadi et al. [44] it has been shown that patients suffering from depression have an increased concentration of zonulin, LPS, LBP, or alpha-1-antitrypsin, as well as a lower concentration of SCFA in the stool compared to the control group [45]. Therefore, it seems that endotoxemia may be a significant factor in connection with depression, inflammation, and obesity [41,46].
In the studied group of patients, as many as 67.5% suffered from defecation problems, 40% experienced chronic constipation, and 30% experienced chronic diarrhea. The gut microbiota of patients suffering from gastrointestinal complaints was characterized by a significantly higher relative abundance of Enterobacteriaceae (whose overgrowth can be seen in many inflammatory conditions, such as inflammatory bowel diseases, obesity, colorectal cancer, and celiac disease) [47], Parasutterella (its presence may be related to genesis and development of IBS, as well as chronic inflammation of the intestines) [48], or Enterococcus (opportunistic pathogens that, apart from their typical commensal environment—the gastrointestinal tract, can cause various infections). Especially E. faecalis and E. faecium are related with serious complications and nosocomial infections [49]. The presence of a significantly higher number of Sellimonas in the feces of this group of patients is somewhat surprising. It is postulated that these bacteria can potentially have a beneficial effect on the health of the host, and S. intestinalis may serve as a biomarker of the return of homeostasis within the gut microbiota [50].
The gut microbiota associated with the occurrence of gastrointestinal complaints among the studied patients was also related to the increased concentration of isobutyric acid in the feces (Figure 5). This acid, like isovaleric acid, is classified as a branched fatty acid (BCFA). They are produced by the gut microbiota mainly as a result of fermentation (mainly by Bacteroides and Clostridium) of branched-chain amino acids (valine, leucine, and isoleucine) [51]. We still know relatively little about the impact of BCFA on human health. It seems, however, that these acids can undergo oxidation if the amount of butyric acid (included in SCFA) is insufficient and constitutes a source of energy for colonocytes [52]. Additionally, an increase in the amount of BCFA in the stool may indicate an increased proteolytic fermentation (a high amount of protein in the large intestine may result from its high intake in the diet and/or malabsorption disorders) leading to the formation of harmful metabolites, i.e., ammonia, p-cresol, phenols, or hydrogen sulfide. [51,53,54]. This, in turn, may contribute to the disturbance of the structure of the colon epithelium and the development of inflammation of the mucosa. It may also affect the intestinal nervous system and intestinal motility. This is of significant clinical importance in inflammatory bowel diseases or colorectal neoplasms [55,56]. Additionally, it has been shown that BCFA (isobutyric and isovaleric acid) may be one of the factors contributing to the development of depressive disorders [57]. In studies conducted in patients after bariatric surgery, an increase in the concentration of BCFA in the feces as well as a decrease in the SCFA/BCFA ratio and a negative correlation between the consumption of starch and the concentration of BCFA in the feces have been reported [58,59,60,61]. Therefore, in order to limit proteolytic fermentation, it seems justified to pay special attention to the appropriate dietary fiber intake in the diet of patients after bariatric surgery [56,60]. In the study, the patients consumed the recommended amount of protein, mainly from poultry and dairy products (DQI-I diversity 9.9 (±4.72) points), with a simultaneous low consumption of cereal products and fiber (DQI-I adequacy 22.55 (±3.46) points), which could have influence on a significant increase in the concentration of isobutyric acid in the stool of people suffering from gastrointestinal ailments (Figure 6). Also, in other studies [62,63], a low consumption of fiber is reported in the bariatric population, which undoubtedly has a negative impact on the functioning of the body [64].
In the current study, the normal BMI range was observed only in 6 patients and more than 50% of patients suffered from obesity (see Supplementary Table S4). Obesity is characterized by low-level inflammation, which contributes to the development of many comorbidities [65]. Studies have shown that the concentration of LPS is higher in obese people than in lean people, and by unsealing the intestinal barrier, it can get into the circulatory system [66]. Obviously, small amounts of LPS (as a component of the cell membrane of gram-negative bacteria) also enter the circulation in healthy people, but its increased translocation occurs after eating high-fat meals [67,68,69,70,71]. In particular, saturated fatty acids may promote low-intensity chronic inflammation and induce an increase in LPS levels [66,72]. Interestingly, in a study focusing on the analysis of the microbiota of patients who experienced a re-gain in body weight after bariatric surgery, it was shown that they are characterized by lower microbiota abundance, and also have lower numbers of Sarcina, Butyrivibrio, Alkaliphilus, Lachnospira, Pseudoalteromonas, and Cetobacterium in relation to people who have achieved successful weight loss after surgery [73].

Limitations

This study has several limitations worth noting. Although we stated that the number of patients who met the inclusion criteria were 91, only 41 people were enrolled in this research. Different surgery methods (SG and RYGB) and the obesity of most participants can be a significant confounder factor of microbiota analysis. This undoubtedly makes it necessary to repeat the study on a larger group of participants. Secondly, it is worth remembering that BCFA in the stool is dependent on their synthesis, utilization, and absorption. In this study, we examined only BCFA level in the stool (without blood level concentration).

5. Conclusions

The type of bariatric surgery affects the microbiota in different ways. Studies have suggested that the gut microbiota may play a role in the development of depressive symptoms and gastrointestinal complications in patients after bariatric surgery. Low fiber consumption and an increased level of fecal isobutyric acid may indicate increased proteolytic fermentation and lead to intestinal inflammation. There is a need for further research on this topic, including a bigger sample size.

Supplementary Materials

The following supporting information can be downloaded at: https://www.mdpi.com/article/10.3390/nu14245372/s1, Table S1: Descriptive statistics of all variables used in the study; Table S2: Steps of the RDA analysis–variable selectin process; Table S3: The coefficients of determination (R2) and p values from regression analysis of variables (vectors or factors) with nMDS ordination scores using envfit function (vegan package); Table S4: BMI of patients enrolled in the study.

Author Contributions

Conceptualization, N.K. and E.S.; methodology, N.K., J.P. and E.S.; software, A.M.-V.K. and A.N.; validation, A.M.-V.K. and A.N.; formal analysis, A.M.-V.K., A.N., M.W., M.K. and K.P.; investigation, N.K., B.K. and K.K.; resources, N.K., B.K. and K.K.; data curation, N.K.; writing—original draft preparation, N.K., K.K.-S. and P.B.; writing—review and editing, N.K. and E.S.; visualization, A.M.-V.K. and A.N.; supervision, E.S., I.Ł. and M.K.; project administration, N.K. and E.S.; funding acquisition, E.S. All authors have read and agreed to the published version of the manuscript.

Funding

This research was funded by the Pomeranian Medical University in Szczecin.

Institutional Review Board Statement

The study was conducted in accordance with the Declaration of Helsinki, and approved by the Bioethics Committee of the Pomeranian Medical University in Szczecin (resolution no. KB-0012/40/17) on 27 February 2017.

Informed Consent Statement

Informed consent was obtained from all subjects involved in the study.

Data Availability Statement

Not applicable.

Conflicts of Interest

The authors declare no conflict of interest.

References

  1. Morais, L.H.; Schreiber, H.L.; Mazmanian, S.K. The gut microbiota–brain axis in behaviour and brain disorders. Nat. Rev. Microbiol. 2021, 19, 241–255. [Google Scholar] [CrossRef] [PubMed]
  2. Silva, Y.P.; Bernardi, A.; Frozza, R.L. The Role of Short-Chain Fatty Acids from Gut Microbiota in Gut-Brain Communication. Front. Endocrinol. 2020, 11, 25. [Google Scholar] [CrossRef] [PubMed] [Green Version]
  3. Lo, T.; Tavakkoli, A. Bariatric surgery and its role in obesity pandemic. Curr. Opin. Physiol. 2019, 12, 51–56. [Google Scholar] [CrossRef]
  4. English, W.J.; DeMaria, E.J.; Hutter, M.M.; Kothari, S.N.; Mattar, S.G.; Brethauer, S.A.; Morton, J.M. American Society for Metabolic and Bariatric Surgery 2018 estimate of metabolic and bariatric procedures performed in the United States. Surg. Obes. Relat. Dis. 2020, 16, 457–463. [Google Scholar] [CrossRef]
  5. Steenackers, N.; Vanuytsel, T.; Augustijns, P.; Tack, J.; Mertens, A.; Lannoo, M.; Van der Schueren, B.; Matthys, C. Adaptations in gastrointestinal physiology after sleeve gastrectomy and Roux-en-Y gastric bypass. Lancet Gastroenterol. Hepatol. 2021, 6, 225–237. [Google Scholar] [CrossRef]
  6. Pucci, A.; Batterham, R.L. Mechanisms underlying the weight loss effects of RYGB and SG: Similar, yet different. J. Endocrinol. Investig. 2019, 42, 117–128. [Google Scholar] [CrossRef]
  7. Anhê, F.F.; Varin, T.V.; Schertzer, J.D.; Marette, A. The Gut Microbiota as a Mediator of Metabolic Benefits after Bariatric Surgery. Can. J. Diabetes 2017, 41, 439–447. [Google Scholar] [CrossRef]
  8. Palleja, A.; Kashani, A.; Allin, K.H.; Nielsen, T.; Zhang, C.; Li, Y.; Brach, T.; Liang, S.; Feng, Q.; Jørgensen, N.B.; et al. Roux-en-Y gastric bypass surgery of morbidly obese patients induces swift and persistent changes of the individual gut microbiota. Genome Med. 2016, 8, 67. [Google Scholar] [CrossRef] [Green Version]
  9. Davies, N.K.; O’Sullivan, J.M.; Plank, L.D.; Murphy, R. Altered gut microbiome after bariatric surgery and its association with metabolic benefits: A systematic review. Surg. Obes. Relat. Dis. 2019, 15, 656–665. [Google Scholar] [CrossRef]
  10. Spirou, D.; Raman, J.; Smith, E. Psychological outcomes following surgical and endoscopic bariatric procedures: A systematic review. Obes. Rev. 2020, 21, e12998. [Google Scholar] [CrossRef]
  11. Madison, A.; Kiecolt-Glaser, J.K. Stress, depression, diet, and the gut microbiota: Human–bacteria interactions at the core of psychoneuroimmunology and nutrition. Curr. Opin. Behav. Sci. 2019, 28, 105–110. [Google Scholar] [CrossRef] [PubMed]
  12. Limbana, T.; Khan, F.; Eskander, N. Gut Microbiome and Depression: How Microbes Affect the Way We Think. Cureus 2020, 12, e9966. [Google Scholar] [CrossRef] [PubMed]
  13. Liu, R.T.; Rowan-Nash, A.D.; Sheehan, A.E.; Walsh, R.F.L.; Sanzari, C.M.; Korry, B.J.; Belenky, P. Reductions in anti-inflammatory gut bacteria are associated with depression in a sample of young adults. Brain Behav. Immun. 2020, 88, 308–324. [Google Scholar] [CrossRef] [PubMed]
  14. Huang, Y.; Shi, X.; Li, Z.; Shen, Y.; Shi, X.; Wang, L.; Li, G.; Yuan, Y.; Wang, J.; Zhang, Y.; et al. Possible association of Firmicutes in the gut microbiota of patients with major depressive disorder. Neuropsychiatr. Dis. Treat. 2018, 14, 3329–3337. [Google Scholar] [CrossRef] [PubMed] [Green Version]
  15. Huang, T.-T.; Lai, J.-B.; Du, Y.-L.; Xu, Y.; Ruan, L.-M.; Hu, S.-H. Current Understanding of Gut Microbiota in Mood Disorders: An Update of Human Studies. Front. Genet. 2019, 10, 98. [Google Scholar] [CrossRef] [Green Version]
  16. Wang, Y.-P.; Gorenstein, C. Assessment of depression in medical patients: A systematic review of the utility of the Beck Depression Inventory-II. Clinics 2013, 68, 1274–1287. [Google Scholar] [CrossRef]
  17. Kapci, E.G.; Uslu, R.; Turkcapar, H.; Karaoglan, A. Beck Depression Inventory II: Evaluation of the psychometric properties and cut-off points in a Turkish adult population. Depress. Anxiety 2008, 25, E104–E110. [Google Scholar] [CrossRef]
  18. Beck, A.T.; Ward, C.H.; Mendelson, M.; Mock, J.; Erbaugh, J. An Inventory for Measuring Depression. Arch. Gen. Psychiatry 1961, 4, 561–571. [Google Scholar] [CrossRef] [Green Version]
  19. Fauziana, R.; Jeyagurunathan, A.; Abdin, E.; Vaingankar, J.; Sagayadevan, V.; Shafie, S.; Sambasivam, R.; Chong, S.A.; Subramaniam, M. Body mass index, waist-hip ratio and risk of chronic medical condition in the elderly population: Results from the Well-being of the Singapore Elderly (WiSE) Study. BMC Geriatr. 2016, 16, 125. [Google Scholar] [CrossRef] [Green Version]
  20. Hamilton, M. A RATING SCALE FOR DEPRESSION. J. Neurol. Neurosurg. Psychiatry 1960, 23, 56–62. [Google Scholar] [CrossRef]
  21. Zimmerman, M.; Martinez, J.H.; Young, D.; Chelminski, I.; Dalrymple, K. Severity classification on the Hamilton depression rating scale. J. Affect. Disord. 2013, 150, 384–388. [Google Scholar] [CrossRef] [PubMed]
  22. Sirajudeen, M.S.; Dilshad Manzar, M.; Alqahtani, M.; Alzhrani, M.; Albougami, A.; Somasekharan Pillai, P.; Spence, D.W.; Pandi-Perumal, S.R. Psychometric Properties of the Athens Insomnia Scale in Occupational Computer Users. Healthcare 2020, 8, 89. [Google Scholar] [CrossRef] [PubMed] [Green Version]
  23. Kim, S.; Haines, P.S.; Siega-Riz, A.M.; Popkin, B.M. The Diet Quality Index-International (DQI-I) provides an effective tool for cross-national comparison of diet quality as illustrated by China and the United States. J. Nutr. 2003, 133, 3476–3484. [Google Scholar] [CrossRef] [Green Version]
  24. Masella, A.P.; Bartram, A.K.; Truszkowski, J.M.; Brown, D.G.; Neufeld, J.D. PANDAseq: Paired-end assembler for illumina sequences. BMC Bioinform. 2012, 13, 31. [Google Scholar] [CrossRef] [PubMed] [Green Version]
  25. Wang, Q.; Garrity, G.M.; Tiedje, J.M.; Cole, J.R. Naïve Bayesian Classifier for Rapid Assignment of rRNA Sequences into the New Bacterial Taxonomy. Appl. Environ. Microbiol. 2007, 73, 5261–5267. [Google Scholar] [CrossRef] [PubMed] [Green Version]
  26. Kelly, B.J.; Gross, R.; Bittinger, K.; Sherrill-Mix, S.; Lewis, J.D.; Collman, R.G.; Bushman, F.D.; Li, H. Power and sample-size estimation for microbiome studies using pairwise distances and PERMANOVA. Bioinformatics 2015, 31, 2461–2468. [Google Scholar] [CrossRef] [PubMed] [Green Version]
  27. Wickham, H. Ggplot2: Elegant Graphics for Data Analysis; Wickham, H., Ed.; Springer: New York, NY, USA, 2016; ISBN 978-3-319-24277-4. [Google Scholar]
  28. De Caceres, M.; Legendre, P. Associations between species and groups of sites: Indices and statistical inference. Ecology 2009, 90, 3566–3574. [Google Scholar] [CrossRef]
  29. Sherf Dagan, S.; Goldenshluger, A.; Globus, I.; Schweiger, C.; Kessler, Y.; Kowen Sandbank, G.; Ben-Porat, T.; Sinai, T. Nutritional Recommendations for Adult Bariatric Surgery Patients: Clinical Practice12. Adv. Nutr. 2017, 8, 382–394. [Google Scholar] [CrossRef] [Green Version]
  30. Major, P.; Matłok, M.; Pędziwiatr, M.; Migaczewski, M.; Budzyński, P.; Stanek, M.; Kisielewski, M.; Natkaniec, M.; Budzyński, A. Quality of Life After Bariatric Surgery. Obes. Surg. 2015, 25, 1703–1710. [Google Scholar] [CrossRef] [Green Version]
  31. Major, P.; Stefura, T.; Dziurowicz, B.; Radwan, J.; Wysocki, M.; Małczak, P.; Pędziwiatr, M. Quality of Life 10 Years After Bariatric Surgery. Obes. Surg. 2020, 30, 3675–3684. [Google Scholar] [CrossRef]
  32. Felske, A.N.; Williamson, T.M.; Scurrey, S.R.M.; Telfer, J.A.; Campbell, T.S.; Rash, J.A. The Influence of Weight-Related Self-Esteem and Symptoms of Depression on Shape and Weight Concerns and Weight-Loss 12 Months After Bariatric Surgery. Obes. Surg. 2021, 31, 1062–1072. [Google Scholar] [CrossRef] [PubMed]
  33. Ivezaj, V.; Grilo, C.M. The Complexity of Body Image Following Bariatric Surgery: A Systematic Review of the Literature. Obes. Rev. 2018, 19, 1116–1140. [Google Scholar] [CrossRef] [PubMed]
  34. Gill, H.; Kang, S.; Lee, Y.; Rosenblat, J.D.; Brietzke, E.; Zuckerman, H.; McIntyre, R.S. The long-term effect of bariatric surgery on depression and anxiety. J. Affect. Disord. 2019, 246, 886–894. [Google Scholar] [CrossRef] [PubMed]
  35. Bhatti, J.A.; Nathens, A.B.; Thiruchelvam, D.; Grantcharov, T.; Goldstein, B.I.; Redelmeier, D.A. Self-harm Emergencies After Bariatric Surgery: A Population-Based Cohort Study. JAMA Surg. 2016, 151, 226–232. [Google Scholar] [CrossRef] [PubMed] [Green Version]
  36. Lagerros, Y.T.; Brandt, L.; Hedberg, J.; Sundbom, M.; Bodén, R. Suicide, Self-harm, and Depression After Gastric Bypass Surgery: A Nationwide Cohort Study. Ann. Surg. 2017, 265, 235–243. [Google Scholar] [CrossRef]
  37. Morgan, D.J.R.; Ho, K.M. Incidence and Risk Factors for Deliberate Self-harm, Mental Illness, and Suicide Following Bariatric Surgery: A State-wide Population-based Linked-data Cohort Study. Ann. Surg. 2017, 265, 244–252. [Google Scholar] [CrossRef]
  38. Azam, H.; Shahrestani, S.; Phan, K. Alcohol use disorders before and after bariatric surgery: A systematic review and meta-analysis. Ann. Transl. Med. 2018, 6, 148. [Google Scholar] [CrossRef]
  39. Lu, C.-W.; Chang, Y.-K.; Lee, Y.-H.; Kuo, C.-S.; Chang, H.-H.; Huang, C.-T.; Hsu, C.-C.; Huang, K.-C. Increased risk for major depressive disorder in severely obese patients after bariatric surgery—A 12-year nationwide cohort study. Ann. Med. 2018, 50, 605–612. [Google Scholar] [CrossRef]
  40. Ribeiro, G.A.N.D.A.; Giapietro, H.B.; Belarmino, L.B.; Salgado-Junior, W. Depression, anxiety, and binge eating before and after bariatric surgery: Problems that remain. Arq. Bras. Cir. Dig. 2018, 31, e1356. [Google Scholar] [CrossRef]
  41. Schachter, J.; Martel, J.; Lin, C.-S.; Chang, C.-J.; Wu, T.-R.; Lu, C.-C.; Ko, Y.-F.; Lai, H.-C.; Ojcius, D.M.; Young, J.D. Effects of obesity on depression: A role for inflammation and the gut microbiota. Brain Behav. Immun. 2018, 69, 1–8. [Google Scholar] [CrossRef]
  42. Milano, W.; Ambrosio, P.; Carizzone, F.; De Biasio, V.; Di Munzio, W.; Foia, M.G.; Capasso, A. Depression and Obesity: Analysis of Common Biomarkers. Diseases 2020, 8, 23. [Google Scholar] [CrossRef] [PubMed]
  43. Cheung, S.G.; Goldenthal, A.R.; Uhlemann, A.-C.; Mann, J.J.; Miller, J.M.; Sublette, M.E. Systematic Review of Gut Microbiota and Major Depression. Front. Psychiatry 2019, 10, 34. [Google Scholar] [CrossRef] [Green Version]
  44. Safadi, J.M.; Quinton, A.M.G.; Lennox, B.R.; Burnet, P.W.J.; Minichino, A. Gut dysbiosis in severe mental illness and chronic fatigue: A novel trans-diagnostic construct? A systematic review and meta-analysis. Mol. Psychiatry 2021, 27, 141–153. [Google Scholar] [CrossRef] [PubMed]
  45. Skonieczna-Żydecka, K.; Grochans, E.; Maciejewska, D.; Szkup, M.; Schneider-Matyka, D.; Jurczak, A.; Łoniewski, I.; Kaczmarczyk, M.; Marlicz, W.; Czerwińska-Rogowska, M.; et al. Faecal Short Chain Fatty Acids Profile is Changed in Polish Depressive Women. Nutrients 2018, 10, 1939. [Google Scholar] [CrossRef] [Green Version]
  46. Knight, E.L.; Majd, M.; Graham-Engeland, J.E.; Smyth, J.M.; Sliwinski, M.J.; Engeland, C.G. Gender differences in the link between depressive symptoms and ex vivo inflammatory responses are associated with markers of endotoxemia. Brain Behav. Immun. Health 2020, 2, 100013. [Google Scholar] [CrossRef] [PubMed]
  47. Zeng, M.; Inohara, N.; Nuñez, G. Mechanisms of inflammation-driven bacterial dysbiosis in the gut. Mucosal. Immunol. 2017, 10, 18–26. [Google Scholar] [CrossRef] [PubMed] [Green Version]
  48. Chen, Y.-J.; Wu, H.; Wu, S.-D.; Lu, N.; Wang, Y.-T.; Liu, H.-N.; Dong, L.; Liu, T.-T.; Shen, X.-Z. Parasutterella, in association with irritable bowel syndrome and intestinal chronic inflammation. J. Gastroenterol. Hepatol. 2018, 33, 1844–1852. [Google Scholar] [CrossRef]
  49. Krawczyk, B.; Wityk, P.; Gałęcka, M.; Michalik, M. The Many Faces of Enterococcus spp.—Commensal, Probiotic and Opportunistic Pathogen. Microorganisms 2021, 9, 1900. [Google Scholar] [CrossRef]
  50. Muñoz, M.; Guerrero-Araya, E.; Cortés-Tapia, C.; Plaza-Garrido, A.; Lawley, T.D.; Paredes-Sabja, D. Comprehensive genome analyses of Sellimonas intestinalis, a potential biomarker of homeostasis gut recovery. Microb. Genom. 2020, 6, mgen000476. [Google Scholar] [CrossRef]
  51. Rios-Covian, D.; González, S.; Nogacka, A.M.; Arboleya, S.; Salazar, N.; Gueimonde, M.; de los Reyes-Gavilán, C.G. An Overview on Fecal Branched Short-Chain Fatty Acids Along Human Life and as Related With Body Mass Index: Associated Dietary and Anthropometric Factors. Front. Microbiol. 2020, 11, 973. [Google Scholar] [CrossRef]
  52. Jaskiewicz, J.; Zhao, Y.; Hawes, J.W.; Shimomura, Y.; Crabb, D.W.; Harris, R.A. Catabolism of Isobutyrate by Colonocytes. Arch. Biochem. Biophys. 1996, 327, 265–270. [Google Scholar] [CrossRef] [PubMed]
  53. Smith, E.A.; Macfarlane, G.T. Enumeration of amino acid fermenting bacteria in the human large intestine: Effects of pH and starch on peptide metabolism and dissimilation of amino acids. FEMS Microbiol. Ecol. 1998, 25, 355–368. [Google Scholar] [CrossRef]
  54. Mahawar, K.K.; Sharples, A.J. Contribution of Malabsorption to Weight Loss After Roux-en-Y Gastric Bypass: A Systematic Review. Obes. Surg. 2017, 27, 2194–2206. [Google Scholar] [CrossRef] [PubMed]
  55. Yao, C.K.; Muir, J.G.; Gibson, P.R. Review article: Insights into colonic protein fermentation, its modulation and potential health implications. Aliment. Pharmacol. Ther. 2016, 43, 181–196. [Google Scholar] [CrossRef] [Green Version]
  56. Diether, N.E.; Willing, B.P. Microbial Fermentation of Dietary Protein: An Important Factor in Diet–Microbe–Host Interaction. Microorganisms 2019, 7, 19. [Google Scholar] [CrossRef] [Green Version]
  57. Szczesniak, O.; Hestad, K.A.; Hanssen, J.F.; Rudi, K. Isovaleric acid in stool correlates with human depression. Nutr. Neurosci. 2016, 19, 279–283. [Google Scholar] [CrossRef]
  58. Tremaroli, V.; Karlsson, F.; Werling, M.; Ståhlman, M.; Kovatcheva-Datchary, P.; Olbers, T.; Fändriks, L.; le Roux, C.W.; Nielsen, J.; Bäckhed, F. Roux-en-Y Gastric Bypass and Vertical Banded Gastroplasty Induce Long-Term Changes on the Human Gut Microbiome Contributing to Fat Mass Regulation. Cell Metab. 2015, 22, 228–238. [Google Scholar] [CrossRef] [Green Version]
  59. Hoozemans, J.; de Brauw, M.; Nieuwdorp, M.; Gerdes, V. Gut Microbiome and Metabolites in Patients with NAFLD and after Bariatric Surgery: A Comprehensive Review. Metabolites 2021, 11, 353. [Google Scholar] [CrossRef]
  60. Farup, P.G.; Valeur, J. Changes in Faecal Short-Chain Fatty Acids after Weight-Loss Interventions in Subjects with Morbid Obesity. Nutrients 2020, 12, 802. [Google Scholar] [CrossRef] [Green Version]
  61. Pakiet, A.; Wilczynski, M.; Rostkowska, O.; Korczynska, J.; Jabłonska, P.; Kaska, L.; Proczko-Stepaniak, M.; Sobczak, E.; Stepnowski, P.; Magkos, F.; et al. The Effect of One Anastomosis Gastric Bypass on Branched-Chain Fatty Acid and Branched-Chain Amino Acid Metabolism in Subjects with Morbid Obesity. Obes. Surg. 2020, 30, 304–312. [Google Scholar] [CrossRef]
  62. Afshar, S.; Kelly, S.B.; Seymour, K.; Woodcock, S.; Werner, A.-D.; Mathers, J.C. The Effects of Bariatric Procedures on Bowel Habit. Obes. Surg. 2016, 26, 2348–2354. [Google Scholar] [CrossRef] [PubMed] [Green Version]
  63. Grosse, C.S.; Cope, V.C. Dietary Fibre Intake and Bowel Habits After Bariatric Surgery: A Structured Literature Review. Obes. Surg. 2019, 29, 2247–2254. [Google Scholar] [CrossRef] [PubMed]
  64. Barber, T.M.; Kabisch, S.; Pfeiffer, A.F.H.; Weickert, M.O. The Health Benefits of Dietary Fibre. Nutrients 2020, 12, 3209. [Google Scholar] [CrossRef] [PubMed]
  65. Barbarroja, N.; López-Pedrera, R.; Mayas, M.D.; García-Fuentes, E.; Garrido-Sánchez, L.; Macías-González, M.; El Bekay, R.; Vidal-Puig, A.; Tinahones, F.J. The obese healthy paradox: Is inflammation the answer? Biochem. J. 2010, 430, 141–149. [Google Scholar] [CrossRef] [Green Version]
  66. Tuomi, K.; Logomarsino, J.V. Bacterial Lipopolysaccharide, Lipopolysaccharide-Binding Protein, and Other Inflammatory Markers in Obesity and After Bariatric Surgery. Metab. Syndr. Relat. Disord. 2016, 14, 279–288. [Google Scholar] [CrossRef]
  67. Erridge, C.; Attina, T.; Spickett, C.M.; Webb, D.J. A high-fat meal induces low-grade endotoxemia: Evidence of a novel mechanism of postprandial inflammation. Am. J. Clin. Nutr. 2007, 86, 1286–1292. [Google Scholar] [CrossRef] [Green Version]
  68. Cani, P.D.; Amar, J.; Iglesias, M.A.; Poggi, M.; Knauf, C.; Bastelica, D.; Neyrinck, A.M.; Fava, F.; Tuohy, K.M.; Chabo, C.; et al. Metabolic Endotoxemia Initiates Obesity and Insulin Resistance. Diabetes 2007, 56, 1761–1772. [Google Scholar] [CrossRef] [Green Version]
  69. Clemente-Postigo, M.; Queipo-Ortuño, M.I.; Murri, M.; Boto-Ordoñez, M.; Perez-Martinez, P.; Andres-Lacueva, C.; Cardona, F.; Tinahones, F.J. Endotoxin increase after fat overload is related to postprandial hypertriglyceridemia in morbidly obese patients. J. Lipid Res. 2012, 53, 973–978. [Google Scholar] [CrossRef] [Green Version]
  70. Pussinen, P.J.; Havulinna, A.S.; Lehto, M.; Sundvall, J.; Salomaa, V. Endotoxemia Is Associated With an Increased Risk of Incident Diabetes. Diabetes Care 2011, 34, 392–397. [Google Scholar] [CrossRef] [Green Version]
  71. Cani, P.D.; Possemiers, S.; Van deWiele, T.; Guiot, Y.; Everard, A.; Rottier, O.; Geurts, L.; Naslain, D.; Neyrinck, A.; Lambert, D.M.; et al. Changes in gut microbiota control inflammation in obese mice through a mechanism involving GLP-2-driven improvement of gut permeability. Gut 2009, 58, 1091–1103. [Google Scholar] [CrossRef]
  72. Cani, P.D.; Osto, M.; Geurts, L.; Everard, A. Involvement of gut microbiota in the development of low-grade inflammation and type 2 diabetes associated with obesity. Gut Microbes 2012, 3, 279–288. [Google Scholar] [CrossRef] [PubMed] [Green Version]
  73. Gutiérrez-Repiso, C.; Moreno-Indias, I.; de Hollanda, A.; Martín-Núñez, G.M.; Vidal, J.; Tinahones, F.J. Gut microbiota specific signatures are related to the successful rate of bariatric surgery. Am. J. Transl. Res. 2019, 11, 942–952. [Google Scholar] [PubMed]
Figure 1. Flow chart for screening patients for further analysis. pts = points (Created with BioRender.com (accessed on 2 November 2022)).
Nutrients 14 05372 g001
Figure 2. The summary of complaints reported by patients.
Nutrients 14 05372 g002
Figure 3. The composition of gut microbiota (relative abundance of OUT) based on the 16S rRNA gene sequencing by sample and type of surgery. Relative abundance of OTUs is shown for each patient. Patients are arranged by type of surgery. In the legend, the p value and group (RYGB or SG) for which the highest association was found for a given taxon are shown. The association between taxa patterns and groups was performed by multilevel pattern analysis.
Nutrients 14 05372 g003
Figure 4. Relationship between the composition of the intestinal microbiota and Beck’s score, and the concentration of isobutyric acid and acetate in the stool. Black circles—individual patients; blue color line—Beck’s scale value; red color—the concentration of isobutyric acid in the stool; green—the concentration of acetate in the stool. The increase of the Beck sum of points (blue line) is associated with a decrease in stool isobutyric acid (red line) and an increase in stool acetate (green line).
Nutrients 14 05372 g004
Figure 5. NMDS plot of bacterial communities where samples are grouped into two significantly different groups—presence/absence of gastrointestinal complaints with the arrow representing increasing concentration of isobutyric acid in the stool. Yes—the presence of gastro-intestinal symptoms; no—the lack of gastro-intestinal symptoms. The blue arrow represents direction of increasing concentration of SCFAC4i.
Nutrients 14 05372 g005
Figure 6. The most common taxa and the strength of association (and corresponding p values) with a presence/lack of gastrointestinal symptoms. * strength of association.
Nutrients 14 05372 g006
Table 1. Individual patients characteristics.
UPNAgeGenderType of SurgeryMonths after SurgeryBeck’s ScaleHamilton’s ScaleAthenian Insomnia Scale
J3176747WomanRYGB6016118
J3174847WomanRYGB60121110
J3176659WomanRYGB60225
J3174759WomanRYGB60121210
J3175760WomanRYGB4814NANA
J3177545WomanRYGB62NANA
J3175545WomanRYGB612NANA
J3175348WomanRYGB19181410
J3175138WomanRYGB493107
J3176330WomanRYGB256NANA
J3176054WomanRYGB145161711
J3175838WomanRYGB20101012
J3177452WomanRYGB89711
J3176148WomanRYGB13743
J3177348WomanRYGB25644
J3177241WomanRYGB1099NANA
J3177064WomanRYGB714193
J3174051WomanRYGB9291711
J3173838WomanRYGB12019196
J3176945WomanSG30900
J3173645WomanSG3012NANA
J3177836WomanSG115NANA
J3174536WomanSG11231511
J3177734WomanSG9487
J3174234WomanSG912136
J3175228WomanSG14596
J3175055WomanSG15226
J3176523WomanSG1822614
J3176448WomanSG1518711
J3176249WomanSG61111010
J3175944WomanSG61322111
J3177166WomanSG1093NANA
J3175436ManSG2412NANA
J3174931ManSG18211310
J3174636WomanSG481299
J3174328WomanSG6211213
J3174150WomanSG4812NANA
J3173947WomanSG14341918
J3173735ManSG151876
J3173449WomanSG1212913
J3173344WomanSG912711
UPN—Unique patient name; RYGB—Roux-en-Y gastric bypass, SG—sleeve gastrectomy; NA—not available.
Publisher’s Note: MDPI stays neutral with regard to jurisdictional claims in published maps and institutional affiliations.

