Article

Dietary Characteristics of Elders with Frailty and with Mild Cognitive Impairment: Cross-Sectional Findings and Implications from the Nutrition and Health Survey in Taiwan 2014–2017

1
Institute of Biomedical Science, Academia Sinica, 128 Sec. 2, Academia Rd. Nankang, Taipei City 115, Taiwan
2
Department of Food Nutrition, Chung Hwa University Medical Technology, No. 89, Wenhua 1st St., Rende Dist., Tainan City 717, Taiwan
3
Institute of Population Health Sciences, National Health Research Institutes, No. 35, Keyan Road, Zhunan Town, Miaoli County 350, Taiwan
4
Department of Food Nutrition and Health Biotechnology, Asia University, No. 500, Lioufeng Rd., Wufeng, Taichung 41354, Taiwan
5
Department of Biochemical Science & Technology, National Taiwan University, No. 1, Sec. 4, Roosevelt Rd., Taipei City 10617, Taiwan
6
Institute of Public Health, National Yang Ming Chiao Tung University, No. 155, Sec. 2, Linong St., Beitou Dist., Taipei City 112, Taiwan
*
Author to whom correspondence should be addressed.
Nutrients 2022, 14(24), 5216; https://doi.org/10.3390/nu14245216
Submission received: 28 October 2022 / Revised: 29 November 2022 / Accepted: 4 December 2022 / Published: 7 December 2022

Abstract

:
It is unclear whether low dietary intake accompanied with multiple nutrient deficiencies or specific nutrient inadequacy is associated with geriatric syndrome. This study aimed to examine the nutrition inadequacy profiles associated with frailty and cognitive impairment (CI). With information from the Nutrition and Health Survey in Taiwan, 2014–2017, sex-specific nutrient intakes and intake per kg of body weight (BW) were estimated from 24-hour recall data for two age groups (65–74 years; ≥75 years) regarding the three frailty and three CI subgroups. Total energy intakes were significantly lower with the severity of both frailty and CI in analysis combining both gender and age groups, and in both the 65-to-74-year-old women or the over-75-year-old women. These trends were observed but not significant in either of the two age groups in men. Significantly lower levels of energy intake have been observed when age, sex, and sampling strata were adjusted. Intake levels of multiple nutrients also decreased with the severity of frailty and CI. A greater number of nutrient inadequacies for the frail and the CI was found in the 65-to-74-year-old group than the over-75-year-old age group. However, most of the associations between micronutrients and the two geriatric syndromes disappeared after energy adjustment. The remaining few did not show consistency across age–sex subgroups. In conclusion, frailty or CI was associated with low amounts of food consumption accompanied by multiple nutrient insufficiencies. Dietary intervention to ensure adequate total energy and multiple nutrient intakes should be trialed in the geriatric population to address both the causal and efficacy issues.

1. Introduction

With the rapidly growing proportion of the older population, the world is facing the challenges associated with this transition to aged society. Healthy aging has been recognized as one of the crucial strategies for sustainable development. From a nutritional point of view, healthy aging could be promoted by ensuring sufficient energy and all essential nutrients to elders. However, little is known about the multiple nutrient insufficiency profiles associated with the “unhealthy” aging process.
Aging is accompanied by multiple physiological dysfunctions. Frailty and cognitive impairment (CI) are the two most common components of the geriatric syndromes [1] and they were identified as risk factors for each other in cross-sectional and longitudinal studies [2,3,4]. Many age-related processes leading to frailty may have an influence on brain aging and cognitive function, and CI is sometimes considered to be a component of frailty [5] and named as a cognitive frailty [6]. Although multiple potential mechanisms have been studied concerning Alzheimer pathology, hormones, nutrition, chronic inflammation, cardiovascular risks, mental health, mitochondrial dysfunction, and oxidative stress, etc. [1,2], it is unclear how the two syndromes are interrelated.
Age itself is a major independent risk factor of frailty and CI [1]. While multiple aging-related factors contribute to the development of frailty and CI, nutrition is a potentially modifiable factor since elderly people tend to gradually lose appetite which may reduce dietary intake and jeopardize human health [7]. On the other hand, people who develop geriatric syndrome may enter into a vicious cycle and further reduce their food intake [8]. Although it is hard to tease apart causal agents and the consequences of these complex circles, documenting the energy and nutrient profiles associated with geriatric syndrome may shed light on major nutrition problems and the interrelationship between geriatric components. In this study, we investigated the nutrient insufficiency profiles associated with frailty and with CI by sex and age groups (65-to-74-year-old age group vs. over-75-year-old age group), taking advantage of data collected from the Nutrition and Health Survey in Taiwan (NAHSIT) where the older population is growing rapidly.

2. Methods

2.1. Study Population and Ethics

The study population is from the NAHSIT, a nationwide population-based survey executed on a regular basis. In brief, the target population was non-institutionalized Taiwanese nationals and a stratified, three-stage, clustered sampling scheme was used. Details of the survey design and data collection have been published elsewhere [9]. The survey protocol was approved by the Institutional Review Board on Biomedical Science Research, Academia Sinica (project AS-IRB01-13067). All participants provided written informed consent prior to the interview.

2.2. Dietary Assessment

Participants’ dietary intake of the past 24-hour before the survey visit was assessed by using a 24-hour dietary recall method, inquiring about the consumed dietary items, the quantity of intake, and cooking recipes. Methods of 24-hour recall and nutrient computation were similar to those employed in 2005–2008 by NAHSIT [10]. Data of the total energy and 24 nutrients including three macronutrients, nine vitamins, seven minerals, three groups of fatty acids, dietary fibre, and cholesterol were used for statistical analysis in this study.
For further investigation into the dietary pattern, the consumed dietary items and their nutrient data were further used for estimating the number of servings of the six major food groups, the same as the Daily Food Guide of Taiwan (grains and roots, soybeans and products, aquatic foods, eggs and meat, vegetables, fruit, dairy, and nuts and oils) [11].

2.3. Frailty Definition

Like an earlier study published elsewhere [9], the three severity levels of frailty (robust, pre-frail, and frail) were defined using modified Linda Fried criteria with data and cut-off points from NAHSIT, 2014–2017.

2.4. Cognitive Function Assessment

The cognitive function was assessed by the Chinese Mini-Mental State Examination (CMMSE) score [12]. According to Tsai et al. (2016) from Taiwan, participants with the score ≥ 28 were classified as normal cognitive function, those with a score = 24–27 were classified as MCI, and those with a score ≤ 23 were classified as CI [13].

2.5. Statistical Analysis

The present study used data of those aged 65 years and above (n = 1920) from 2014–2017 NAHSIT. Among them, 1681 provided both dietary intake and MMSE scores, and 1186 provided both dietary intake and frailty data. First of all, the associations between geriatric syndromes (frailty and CI) and nutrient intake indicators (total nutrient intake and total nutrient intake per kg of body weight) were compared within each of the four age-sex groups (65–74-year-old men; over-75-year-old men; 65–74-year-old women; over-75-year-old women). All analyses were weighted and adjusted to obtain population-representative estimates by using SUDAAN (version 11.0.1; RTI International, Research Triangle Park, NC, USA) to account for the complex survey design. Within each age–sex group, a trend test was performed with a generalized linear model to examine whether the severity of frailty or CI had an ordered relationship with total energy and multiple nutrient intakes. Age was adjusted in the models for energy and all nutrients, wherever appropriate. Energy-related factors such as physical activity, body weight, and body mass index were not adjusted in the models because these factors have been used to define frailty. Trend tests were also performed on energy adjusted values to check whether associations between macro- or micro-nutrients and the two geriatric syndromes were independent of energy intake level.
Secondly, the percentage of each nutrient intake indicator relative to its recommended dietary allowance (RDA) or adequate intake (AI) were estimated by age–sex–geriatric syndrome groups for graphical presentation. Reference values of RDAs or AIs were from the eighth version of Taiwanese DRIs [14]. As for fat, cholesterol, fatty acids, sodium, and potassium, no reference values were available in Taiwanese DRIs. Hence, available recommendations from the Health Promotion Agency in Taiwan and the American DRIs were applied, for example, 30% of total energy for total fat intake [11], less than 2400 milligrams for the sodium intake [15], 3400 milligrams for men and 2600 milligrams for women for the potassium intake [16], and less than 300 milligrams for the cholesterol intake [17]. As for fatty acids, the percentage of saturated fatty acids (SFA), monounsaturated fatty acids (MUFA), and polyunsaturated fatty acids (PUFA) were estimated with the total fat intake as the denominator.

3. Results

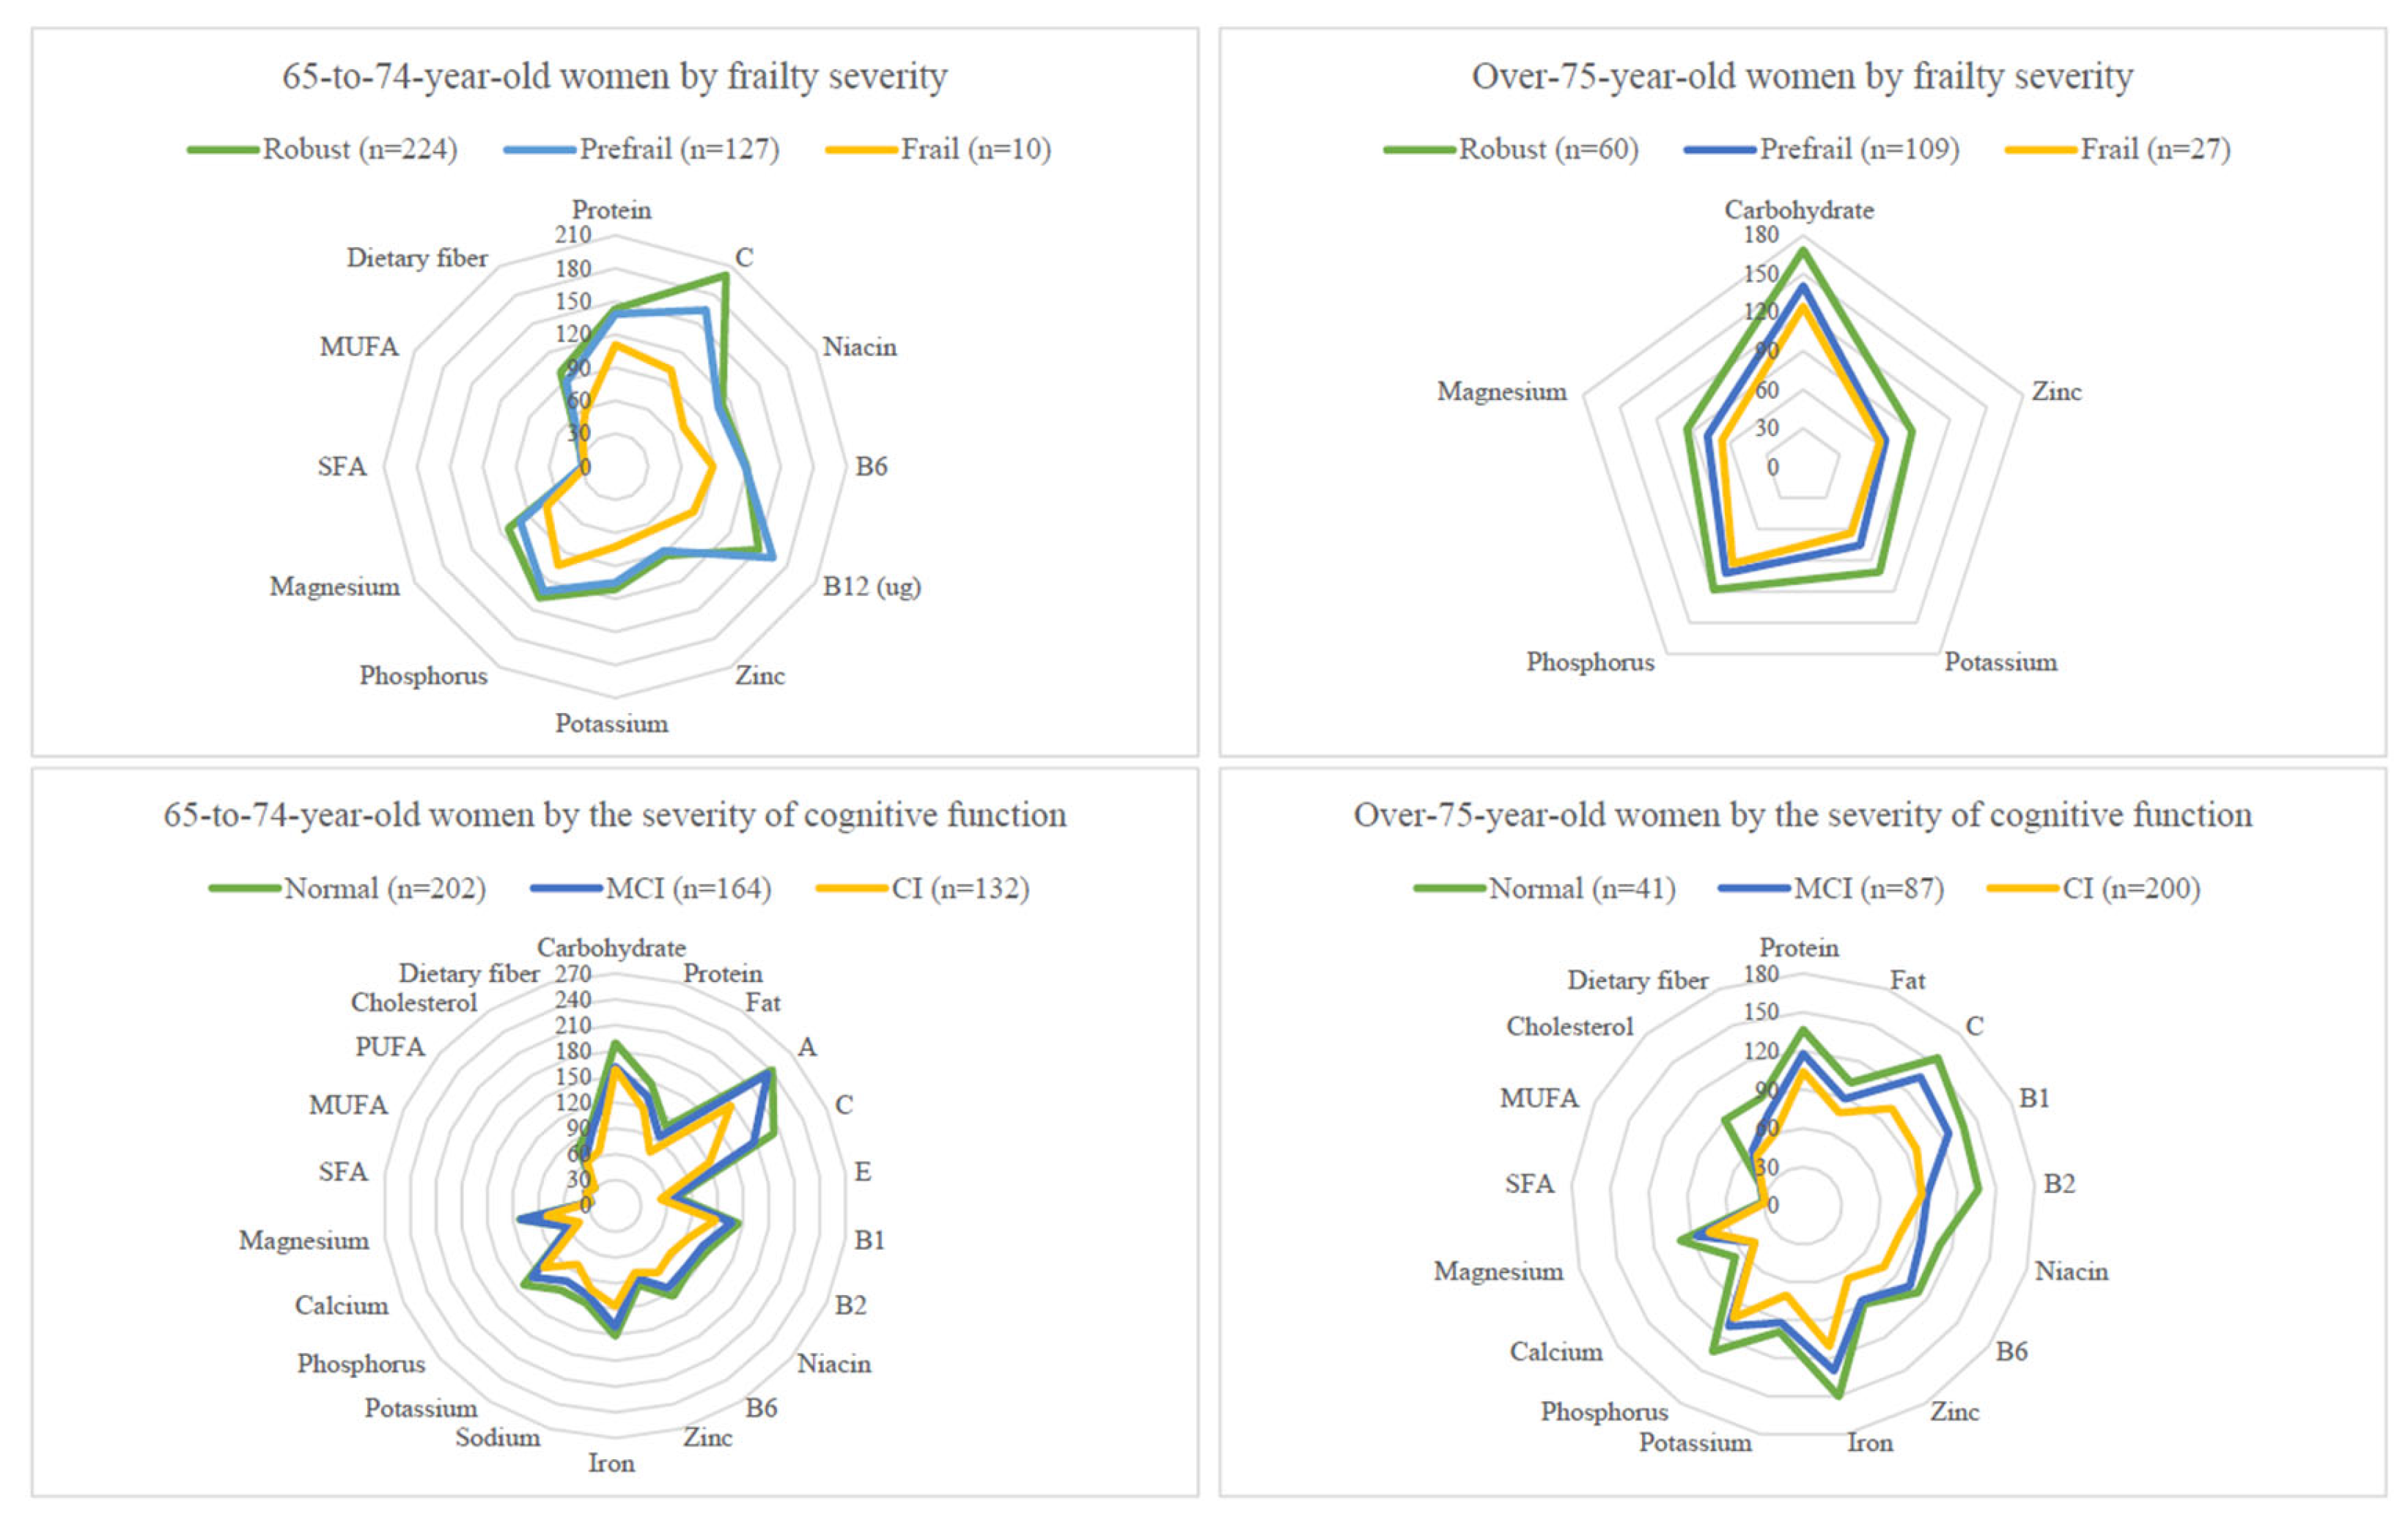
Age-adjusted nutrient intake means and standard errors by age and by geriatric syndrome groups (frailty or cognitive impairment) in men and women are shown in Supplementary Tables S1–S8. For presentation clarity, only nutrient intake levels with a significant P value for trends after age and energy adjustment, expressed as percentage RDAs, by age and geriatric syndrome groups in men and women are shown in Figure 1 and Figure 2.

3.1. Total Energy Intake Levels by Sex, Age, and Geriatric Syndrome Subgroups

Total energy intakes were significantly decreased with the severity of frailty (P for trend = 0.001) and cognitive impairment (P for trend < 0.0001), respectively (Table 1). However, the decreasing trends were significant (or significant at borderline) in the 65-to-74 year-old age group and in over-75-year-old women, but not in men, with respect to the two geriatric syndromes. In addition, we observed significant sex (both Ps < 0.0001) but no age differences in the total energy intake levels (Table 1).

3.2. Nutrient Intake Levels by Sex, Age, and Geriatric Syndrome Subgroups

With respect to either frailty or CI, intake levels of multiple nutrients decreased with the severity. The number of nutrient inadequacies in the 65-to-74-year-old age group outweighed that of the over-75-year-old age group for frailty and CI. Details are described below.

3.3. Frailty

Nutrients that were significantly lowered with the advanced stage of frailty in the 65-to-74-year-old men group included vitamin C, dietary fibre, phosphorus, calcium, magnesium (all Ps for trend <0.0001 for these five nutrients), protein and PUFA (both Ps for trend <0.001), vitamin B1, niacin, B6, and E, sodium, potassium, iron, zinc, and MUFA (all Ps for trend <0.05 for these 9 nutrients) (Supplementary Table S1). In the over-75-year-old men group, two nutrients (vitamin B6 and zinc) were significantly lowered in the frail (both Ps for trend <0.05) compared with the robust (Supplementary Table S1).
In the 65-to-74-year-old women, the nutrients consumed significantly less with advanced frailty levels included niacin and vitamin C (both Ps for trend <0.0001), magnesium and dietary fibre (both Ps for trend <0.001), protein, fatty acids (SFA and MUFA), vitamins (B6 and B12), potassium, phosphorus, and zinc (all Ps for trend <0.05) (Supplementary Table S3). In the over-75-year-old women, frailty was associated with carbohydrate, phosphorus, potassium, magnesium, and zinc (all Ps for trend <0.05) (Supplementary Table S3).
Many significant trends with the nutrients described above disappeared after adjusting the total energy intake. Nutrients consistently associated in two or more of the four age–sex groups included potassium, magnesium, dietary fibre, and vitamin C (Figure 1 and Figure 2).

3.4. Cognitive Impairment

Significant trends of lower intakes of vitamin E and B2, potassium, and magnesium (all Ps for trend <0.05) were detected with severity of CI in the 65-to-74-year-old men (Supplementary Table S2). In the over-75-year-old men, vitamin C (P for trend = 0.028) and dietary fibre (P for trend <0.001) had significantly lower trends in those with a higher degree of CI (Supplementary Table S2).
Nutrients consumed significantly less with the advancement of CI stages in the 65-to-74-year-old women included fat, SFA, potassium, magnesium, dietary fibre, niacin, and vitamin B6 (all Ps for trend <0.0001), carbohydrate, fatty acids (MUFA and PUFA), phosphorus, and vitamin C (all Ps for trend <0.001) (Supplementary Table S4). Significance levels were slightly less for protein, vitamins (B1, B2, A, and E), sodium, calcium, iron and zinc, and cholesterol (all Ps for trend <0.05). In the over-75-year-old women, significant ones were protein, fat, fatty acids (SFA and MUFA), dietary fibre, vitamins (B1, B2, niacin, B6, and C), potassium, phosphorus, calcium, magnesium, iron and zinc, and cholesterol (all Ps for trend <0.05) (Supplementary Table S4).
Again, after adjusting the total energy intake, most significant trends between nutrients and CI disappeared. Nutrients consistently associated in two or more of the four age–sex groups included potassium, dietary fibre, and vitamin C (Figure 1 and Figure 2).

3.5. Nutrient Intake Levels Per Kilogram of Body Weight by Sex, Age, and Geriatric Syndrome Subgroups

For either the robust or the normal cognition groups, the intakes of nutrients per kg of body weight were similar in both the 65-to-74-year-old and the over-75-year-old age group (Supplementary Tables S5–S8). However, intakes decreased with more advanced frailty and CI stages. The number of significant nutrients per kg of body weight were pretty similar to those of total nutrient intakes, including findings with or without energy adjustment.

3.6. Nutrients Not Reaching 75% DRIs in Elders with Pre-Frailty/Frailty or with MCI/CI

Among those nutrients with significantly decreasing trends across the severity of frailty, zinc, potassium, magnesium, and dietary fibre did not reach 75% DRIs in elders with pre-frailty/frailty in two or more of the age–sex groups.
As for elders with MCI/CI, vitamin E, potassium, calcium, magnesium, and dietary fibre did not reach 75% DRIs in two or more of the age–sex groups.

3.7. Dietary Pattern by Geriatric Syndrome Subgroups

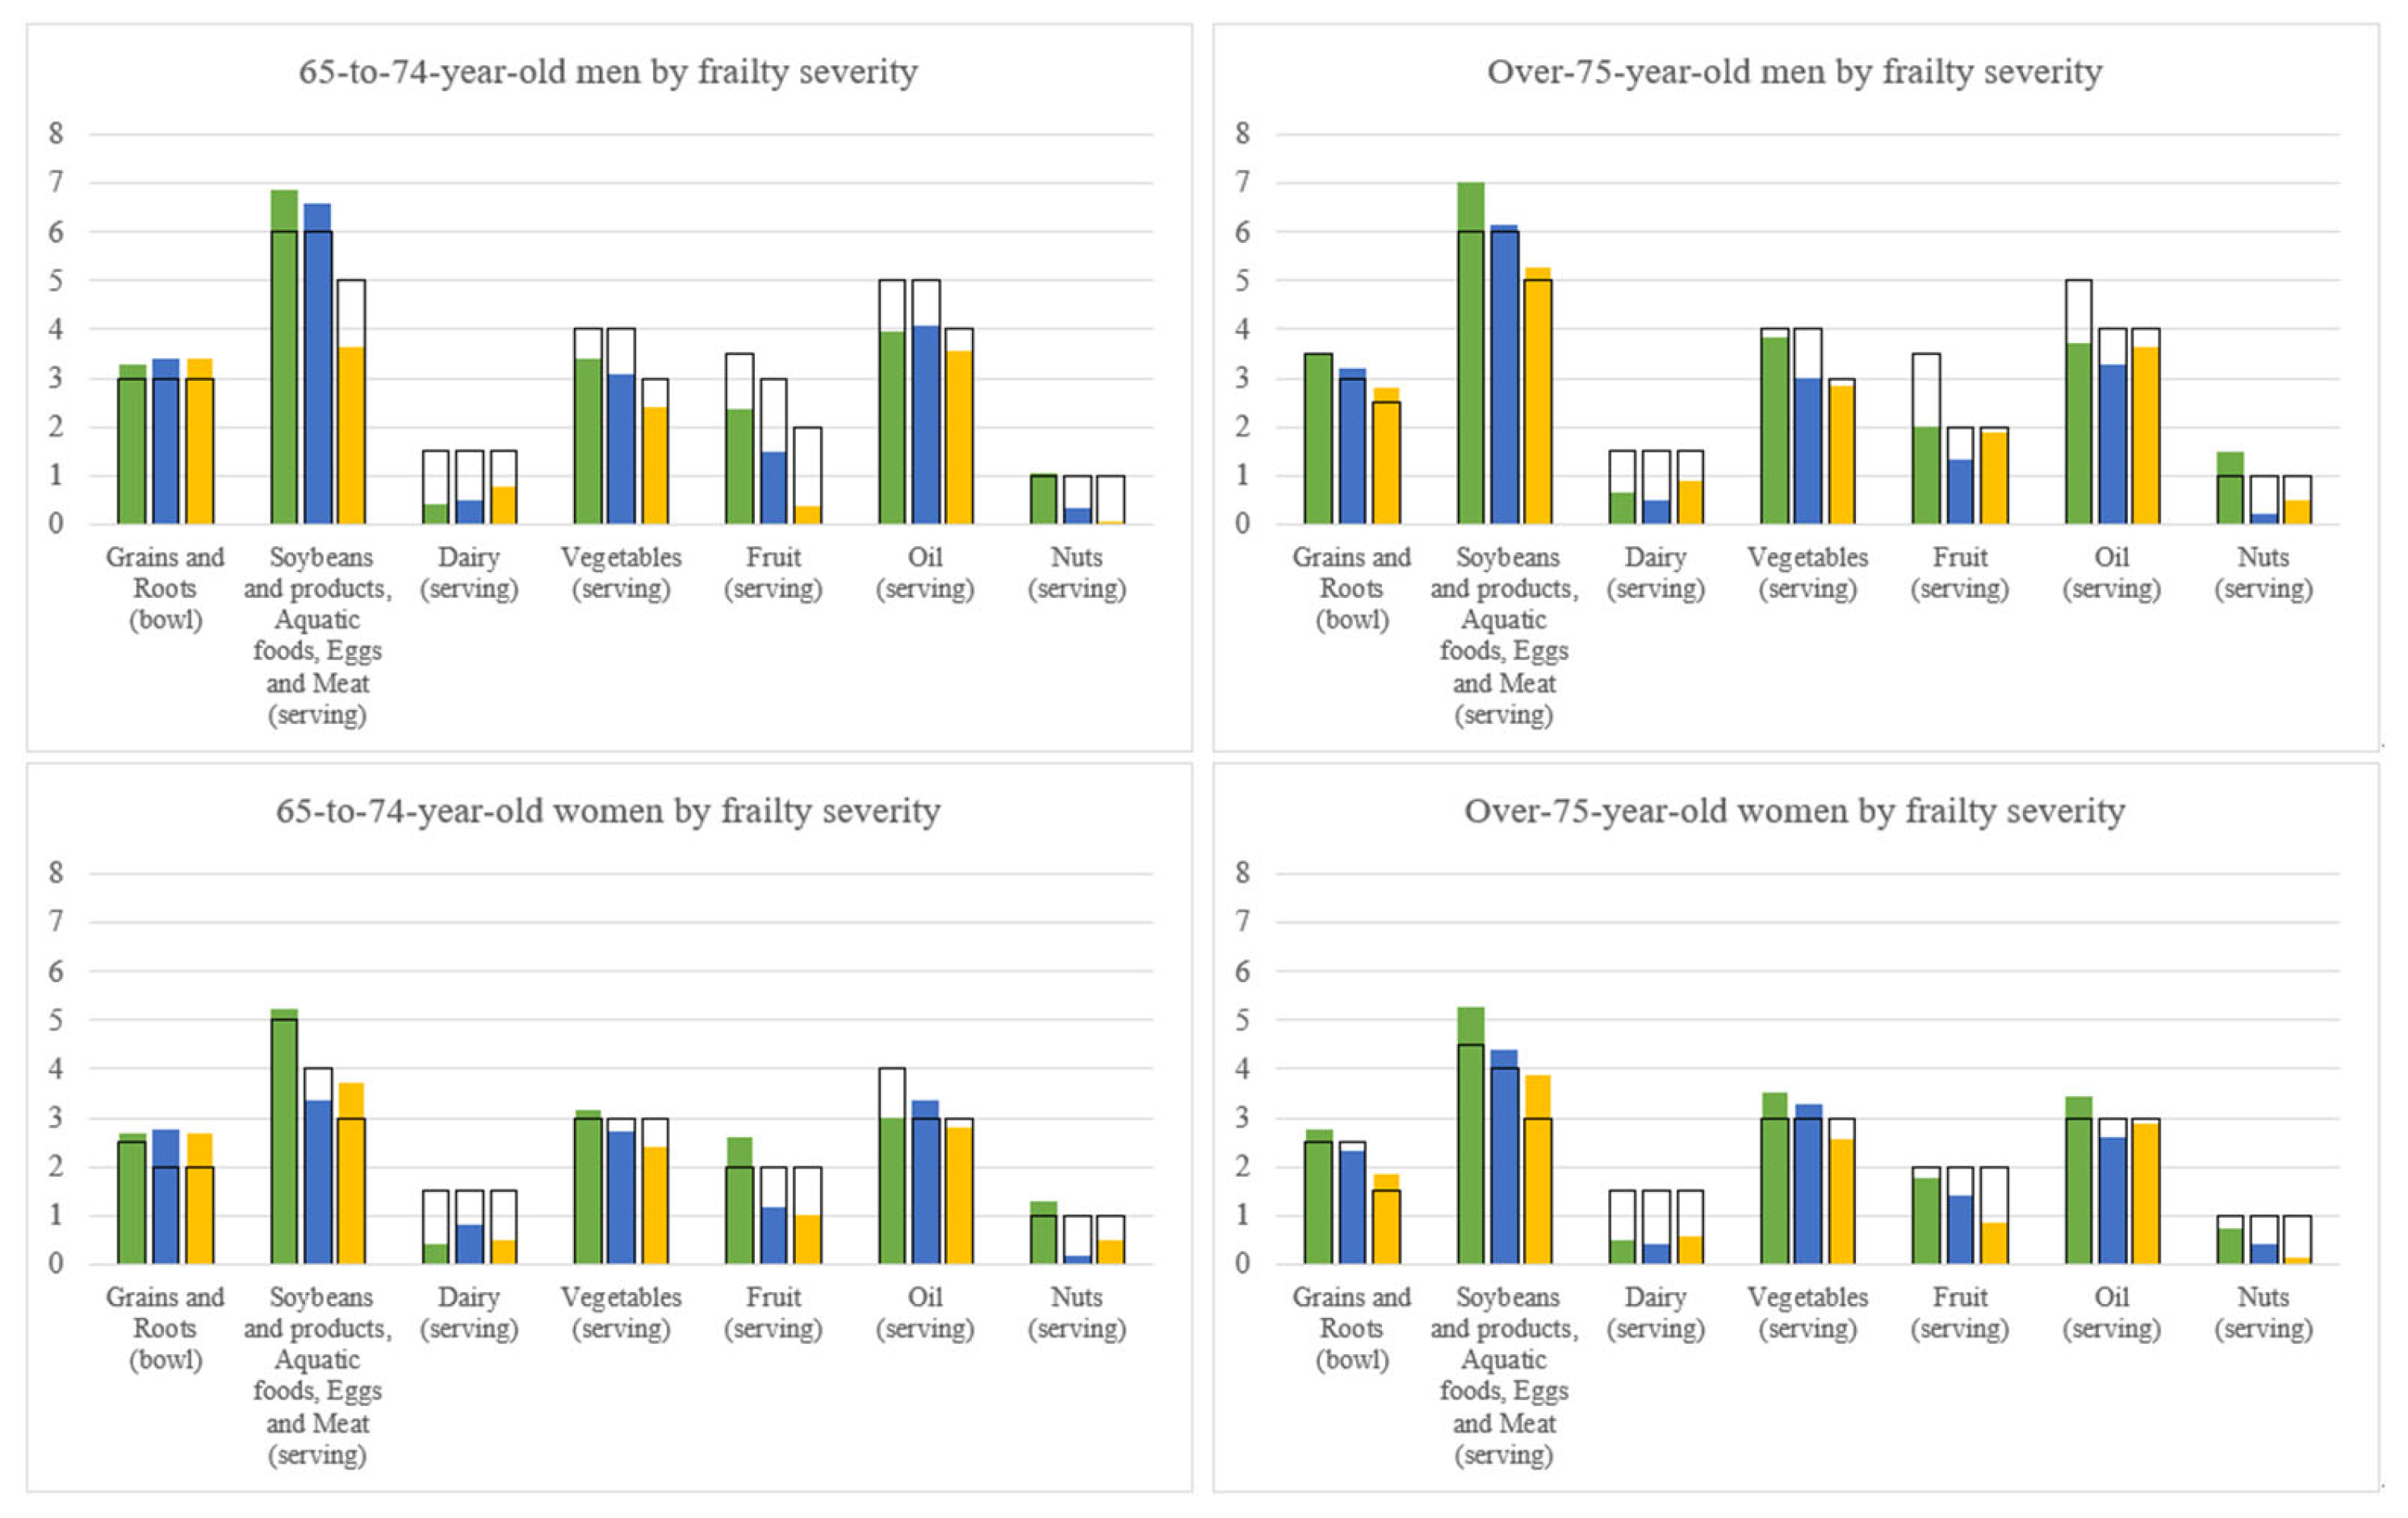
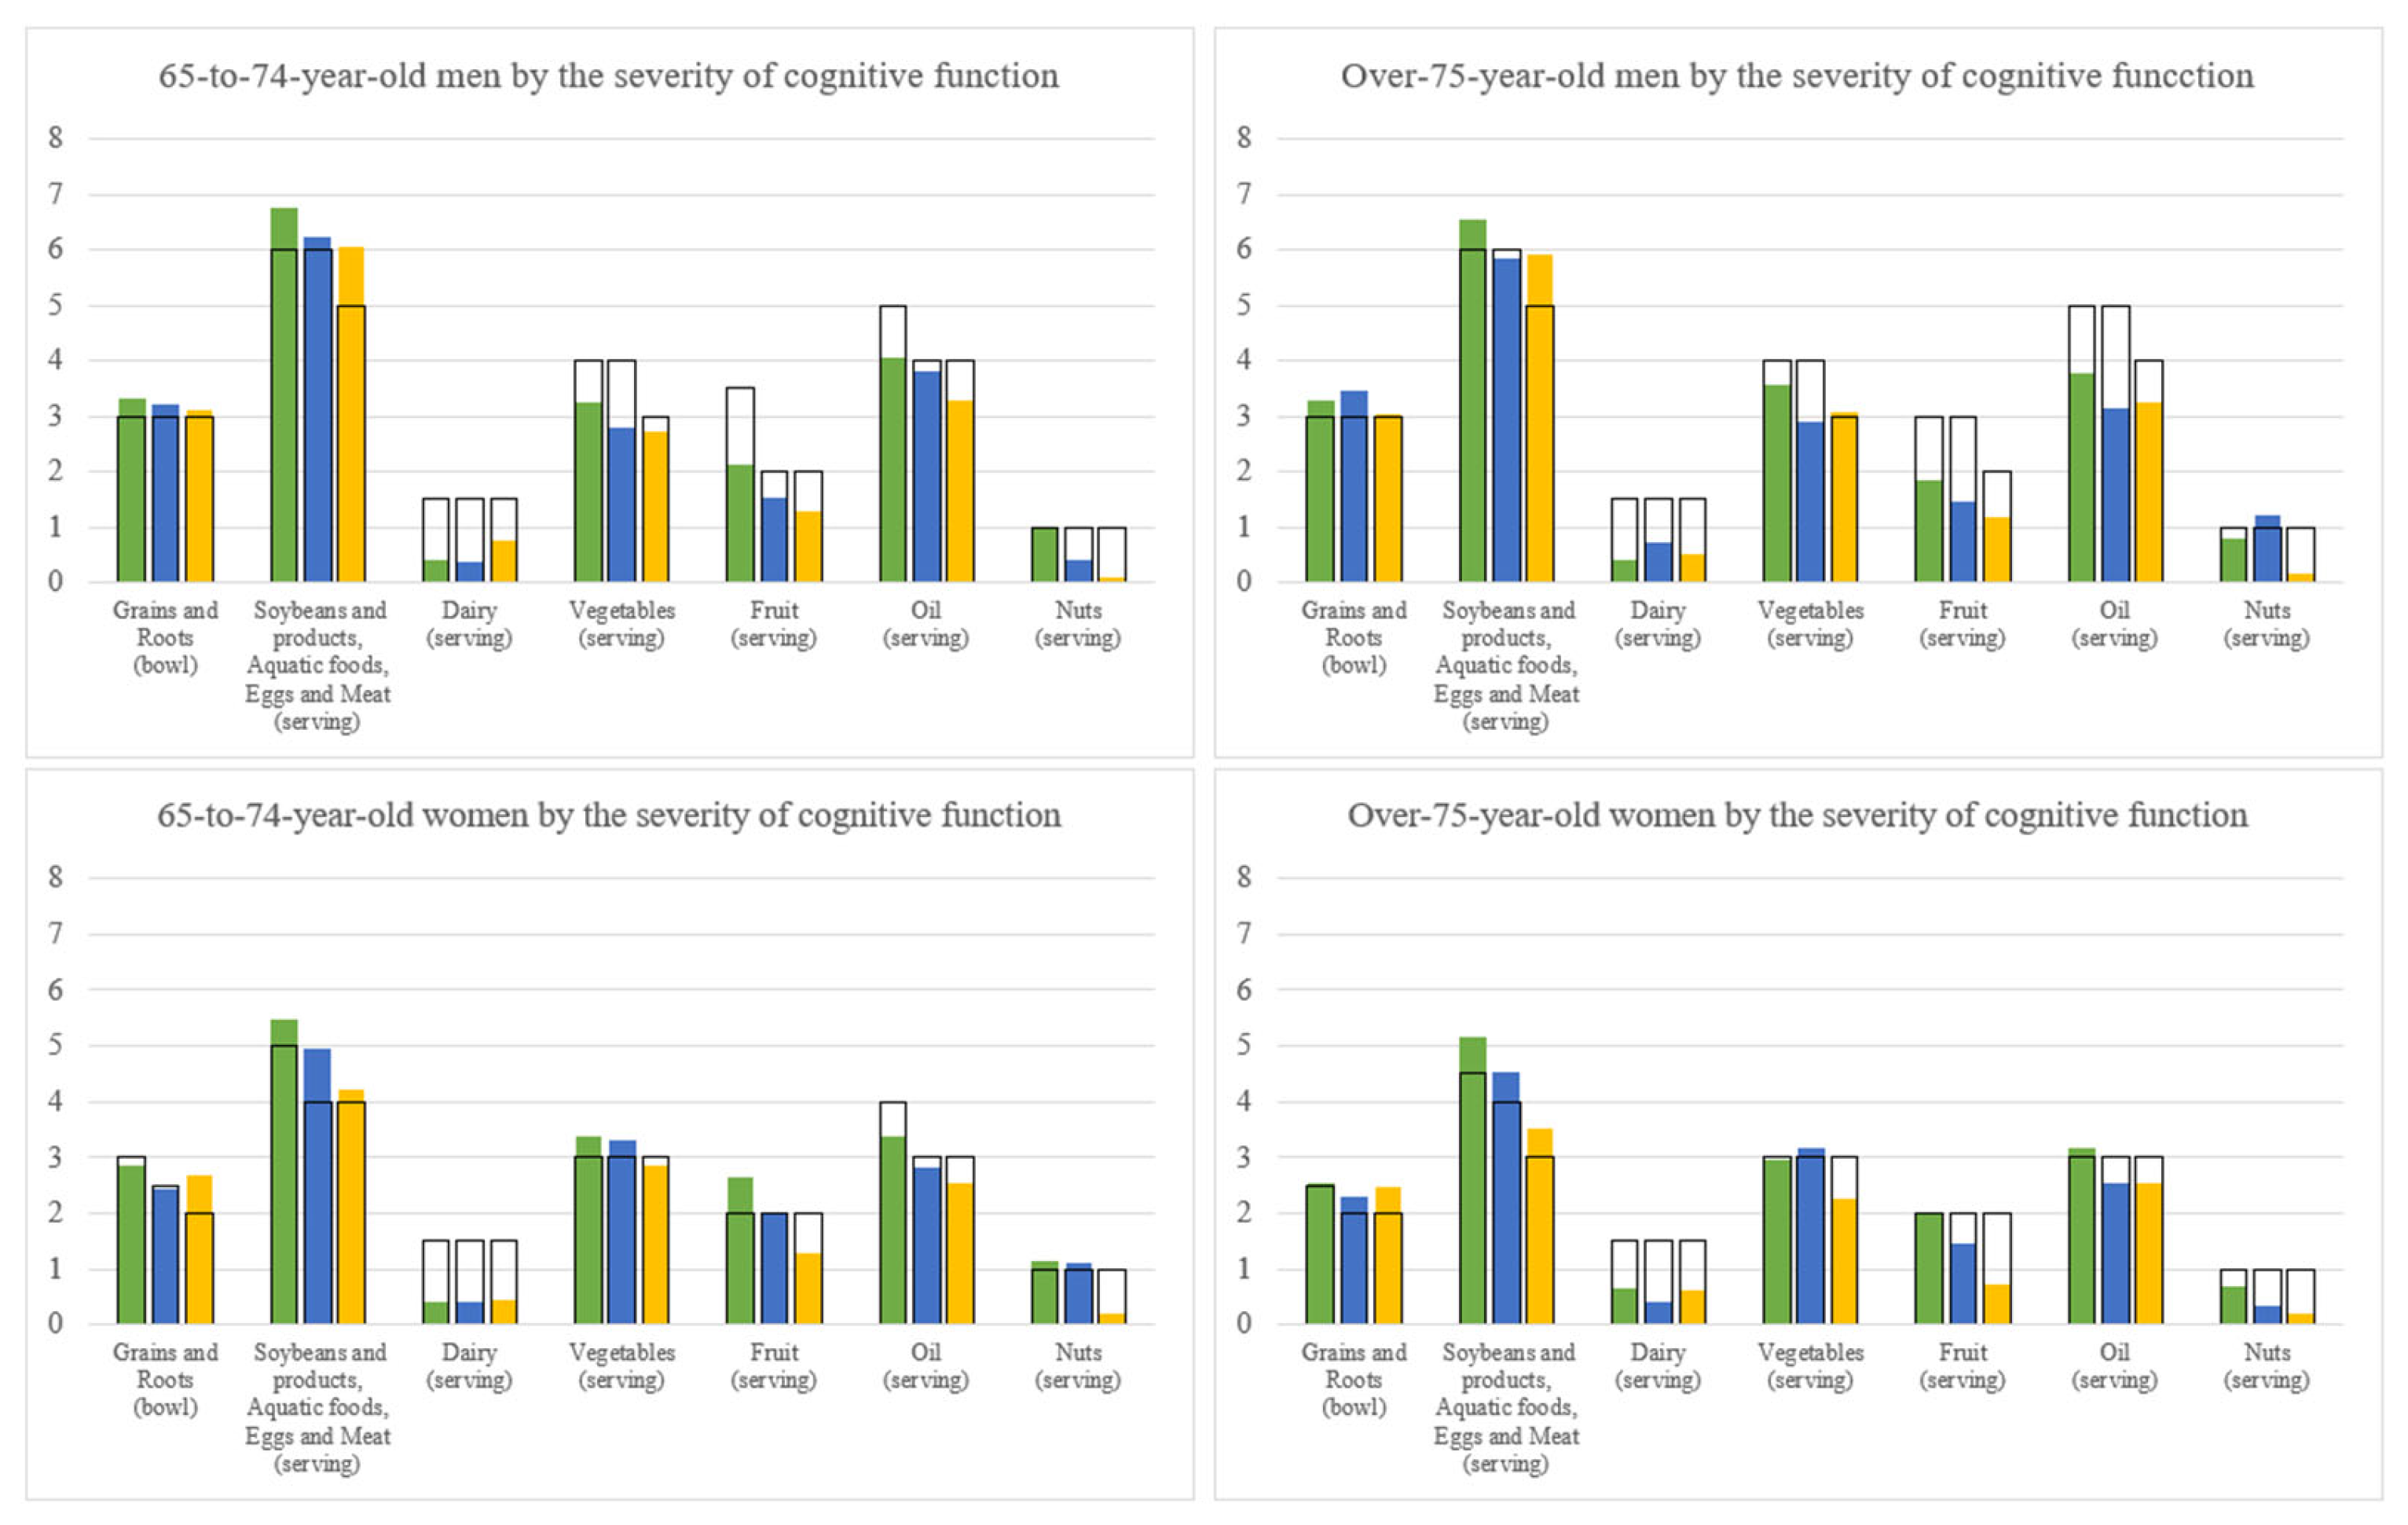
Figure 3 shows the number of servings of the six major food groups by frailty severity. For comparison purpose, the recommended numbers of serving of the six major food groups suggested by the Daily Food Guide of Taiwan according to the corresponding energy levels were also shown. Figure 4 is for cognitive function.
In the 65-to-74-year-old men and women, when compared with the robust group, the frail group consumed similar servings of grains and roots, but fewer servings in the other four food groups, i.e., protein-rich foods, vegetables, fruit, and nuts and oil. A small amount of dairy was consumed by all three frailty subgroups without consistent patterns. In the over-75-year-old men and women, when compared with the robust group, the frail group consumed less in all major food groups except dairy intake which was modest and similar in the three frailty levels. As for the cognitive function, the CI groups of all 65-to-74-year-old men, 65-to-74-year-old women, over-75-year-old men, and over-75-year-old women consumed fewer servings than the normal groups in all major food groups except dairy.
When compared with the Daily Food Guide, the frail and the CI adults consumed more grains and roots, but mostly fewer servings of dairy, vegetables, fruit, and nuts and oil than the recommendations for their specific energy level. With respect to protein-rich foods (soybeans and products, fish, eggs, or meat), all sex and age groups with geriatric syndromes, except for the 65-to-74-year-old frail men, consumed more than the recommended servings given their energy intake level.

4. Discussion

Using data from 2014–2017 NAHSIT, we found that the more severe the frailty or CI level, the lower the intakes of foods, energy as well as multiple nutrients, including macronutrients, multiple vitamins, and minerals. Findings on energy intake and nutrient intake per kg of body weight are not much different from those of the total intake. Most of the significant associations between nutrients and frailty/CI disappeared after energy adjustment. Apparently, this is due to significant correlations between the intakes of these nutrients with total energy. A few nutrients, such as magnesium, potassium, vitamin C, and dietary fibre, remained significantly associated in some but not all age–sex subgroups, indicating a smaller intake of plant foods beyond that of total intakes. However, this did not appear in a consistent fashion in all sex–age groups. The associations between the decreased overall food intake and lower levels of multiple nutrients in those with geriatric syndromes point to the importance of examining the nutrient adequacy of these elders to ensure total wellbeing.
In the vicious cycle diagram of frailty development provided by Fried et al., they proposed that the gradual reduction of food intakes may play a role in the pathogenesis of the physical frailty phenotype [8]. Due to the cross-sectional nature of our analysis, we could not conclude that it is the lower intake of foods which predispose the risk of frailty or MCI, although several prospective studies suggest so. The following studies have reported the significant association between low energy intake and incident frailty to the best of author’s knowledge. An Italian study (sample size = 802, age ≥ 65 years) reported the ORs (95% confidence interval) of total energy intake less than 21 Kcal per kg of body weight (the lowest quintile of the distribution of energy) for frailty was 1.24 (1.02–1.5) [18]. Another British study which included 76 migrant women (age ≥ 60 years) reported the ORs (95% confidence interval) of less than 13 Kcal per kg of body weight (the lowest quintile of the distribution of energy) for frailty was 11.71 (2.36–57.97) [19]. In addition, a Rotterdam study demonstrated that every increase of 100 Kcal in energy intake, but not protein specifically, is associated with 5% lowered ORs of frailty (95% confidence interval, 0.93 to 0.97) [20]. Another Japanese study reported a significantly reversed J-shaped association between the energy intake calibrated with doubly labelled water and the prevalence of physical frailty among community-dwelling older adults [21]. The lowest prevalence of frailty was found to be at approximately 40 Kcal/day/kg ideal body weight. A systematic review included 13 intervention studies and concluded that protein–energy supplementation tended to be effective only in malnourished older adults, and the effects of micronutrient supplementation on frailty were inconclusive [22]. Another meta-analysis of 12 cross-sectional and 5 longitudinal studies found that protein intake, whether absolute, adjusted, or relative to total energy intake, was not significantly associated with frailty in older adults [23]. These results suggest insufficient energy intake might cause lower protein intake which in turn increases the risk of frailty.
For cognition impairment, a recent published meta-analysis of seven studies (total sample size = 808) on Alzheimer’s disease indicates no difference in energy intake between the patients and controls [24]. A recent review article suggested that no single food or nutrient could prevent dementia or cognitive decline, although some of them have shown potential neuroprotective functions [25]. Our cross-sectional study showed low intakes of total energy in MCI elders. We recognize the importance to carry out more prospective investigations.
Findings on lower incidence of frailty in elders with low intake of total energy or foods do not negate the importance of dietary quality. Several previous studies have investigated dietary patterns and frailty and/or cognitive decline [26,27,28,29,30]. The majority have suggested that adhering to a Mediterranean dietary pattern is protective against frailty and dementia [26,27,30,31]. With respect to Asians, including Taiwanese, dietary patterns with more phytonutrient-rich plant foods (vegetable, fruit, nuts, and whole grain), protein-rich foods (dairy, poultry, eggs, soya, and seafood), and tea have been found to be associated with a lower risk of frailty as well as cognitive performance impairment [28,32,33,34]. Our previous intervention studies have demonstrated that a diet fulfilling the Daily Food Guide of Taiwan, i.e., satisfying individualized caloric level and protein requirements, could significantly regress frailty stage and geriatric depression score [35,36]. It is worth noting that the beneficial effect of such a diet may be enlarged when nutrition intervention is combined with physical activity modules [37]. These results of dietary pattern and intervention studies demonstrate the synergistic effects of multiple nutrients with a wide range of physiological functions for preventing frailty and cognitive decline.
With respect to nutrients of low intakes, we found that zinc, potassium, magnesium, and dietary fibre did not reach 75% DRIs in elders with pre-frailty/frailty in two or more of the age– sex groups and, for elders with MCI/CI, vitamin E, potassium, calcium, magnesium, and dietary fibre did not. This may indicate that the plant foods such as vegetables, fruits, and nuts should be worthy of attention, although a causal relationship is not known. One recently reported meta-analysis, including 10 cohorts and 4 cross-sectional studies, showed an inverse association between increment in fruit and vegetables intake and lowered risk of frailty [37]. Frailty risk was reduced by 14% by every serving (200 g) of fruit and vegetables per day with up to 3.5 servings. However, the protection was not observed when fruits and vegetables were separately analyzed. Another meta-analysis including 16 studies with a cross-sectional, cohort, and case-control study design also showed the protective effect of consuming fruit and vegetables alone and together on cognitive disorders in older adults [38]. These results revealed the importance of increasing nutrient density by consuming more fruits and vegetables in the elderly. Food group analysis showed that both frailty or CI elders tended to eat relatively more rice but less amounts of other food groups, again supporting the importance of increasing nutrient density from eating nutrient dense foods. An effective approach for preventing geriatric syndromes would be for elders to consume, on the basis of individualized caloric levels, palatable local gourmet made with properly balanced whole foods.
Several limitations of this study should be noted. First, NAHSIT is a cross-sectional study, which cannot conclude on causality. Second, as compared with the sample size of robust and pre-frail groups, the sample size of the frail group was relatively small and thus may limit the statistical power. This has also limited us to exclude participants with both frailty and CI when carrying out the analysis of the counterpart. Third, the 24-hour diet recall is highly dependent upon one’s memory, which could have produced some systematic biases and non-differentiable misclassifications.

5. Conclusions

In conclusion, we demonstrated that Taiwanese elders with frailty or with CI are likely to consume lower levels of total energy as well as multiple nutrients, and multiple nutrient insufficiencies are likely due to the lower level of food intakes. It is essential to boost up appetite and the quality of foods consumed by these elders to ensure health and total wellbeing, particularly for some nutrients with low percentage DRIs such as zinc, potassium, magnesium, fiber, calcium, and vitamin E. Further intervention research focusing on appetite and dietary means to increase nutrient density is highly warranted.

Supplementary Materials

The following supporting information can be downloaded at: https://www.mdpi.com/article/10.3390/nu14245216/s1, Table S1: Total energy and nutrients intakes for the older men by frailty levels in 2014–2017 NAHSIT. Table S2: Total energy and nutrients intakes for the older men by stages of cognitive ability in 2014–2017 NAHSIT. Table S3: Total energy and nutrients intakes for the older women by frailty levels in 2014–2017 NAHSIT. Table S4: Total energy and nutrients intakes for the older women by stages of cognitive ability in 2014–2017 NAHSIT. Table S5: Total energy and nutrients intakes per kilogram of body weight for the older men by frailty levels in 2014–2017 NAHSIT. Table S6: Total energy and nutrients intakes per kilogram of body weight for the older men by stages of cognitive ability in 2014–2017 NAHSIT. Table S7: Total energy and nutrients intakes per kilogram of body weight for the older women by frailty levels in 2014–2017 NAHSIT. Table S8: Total energy and nutrients intakes per kilogram of body weight for the older women by stages of cognitive ability in 2014–2017 NAHSIT.

Author Contributions

Conceptualization, W.-H.P.; Data curation, N.-H.Y., C.-F.W. and S.-Y.H.; Formal analysis, S.-Y.W.; Investigation, N.-H.Y., C.-F.W. and S.-Y.H.; Methodology, S.-J.W. and W.-H.P.; Project administration, S.-C.L.; Supervision, W.-H.P.; Validation, S.-J.W.; Visualization, S.-C.L.; Writing—original draft, S.-Y.W. and W.-H.P.; Writing—review & editing, W.-H.P. All authors have read and agreed to the published version of the manuscript.

Funding

This work was supported by grants from Academia Sinica and the Health Promotion Administration (HPA), Ministry of Health and Welfare (grant number: MOHW111-HPA-H-113-124712, MOHW106-HPA-M-114-133401), Taiwan. The content of this research does not represent the opinion of Academia Sinica and HPA.

Institutional Review Board Statement

The study was conducted in accordance with the Declaration of Helsinki, and approved by the Institutional Review Board of Biomedical Science Research, Academia Sinica (project AS-IRB01-13067, approved on 9 January 2014).

Informed Consent Statement

Informed consent was obtained from all subjects involved in the study.

Data Availability Statement

Data of Nutrition and Health Survey from Taiwan described in the manuscript belong to HPA, which can be accessed in data center with the permission of HPA.

Acknowledgments

We would like to thank all volunteers who took part in the study and thank all of the interviewers and all of those who assisted the survey in various local sites.

Conflicts of Interest

The authors declare no conflict of interest.

References

  1. Fabrício, D.M.; Chagas, M.H.N.; Diniz, B.S. Frailty and cognitive decline. Transl. Res. 2020, 221, 58–64. [Google Scholar] [CrossRef] [PubMed]
  2. Robertson, D.A.; Savva, G.M.; Kenny, R.A. Frailty and cognitive impairment—A review of the evidence and causal mechanisms. Ageing Res. Rev. 2013, 12, 840–851. [Google Scholar] [CrossRef] [PubMed]
  3. Panza, F.; Seripa, D.; Solfrizzi, V.; Tortelli, R.; Greco, A.; Pilotto, A.; Logroscino, G. Targeting Cognitive Frailty: Clinical and Neurobiological Roadmap for a Single Complex Phenotype. J. Alzheimer’s Dis. JAD 2015, 47, 793–813. [Google Scholar] [CrossRef] [PubMed]
  4. Panza, F.; Solfrizzi, V.; Seripa, D.; Imbimbo, B.P.; Capozzo, R.; Quaranta, N.; Pilotto, A.; Logroscino, G. Age-related hearing impairment and frailty in Alzheimer’s disease: Interconnected associations and mechanisms. Front. Aging Neurosci. 2015, 7, 113. [Google Scholar] [CrossRef] [PubMed]
  5. Gomez-Gomez, M.E.; Zapico, S.C. Frailty, Cognitive Decline, Neurodegenerative Diseases and Nutrition Interventions. Int. J. Mol. Sci. 2019, 20, 2842. [Google Scholar] [CrossRef] [Green Version]
  6. Kelaiditi, E.; Cesari, M.; Canevelli, M.; van Kan, G.A.; Ousset, P.J.; Gillette-Guyonnet, S.; Ritz, P.; Duveau, F.; Soto, M.E.; Provencher, V.; et al. Cognitive frailty: Rational and definition from an (I.A.N.A./I.A.G.G.) international consensus group. J. Nutr. Health Aging 2013, 17, 726–734. [Google Scholar] [CrossRef]
  7. Pilgrim, A.L.; Robinson, S.M.; Sayer, A.A.; Roberts, H.C. An overview of appetite decline in older people. Nurs. Older People 2015, 27, 29–35. [Google Scholar] [CrossRef]
  8. Fried, L.P.; Tangen, C.M.; Walston, J.; Newman, A.B.; Hirsch, C.; Gottdiener, J.; Seeman, T.; Tracy, R.; Kop, W.J.; Burke, G.; et al. Frailty in older adults: Evidence for a phenotype. J. Gerontol. A Biol. Sci. Med. Sci. 2001, 56, M146–M156. [Google Scholar] [CrossRef]
  9. Wu, S.Y.; Yeh, N.H.; Chang, H.Y.; Wang, C.F.; Hung, S.Y.; Wu, S.J.; Pan, W.H. Adequate protein intake in older adults in the context of frailty: Cross-sectional results of the Nutrition and Health Survey in Taiwan 2014–2017. Am. J. Clin. Nutr. 2021, 114, 649–660. [Google Scholar] [CrossRef]
  10. Tu, S.H.; Chen, C.; Hsieh, Y.T.; Chang, H.Y.; Yeh, C.J.; Lin, Y.C.; Pan, W.H. Design and sample characteristics of the 2005–2008 Nutrition and Health Survey in Taiwan. Asia Pac. J. Clin. Nutr. 2011, 20, 225–237. [Google Scholar]
  11. Health Promotion Administration; Ministry of Health and Welfare. Taiwan. Daily Food Guide; Health Promotion Administration; Ministry of Health and Welfare: Taipei, Taiwan, 2011.
  12. Guo, N.W.; Liu, H.C.; Wong, P.F.; Liao, K.K.; Yan, S.H.; Lin, K.P.; Chang, C.Y.; Hsu, T.C. Chinese Version and Norms of the Mini-Mental State Examination. J. Rehab. Med. 1988, 16, 52–59. [Google Scholar]
  13. Tsai, J.C.; Chen, C.W.; Chu, H.; Yang, H.L.; Chung, M.H.; Liao, Y.M.; Chou, K.R. Comparing the Sensitivity, Specificity, and Predictive Values of the Montreal Cognitive Assessment and Mini-Mental State Examination When Screening People for Mild Cognitive Impairment and Dementia in Chinese Population. Arch. Psychiatr. Nurs. 2016, 30, 486–491. [Google Scholar] [CrossRef] [PubMed]
  14. Health Promotion Administration, Ministry of Health and Welfare, Taiwan. Taiwanese Dietary Reference Intakes: The 8th Version. Available online: https://www.hpa.gov.tw/Pages/Detail.aspx?nodeid=4248&pid=12285 (accessed on 14 September 2022).
  15. Health Promotion Administration, Ministry of Health and Welfare, Taiwan. Salt Reduction Tips Handbook. Available online: https://www.hpa.gov.tw/Pages/EBook.aspx?nodeid=1160 (accessed on 14 September 2022).
  16. National Academies of Sciences, Engineering, and Medicine; Health and Medicine Division; Food and Nutrition Board; Committee to Review the Dietary Reference Intakes for Sodium and Potassium. Dietary Reference Intakes for Sodium and Potassium; Oria, M., Harrison, M., Stallings, V.A., Eds.; National Academies Press: Washington, DC, USA, 2019. [Google Scholar]
  17. Jahns, L.; Davis-Shaw, W.; Lichtenstein, A.H.; Murphy, S.P.; Conrad, Z.; Nielsen, F. The History and Future of Dietary Guidance in America. Adv. Nutr. 2018, 9, 136–147. [Google Scholar] [CrossRef] [PubMed] [Green Version]
  18. Bartali, B.; Frongillo, E.A.; Bandinelli, S.; Lauretani, F.; Semba, R.D.; Fried, L.P.; Ferrucci, L. Low nutrient intake is an essential component of frailty in older persons. J. Gerontol. A Biol. Sci. Med. Sci. 2006, 61, 589–593. [Google Scholar] [CrossRef] [PubMed]
  19. Castaneda-Gameros, D.; Redwood, S.; Thompson, J.L. Low Nutrient Intake and Frailty Among Overweight and Obese Migrant Women From Ethnically Diverse Backgrounds Ages 60 Years and Older: A Mixed-Methods Study. J. Nutr. Educ. Behav. 2017, 49, 3–10.e11. [Google Scholar] [CrossRef] [Green Version]
  20. Schoufour, J.D.; Franco, O.H.; Kiefte-de Jong, J.C.; Trajanoska, K.; Stricker, B.; Brusselle, G.; Rivadeneira, F.; Lahousse, L.; Voortman, T. The association between dietary protein intake, energy intake and physical frailty: Results from the Rotterdam Study. Br. J. Nutr. 2019, 121, 393–401. [Google Scholar] [CrossRef] [Green Version]
  21. Watanabe, D.; Yoshida, T.; Nanri, H.; Watanabe, Y.; Date, H.; Itoi, A.; Goto, C.; Ishikawa-Takata, K.; Sagayama, H.; Ebine, N.; et al. Association Between the Prevalence of Frailty and Doubly Labeled Water-Calibrated Energy Intake Among Community-Dwelling Older Adults. J. Gerontol. A Biol. Sci. Med. Sci. 2021, 76, 876–884. [Google Scholar] [CrossRef]
  22. Khor, P.Y.; Vearing, R.M.; Charlton, K.E. The effectiveness of nutrition interventions in improving frailty and its associated constructs related to malnutrition and functional decline among community-dwelling older adults: A systematic review. J. Hum. Nutr. Diet. Off. J. Br. Diet. Assoc. 2022, 35, 566–582. [Google Scholar] [CrossRef]
  23. Coelho-Junior, H.J.; Calvani, R.; Picca, A.; Tosato, M.; Landi, F.; Marzetti, E. Protein Intake and Frailty in Older Adults: A Systematic Review and Meta-Analysis of Observational Studies. Nutrients 2022, 14, 2767. [Google Scholar] [CrossRef]
  24. Doorduijn, A.S.; van de Rest, O.; van der Flier, W.M.; Visser, M.; de van der Schueren, M.A.E. Energy and Protein Intake of Alzheimer’s Disease Patients Compared to Cognitively Normal Controls: Systematic Review. J. Am. Med. Dir. Assoc. 2019, 20, 14–21. [Google Scholar] [CrossRef]
  25. Dominguez, L.J.; Veronese, N.; Vernuccio, L.; Catanese, G.; Inzerillo, F.; Salemi, G.; Barbagallo, M. Nutrition, Physical Activity, and Other Lifestyle Factors in the Prevention of Cognitive Decline and Dementia. Nutrients 2021, 13, 4080. [Google Scholar] [CrossRef] [PubMed]
  26. Coelho-Júnior, H.J.; Trichopoulou, A.; Panza, F. Cross-sectional and longitudinal associations between adherence to Mediterranean diet with physical performance and cognitive function in older adults: A systematic review and meta-analysis. Ageing Res. Rev. 2021, 70, 101395. [Google Scholar] [CrossRef] [PubMed]
  27. Ntanasi, E.; Charisis, S.; Yannakoulia, M.; Georgiadi, K.; Balomenos, V.; Kosmidis, M.H.; Dardiotis, Ε.; Hadjigeorgiou, G.; Sakka, P.; Maraki, M.; et al. Adherence to the Mediterranean diet and incident frailty: Results from a longitudinal study. Maturitas 2022, 162, 44–51. [Google Scholar] [CrossRef] [PubMed]
  28. Shiau, M.H.; Lee, M.C.; Lin, F.L.; Hurng, B.S.; Yeh, C.J. Cross-Sectional, Short-, Medium-, and Long-Term Effects of Dietary Pattern on Frailty in Taiwan. Int. J. Environ. Res. Public Health 2021, 18, 9717. [Google Scholar] [CrossRef]
  29. Rashidi Pour Fard, N.; Amirabdollahian, F.; Haghighatdoost, F. Dietary patterns and frailty: A systematic review and meta-analysis. Nutr. Rev. 2019, 77, 498–513. [Google Scholar] [CrossRef]
  30. van den Brink, A.C.; Brouwer-Brolsma, E.M.; Berendsen, A.A.M.; van de Rest, O. The Mediterranean, Dietary Approaches to Stop Hypertension (DASH), and Mediterranean-DASH Intervention for Neurodegenerative Delay (MIND) Diets Are Associated with Less Cognitive Decline and a Lower Risk of Alzheimer’s Disease-A Review. Adv. Nutr. 2019, 10, 1040–1065. [Google Scholar] [CrossRef] [Green Version]
  31. Ntanasi, E.; Yannakoulia, M.; Kosmidis, M.H.; Anastasiou, C.A.; Dardiotis, E.; Hadjigeorgiou, G.; Sakka, P.; Scarmeas, N. Adherence to Mediterranean Diet and Frailty. J. Am. Med. Dir. Assoc. 2018, 19, 315–322.e312. [Google Scholar] [CrossRef]
  32. Chuang, S.-Y.; Lo, Y.-L.; Wu, S.-Y.; Wang, P.-N.; Pan, W.-H. Dietary patterns and foods associated with cognitive function in Taiwanese elderly: The cross-sectional and longitudinal studies. J. Am. Med. Directors Assoc. 2019, 20, 544–550. [Google Scholar] [CrossRef]
  33. Lo, Y.L.; Hsieh, Y.T.; Hsu, L.L.; Chuang, S.Y.; Chang, H.Y.; Hsu, C.C.; Chen, C.Y.; Pan, W.H. Dietary Pattern Associated with Frailty: Results from Nutrition and Health Survey in Taiwan. J. Am. Geriatr. Soc. 2017, 65, 2009–2015. [Google Scholar] [CrossRef]
  34. Pan, W.-H.; Wu, S.-Y.; Yeh, N.-H.; Hung, S.-Y. Healthy Taiwanese Eating Approach (TEA) toward Total Wellbeing and Healthy Longevity. Nutrients 2022, 14, 2774. [Google Scholar] [CrossRef]
  35. Hsieh, T.J.; Su, S.C.; Chen, C.W.; Kang, Y.W.; Hu, M.H.; Hsu, L.L.; Wu, S.Y.; Chen, L.; Chang, H.Y.; Chuang, S.Y.; et al. Individualized home-based exercise and nutrition interventions improve frailty in older adults: A randomized controlled trial. Int. J. Behav. Nutr. Phys. Act. 2019, 16, 119. [Google Scholar] [CrossRef] [PubMed] [Green Version]
  36. Wu, S.Y.; Hsu, L.L.; Hsu, C.C.; Hsieh, T.J.; Su, S.C.; Peng, Y.W.; Guo, T.M.; Kang, Y.W.; Pan, W.H. Dietary education with customised dishware and food supplements can reduce frailty and improve mental well-being in elderly people: A single-blind randomized controlled study. Asia Pac. J. Clin. Nutr. 2018, 27, 1018–1030. [Google Scholar] [CrossRef] [PubMed]
  37. Ghoreishy, S.M.; Asoudeh, F.; Jayedi, A.; Mohammadi, H. Fruit and vegetable intake and risk of frailty: A systematic review and dose response meta-analysis. Ageing Res. Rev. 2021, 71, 101460. [Google Scholar] [CrossRef] [PubMed]
  38. Zhou, Y.; Wang, J.; Cao, L.; Shi, M.; Liu, H.; Zhao, Y.; Xia, Y. Fruit and Vegetable Consumption and Cognitive Disorders in Older Adults: A Meta-Analysis of Observational Studies. Front. Nutr. 2022, 9, 871061. [Google Scholar] [CrossRef]
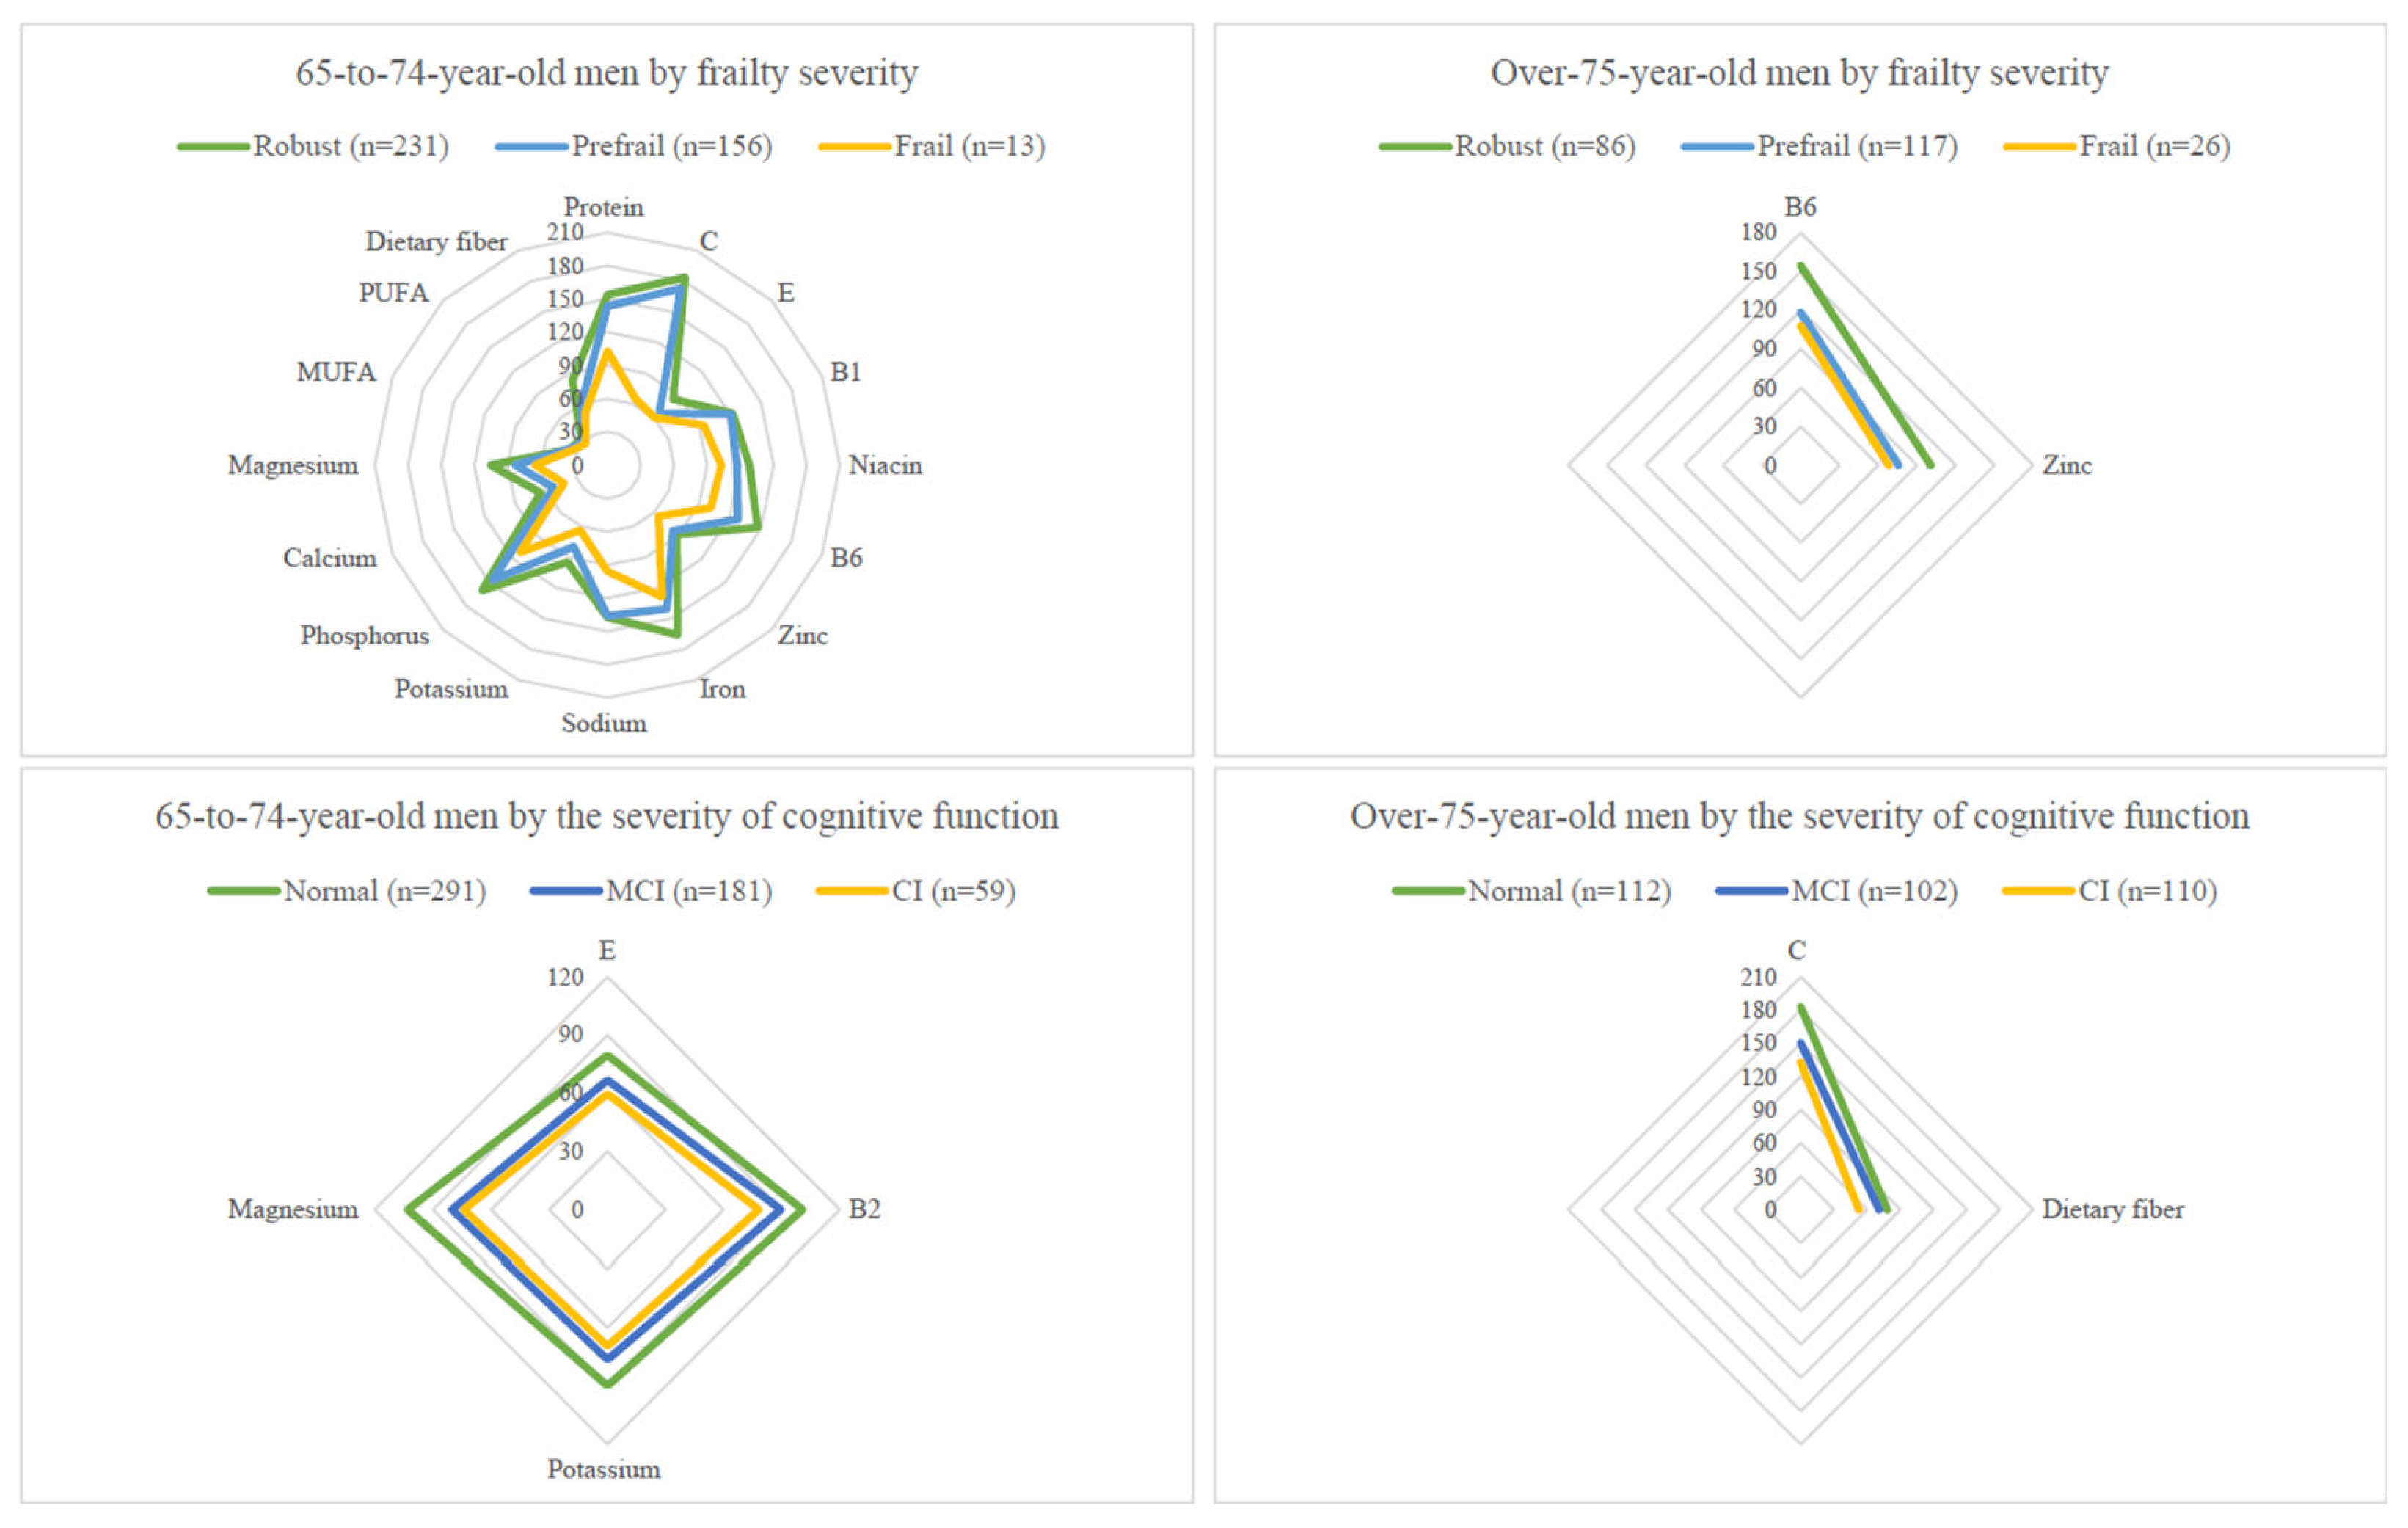
Figure 1. Comparing nutrient intake levels (presented as % RDA) across geriatric syndrome subgroups in men. Top: Total energy and nutrients intakes (presented as % RDA) by three frailty subgroups and by two age groups in men. Bottom: Total energy and nutrients intakes (presented as % RDA) by three CI subgroups and by two age groups in men. The trend test was performed by using the general linear model to test whether the mean of each nutrient variable has an ordered relationship across either the three frailty subgroups or three CI subgroups when age was adjusted.
Nutrients 14 05216 g001
Figure 2. Comparing nutrient intake levels (presented as % RDA) across geriatric syndrome subgroups in women. Top: Total energy and nutrients intakes (presented as % RDA) by three frailty subgroups and by two age groups in women. Bottom: Total energy and nutrients intakes (presented as % RDA) by three CI subgroups and by two age groups in women. The trend test was performed by using the general linear model to test whether the mean of each nutrient variable has an ordered relationship across either the three frailty subgroups or three CI subgroups when age was adjusted.
Nutrients 14 05216 g002
Figure 3. Comparing dietary intake levels of the six food groups with the Daily Food Guide of Taiwan among frailty severity groups by sex and age groups. Top: The dietary intakes of the six food groups by three frailty subgroups and by two age groups in men. Bottom: The dietary intakes of the six food groups by three frailty subgroups and by two age groups in women. The robust is in green, the pre-frail is in blue, and the frail is in yellow. The blank bar (□) indicates the recommended number of servings of the six major food groups by the Daily Food Guide of Taiwan according to the corresponding energy levels.
Nutrients 14 05216 g003
Figure 4. Comparing dietary intake levels of the six food groups with the Daily Food Guide of Taiwan among the severity groups of cognitive function by sex and age groups. Top: The dietary intakes of the six food groups by three cognitive impairment (CI) subgroups and by two age groups in men. Bottom: The dietary intakes of the six food groups by three CI subgroups (the robust is in green, the pre-frail is in blue, and the frail is in yellow) and by two age groups in women. The normal cognitive function is in green, the mild CI is in blue, and the CI is in yellow. The blank bar (□) is the recommended number of servings of the six major food groups by the Daily Food Guide of Taiwan according to the corresponding energy levels.
Nutrients 14 05216 g004
Table 1. Energy intakes by geriatric syndrome groups in all participants and in sex–age subgroups, using 2014–2017 NAHSIT data a.
nGeriatric Syndrome GroupsP Values
Sex AgeTrend b
RobustPrefrailFrail
All participants601/509/761869 ± 41.341693 ± 40.931537 ± 81.20<0.00010.1030.001
 Men
  65~74-year-old231/156/132078 ± 49.121953 ± 74.791761 ± 192.7--0.114
   ≥75-year-old86/117/262164 ± 122.71888 ± 107.81840 ± 179.7--0.158
 Women
  65~74-year-old224/127/101697 ± 61.181629 ± 62.041426 ± 106.1--0.027
   ≥75-year-old60/109/271484 ± 66.161313 ± 66.191246 ± 117.4--0.085
NormalMCICI
All participants646/534/5011851 ± 40.221695 ± 38.641553 ± 44.45<0.00010.217<0.0001
 Men
  65~74-year-old291/181/592045 ± 43.041872 ± 65.681829 ± 171.9--0.254
   ≥75-year-old112/102/1101945 ± 88.322045 ± 135.41770 ± 125.4--0.267
 Women
  65~74-year-old202/164/1321761 ± 60.541530 ± 72.961409 ± 46.63--<0.0001
   ≥75-year-old41/87/2001594 ± 127.31383 ± 72.931314 ± 49.97--0.043
a Data are sex and age groups adjusted Mean ± SEM for all participants, and age-adjusted Mean ± SEM for all the subgroups. CI: cognitive impairment; MCI: mild cognitive impairment. b The trend test was performed by using the general linear model to test whether the mean energy intake has an ordered relationship across the severity of frailty or CI groups after adjusting for sex and age groups for all participants, or adjusting for age for all the subgroups.
Publisher’s Note: MDPI stays neutral with regard to jurisdictional claims in published maps and institutional affiliations.