Abstract
Dihydroquercetin (DHQ) is a natural flavonoid with multiple bioactivities, including hepatoprotective effects. This study aimed to investigate whether DHQ improved lipid dysmetabolism in the body, especially in the liver, and whether there is a relationship between hepatic metabolism and altered gut flora in high-fat diet (HFD)-induced mice. HFD-induced mice were given 50 mg/kg body weight DHQ intragastrically for 10 weeks. The data showed that DHQ reduced body weight, the weight of the liver and white adipose tissue as well as serum leptin, LPS, triglyceride and cholesterol levels. RNA-seq results indicated that DHQ down-regulated lipogenesis-related genes and up-regulated fatty acid oxidation-related genes, including MOGAT1 and CPT1A. Furthermore, DHQ had a tendency to decrease hepatic cholesterol contents by reducing the mRNA levels of cholesterol synthesis genes such as FDPS and HMGCS1. 16S rRNA sequencing analysis indicated that DHQ significantly decreased the richness of Lactococcus, Lachnoclostridium, and Eubacterium_xylanophilum_group. Correlation analysis further demonstrated that these bacteria, Lactococcus and Eubacterium_xylanophilum_group in particular, had significantly positive correlation with lipid and cholesterol synthesis genes, and negative correlation with fatty acid oxidation genes. In conclusion, DHQ could improve hepatic lipid dysmetabolism potentially by improved gut microbial community, which may be used as an intervention strategy in hepatic metabolism diseases.
1. Introduction
Hepatic metabolic disorder is considered as a risk factor for metabolism problems, including hyperglycemia, hyperlipidemia, obesity, and fatty liver diseases, which is increasingly common worldwide [1]. If not adequately controlled, it will further lead to the occurrence of some complications such as hypertension, atherosclerosis, and associated cardiovascular diseases, becoming a major threat to human health [2]. It was reported that silymarin was useful as a complementary alternative medicine for non-alcoholic fatty liver disease (NAFLD) and liver cirrhosis for many years worldwide [3,4]. NAFLD and liver cirrhosis were usually caused by the disorder of hepatic metabolism. Thus, we speculated that dihydroquercetin (DHQ), as the bioactive ingredient of silymarin, could potentially improve hepatic metabolic disorder.
DHQ (3,5,7,3,4-pentahydroxy flavanone), a kind of secondary metabolite, was generally distributed in Douglas fir, silybum marianum, and onions [5,6,7]. It has been used as a food supplement for milk, cheese, and beef tallow due to multiple positive effects, including anti-oxidative, anti-inflammatory, and liver-protective functions for humans and animals [8]. A vitro study in 2018 suggested that DHQ resulted in the remission of alcoholic liver steatosis with potent inhibitory function on lipogensis in HepG2 cells [9]. Finger millet extracts (FME) was reported to inhibit high-fat diet (HFD)-caused hepatic metabolic alterations and prevent liver steatosis in models of mice, and DHQ was speculated to be its predominant active ingredient in FME [10]. Moreover, a recent study has revealed that DHQ treatment could decrease the total triglyceride (TG) and cholesterol (TC) contents in hepatic tissues of HFD-induced mice [11]. However, as the liver is the major metabolic organ, how DHQ supplementation regulates hepatic metabolism-related genes was unclear. In addition, DHQ had ability to regulate gut microbiota. Recently, a preclinical trial based on in vivo study revealed that the supplementation of DHQ altered the composition of intestinal microbiota with increasing Firmicutes levels and decreased Bacteroidetes levels in dextran sodium sulfate (DSS)-caused colitis mice [12]. Our previous study also demonstrated that DHQ treatment increased the fecal Firmicutes/Bacteroidetes ratio and changed the richness of some genus such as Lactobacillus, Dubosiella, and Bacteroidetes in DSS-induced mice [13]. Besides, a mice study showed that DHQ could correct HFD-caused gut microbiota imbalance and increase bacteria diversity [11]. In light of this, although the previous studies have proven that DHQ could improve gut microbiota composition, the underlying mechanisms of DHQ on the association of hepatic lipid metabolism with the regulation of intestinal flora, were still unclear.
Thus, in this study, we aim to investigate the regulatory effects of DHQ on hepatic lipid metabolic genes through transcriptomics technology in HFD-induced mice. Moreover, using 16S rRNA gene sequencing method, this study sought to investigate how DHQ supplementation affected gut microbiota composition, and further revealed the relationship between lipid metabolic-related indexes and gut microbiota through correlation analysis. This study would offer theoretical evidence to develop strategic approach to prevent and treat hepatic metabolism-associated disorders, as well as provide new insights for the application of DHQ as a green additive in animal husbandry.
2. Materials and Methods
2.1. Chemicals and Diets
DHQ was acquired from Shanghai Yuanye Bio-Technology Co., Ltd. (Shanghai, China) with the purity of 99.50%. The standard chow diet (SD, research diet D12450B, 3.85 kcal/g) and the HFD (research diet D12492, 5.24 kcal/g) were provided from Beijing Keao Xieli Feed Co., Ltd. (Beijing, China). Energy intake was calculated according to the following formula:
CON group: Energy intake (kcal) = Feed intake (g) × 3.85 (kcal/g)
HFD and HFD+DHQ group: Energy intake (kcal) = Feed intake (g) × 5.24 (kcal/g)
2.2. HPLC Analysis
Through high performance liquid chromatograph (HPLC) detection, the purity of DHQ was defined using a HPLC system (Dalian YiLiTe Technologies, Dalian, China). Elution solvents were solvent A (0.1% H3PO4 in H2O) and solvent B (acetonitrile). The separation was preformed on a Hyper 0DS2 C18 column (4.6 mm × 250 mm, 5 μm). Moreover, column temperature was 25 °C and detection was conducted at 286 nm. After detection, the purity of DHQ was 99.50% and showed in Figure S1.
2.3. Animals and Experimental Design
Male C57BL/6J (6 weeks old) mice were acquired from Peking University Health Science Center (Beijing, China). They were raised in animal house with free access to diet and water under a controlled environment at 21 ± 2 °C and a 12/12 h light/dark cycle. After a week of adaptation, mice were randomly allocated to 3 groups (n = 8/group). Mice in HFD+DHQ group were fed a HFD with gavage of 50 mg/kg body weight DHQ (dissolved in corn oil). Mice in CON and HFD groups were received with SD and HFD separately, with the same volume of corn oil intragastrically. The body weight and feed intake of them were measured every week. After 10 weeks, blood materials were obtained via orbital blooding and then the mice were killed through cervical dislocation. Liver weight and white adipose tissues weight (inguinal, epididymal, and perirenal adipose tissues) was weighed and recorded. Liver tissue was quickly taken out and frozen in liquid nitrogen for future analysis. For histopathology analysis, part of liver was cut and fixed in 4% paraformaldehyde. Feces were obtained and quickly stored in liquid nitrogen for 16S rRNA sequencing.
2.4. Hepatic Hematoxylin and Eosin (H&E) Staining
Part of the liver was fixed with 4% paraformaldehyde, then dehydrated and embedded in paraffin. A section was cut and placed on a slide. After deparaffinization and hydration, the sections were stained with H&E for microscopy. Images were obtained with inverted fluorescence microscope (Leica DMI3000B) (Leica, Weztlar, Germany).
2.5. Serum and Hepatic Parameters Analysis
After the centrifugation of blood at 3000 rpm and 4 °C for 10 min, the serum samples were collected for future biochemical analysis. The contents of total triglyceride (TG) and total cholesterol (TC) in serum and hepatic tissue, as well as serum low-density lipoprotein cholesterol (LDL-C) and high density lipoprotein cholesterol (HDL-C) were identified through automatic biochemical analyzer (fully automatic bioanalyzer BK-280, Biobase Biodustry Co., Ltd., Jinan, China). The levels of leptin, insulin, and LPS in serum were identified by ELISA assay according to the manufacturers’ manuals (Nanjing Bioengineering Institute, Nanjing, China). Moreover, the homeostasis model assessment of insulin resistance (HOMA-IR) was employed to estimate insulin resistance based on the following formula:
HOMA-IR = Fasting blood glucose (mmol/L) × Fasting insulin (mIU/ L)/22.5
2.6. Hepatic Transcriptome Sequencing and Bioinformatics Analysis
Liver tissues from the CON, HFD, and HFD+DHQ groups were stored in liquid nitrogen and entrusted to Majorbio Bio-Pharm Technology Co., Ltd. (Shanghai, China) for transcriptomics analysis. Following the manufacturer’s instructions, total RNA was extracted with Trizol® reagent (Invitrogen, Waltham, MA, USA) and genomic DNA was removed with DNase I (TaKara, Otsu, Japan). The RNA quality and purity were determined by 2100 Bioanalyser (Agilent, alo Alto, CA, USA) and Nanodrop2000 (NanoDrop Technologies, Wilmington, DE, USA). Then, sequencing library was constructed for further analysis with high-quality RNA samples (OD260/280 ≥ 1.8, OD260/230 ≥ 1.0, RIN ≥ 8.0, 28/23S > 18/16S, ≥1.6 μg). Messenger RNA is separated from total RNA using oligo (dT) beads and then segmented using fragmentation buffer. Double-stranded cDNA was synthesized by reverse transcriptase and subjected to terminal-repair, phosphorylation, and “A” base addition. After PCR for 15 cycles and quantified by TBS380, sequencing was performed with the Illumina NovaSeq 6000 sequencer (2 × 150 bp read length). CASAVA base calling was employed to transform sequencing images signal to sequencing data pattern. By SeqPrep (https://github.com/jstjohn/SeqPrep (accessed on 25 December 2021)), and Sickle (https://github.com/najoshi/sickle (accessed on 25 December 2021)) programs, the clean data reads were remained following quality assessment and low quality filtering of raw reads. Then, mapped data was acquired after aligning the clean data to the mouse genome with HISAT2 (http://ccb.jhu.edu/software/hisat2/index.shtml (accessed on 25 December 2021)) analysis. Following transcripts assembly using StringTie (http://ccb.jhu.edu/software/stringtie/ (accessed on 25 December 2021)), RSEM (http://deweylab.biostat.wisc.edu/rsem/, version 1.3.3 (accessed on 25 December 2021)) software was used for quantification based on transcripts per million reads (TPM). Differential expression genes (DEGs) between groups were determined with DESeq2. Genes were defined to be significantly differentially expressed with p-adjust < 0.05 and fold change (FC) ≥ 2 (for up-regulation) or ≤0.5 (for down-regulation).
2.7. Quantitative Real-Time PCR (qRT-PCR) Analysis
Biochemical reagents, including Trizol (Invitrogen, USA) reagent, chloroform, isopropanol, and 75% ethanol solution, were used to isolate total RNA of liver tissues. Then, RNA concentrations were detected with the NanoDrop 2000 (Nanodrop Technologies, USA). After removing the possible DNA contaminations, the reverse transcription was conducted using PrimeScript RT reagent kits (Takara, Beijing, China). Next, qRT-PCR was conducted in accordance with the manual of the manufacturer with KAPA SYBR FAST qPCR Master Mix kit. Briefly, reactions were carried out in triplicate for each sample in a 10 μL volume consisting of 5 μL KAPA SYBR FAST qPCR Master Mix Universal, 0.4 μL PCR forward primer, 0.4 μL PCR reverse primer, 0.2 μL ROX low, 1 μL cDNA, and 3 μL PCR-grade water following the instruction of the manufacturer (KAPA biosystems, Beijing, China). β-actin was designed as internal control and each result of target genes was normalized to β-actin and relatively quantified with 2−ΔΔCt method. The RT-PCR was performed on an Applied Biosystems 7500 RT-PCR System (Thermo Fisher Scientific, Shanghai, China). Specific primers were synthesized in Sangon Biotech Co., Ltd. (Shanghai, China) and exhibited in Table 1.

Table 1.
Primers applied for qRT-PCR detection.
2.8. Gut Microbiota Profiling in Feces
Microbial community total genome DNA of feces was extracted with the FastDNA® Spin Kit for Soil (MP Biomedicals, Solon, OH, USA). Then, the quality of total genome DNA was analyzed with 1% agarose gel. Its purity and concentration were identified by NanoDrop 2000 UV-vis spectrophotometer (Thermo Scientific, Wilmington, DE, USA). PCR amplification of hypervariable region V3-V4 in the bacteria 16S ribosomal RNA gene was performed using specific primers (338F, 5′-ACTCCTACGGGAGGCAGCAG-3′; 806R, 5′-GGACTACHVGGGTWTCTAAT-3′) with an ABI GeneAmp® 9700 PCR thermocycler (ABI, Los Angeles, CA, USA). The PCR product was checked with 2% agarose gel, followed with purification, quantification, and homogenization with AxyPrep DNA Gel Extraction Kit (Axygen Biosciences, Union City, CA, USA) and Quantus™ Fluorometer (Promega, Fitchburg, WI, USA) based on the manufacturer’s requirements. After that, purified amplicons were sequenced with an Illumina MiSeq PE300 platform (Illumina, San Diego, CA, USA) at Majorbio Bio-Pharm Technology Co., Ltd. (Shanghai, China) based on the standard protocols. The sequences were quality-filtered and merged, then clustered to operational taxonomic units (OTUs) with 97% similarity using the UPARSE software (http://www.drive5.com/uparse/, version 7.1 (accessed on 25 December 2021)). Alpha diversity, including Simpson, Shannon, and Chao indices, was conducted by the Mothur version 1.30.2. Beta diversity was determined through calculating the weighted Unifrac distance and visualized by principal co-ordinates analysis (PCoA).
2.9. Correlation Analysis
Pearson’s correlation analysis was carried out between gut microbiota and hepatic lipid metabolic parameters.
2.10. Statistical Analysis
Statistical analyses were processed through one-way analysis of variance (ANOVA) with Duncan test (SPSS 22.0 software, IBM Corp., Chicago, IL, USA). The data were expressed as the mean ± SEM. p < 0.05 was considered to be significant statistically.
3. Results
3.1. DHQ Alleviated the Weight Parameters and Prevented Fat Accumulation in Hepatic Tissue in HFD-Induced Mice
To establish a model of lipid metabolic disorder, the mice were raised with HFD for consecutive 10 weeks (Figure 1A). The results showed that there was higher final body weight in the HFD group compared with the CON group, whereas DHQ supplementation to HFD-fed mice prevented weight gain, leading to a significantly lower body weight after 10 weeks (p < 0.05) (Figure 1B,C). During the whole experiment, HFD-fed mice showed the decreased average daily food intake and increased energy inputs than mice fed with a SD. Meanwhile, the average daily food consumption and energy inputs was similar between HFD and HFD+DHQ groups (Figure 1D,E). Furthermore, mice fed with a HFD displayed a significant elevation of the liver weight than CON mice, which could be alleviated by the administration of DHQ (p < 0.05) (Figure 1F). Compared to the normal controls, HFD-fed mice exhibited significant higher weight of inguinal, epididymal, and perirenal adipose tissue, which was dramatically reversible by administration of DHQ (p < 0.05). Meanwhile, HFD increased the ratios of the weight of inguinal, epididymal, and perirenal adipose tissue to the body weight (p < 0.05). However, supplementation with DHQ significantly decreased inguinal and perirenal fat indices, while failed to affect epididymal fat indices (Figure 1F,H).
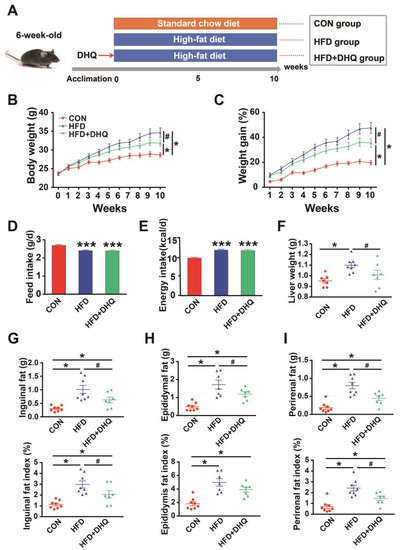
Figure 1.
Effects of DHQ on growth performance and lipid deposition in mice. (A) Animal breeding scheme (three groups); (B) body weight; (C) weight gain; (D) feed intake; (E) energy intake; (F) liver weight; (G) inguinal fat weight and index; (H) epididymal fat weight and index; (I) perirenal fat weight and index. Data were expressed as the mean ± SEM. * p < 0.05, *** p < 0.001 vs. CON group, # p < 0.05 vs. HFD group.
3.2. DHQ Alleviated Lipid Metabolism-Related Biomarkers in Serum of HFD-Induced Mice
Mice fed with a HFD presented a significant increase of leptin, and insulin concentrations, accompanied by a notable increase in HOMA-IR than the control, which were the hallmark features of leptin, and insulin resistance as well as metabolic disorders. However, the supplementation of DHQ could reduce leptin level significantly (p < 0.05), and tend to reduce insulin level and HOMA-IR, as shown in Figure 2A–C (p > 0.05). Moreover, serum LPS levels were significantly increased in mice fed with a HFD than normal group, which could be reversed by DHQ (p < 0.05) (Figure 2D). Simultaneously, in comparison with CON group, HFD-induced mice had elevated TG and TC contents in serum, which could be alleviated by DHQ treatment (p < 0.05) (Figure 2E,F). Besides, the anomalous increase in serum HDL-C caused by HFD was significantly inhibited by DHQ supplementation (p < 0.05). There was no significant difference in LDL-C contents of serum among CON, HFD, and HFD+DHQ groups (Figure 2G,H).
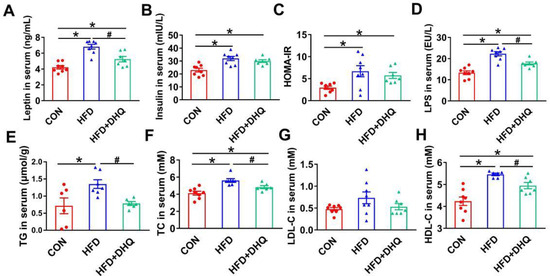
Figure 2.
Effects of DHQ on serum parameters in mice. (A) Leptin; (B) insulin; (C) HOMA-IR; (D) LPS; (E) TG; (F) TC; (G) LDL-C; and (H) HDL-C. Data were expressed as the mean ± SEM. * p < 0.05 vs. CON group, # p < 0.05 vs. HFD group.
3.3. DHQ Improved Lipid Accumulation in Livers of HFD-Induced Mice
As a critical organ for body metabolism, the liver is susceptible to high fat or high energy diet. In this study, pathological observations showed that HFD resulted in the hepatic abnormal accumulation of lipid droplets, which was suppressed after DHQ treatment (Figure 3A). Consistent with this, hepatic TG and TC levels were significantly higher in the mice of the HFD group compared with the CON group (Figure 3B,C). In contrast, the supplementation of DHQ significantly decreased the TG level (p < 0.05), and had a tendency to decrease the TC level (p > 0.05).
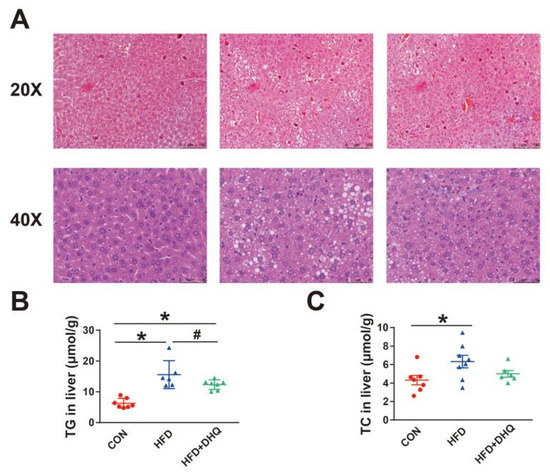
Figure 3.
Effects of DHQ on lipid deposition in livers of mice. (A) H&E staining images of hepatic tissue; (B) TG level; and (C) TC level. Data were expressed as the mean ± SEM. * p < 0.05 vs. CON group, # p < 0.05 vs. HFD group.
3.4. Identification of Differentially Expressed Genes (DEGs) in Liver
Considering that DHQ intervention could attenuate hepatic lipid deposition caused by HFD, we next investigated the effect of DHQ on the mRNA levels of hepatic genes associated with lipid metabolism based on RNA sequencing methods. As shown in Table 2, about 57.6, 53.3, and 55.4 million raw reads were acquired from the CON, HFD, and HFD+DHQ groups, respectively. Through filtering and removing contamination of the raw reads, high-quality clean reads (57.0, 52.8, and 54.9 million in the CON, HFD, and HFD+DHQ groups, respectively) were obtained. Moreover, the average quality of Q20 and Q30 bases in all 12 samples surpassed 98% and 94%, suggesting excellent sequencing quality. After mapped to mouse reference genome of the clean reads, the mapping ratios in three groups all exceed 86%, meeting the requirement for assembly and further analysis.
Table 2.
Quality check and comparative analysis results of RNA-seq results.
The principal component analysis (PCA) result demonstrated that the samples of the HFD group were significantly separated from the CON group, while the gene clustering from the HFD+DHQ group was closer to the CON group (Figure 4A). A strict comparison at p-adjust < 0.05 and FC ≥ 2 (for up-regulation) or ≤−2 (for down-regulation) was conducted to define the number of DEGs. Volcano plots were generated to visualize the distribution of DEGs in the CON and HFD, the HFD and HFD+DHQ groups. There were 577 DEGs (240 being up-regulated and 337 being down-regulated) were determined in the HFD-fed mice than the CON mice. Meanwhile, 31 genes in total have been significantly differentially expressed with 20 being up-regulated and 11 being down-regulated in the HFD+DHQ group, compared to the HFD group (Figure 4B,D).
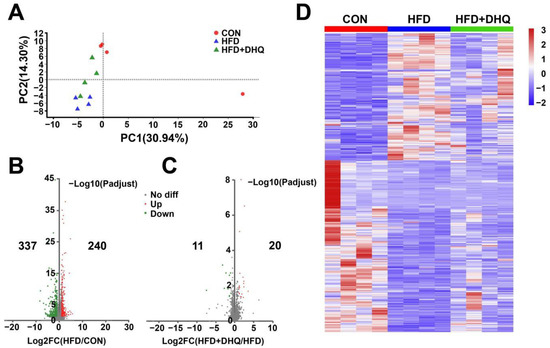
Figure 4.
Effects of DHQ on hepatic genes expression in mice. (A) PCA score plots; (B) volcano plots of DEGs in CON vs. HFD; (C) volcano plots of DEGs in HFD vs. HFD+DHQ groups. Each dot represents a particular gene, and its corresponding horizontal and vertical values are gene expressive changes in the CON and HFD groups or HFD and HFD+DHQ groups, respectively. The red dots mean up-regulated genes expressed significantly, the green dots mean down-regulated genes expressed significantly, and the gray dots mean the genes expressed not significantly; and (D) heatmap of all DEGs altered by HFD and DHQ treatment.
3.5. DEGs Expression Patterns and Functional Annotation from RNA-Seq in the Liver
To characterize the functional results of DEGs provoked by the HFD and DHQ, KEGG and GO analysis was performed. By matching altered genes to the KEGG database, DEGs were functionally annotated in metabolism, human diseases, and organismal systems. As shown in Figure 5A, DEGs in the CON and HFD groups were the most enriched in metabolism, including retinol metabolism, steroid hormone biosynthesis, and drug metabolism-cytochrome P450. Moreover, chemical carcinogenesis was the most enriched in human diseases term, as the inflammatory mediator regulation of TRP channels was the most enriched in organismal systems term. In contrast, for altered gene sets in the HFD and HFD+DHQ groups, metabolism, human diseases, organismal systems, and environmental information processing were the most abundant functional groups. Metabolism and environmental information processing terms, including starch and sucrose metabolism, arachidonic acid metabolism, and the FoxO signaling pathway, were significantly enriched, as human diseases and organismal systems terms such as the adipocytokine signaling pathway, pancreatic secretion, central carbon metabolism in cancer, and pathways in cancer were enriched in our results (Figure 5B). A further investigation based on GO enrichment analysis showed several enriched processes such as the cholesterol biosynthetic process, the regulation of the triglyceride metabolic process, and the long-chain fatty acid metabolic process involved in lipid metabolism in DEGs from the CON and HFD group (Figure 5C). However, DHQ mainly altered the genes associated with glucan metabolic process, glycogen metabolic process, and glucose homeostasis (Figure 5D).
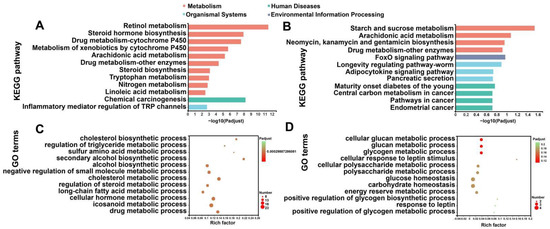
Figure 5.
KEGG and GO enrichment analysis of altered gene sets in liver. (A) KEGG enrichment analysis of DEGs between CON and HFD groups; (B) KEGG enrichment analysis of DEGs between HFD and HFD+DHQ groups; (C) GO classification of DEGs between CON and HFD groups; and (D) GO classification of DEGs between HFD and HFD+DHQ groups. The vertical axis represents GO terms and the horizontal axis is the Rich factor. The size of each point indicates gene numbers in this GO Term.
3.6. DHQ Altered the Hepatic Expression Levels of Genes Involved in Triglyceride and Cholesterol Metabolism in HFD-Induced Mice
Based on the above-mentioned data, we next focused on the genes associated with lipid metabolic processes and identified hub genes that had potential influence on the results. Figure 5A showed that HFD up-regulated the mRNA levels of 1-acylglycerol-3-phosphate O-acyltransferase 1 (AGPAT1), diacylglycerol O-acyltransferase 2 (DGAT2), monoacylglycerol O-acyltransferase 1 (MOGAT1), Mid1 interacting protein 1 (MID1IP1), acyl-CoA thioesterase 11 (ACOT11), fatty acid synthase (FASN), sterol regulatory element binding transcription factor 1 (SREBF1), and MLX interacting protein-like (MLXIPL) involved in lipogenesis, which was reversed by DHQ supplementation. Meanwhile, the expression of carnitine palmitoyltransferase 1a (CPT1A), enoyl-CoA, hydratase/3-hydroxyacyl CoA dehydrogenase (EHHADH), long-chain acyl-Coenzyme A dehydrogenase (ACADL), CYP4A10, CYP4A14, and CYP4A31 related to fatty acid oxidation were decreased in mice fed with a HFD than those of normal diet, which also could be reversed with DHQ. Moreover, HFD and DHQ altered the mRNA expression of genes associated with lipid transport, including CD36 molecule (CD36), solute carrier family 27, member 5 (SLC27A5), and microsomal triglyceride transfer protein (MTTP) (Figure 6A).
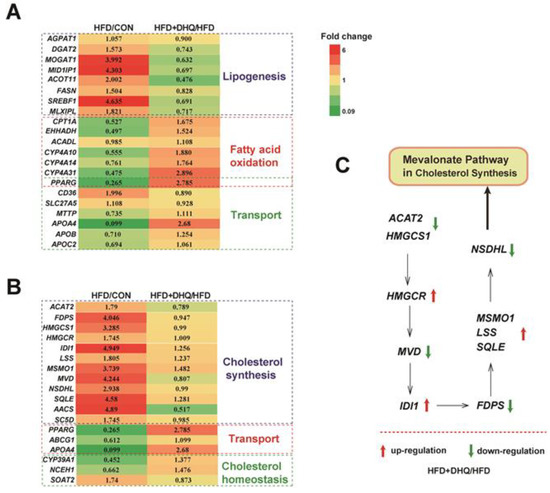
Figure 6.
Effects of DHQ on fold change of lipid metabolic-related gene expression in liver in mice. (A) TG metabolism-related genes; (B) TC metabolism-related genes; (C) Mevalonate pathway in cholesterol synthesis. The red arrow represents up-regulation, and the green arrow represents down-regulation.
In addition, DHQ reprogramed some gene sets involved in cholesterol metabolism. Specifically, HFD increased the mRNA levels of acetyl-CoA acetyltransferase 2 (ACAT2), farnesyl diphosphate synthetase (FDPS), 3-hydroxy-3-methylglutaryl-CoA synthase 1 (HMGCS1), 3-hydroxy-3-methylglutaryl-CoA reductase (HMGCR), isopentenyl-diphosphate delta isomerase (IDI1), lanosterol synthase (LSS), methylsterol monooxygenase 1 (MSMO1), mevalonate diphosphate decarboxylase (MVD), NAD(P) dependent steroid dehydrogenase-like (NSDHL), squalene epoxidase (SQLE), acetoacetyl-CoA synthetase (AACS), and sterol-C5-desaturase (SC5D) involved in cholesterol synthesis, while ACAT2, FDPS, HMGCS1, MVD, NSDHL, AACS, and SC5D levels were down-regulated after DHQ administration to HFD-fed mice. Notably, DHQ also changed the genes related to cholesterol transport and cholesterol homeostasis such as peroxisome proliferator activated receptor gamma (PPARG), ATP binding cassette subfamily G member 1 (ABCG1), apolipoprotein A-IV (APOA4), CYP39A1, neutral cholesterol ester hydrolase 1 (NCEH1), and sterol O-acyltransferase 2 (SOAT2) (Figure 6B). Besides, Figure 5C showed mevalonate pathway in cholesterol synthesis.
3.7. Verification of RNA-Seq Results through qRT-PCR in the Liver
To prove the correctness of the results obtained from RNA-seq analysis, qRT-PCR was employed to analyze the mRNA expression of nine genes selected randomly, including phosphoenolpyruvate carboxykinase 1 (PCK1), lipin 2 (LPIN2), glycerophosphocholine phosphodiesterase 1 (GPCPD1), CYP4A32, abhydrolase domain containing 2 (ABHD2), sphingomyelin phosphodiesterase 3 (SMPD3), elongation of very long chain fatty acid elongase 2 (ELOVL2), Fibrinogen-like protein 1 (FGL1), and CPT1A. Relative to the CON group, several genes were markedly down-regulated in the HFD group, including PCK1, LPIN2, GPCPD1, CYP4A32, ABHD2, SMPD3, ELOVL2, FGL1, and CPT1A (p < 0.05). Meanwhile, it was found that DHQ significantly enhanced the expression of LPIN2, GPCPD1, CYP4A32, ELOVL2, and FGL1 for mice induced by HFD (p < 0.05) (Figure 7A). In brief, the expression trends of the detected genes were highly in conformance with the results obtained by RNA-seq (Figure 7B,C). Differences in fold change values were likely due to the different detection sensitivity of the two methods [14].
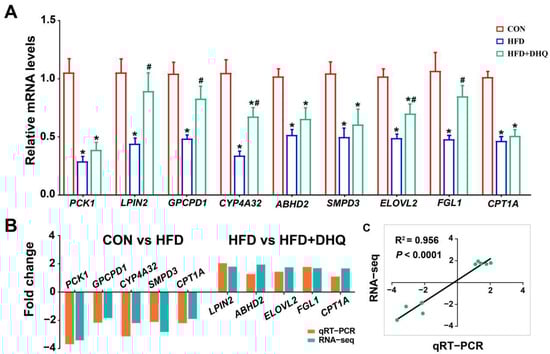
Figure 7.
qRT-PCR validation of 9 DEGs selected randomly. (A) Relative mRNA levels of PCK1, LPIN2, GPCPD1, CYP4A32, ABHD2, SMPD3, ELOVL2, FGL1, and CPT1A; (B) fold change of up-regulation or down-regulation in RNA-seq and qRT-PCR assays; and (C) correlation analysis. Data were expressed as the mean ± SEM. * p < 0.05 vs. CON group, # p < 0.05 vs. HFD group.
3.8. DHQ Modified Gut Microbiota Composition in HFD-Induced Mice
Next, 16S rRNA gene sequencing was used to identify microbiota structure in the feces with 7–8 biological replicates in each group. As shown in Figure 8A, the rarefaction curves indicated that the end of the curve tends to be flat, demonstrating that the amount of sequencing data is reasonable enough to reflect the vast majority of microbiota diversity in fecal samples. The Venn diagram presented 336 common OUTs and 36, 43, and 42 individual OTUs, respectively, in the CON, HFD, and HFD+DHQ groups based on 97% sequence similarity (Figure 8B). Further, the Simpson, Shannon, and Chao indexes were determined for alpha-diversity and community richness of gut flora. As illustrated in Figure 8C, daily HFD treatment for 10 weeks significantly reduced the Simpson index (p < 0.05), while displayed tenuous effect on the Shannon and Chao indexes than CON group. Moreover, DHQ had no significant impact on Simpson, Shannon, and Chao indexes in the HFD-fed mice. Then, β-diversity was evaluated via principal co-ordinates analysis (PCoA) based on Bray-Curtis distance. It was showed that the CON group showed an obvious separation in microbiota structure compared with the HFD and HFD+DHQ groups. Meanwhile, there is also a discrepancy in the make-up of gut bacteria between the HFD and HFD+DHQ groups, revealing that the gut micorbial community in mice fed with a HFD was influenced by DHQ (Figure 8D).
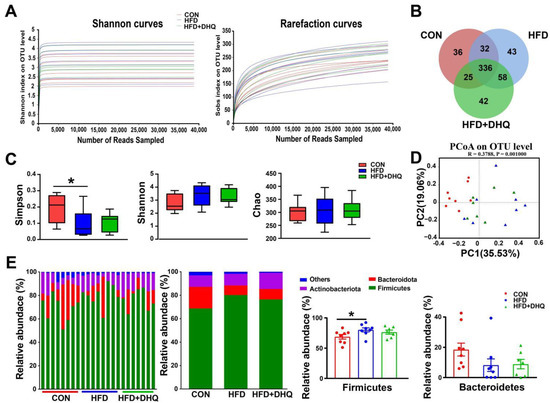
Figure 8.
Effects of DHQ supplementation on fecal microbiota diversity and microbial composition at phylum level in mice. (A) Dilution curves; (B) Venn diagram; (C) α-diversity; (D) PCoA; and (E) microbial composition at phylum level. Data were expressed as the mean ± SEM. * p < 0.05 vs. CON group.
At the phylum level, compared with the CON group, the supplementation of the HFD decreased the richness of Firmicutes significantly (p < 0.05), which can be reversed by DHQ, although not significantly (p > 0.05) (Figure 8E). In addition, there was no significant alterations in the relative abundance of Bacteroidetes among the CON, HFD, and HFD+DHQ groups (Figure 8E). At the genus level, the proportions of Streptococcus, Lactococcus, Enterococcus, unclassified_f_Lachnospiraceae, Lachnoclostridium, and Eubacterium_xylanophilum_group was significantly increased, whereas Coriobacteriaceae_UCG-002 was significantly decreased in mice of the HFD group than those of normal controls (p < 0.05). Noteworthy, the alterations were reversed after DHQ supplementation. In particular, the richness of Lactococcus, Lachnoclostridium, and Eubacterium_xylanophilum_group was significantly reduced by DHQ in HFD-caused mice (Figure 9).
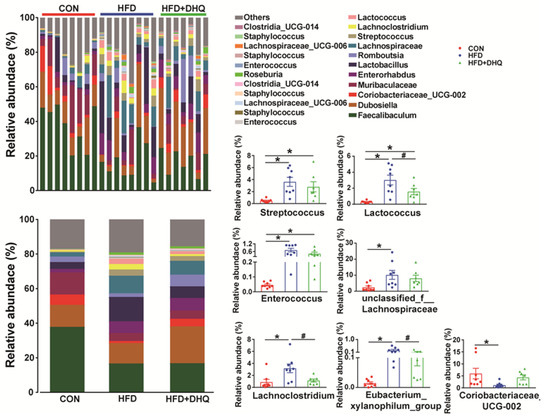
Figure 9.
Effects of DHQ supplementation on fecal microbial composition at genus level in mice. Data were expressed as the mean ± SEM. * p < 0.05 vs. CON group, # p < 0.05 vs. HFD group.
3.9. Correlation Analysis between the Altered Gut Microbiota and Lipid Metabolic Indexes
The relevance of the altered gut microbiota and lipid metabolism-associated indicators were evaluated by Pearson’s correlation analysis and visualized through heatmap (Figure 10 and Figure S2). As demonstrated in Figure 10, the relative abundance of Streptococcus was significantly positively associated with serum insulin, LPS, TC, and hepatic TG levels. The richness of Lactococcus and Enterorcoccus had positive relationship with body weight, serum leptin, insulin, LPS, TC, and hepatic TG levels. Moreover, the relative richness of unclassified_f_Lachnospiraceae and Eubacterium_xylanophilum_group showed positive correlation with the amounts of leptin, TC in serum, and TG in liver. Furthermore, the relative abundance of Lachnoclostridium correlated positively with body weight, serum leptin, LPS, TG, and hepatic TG, TC levels. Besides, it is clear that the relative abundance of Coriobacteriaceae_UCG-002 had negative correlation with serum LPS, TG and hepatic TG levels. Meanwhile, the correlation analysis between flora and key genes in the hepatic transcriptome data was performed. The results indicated that the relative abundance of Streptococcus and Eubacterium_xylanophilum_group was significantly positively related to MOGAT1, MID1IP1, ACAT2, FDPS, and MVD, but significantly negatively correlated with CPT1A expression. The richness of Lactococcus and Enterorcoccus showed positive correlation with the expression of DGAT2, MOGAT1, MID1IP1, MLXIPL, ACAT2, FDPS, HMGCS1, MVD, and NSDHL, but negative correlation with CPT1A and CYP4A10 expression. Furthermore, there was a positive relationship between the richness of unclassified_f_Lachnospiraceae and the expression of FDPS, HMGCS1, MVD and NSDHL in the liver. In addition, the proportion of Lachnoclostridium had positively correlation with MID1IP1, FDPS, HMGCS1, and MVD mRNA levels.
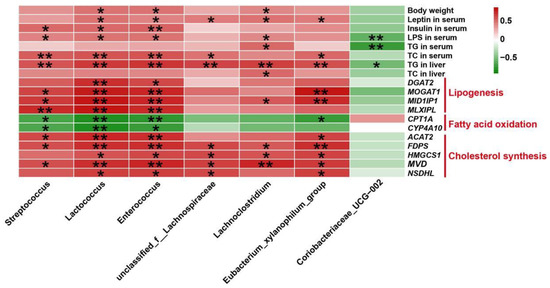
Figure 10.
Pearson’s correlation analysis between fecal microbiota at the genus level and lipid metabolic indexes. * p < 0.05 and ** p < 0.01 represents significantly positive (red) or negative (green) correlation.
4. Discussion
Lipid metabolic disorder is emerging as an epidemic pathological process with promoting the incidence and progression of fatty liver diseases, seriously endangering people’s health [15]. In the present study, we found that DHQ supplementation improved hepatic lipid dysmetabolism with decreasing lipid and cholesterol synthesis-associated genes as well as increasing fatty acid oxidation-associated genes, which was related to the improved gut microbiota composition.
Lipid metabolism imbalance induced by HFD is often concomitant with the increase of body weight and fat storage [16,17]. A recent study has indicated that DHQ supplementation had beneficial metabolic effects for HFD-fed mice, which is featured by decreasing body weight and fat accumulation [11]. Similarly, our data showed that dietary HFD caused increased body weight and adipose tissue weight (inguinal, epididymal, and perirenal adipose tissue), which was remarkably decreased by DHQ treatment. Moreover, HFD feeding usually caused hyperlipidemia, which were considered as risk indicators for metabolic disorder [18]. Here, the consumption of a HFD resulted in higher levels of serum TG and TC, which was coincident with an earlier study [19]. It was reported that elevated TG and TC levels in serum could promote the development of NAFLD and other metabolic diseases [20]. Notably, the present study showed that DHQ supplementation had significantly reduced serum TG and TC production in mice fed with a HFD. HDL-C is involved in transporting cholesterol to the liver from peripheral tissues and decomposing it into bile acids, which in turn are released into the intestine and excreted from the body [21]. In this work, we also found that DHQ supplementation inhibited the abnormal increase of serum HDL-C level caused by a HFD. Collectively, these data demonstrated that DHQ supplementation decreased body fat storage and ameliorated hyperlipidemia in mice fed with a HFD.
Leptin, an adipocyte-secreted hormone, is required for maintaining energy balance through mediating processes involved in food intake and expenditure [22]. Insulin displayed important function in regulating lipid metabolism. During the challenge of insulin resistance, insulin promoted de novo lipogenesis and re-esterification in the liver [23]. HFD-fed models usually had enhanced production of systemic leptin and insulin, which was associated with leptin and insulin resistance, as well as metabolic disorder [24,25,26]. A partial reduction of leptin content can promote weight loss and mitigate both leptin and insulin resistance in HFD-fed mice [27]. In the current study, it was revealed that DHQ supplementation decreased serum leptin level and had a tendency to reduce serum insulin level and HOMA-IR, which further revealed the beneficial impacts of DHQ on body metabolism in HFD-induced mice.
When fed with long-term high fat or carbohydrate diets, lipids are generally deposited in hepatic tissue, resulting in metabolic liver dysfunction, and eventually developing into NAFLD or hepatic fibrosis [28]. In the present study, the liver weight was measured, and the HFD significantly increased the liver weight, which was in accordance with a previous study [20]. The histological results from H&E staining also confirmed that massive lipid droplets were distributed in the livers of HFD-fed mice here. Furthermore, according to our data, the HFD-fed mice showed increased hepatic TG and TC contents. These data demonstrated that a HFD caused excess lipid deposition in the liver tissue in this work. Nevertheless, after DHQ supplementation, the liver weight, hepatic TG content and lipid droplets numbers were significantly reduced, implying that DHQ treatment played a positive role in alleviating abnormal lipid accumulation in hepatic tissue. Taken together, these results indicated that DHQ supplementation effectively improved lipid deposition in the livers of HFD-fed mice.
As a principal regulator of lipid metabolism, the liver is implicated in modulating lipid synthesis and utilization, fatty acid metabolism, and cholesterol homeostasis, etc. [29]. Previous studies described that HFD can cause hepatic lipid accumulation by modulating lipid metabolism-related genes [30,31]. In parallel, numerous bioactive flavonoids from natural plants have been confirmed to attenuate HFD-induced lipid deposition in the liver via regulating the genes related to lipogensis and fatty acid metabolism [32,33,34]. Therefore, this experiment further investigated the mechanism of DHQ-reducing hepatic lipids in HFD-fed mice from the level of mRNA levels. The results showed that the HFD-fed mice had higher expression of AGPAT1, DGAT2, MOGAT1, MID1IP1, ACOT11, FASN, SREBF1, and MLXIPL in the liver required from RNA-seq analysis. AGPAT1, DGAT2, and MOGAT1 are implicated in triglyceride synthesis, while MID1IP1, ACOT11, and FASN are associated with fatty acid synthesis [35,36,37]. The proteins encoded by SREBF1 and MLXIPL played important effects in promoting the transcription of lipogenic genes, such as FASN [38]. However, after DHQ treatment, these genes in liver were down-regulated. In especial, MOGAT1, MID1IP1, and ACOT11 mRNA levels in hepatic tissue were greatly lessened by DHQ in mice fed with a HFD (fold changes were 0.632, 0.697, and 0.476, respectively). MOGAT1 is involved in converting monoacylglycerol to diacylglycerol, which was overexpressed in the livers of obese mice suffering from hepatic steatosis [39]. It was reported that MOGAT1 gene deficiency decreased weight gain and hepatic fat mass as well as improved glucose tolerance and insulin signaling in obese mice fed with a diet containing high energy [40]. MID1IP1 was associated with the synthesis of fatty acid, which promote the risk of fatty liver diseases [41]. ACOT11, a member of the acyl-CoA thioesterase family, plays a critical role in catalyzing the hydrolysis of fatty acyl CoA to release free fatty acids and CoA, which is regulated by ambient temperature and food expenditure. Knockdown of ACOT11 could successfully combat HFD-induced obesity and hepatic steatosis [42]. Here, the reduction of MOGAT1, MID1IP1, and ACOT11 expression caused by DHQ supplementation may be greatly responsible for the decrease of triglyceride content in hepatic tissue. Furthermore, various genes, including ACADL, CPT1A, EHHADH, CYP4A10, CYP4A14, and CYP4A31, were down-regulated in mice fed with a HFD, whereas DHQ supplementation inhibited these changes. CPT1A, EHHADH, and ACADL are implicated in β-oxidation of fatty acid, while CYP4A10, CYP4A14, and CYP4A31 were involved in ω-oxidation of fatty acid [43,44,45]. Of note, CPT1A is the rate-limiting enzyme in fatty acid oxidation, which is responsible for transporting fatty acids from cytoplasm to mitochondria for oxidative decomposition. Here, the elevated expression of CPT1A, EHHADH, ACADL, CYP4A10, CYP4A14, and CYP4A31 resulting from DHQ supplementation contributed to the enhancement of fatty acid oxidation, which could further explain the smaller hepatic TG accumulation in mice fed with a HFD. CD36 and SLC27A5 are fatty acid translocases capable of mediating fatty acid uptake into the liver [46]. In the current study, DHQ supplementation down-regulated the expression of CD36 and SLC27A5 in the livers of HFD-fed mice, which promoted the decrease of fatty acid uptake in hepatic tissue. Altogether, these results suggested that DHQ reduced triglyceride level and alleviated lipid deposition in hepatic tissue potentially through regulating adipogenesis, fatty acid oxidation, and fatty acid transport-related genes.
In addition to the beneficial effect on triglyceride homeostasis, cholesterol metabolism was also affected by DHQ in this study. In fact, it was shown that excess lipid accumulation in the liver could disturb cholesterol metabolism, causing the dysregulation of cholesterol synthetic pathways, bile acid metabolism, and cholesterol export [47,48]. In the current study, RNA-seq results demonstrated that HFD up-regulated the expression of ACAT2, FDPS, HMGCS1, HMGCR, IDI1, LSS, MSMO1, MVD, MVK, NSDHL, SQLE, AACS, and SC5D, which were involved in de novo cholesterol synthesis [49,50]. However, after DHQ treatment, the expression of ACAT2, FDPS, HMGCS1, MVD, NSDHL, AACS, and SC5D was down-regulated, which promoted cholesterol decrease in mice fed with a HFD here. Moreover, genes associated with cholesterol transport such as PPARG were altered by HFD feeding, whereas these alterations were reverted following DHQ treatment. PPARG is known to be implicated in cholesterol efflux and helps maintain intracellular cholesterol homeostasis [51]. In the present study, DHQ activated the expression of PPARG, which partially maybe explain the reason for the decreased cholesterol level in the livers of HFD-fed mice. CYP39A1 was expressed in the hepatic endoplasmic reticulum and participated in bile acid synthesis [52], which is the most important mechanism of cholesterol degradation in the liver [53]. Here, DHQ up-regulated the expression of CYP39A1 in HFD-fed mice, which produced positive activities on cholesterol clearance. Altogether, these results suggested that administration of DHQ could improve cholesterol homeostasis in hepatic tissues of HFD-fed mice, mainly through mediating cholesterogenic genes. Notably, the reliability of RNA-seq data was verified by qRT-PCR for randomly selected genes.
Indeed, gut bacteria had a crucial implication for the regulation of hepatic lipid metabolism [54]. Previous studies have shown that the disruption of gut microbiota balance could easily induce hepatic lipid dysmetabolism and even resulted in fatty liver-associated diseases [55,56]. Interestingly, preclinical trials have shown that flavonoids supplementation from natural plants such as mulberry leaves and hawk tea, could ameliorate hepatic lipid metabolism in association with the changes of gut microbiota [57,58]. Thus, the fecal microbial was analyzed by 16S rRNA sequencing in the present study. We observed a significant elevation in the proportion of Firmicutes in feces collected from the HFD-fed mice, which was in agreement with many former studies [59,60]. However, DHQ treatment on the HFD-fed mice could inhibit this change, although not significantly. At the genus level, HFD feeding enriched the relative abundance of Lachnoclostridium and unclassified_f_Lachnospiraceae within the family Lachnospiraceae, which was potentially pathogenic bacteria and reported to be linked with diet-induced metabolic diseases in humans and mouse models [61,62,63]. Zhao et al. found that the decreased abundance of Lachnospiraceae was involved in the alleviation of alcoholic fatty liver [64]. Similarly, in this experiment, DHQ administration significantly reduced the relative abundance of Lachnoclostridium and tended to reduce unclassified_f_Lachnospiraceae richness, which contributed to the improvement of hepatic lipid metabolism. Moreover, in the HFD-fed mice, DHQ significantly suppressed the increased amount of sequence assigned to Eubacterium_xylanophilum_group, which was abundant in obese mice according to a previous study [65]. This means that Eubacterium_xylanophilum_group may be a potential bacterium related to metabolic disorder, but its role is unclear and needs further exploration. Meanwhile, HFD significantly lowered the richness of Coriobacteriaceae_UCG_002, which is a member of the Coriobacteriaceae family and had a negative effect on cholesterol and triglycerides homeostasis [66]. It has been originally suggested that Coriobacteriaceae_UCG_002 elevation was associated with the development of NAFLD [67]. Surprisingly, DHQ supplementation had a tendency to increase the Coriobacteriaceae_UCG_002 richness. We speculated that different experimental period and materials might result in this inconsistent result due to the susceptibility and dynamic changes of intestinal flora. Additionally, the proportion of Streptococcus, Lactococcus, and Enterococcus was abundant in the HFD-fed mice. When treated with DHQ, Lactococcus richness was significantly decreased, as Streptococcus and Enterococcus richness displayed a decreasing trend. They were identified as LPS-producing bacteria [59,68,69]. Consistently, in this work, serum LPS level was increased in HFD-fed mice. Meanwhile, after DHQ supplementation, the LPS level in serum was significantly decreased in mice fed with a HFD, which might be due to the decreased Streptococcus, Lactococcus, and Enterococcus relative abundance [70]. Taken together, these results suggested that the administration of DHQ can improve the composition of gut microbiota by decreasing the harmful bacteria, especially Lachnoclostridium, Lactococcus and Eubacterium_xylanophilum_group.
To further explain whether the DHQ-alleviated hepatic lipid metabolic dysregulation was associated with gut microbiota, Pearson’s correlation analysis was performed between lipid metabolic parameters and altered intestinal bacteria. In this work, the results showed that the relative abundance of Streptococcus, Lactococcus, and Enterorcoccus had significant positive correlation with serum insulin, LPS, TC, and hepatic TG contents. Streptococcus, Lactococcus, and Enterorcoccus were recognized as the predominant genus in subjects with obesity or fatty liver disorders [59,68,69]. Moreover, Tang et al. demonstrated that unclassified_f_Lachnospiraceae and Lachnoclostridium was relevant for the increase of hepatic TG content [71]. In keeping with this observation, the current study showed that the relative abundance of unclassified_f_Lachnospiraceae and Lachnoclostridium had a positive relationship with serum leptin and hepatic TG levels. As described in previous findings, the relative abundance of Eubacterium_xylanophilum_group had a positive correlation with body mass index and HOMA-IR [65], suggesting that this genera plays a beneficial role in regulating body lipid metabolism. Consistently, the Eubacterium_xylanophilum_group was here found to be positively correlated with the content of leptin, TC in serum, and TG in the liver. Simultaneously, the correlation analysis between flora and key genes associated with hepatic lipid metabolism from transcriptome data was conducted. It was shown that the relative abundance of Streptococcus had a positive correlation with lipogenic genes MOGAT1, MID1IP1, and MLXIPL, but had a negative correlation with fatty acid oxidation genes CPT1A and CYP4A10. Moreover, Lactococcus and Enterorcoccus were positively correlated with DGAT2, MOGAT1, MID1IP1, and MLXIPL, but negatively correlated with CPT1A and CYP4A10. Meanwhile, we also found that Eubacterium_xylanophilum_group richness showed a positive relationship with MOGAT1 and MID1IP1 expression, while it was negatively correlated with CPT1A. This means that Streptococcus, Lactococcus, Enterorcoccus, and the Eubacterium_xylanophilum_group are pivotal bacteria that promoted lipid accumulation in the liver. Furthermore, Lactococcus, Enterorcoccus, and Eubacterium_xylanophilum_group had positive correlation with cholesterol synthesis genes ACAT2, FDPS, HMGCS1, MVD, and NSDHL mRNA levels. Besides, the relative abundance of unclassified_f_Lachnospiraceae was positively correlated with FDPS, HMGCS1, MVD, and NSDHL expression and Lachnoclostridium was positively correlated with FDPS, HMGCS1, and MVD expression in the liver. The data proved that these bacteria might produce adverse effects on cholesterol homeostasis and contribute to excess hepatic cholesterol accumulation, especially Lactococcus, and the Eubacterium_xylanophilum_group. Collectively, the new information here contributed to understanding the improved hepatic lipid metabolism followed by DHQ supplementation, at least in part, was mediated by the alterations of gut microbiota.
5. Conclusions
In the present study, we showed that the treatment of DHQ inhibited the synthesis of lipids and cholesterol, promoted fatty acid oxidation, which was associated with the reduced deleterious bacteria, especially Lactococcus and the Eubacterium_xylanophilum_group. In conclusion, these results demonstrated that DHQ has the potential to be used as an effective dietary supplement in preventing and treating hepatic lipid metabolism disorders, providing a possible approach to human therapy for fatty liver.
Supplementary Materials
The following supporting information can be downloaded at: https://www.mdpi.com/article/10.3390/nu14245214/s1, Figure S1: Total ion chromatography (TIC) of DHQ; Figure S2: Pearson’ s correlation analysis between fecal microbiota at the genus level and hepatic lipid metabolic related genes.
Author Contributions
H.Z., B.Y. and H.H. conceived and designed the experiments; M.W. and H.H. carried out the experiments; M.W., Y.J.D., S.-I.O., X.L., R.Z. and L.L. analyzed the data and drafted the manuscript; B.Y. and F.W. finished editing and revising the manuscript. All authors have read and agreed to the published version of the manuscript.
Funding
This work was supported by the Central Public-interest Scientific Institution Basal Research Fund (No. Y2022GH02 & PJ01618301), the Major Scientific Research Tasks for Scientific and Technological Innovation Projects of the Chinese Academy of Agricultural Sciences (CAAS-ZDRW202006-02) and State Key Laboratory of Animal Nutrition (2004DA125184G2202).
Institutional Review Board Statement
All animal operations were conducted in strict conformity to the Guidelines for Care and Use of Laboratory Animals of Chinese Academy of Agriculture Sciences. The experiments were approved by the regulations of the Animal Ethics Committee of Institute of Animal Science, Chinese Academy of Agriculture Sciences (IAS2021-107).
Informed Consent Statement
Not applicable.
Data Availability Statement
All raw sequences from hepatic transcriptomics and 16S rRNA gene-based analysis were uploaded to NCBI Sequence Read Archive (SRA) database (Accession Number: PRJNA885265 and PRJNA882752).
Acknowledgments
We are very grateful to the reviewers who provided us with suggestions on how to develop this article.
Conflicts of Interest
The authors declare no conflict of interest.
References
- Zhang, Y.; Kishi, H.; Kobayashi, S. Add-on therapy with traditional Chinese medicine: An efficacious approach for lipid metabolism disorders. Pharmacol. Res. 2018, 134, 200–211. [Google Scholar] [CrossRef] [PubMed]
- Watts, G.F.; Karpe, F. Triglycerides and atherogenic dyslipidaemia: Extending treatment beyond statins in the high-risk cardiovascular patient. Heart 2011, 97, 350–356. [Google Scholar] [CrossRef] [PubMed]
- Zhong, S.; Fan, Y.; Yan, Q.; Fan, X.; Wu, B.; Han, Y.; Zhang, Y.; Chen, Y.; Zhang, H.; Niu, J. The therapeutic effect of silymarin in the treatment of nonalcoholic fatty disease: A meta-analysis (PRISMA) of randomized control trials. Medicine 2017, 96, e9061. [Google Scholar] [CrossRef] [PubMed]
- Zaidi, S.N.F.; Mahboob, T. Prevention of liver cirrhosis by Silymarin. Pak. J. Pharm. Sci. 2017, 30, 1203–1211. [Google Scholar] [PubMed]
- Pew, J.C. A flavonone from Douglas-fir heartwood. J. Am. Chem. Soc. 1948, 70, 3031–3034. [Google Scholar] [CrossRef]
- Wallace, S.N.; Carrier, D.J.; Clausen, E.C. Batch solvent extraction of flavanolignans from milk thistle (Silybum marianum L. Gaertner). Phytochem. Anal. 2005, 16, 7–16. [Google Scholar] [CrossRef] [PubMed]
- Lei, L.; Chai, Y.; Lin, H.; Chen, C.; Zhao, M.; Xiong, W.; Zhuang, J.; Fan, X. Dihydroquercetin activates AMPK/Nrf2/HO-1 signaling in macrophages and attenuates inflammation in LPS-induced endotoxemic mice. Front. Pharmacol. 2020, 11, 662. [Google Scholar] [CrossRef]
- Weidmann, A.E. Dihydroquercetin: More than just an impurity? Eur. J. Pharmacol. 2012, 684, 19–26. [Google Scholar] [CrossRef]
- Zhang, Y.; Jin, Q.; Li, X.; Jiang, M.; Cui, B.W.; Xia, K.L.; Wu, Y.L.; Lian, L.H.; Nan, J.X. Amelioration of alcoholic liver steatosis by dihydroquercetin through the modulation of AMPK-dependent lipogenesis mediated by P2X7R-NLRP3-inflammasome activation. J. Agric. Food. Chem. 2018, 66, 4862–4871. [Google Scholar] [CrossRef]
- Khare, P.; Maurya, R.; Bhatia, R.; Mangal, P.; Singh, J.; Podili, K.; Bishnoi, M.; Kondepudi, K.K. Polyphenol rich extracts of finger millet and kodo millet ameliorate high fat diet-induced metabolic alterations. Food Funct. 2020, 11, 9833–9847. [Google Scholar] [CrossRef]
- Su, H.; Wang, W.J.; Zheng, G.D.; Yin, Z.P.; Li, J.E.; Chen, L.L.; Zhang, Q.F. The anti-obesity and gut microbiota modulating effects of taxifolin in C57BL/6J mice fed with a high-fat diet. J. Sci. Food. Agric. 2022, 102, 1598–1608. [Google Scholar] [CrossRef] [PubMed]
- Li, W.; Zhang, L.; Xu, Q.; Yang, W.; Zhao, J.; Ren, Y.; Yu, Z.; Ma, L. Taxifolin alleviates DSS-induced ulcerative colitis by acting on gut microbiome to produce butyric Acid. Nutrients 2022, 14, 1069. [Google Scholar] [CrossRef]
- Wan, F.; Han, H.; Zhong, R.; Wang, M.; Tang, S.; Zhang, S.; Hou, F.; Yi, B.; Zhang, H. Dihydroquercetin supplement alleviates colonic inflammation potentially through improved gut microbiota community in mice. Food Funct. 2021, 12, 11420–11434. [Google Scholar] [CrossRef] [PubMed]
- Wang, Z.; Gerstein, M.; Snyder, M. RNA-Seq: A revolutionary tool for transcriptomics. Nat. Rev. Genet. 2009, 10, 57–63. [Google Scholar] [CrossRef]
- Zivkovic, A.M.; German, J.B.; Sanyal, A.J. Comparative review of diets for the metabolic syndrome: Implications for nonalcoholic fatty liver disease. Am. J. Clin. Nutr. 2007, 86, 285–300. [Google Scholar] [CrossRef]
- Zou, T.; Wang, B.; Li, S.; Liu, Y.; You, J. Dietary apple polyphenols promote fat browning in high-fat diet-induced obese mice through activation of adenosine monophosphate-activated protein kinase α. J. Sci. Food. Agric. 2020, 100, 2389–2398. [Google Scholar] [CrossRef] [PubMed]
- Zhu, Y.; Zhang, J.Y.; Wei, Y.L.; Hao, J.Y.; Lei, Y.Q.; Zhao, W.B.; Xiao, Y.H.; Sun, A.D. The polyphenol-rich extract from chokeberry (Aronia melanocarpa L.) modulates gut microbiota and improves lipid metabolism in diet-induced obese rats. Nutr. Metab. 2020, 17, 54. [Google Scholar] [CrossRef]
- Wu, S.; Liu, Y.; Jiang, P.; Xu, Y.; Zheng, W.; Song, S.; Ai, C. Effect of sulfate group on sulfated polysaccharides-induced improvement of metabolic syndrome and gut microbiota dysbiosis in high fat diet-fed mice. Int. J. Biol. Macromol. 2020, 164, 2062–2072. [Google Scholar] [CrossRef]
- Zhu, Z.; Lin, Z.; Jiang, H.; Jiang, Y.; Zhao, M.; Liu, X. Hypolipidemic effect of Youcha in hyperlipidemia rats induced by high-fat diet. Food Funct. 2017, 8, 1680–1687. [Google Scholar] [CrossRef]
- Zhu, Y.; Wei, Y.L.; Karras, I.; Cai, P.J.; Xiao, Y.H.; Jia, C.L.; Qian, X.L.; Zhu, S.Y.; Zheng, L.J.; Hu, X.; et al. Modulation of the gut microbiota and lipidomic profiles by black chokeberry (Aronia melanocarpa L.) polyphenols via the glycerophospholipid metabolism signaling pathway. Front. Nutr. 2022, 9, 913729. [Google Scholar] [CrossRef]
- Lüscher, T.F.; Landmesser, U.; von Eckardstein, A.; Fogelman, A.M. High-density lipoprotein: Vascular protective effects, dysfunction, and potential as therapeutic target. Circ. Res. 2014, 114, 171–182. [Google Scholar] [CrossRef]
- Villanueva, E.C.; Myers, M.G., Jr. Leptin receptor signaling and the regulation of mammalian physiology. Int. J. Obes. 2008, 32 (Suppl. 7), S8–S12. [Google Scholar] [CrossRef]
- Titchenell, P.M.; Lazar, M.A.; Birnbaum, M.J. Unraveling the regulation of hepatic metabolism by insulin. Trends Endocrinol. Metab. 2017, 28, 497–505. [Google Scholar] [CrossRef] [PubMed]
- Fantuzzi, G.; Faggioni, R. Leptin in the regulation of immunity, inflammation, and hematopoiesis. J. Leukoc. Biol. 2000, 68, 437–446. [Google Scholar] [CrossRef] [PubMed]
- Park, B.G.; Park, Y.S.; Park, J.W.; Shin, E.; Shin, W.S. Anti-obesity potential of enzymatic fragments of hyaluronan on high-fat diet-induced obesity in C57BL/6 mice. Biochem. Biophys. Res. Commun. 2016, 473, 290–295. [Google Scholar] [CrossRef] [PubMed]
- Morris, D.L.; Rui, L. Recent advances in understanding leptin signaling and leptin resistance. Am. J. Physiol. Endocrinol. Metab. 2009, 297, E1247–E1259. [Google Scholar] [CrossRef]
- Zhao, S.; Zhu, Y.; Schultz, R.D.; Li, N.; He, Z.; Zhang, Z.; Caron, A.; Zhu, Q.; Sun, K.; Xiong, W.; et al. Partial leptin reduction as an insulin sensitization and weight loss strategy. Cell Metab. 2019, 30, 706–719. [Google Scholar] [CrossRef]
- Panchal, S.K.; Poudyal, H.; Iyer, A.; Nazer, R.; Alam, M.A.; Diwan, V.; Kauter, K.; Sernia, C.; Campbell, F.; Ward, L.; et al. High-carbohydrate, high-fat diet-induced metabolic syndrome and cardiovascular remodeling in rats. J. Cardiovasc. Pharmacol. 2011, 57, 611–624. [Google Scholar] [CrossRef] [PubMed]
- Jones, J.G. Hepatic glucose and lipid metabolism. Diabetologia 2016, 59, 1098–1103. [Google Scholar] [CrossRef]
- Guo, F.; Huang, C.; Liao, X.; Wang, Y.; He, Y.; Feng, R.; Li, Y.; Sun, C. Beneficial effects of mangiferin on hyperlipidemia in high-fat-fed hamsters. Mol. Nutr. Food Res. 2011, 55, 1809–1818. [Google Scholar] [CrossRef]
- Zuccaro, A.; Zapatería, B.; Sánchez-Alonso, M.G.; Haro, M.; Limones, M.; Terrados, G.; Izquierdo, A.; Corrales, P.; Medina-Gómez, G.; Herradón, G.; et al. Pleiotrophin deficiency induces browning of periovarian adipose tissue and protects against high-fat diet-induced hepatic steatosis. Int. J. Mol. Sci. 2021, 22, 9261. [Google Scholar] [CrossRef]
- Zhang, S.; Zheng, L.; Dong, D.; Xu, L.; Yin, L.; Qi, Y.; Han, X.; Lin, Y.; Liu, K.; Peng, J. Effects of flavonoids from Rosa laevigata Michx fruit against high-fat diet-induced non-alcoholic fatty liver disease in rats. Food Chem. 2013, 141, 2108–2116. [Google Scholar] [CrossRef] [PubMed]
- Wang, Y.; Li, J.Y.; Han, M.; Wang, W.L.; Li, Y.Z. Prevention and treatment effect of total flavonoids in Stellera chamaejasme L. on nonalcoholic fatty liver in rats. Lipids Health Dis. 2015, 14, 85. [Google Scholar] [CrossRef] [PubMed]
- Zhou, Y.; Ding, Y.L.; Zhang, J.L.; Zhang, P.; Wang, J.Q.; Li, Z.H. Alpinetin improved high fat diet-induced non-alcoholic fatty liver disease (NAFLD) through improving oxidative stress, inflammatory response and lipid metabolism. Biomed. Pharmacother. 2018, 97, 1397–1408. [Google Scholar] [CrossRef] [PubMed]
- Chai, C.; Rivkin, M.; Berkovits, L.; Simerzin, A.; Zorde-Khvalevsky, E.; Rosenberg, N.; Klein, S.; Yaish, D.; Durst, R.; Shpitzen, S.; et al. Metabolic circuit involving free fatty acids, microRNA 122, and triglyceride synthesis in liver and muscle tissues. Gastroenterology 2017, 153, 1404–1415. [Google Scholar] [CrossRef]
- Yang, X.F.; Qiu, Y.Q.; Wang, L.; Gao, K.G.; Jiang, Z.Y. A high-fat diet increases body fat mass and up-regulates expression of genes related to adipogenesis and inflammation in a genetically lean pig. J. Zhejiang Univ Sci. B 2018, 19, 884–894. [Google Scholar] [CrossRef]
- Lancha, A.; Rodríguez, A.; Catalán, V.; Becerril, S.; Sáinz, N.; Ramírez, B.; Burrell, M.A.; Salvador, J.; Frühbeck, G.; Gómez-Ambrosi, J. Osteopontin deletion prevents the development of obesity and hepatic steatosis via impaired adipose tissue matrix remodeling and reduced inflammation and fibrosis in adipose tissue and liver in mice. PLoS ONE 2014, 9, e98398. [Google Scholar] [CrossRef]
- Zhu, C.; Huang, M.; Kim, H.G.; Chowdhury, K.; Gao, J.; Liu, S.; Wan, J.; Wei, L.; Dong, X.C. SIRT6 controls hepatic lipogenesis by suppressing LXR, ChREBP, and SREBP1. Biochim. Biophys. Acta Mol. Basis Dis. 2021, 1867, 166249. [Google Scholar] [CrossRef]
- Hall, A.M.; Soufi, N.; Chambers, K.T.; Chen, Z.; Schweitzer, G.G.; McCommis, K.S.; Erion, D.M.; Graham, M.J.; Su, X.; Finck, B.N. Abrogating monoacylglycerol acyltransferase activity in liver improves glucose tolerance and hepatic insulin signaling in obese mice. Diabetes 2014, 63, 2284–2296. [Google Scholar] [CrossRef]
- Soufi, N.; Hall, A.M.; Chen, Z.; Yoshino, J.; Collier, S.L.; Mathews, J.C.; Brunt, E.M.; Albert, C.J.; Graham, M.J.; Ford, D.A.; et al. Inhibiting monoacylglycerol acyltransferase 1 ameliorates hepatic metabolic abnormalities but not inflammation and injury in mice. J. Biol. Chem. 2014, 289, 30177–30188. [Google Scholar] [CrossRef]
- Suh, J.Y.; Lee, H.J.; Sim, D.Y.; Park, J.E.; Ahn, C.H.; Park, S.Y.; Shin, N.; Kim, B.; Shim, B.S.; Kim, S.H. Hypolipogenic effects of Icariside E4 via phosphorylation of AMPK and inhibition of MID1IP1 in HepG2 cells. Phytother Res. 2022. [Google Scholar] [CrossRef] [PubMed]
- Zhang, Y.; Li, Y.; Niepel, M.W.; Kawano, Y.; Han, S.; Liu, S.; Marsili, A.; Larsen, P.R.; Lee, C.H.; Cohen, D.E. Targeted deletion of thioesterase superfamily member 1 promotes energy expenditure and protects against obesity and insulin resistance. Proc. Natl. Acad. Sci. USA 2012, 109, 5417–5422. [Google Scholar] [CrossRef] [PubMed]
- Murea, M.; Freedman, B.I.; Parks, J.S.; Antinozzi, P.A.; Elbein, S.C.; Ma, L. Lipotoxicity in diabetic nephropathy: The potential role of fatty acid oxidation. Clin. J. Am. Soc. Nephrol. 2010, 5, 2373–2379. [Google Scholar] [CrossRef] [PubMed]
- Zhu, S.; Park, S.; Lim, Y.; Shin, S.; Han, S.N. Korean pine nut oil replacement decreases intestinal lipid uptake while improves hepatic lipid metabolism in mice. Nutr. Res. Pract. 2016, 10, 477–486. [Google Scholar] [CrossRef] [PubMed]
- Hoek-van den Hil, E.F.; Keijer, J.; Bunschoten, A.; Vervoort, J.J.; Stankova, B.; Bekkenkamp, M.; Herreman, L.; Venema, D.; Hollman, P.C.; Tvrzicka, E.; et al. Quercetin induces hepatic lipid omega-oxidation and lowers serum lipid levels in mice. PLoS ONE 2013, 8, e51588. [Google Scholar] [CrossRef]
- Zhu, L.; Baker, S.S.; Liu, W.; Tao, M.H.; Patel, R.; Nowak, N.J.; Baker, R.D. Lipid in the livers of adolescents with nonalcoholic steatohepatitis: Combined effects of pathways on steatosis. Metabolism 2011, 60, 1001–1011. [Google Scholar] [CrossRef] [PubMed]
- St-Amand, R.; Ngo Sock, É.T.; Quinn, S.; Lavoie, J.M.; St-Pierre, D.H. Two weeks of western diet disrupts liver molecular markers of cholesterol metabolism in rats. Lipids Health Dis. 2020, 19, 192. [Google Scholar] [CrossRef] [PubMed]
- Arguello, G.; Balboa, E.; Arrese, M.; Zanlungo, S. Recent insights on the role of cholesterol in non-alcoholic fatty liver disease. Biochim. Biophys. Acta 2015, 1852, 1765–1778. [Google Scholar] [CrossRef] [PubMed]
- Groen, A.K.; Bloks, V.W.; Verkade, H.; Kuipers, F. Cross-talk between liver and intestine in control of cholesterol and energy homeostasis. Mol. Aspects Med. 2014, 37, 77–88. [Google Scholar] [CrossRef]
- Goldstein, J.L.; DeBose-Boyd, R.A.; Brown, M.S. Protein sensors for membrane sterols. Cell 2006, 124, 35–46. [Google Scholar] [CrossRef]
- Wang, M.; Cui, B.; Gong, M.; Liu, Q.; Zhuo, X.; Lv, J.; Yang, L.; Liu, X.; Wang, Z.; Dai, L. Arctium lappa leaves based on network pharmacology and experimental validation attenuate atherosclerosis by targeting the AMPK-mediated PPARG/LXRα pathway. Biomed. Pharmacother. 2022, 153, 113503. [Google Scholar] [CrossRef] [PubMed]
- Lorbek, G.; Lewinska, M.; Rozman, D. Cytochrome P450s in the synthesis of cholesterol and bile acids--from mouse models to human diseases. FEBS J. 2012, 279, 1516–1533. [Google Scholar] [CrossRef] [PubMed]
- de Boer, J.F.; Kuipers, F.; Groen, A.K. Cholesterol Transport Revisited: A new turbo mechanism to drive cholesterol excretion. Trends Endocrinol. Metab. 2018, 29, 123–133. [Google Scholar] [CrossRef] [PubMed]
- Spiga, L.; Winter, S.E. Using enteric pathogens to probe the gut microbiota. Trends Microbiol. 2019, 27, 243–253. [Google Scholar] [CrossRef] [PubMed]
- Han, H.; Jiang, Y.; Wang, M.; Melaku, M.; Liu, L.; Zhao, Y.; Everaert, N.; Yi, B.; Zhang, H. Intestinal dysbiosis in nonalcoholic fatty liver disease (NAFLD): Focusing on the gut-liver axis. Crit. Rev. Food Sci. Nutr. 2021, 1–18. [Google Scholar] [CrossRef]
- Illiano, P.; Brambilla, R.; Parolini, C. The mutual interplay of gut microbiota, diet and human disease. FEBS J. 2020, 287, 833–855. [Google Scholar] [CrossRef]
- Zhong, Y.; Song, B.; Zheng, C.; Zhang, S.; Yan, Z.; Tang, Z.; Kong, X.; Duan, Y.; Li, F. Flavonoids from mulberry leaves alleviate lipid dysmetabolism in high fat diet-fed mice: Involvement of gut microbiota. Microorganisms 2020, 8, 860. [Google Scholar] [CrossRef]
- Xu, T.; Hu, S.; Liu, Y.; Sun, K.; Luo, L.; Zeng, L. Hawk tea flavonoids as natural hepatoprotective agents alleviate acute liver damage by reshaping the intestinal microbiota and modulating the Nrf2 and NF-κB signaling pathways. Nutrients 2022, 14, 3662. [Google Scholar] [CrossRef]
- Singh, D.P.; Singh, J.; Boparai, R.K.; Zhu, J.; Mantri, S.; Khare, P.; Khardori, R.; Kondepudi, K.K.; Chopra, K.; Bishnoi, M. Isomalto-oligosaccharides, a prebiotic, functionally augment green tea effects against high fat diet-induced metabolic alterations via preventing gut dysbacteriosis in mice. Pharmacol. Res. 2017, 123, 103–113. [Google Scholar] [CrossRef]
- Chang, C.J.; Lin, C.S.; Lu, C.C.; Martel, J.; Ko, Y.F.; Ojcius, D.M.; Tseng, S.F.; Wu, T.R.; Chen, Y.M.; Young, J.D.; et al. Corrigendum: Ganoderma lucidum reduces obesity in mice by modulating the composition of the gut microbiota. Nat. Commun. 2017, 8, 16130. [Google Scholar] [CrossRef]
- Wang, B.; Yu, H.; He, Y.; Wen, L.; Gu, J.; Wang, X.; Miao, X.; Qiu, G.; Wang, H. Effect of soybean insoluble dietary fiber on prevention of obesity in high-fat diet fed mice via regulation of the gut microbiota. Food Funct. 2021, 12, 7923–7937. [Google Scholar] [CrossRef] [PubMed]
- Kameyama, K.; Itoh, K. Intestinal colonization by a Lachnospiraceae bacterium contributes to the development of diabetes in obese mice. Microbes Environ. 2014, 29, 427–430. [Google Scholar] [CrossRef] [PubMed]
- Qin, J.; Li, Y.; Cai, Z.; Li, S.; Zhu, J.; Zhang, F.; Liang, S.; Zhang, W.; Guan, Y.; Shen, D.; et al. A metagenome-wide association study of gut microbiota in type 2 diabetes. Nature 2012, 490, 55–60. [Google Scholar] [CrossRef] [PubMed]
- Zhao, H.; Kong, L.; Shao, M.; Liu, J.; Sun, C.; Li, C.; Wang, Y.; Chai, X.; Wang, Y.; Zhang, Y.; et al. Protective effect of flavonoids extract of Hippophae rhamnoides L. on alcoholic fatty liver disease through regulating intestinal flora and inhibiting TAK1/p38MAPK/p65NF-κB pathway. J. Ethnopharmacol. 2022, 292, 115225. [Google Scholar] [CrossRef] [PubMed]
- Zhang, L.; Yue, Y.; Shi, M.; Tian, M.; Ji, J.; Liao, X.; Hu, X.; Chen, F. Dietary Luffa cylindrica (L.) Roem promotes branched-chain amino acid catabolism in the circulation system via gut microbiota in diet-induced obese mice. Food Chem. 2020, 320, 126648. [Google Scholar] [CrossRef]
- Claus, S.P.; Ellero, S.L.; Berger, B.; Krause, L.; Bruttin, A.; Molina, J.; Paris, A.; Want, E.J.; de Waziers, I.; Cloarec, O.; et al. Colonization-induced host-gut microbial metabolic interaction. mBio 2011, 2, e00271–e00210. [Google Scholar] [CrossRef] [PubMed]
- Mu, H.; Zhou, Q.; Yang, R.; Zeng, J.; Li, X.; Zhang, R.; Tang, W.; Li, H.; Wang, S.; Shen, T.; et al. Naringin attenuates high fat diet induced non-alcoholic fatty liver disease and gut bacterial dysbiosis in mice. Front. Microbiol. 2020, 11, 585066. [Google Scholar] [CrossRef] [PubMed]
- Jo, J.K.; Seo, S.H.; Park, S.E.; Kim, H.W.; Kim, E.J.; Kim, J.S.; Pyo, J.Y.; Cho, K.M.; Kwon, S.J.; Park, D.H.; et al. Gut microbiome and metabolome profiles associated with high-fat diet in mice. Metabolites 2021, 11, 482. [Google Scholar] [CrossRef] [PubMed]
- Xu, T.; Ge, Y.; Du, H.; Li, Q.; Xu, X.; Yi, H.; Wu, X.; Kuang, T.; Fan, G.; Zhang, Y. Berberis kansuensis extract alleviates type 2 diabetes in rats by regulating gut microbiota composition. J. Ethnopharmacol. 2021, 273, 113995. [Google Scholar] [CrossRef] [PubMed]
- Zhao, Q.; Liu, Z.; Zhu, Y.; Wang, H.; Dai, Z.; Yang, X.; Ren, X.; Xue, Y.; Shen, Q. Cooked adzuki bean reduces high-fat diet-induced body weight gain, ameliorates inflammation, and modulates intestinal homeostasis in mice. Front. Nutr. 2022, 9, 918696. [Google Scholar] [CrossRef]
- Tang, W.; Yao, X.; Xia, F.; Yang, M.; Chen, Z.; Zhou, B.; Liu, Q. Modulation of the gut microbiota in rats by Hugan Qingzhi Tablets during the treatment of high-fat-Diet-induced nonalcoholic fatty liver disease. Oxid. Med. Cell. Longev. 2018, 2018, 7261619. [Google Scholar] [CrossRef] [PubMed]
Publisher’s Note: MDPI stays neutral with regard to jurisdictional claims in published maps and institutional affiliations. |
© 2022 by the authors. Licensee MDPI, Basel, Switzerland. This article is an open access article distributed under the terms and conditions of the Creative Commons Attribution (CC BY) license (https://creativecommons.org/licenses/by/4.0/).