Abstract
Online food delivery (OFD) platforms have become increasingly popular due to advanced technology, which is changing the way consumers purchase food prepared outside of the home. There is limited research investigating the healthiness of the digital food environment and its influence on consumer choice and dietary behaviours. This study is the first to examine the nutritional quality and marketing attributes of menu items from popular independent and franchise restaurants and takeaway outlets on New Zealand’s market leading OFD platform (UberEATS®). A total of 374 popular independent and franchise restaurants and takeaway outlets were identified to form a database of complete menus and marketing attributes. All 25,877 menu items were classified into 38 food and beverage categories based on the Australian Dietary Guidelines. Of complete menus, 73.3% (18,955/25,877) were discretionary. Thirty-six percent (9419/25,877) were discretionary cereal-based mixed meals, the largest of the 38 categories. Discretionary menu items were more likely to be categorized as most popular (OR: 2.0, 95% CI 1.7–2.2), accompanied by a photo (OR: 1.7, 95% CI 1.6–1.8), and offered as a value bundle (OR: 4.6, 95% CI 3.2–6.8). Two of the three discretionary mixed meal categories were significantly less expensive than their healthier counterparts (p < 0.001). The overwhelming availability and promotion of discretionary choices offered by restaurants and takeaway outlets on OFD platforms have implications for public health policy. Further research to explore direct associations between nutritional quality and consumers’ dietary choices is required.
1. Introduction
Obesity has become a global health concern and is associated with the onset of multiple chronic noncommunicable diseases (NCDs) such as type 2 diabetes mellitus, cardiovascular diseases, stroke, and cancers [1,2]. The New Zealand (NZ) Health Survey 2019/2020 conducted by the Ministry of Health found that approximately 31% of the adult population (15 years and over) were obese [3]. The escalating global prevalence of obesity is predominantly driven by dietary changes and lifestyle behaviours [1]. These behaviours include overconsumption of sweets, sugar-sweetened beverages (SSB), processed meats, high-fat dairy products, and packaged, ultra-processed snacks; and low consumption of fruits, vegetables, and wholegrains [1,4,5,6]. The modern food environment acts as a contributor to poor health of adults in NZ. One segment of the food environment is the foodservice sector, which includes dining restaurants, cafés, and fast-food or quick-service restaurants that can provide foods and drinks for immediate consumption [5].
Globally, working individuals have much busier lifestyles, hence the desire to spend less time and effort preparing food at home and increased demand for convenience [7,8]. In NZ, according to a 2018 survey, approximately 80% of children and young adults stated that they had fast-food or takeaway at least once per week [9]. According to the food price index for NZ in 2020, approximately 27% of the food budget was spent on ready-to-eat and restaurant meals which was a slight increase from 26% in 2017 [10,11]. The average Kiwi household food budget on takeaways and restaurant meals has also steadily risen from 22% in 2000 to 27% in 2020 [10]. Additionally, Auckland residents had shown to be spending the highest proportion (32%) of their food budget on takeaways as compared to the national average of 27% [10]. However, frequent consumption of takeaways and fast-foods have been associated with a poor diet quality with increased energy, total fat, sodium, and added sugars content, increasing the risk of obesity and its related comorbidities [6,12,13,14,15].
Smartphones and the internet have provided quick access to food outlets away from home, to order food directly to the consumer’s address at their convenience through online food delivery (OFD) platforms [16]. OFDs enable consumers to choose from a variety of food options from a broad range of foodservice outlets offering various cuisines [5,17,18]. Young adults (15–34 years) are reported to be the largest users of OFD platforms, constituting approximately 48% of users globally and over 25% of users in Australia and NZ [19,20]. More specifically in NZ, 47% of the reported users of OFD platforms in 2021 were young adults (18–34 years) [21].
Internationally, Uber Eats is the most popular food delivery service and remains the largest and the most popular OFD platform in Australia and NZ [20,22]. The majority of most popular food outlets on Uber Eats NZ have been categorized as discretionary and 86% of the popular menu items offered by these outlets are discretionary foods and beverages with low nutritional value [19,23]. An analysis of complete menus from popular independent restaurants and takeaway outlets in Sydney, Australia, reported 81% to be discretionary items and discretionary menu items were also more likely to be categorized as most popular [22]. Additionally, the typical nature of ordering food through OFD platforms for convenience also promotes a sedentary lifestyle, further contributing to the global burden of obesity and NCDs [1,24,25]. As a result of the COVID-19 pandemic, people across the world were forced to stay at home and have relied more on OFD services to access fast-foods and takeaways [26]. Additionally, since the pandemic, most food outlets have increased their geographical delivery distance to reach more consumers, hence increasing accessibility to food choices beyond local food outlets [27].
Multiple studies have demonstrated that OFD platforms use marketing strategies, including but not limited to appealing food images, discounts, combos, and meal deals to heavily influence consumers’ food purchases [16,22,28]. Like the effect of placing products at eye-level on supermarket shelves, “Popular Near You” and “Most Popular” options make food outlets and menu items easily visible on OFD platforms and influence consumers’ food preferences [29,30]. Currently, very limited research has been done on the marketing techniques used by OFD platforms to target consumers, highlighting a research gap.
The use of marketing strategies to promote food outlets and menu items with poor nutritional quality within the currently unregulated space of OFD platforms, highlights the need for policies and interventions. Mandatory kilojoule labelling has been implemented in some Australian states for franchise restaurants/takeaway outlets (i.e., a restaurant group that prepare and sell meals ready for immediate consumption, offered in specialized packaging, e.g., Burger King®) for consumers to make informed choices at point-of-purchase [5,16]. However, independent food outlets (e.g., local pizza or kebab shops), are not subject to this regulation and remain highly unregulated [31]. In NZ, in addition to OFD platforms being unregulated, neither the franchise food outlets nor the independent food outlets are subject to any mandatory labelling.
The primary aim of this study was to evaluate the nutritional quality of all menu items from popular restaurants and takeaway outlets available on Uber Eats in NZ. The secondary aim was to investigate the associations between the nutritional quality and marketing attributes of all menus.
2. Materials and Methods
2.1. Identification of Popular Franchise & Independent Restaurants and Takeaway Outlets
A previous cross-sectional study conducted in Sydney, Australia, and Auckland, NZ searched a total of 186 Auckland, NZ suburbs between 9 and 22 February 2020 to form a database of popular food outlets including independent and franchise food outlets. The identification process is described in detail in a previous study [19]. Auckland was chosen as the location of interest in this study since it is the largest city in NZ with high concentrations of young consumers (15–34 years), who are the primary users of OFD services in general [19,32]. The 10 most popular food outlets were extracted from the “popular near you” section on the Uber Eats platform, for suburbs with above-average populations of young people (>30%, 15–34 years), who are the leading users of OFD platforms [19]. The current analysis commenced in 2022, by which time 20 of the food outlets identified from this previous study ceased partnership with Uber Eats and thus were excluded. Unlike the previous study conducted in Australia [22], this NZ study also included both franchise and independent restaurants and takeaway outlets. In this study, franchise restaurants/takeaway outlets have been defined as chain stores with outlets in two or more locations with the name, brand, logo, and menu consistent across all locations (e.g., McDonalds®, Subway®, KFC®) [33,34]. An independent restaurant/takeaway outlet does not have any other chains and is run by an independent owner, e.g., local kebab or pizza shop [33].
Researchers were not logged into any personal Uber Eats accounts during the search to avoid personalized results and to only access publicly available data. This NZ study focused on evaluating the food outlets identified in the previous study using the Food Environment Score Tool [19,35,36,37]. Franchise stores in different locations were considered individual outlets or “unique”. Unique food outlets were classified as having a different geographical location (e.g., Subway Botany, Subway Mission Bay, etc.).
2.2. Data Extraction
Publicly available complete menus were extracted from the Uber Eats website on 10 September 2020 (via web scraping, ScrapingSolutions) [22]. Complete menus include all menu items available from independent and franchise restaurants and takeaway outlets as displayed on their Uber Eats webpage. Data extracted from these menus for each food outlet included the menu items’ names, descriptions, Uber Eats categories, prices, photos, nutritional information (e.g., the macronutrient profile), and any dietary labelling (e.g., vegan, vegetarian, gluten-free, etc.) if available. In the Australian study, most popular menu items were extracted for analysis from the ‘Most Popular’ section displayed at the top of each food outlet’s webpage [19,22]. However, most of the food outlets in NZ displayed “Picked-for-you” instead, hence was assumed to be the same as “Most Popular” in this study. To improve readability, the term ‘popularized menu items’ will be used in this article combining both ‘most popular’ and ‘picked for you’ categories. Table 1 provides a summary of definitions and the derivations of the data extracted.

Table 1.
Summary of definitions and derivations of data extracted from complete menus of each independent and franchise food outlet on Uber Eats and study outcomes.
2.3. Outcome Measures
This study’s primary outcome was to evaluate the nutritional quality of complete menus from popular independent and franchise restaurants and takeaway outlets available on the market leading OFD platform (i.e., Uber Eats) in NZ. The secondary outcome was to investigate the associations between nutritional quality and marketing attributes for complete menus, including popularity cue, use of photos and promotional offers.
2.3.1. Nutritional Quality
All menu items from the most popular independent and franchise restaurants and takeaway outlets on Uber Eats were classified into 38 food and beverage categories based on the menu item description and/or photo provided of the menu item on the food outlet’s Uber Eats webpage, using an updated version of a classification system previously proposed for a sub-study of the MYMeals project [38]. The Australian Dietary Guidelines were used to define all menu items into Five Food Group (FFG) and discretionary classifications [19,23]. Menu items classified as FFG contain food(s) or a combination of foods from the five food groups: vegetables and legumes/beans, fruit, grain (cereal) foods, mostly wholegrain, and/or high cereal fibre varieties; lean meats and poultry, fish, eggs, tofu, nuts and seeds, and legumes/beans; and milk, yoghurt, cheese and/or alternatives, and mostly reduced fat [19,23]. Australian Dietary Guidelines has defined discretionary foods as foods that are high in saturated fats, sugars, sodium and/or alcohol and lower in dietary fibre [23]. The Australian Dietary Guidelines were used in this study for consistency between similar studies conducted previously [19,22] and because they align with the NZ Eating and Activity Guidelines [39].
The Australian Bureau of Statistics’ (ABS) principles and list for identifying discretionary foods were used to assist categorization [40]. For menu items with insufficient information such as stir-fries, without adequate detail in the description (although stir-fries have excessive sodium and would be considered discretionary if the saturated fat content is >5 g/100 g), a conservative approach was taken. These menu items were classified as a FFG type dish. However, when a menu item contained a discretionary ingredient (e.g., battered, or crumbed meats and seafood, processed meats such as sausages or bacon, katsu (fried) chicken, cream-based curries, or hot chips and SSB as part of a meal deal), then the menu item was classified as discretionary [19,22].
Menu items as part of a value bundle (i.e., meal deals and family deals), were categorized for each food item included. For example, burgers, chips, and drink as part of a meal deal or a combination menu item were all separately analysed for nutritional quality. Combination menu items in this study have been defined as menu items consisting of more than one food/beverage item. For example, menu item ‘fish and chips’ are categorized as a combination menu item as both ‘fish’ and ‘chips’ are individual food items assigned to different food categories (i.e., Meat or alternative-based mixed meal (discretionary) and Fried potato (or similar) respectively). Unlike this current NZ study, the Australian study included combination menu items and coded these items as meal deals when there was an option to purchase the individual components from the food outlet and the combination meal was available at a discounted price [22]. Combination menu items in the Australian study were only assigned a single category for nutritional quality based on the main component of the menu item. For example, ‘fish and chips’ in the Australian study were categorized as meat or alternative-based mixed meal (discretionary) only; unlike the NZ study which also categorized ‘chips’. The combination menu items contain more than one food/beverage item, hence in the NZ study, they were analysed separately to avoid an overlap of food and beverage categories in the analysis.
All SSB (i.e., beverages containing added sugars or nutritive sweeteners such as soft drinks, bubble teas, and milk or alternative-based beverages with discretionary items such as syrups and sweeteners) were classified as discretionary. For food outlets that allowed consumers to design their own meal, e.g., Subway; the nutritional analysis was based on the image and description provided on the OFD platform as a suggestion for the consumers. Furthermore, menu items that lacked significant data to enable classification into one of the groups were classified as “undetermined” as there were multiple categories they could be assigned to (e.g., “drink” or “meat dish”, with no image or description provided for classification). Additionally, some inedible menu items (e.g., cutlery) were classified as “non-consumable”. All menu items categorized as undetermined and non-consumable were excluded from data analysis. The nutritional analysis of all menu items was conducted by a student dietitian (NM). A random 20% of the data was cross-checked by a registered dietitian (RR) and there were no disagreements.
2.3.2. Marketing Attributes
Marketing attributes included: popularity cue (Uber eats category of “Most Popular” and “Picked-for-you”), price, photo of menu item, value bundles, special promotions, nutritional information, and dietary labelling. The web scraping company extracted marketing attributes, excluding value bundles, special promotions, and picked-for-you categories, during data extraction from the Uber Eats website. The Uber eats category “Picked-for-you” was a new category added after the data had been extracted, menu items under this category were manually coded during the nutritional analysis. Value bundles such as meal deals, and family deals were coded manually during the nutritional analysis using the menu items’ names and descriptions. Menu items with value bundles (i.e., meal deals and family deals) were expected to increase the median price of the menu items due to their higher costs, and thus were excluded from the price analysis. Additionally, promotional offers such as “Buy 1, get 1 free”, “Free with $20 purchase (add to cart)”, etc., categories displayed by some food outlets were also manually entered under ‘Special Promotions’ during the nutritional analysis as they were not present during the original web scraping process. Special promotions were excluded from price analysis. Menu items that were under the “catering” or “party” categories or had similar terms in their descriptions or names were coded under the ‘Catering and Party Packs’ category. Some menu items were categorized under both ‘catering and party packs’ and ‘family deals’. An example of this is a menu item under the Uber Eats category ‘Family Meals’ and named ‘Party Packs’. Table 1 provides a summary of the definitions of these study outcomes.
2.4. Data Analysis
All data was collated on Microsoft Excel (Version 16.56, Microsoft Corporation, Redmond, Washington, DC, USA). Food and beverage categories that were less than 10% of all menu items were grouped into four categories: Other Food (discretionary), Other Food (FFG), Other Beverage (discretionary), and Other Beverage (FFG). To analyse the nutritional quality and the marketing attributes of all menu items, descriptive statistics such as proportions were calculated (Table 2). Categorical variables (nutritional quality, popularity, value bundles, photo, special promotions, nutritional information, and dietary labelling) were summarized using frequencies and proportions. All inferential statistical analysis were performed using SPSS Statistics Version 27 (IBM, Armonk, New York, NY, USA). Chi-squared tests with Bonferroni multiple comparisons correction and odds ratios were used for categorical variables to identify significant differences between (i) discretionary and FFG menu items (Table 3 and Table 4) and (ii) popularized and regular menu items (Table 4) (iii) independent outlets and franchise outlets. The variable ‘price’ was summarized as medians and interquartile intervals. Finally, Kruskal–Wallis tests with multiple comparisons corrections were used for continuous variable (price) to identify significant differences between (i) popularized menu items and regular menu items (Table 5) and (ii) comparable discretionary and FFG food and beverage categories (Table 5).
3. Results
3.1. Selection of Menu Items
A total of 29,764 menu items were available from complete menus of 354 unique popular independent and franchise restaurants and takeaway outlets available on Uber Eats in NZ (Figure 1). Of all menu items, 141 undetermined and non-consumable menu items were excluded. A total of 29,623 menu items, 3746 of which were combination menu items (that were analysed separately), were available for analyses of nutritional quality and marketing attribute, excluding price. Out of 25,877 menu items, 1571 were popularized menu items on Uber Eats. Following further exclusion of 513 catering and party packs, meal deals, family deals, and menu items with price unavailable, 25,364 menu items remained for price analysis, out of which 1518 were a popularized category.
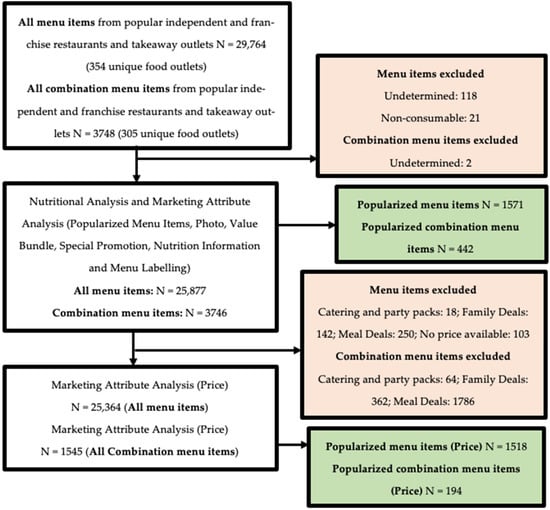
Figure 1.
Flow diagram outlining the inclusion of menu items in each analysis.
Out of 29,764 menu items, 3748 (12.6%) were combination menu items (Figure 1). Of the 354 restaurants and takeaway outlets that were analysed, 86.2% (305/354) included combination menu items. After excluding 2 undetermined menu items, 3746 combination menu items remained for nutritional analysis and all marketing attributes, excluding price. Out of 3746 combination menu items, 442 were popularized by Uber Eats. As combination menu items consist of more than one food/beverage category, analysis for nutritional quality and marketing attributes was conducted by including all menu items which contained the food/beverage categories of interest. Following further exclusion of 2212 catering and party packs, meal deals, and family deals, with 6 menu items consisting of both catering and party packs and family deals, 1545 menu items were available for price analysis, out of which 194 were popularized menu items.
3.2. Nutritional Quality and Marketing Attributes
3.2.1. Nutritional Quality and Popularized Menu Items
Table 2 shows the proportions of each food and beverage category for all menu items. Most of all menu items were discretionary (73.3%, 18,955/25,877). The discretionary cereal-based mixed meal category was the largest category within complete menus (36.4%, 9419/25,877) (Table 2). This category included burgers, pizzas, sandwiches, wraps, pasta, entrées, and sides. The second largest category was discretionary meat or alternative-based mixed meals (8.9%, 2308/25,877). This category included menu items such as deep-fried meat and seafood meals, processed meats, ribs, meat, or seafood meals with an excessive amount of sauce added as shown in the menu photo (if available), or meat/seafood curries including discretionary ingredients such as butter and cream (e.g., butter chicken) or other coconut-based or cream-based curries, including paneer or tofu.
Table 2.
The proportion of food and beverage categories in complete menus (N = 25,877) from 354 local independent and franchise restaurants and takeaway outlets in descending order. Excludes combination menu item menu items.
Table 2.
The proportion of food and beverage categories in complete menus (N = 25,877) from 354 local independent and franchise restaurants and takeaway outlets in descending order. Excludes combination menu item menu items.
| Type of Category | Food Categories | n | % |
|---|---|---|---|
| Discretionary | Cereal-based mixed meal | 9419 | 36.4 |
| Meat or alternative based mixed meal | 2308 | 8.9 | |
| Sugar-Sweetened Beverages | 1673 | 6.5 | |
| Baked goods/Desserts (homemade or similar) | 1001 | 3.9 | |
| Other Beverage b | 979 | 3.8 | |
| Vegetable-based mixed meal | 763 | 2.9 | |
| Discretionary Milk Based Beverages | 698 | 2.7 | |
| Savoury Sauces, Condiments and Spreads | 670 | 2.6 | |
| Iced confectionary and dairy-based desserts | 617 | 2.4 | |
| Fried Potato (or similar) | 445 | 1.7 | |
| Other Food a | 382 | 1.5 | |
| Total Discretionary | 18,955 | 73.3 | |
| Five Food Groups (FFG) | Cereal-based mixed meal | 2366 | 9.1 |
| Meat or alternative based mixed meal | 1459 | 5.6 | |
| Vegetable-based mixed meal | 889 | 3.4 | |
| Other Beverage d | 811 | 3.1 | |
| Other Food c | 533 | 2.1 | |
| Juice | 482 | 1.9 | |
| Water | 382 | 1.5 | |
| Total FFG | 6922 | 26.7 | |
| Total | 25,877 |
a Confectionery, Discretionary snack food (Savoury)—Packaged, Discretionary snack food (Sweet)—Packaged, Other snack food (other), Processed Meats, b Alcohol, Energy Drinks, Non-Sugar Sweetened Beverages, Rehydration Beverages (Electrolytes), Water Based Flavoured Beverage—sugar not determined, c Breads and Cereals, Dairy and alternatives, Fats/Oils, Fruit, Legumes, Meat and Alternatives, Soup, Vegetables (Other), d Body Building and Performance Beverages, Coffee, Milk/Milk Alternatives, Milk/Milk Alternative Based Beverages, Tea.
Table 3 shows the proportion of discretionary and FFG menu items within complete menus and each marketing characteristic. Popularized menu items comprised 6.1% (1571/25,877) of complete menus and the majority of the popularized menu items were significantly discretionary (83.8%, 1317/1571) (Table 3). Furthermore, a discretionary menu item was more likely (OR: 2.0, 95% CI 1.7–2.2) to be popularized compared to a FFG menu item. The discretionary cereal-based mixed meal category was the largest category from the popularized menu items (48.9%, 768/1571). The second-largest category for popularized menu items was meat or alternative-based mixed meals (19.7%, 310/1571).
Table 3.
The proportion of discretionary categories compared against Five Good Group (FFG) categories within marketing attributes for complete menus 1. Excludes combination menu item menu items.
Table 3.
The proportion of discretionary categories compared against Five Good Group (FFG) categories within marketing attributes for complete menus 1. Excludes combination menu item menu items.
| Characteristic | Discretionary (%) | Five Food Group (%) | Total | Odds Ratio (95% CI) |
|---|---|---|---|---|
| Popularized Menu Items | 1317 (83.8) | 254 (16.2) | 1571 | 2.0 (1.7–2.2) ** |
| Photo | 13,591 (76.7) | 4132 (23.3) | 17,723 | 1.7 (1.6–1.8) ** |
| Value Bundle | 363 (92.6) | 29 (7.4) | 392 | 4.6 (3.2–6.8) ** |
| Special Promotions | 265 (74.4) | 91 (25.6) | 356 | 1.1 (0.8–1.4) |
| Total Menu Items | 18,955 (73.3) | 6922 (26.7) | 25,877 |
1 The odds ratio was calculated for discretionary categories compared against FFG categories. The percentages are within each marketing attribute. ** Statistically significant p < 0.001. Abbreviation: CI = confidence interval.
3.2.2. Nutritional Quality and Combination Popularized Menu Items
The proportion of each food and beverage category for popularized and regular menu items within combination menu items is provided in Supplementary File S1. Since combination menu items contain more than one food/beverage item, analysis of the nutritional quality and marketing attributes included all menu items which contained the food/beverage category of interest. The majority (90.0%, 1176/1306) of popularized combination menu items and 81.1% (6941/8562) of remaining combination menu items contained at least one discretionary food/beverage category (Supplementary File S1). Fried potato (or similar) was the largest category for both popularized unique combination menu items (65.4%, 289/442) and for the remaining combination menu item (53.0%, 1752/3304). This category mainly included potato/kumara fries or wedges that were one of the food items in the meal deal or combination menu item. Discretionary cereal-based mixed meals were the second largest food category for both popularized unique combination menu items (51.1%, 226/442) and the remaining combination menu item (47.7%, 1577/3304). This included combo meals (i.e., meal deals) or combination menu items that contained discretionary cereal-based mixed meal items such as burgers, wraps, discretionary breads (i.e., butter naan, garlic bread, etc.), and pizzas.
Popularized unique combination menu item menu items comprised 11.8% (442/3746) of total unique combination menu items and the majority of the popularized menu items were discretionary (90.0%, 1176/1306). There were no significant differences between all four outlet categories (independent takeaway, independent restaurant, franchise takeaway, franchise restaurant) in terms of nutritional quality for all menu items.
3.2.3. Photos
Within complete menus, 68.5% (17,723/25,877) of the menu items were accompanied by a photo (Table 4). A higher proportion of discretionary menu items (71.7%, 13,591/18,955) had photos compared to FFG menu items (59.7%, 4132/6922) (p < 0.001) (Table 4). Discretionary menu items were 1.7 times more likely (OR: 1.7, 95% CI 1.6–1.8) to include a photo as compared to the FFG menu items (Table 3). Among the popularized menus, 78.5% (1234/1571) were accompanied by a photo and were also more likely to have a photo compared to all menu items (p < 0.001). A higher proportion of discretionary popularized menu items (82.7%, 1089/1317) had photos compared to FFG popularized menu items (57.1%, 145/254) (Table 4).
Table 4.
Prevalence of photos, value bundles and special promotions for all menu items (N = 25,877) and popularized menu items (n = 1571) of 354 independent and franchise restaurants and takeaway outlets 1. All menu items include popularized menu items and remaining regular menu items.
Table 4.
Prevalence of photos, value bundles and special promotions for all menu items (N = 25,877) and popularized menu items (n = 1571) of 354 independent and franchise restaurants and takeaway outlets 1. All menu items include popularized menu items and remaining regular menu items.
| Food & Beverage Group | Food & Beverage Category | Marketing Attributes | All Menu Items | Popularized Menu Items | ||
|---|---|---|---|---|---|---|
| n | % | n | % | |||
| Food (Discretionary) | Cereal-based mixed meal | Photo | 7193 | 76.4 | 671 | 87.4 ** |
| Value Bundle | 105 | 1.1 | 3 | 0.4 * | ||
| Special Promotions | 151 | 1.6 | 10 | 1.3 | ||
| Meat or alternative-based mixed meal | Photo | 993 | 43.0 | 236 | 76.1 ** | |
| Value Bundle | 69 | 3.0 | 37 | 11.9 ** | ||
| Special Promotions | 13 | 0.6 | 1 | 0.3 | ||
| Savoury Sauces, Condiments and Spreads | Photo | 260 | 38.8 | 2 | 50.0 | |
| Value Bundle | 0 | 0 | 0 | 0 | ||
| Special Promotions | 0 | 0 | 0 | 0 | ||
| Fried Potato (or similar) | Photo | 316 | 71.0 | 30 | 65.2 | |
| Value Bundle | 1 | 0.2 | 1 | 2.2 * | ||
| Special Promotions | 3 | 0.7 | 0 | 0 | ||
| Food (Discretionary) | Baked goods/ desserts (homemade or similar) | Photo | 894 | 89.3 | 49 | 98.0 * |
| Value Bundle | 181 | 18.1 | 6 | 12.0 | ||
| Special Promotions | 30 | 3.0 | 0 | 0 | ||
| Iced confectionary and dairy-based desserts | Photo | 565 | 91.6 | 21 | 87.5 | |
| Value Bundle | 2 | 0.3 | 0 | 0 | ||
| Special Promotions | 2 | 0.3 | 0 | 0 | ||
| Vegetable-based mixed meal | Photo | 386 | 50.6 | 14 | 31.1 * | |
| Value Bundle | 5 | 0.7 | 0 | 0 | ||
| Special Promotions | 13 | 1.7 | 1 | 2.2 | ||
| Other Food a | Photo | 331 | 86.6 | 5 | 100.0 | |
| Value Bundle | 0 | 0 | 0 | 0 | ||
| Special Promotions | 1 | 0.3 | 0 | 0 | ||
| Beverage (Discretionary) | Sugar-Sweetened Beverages | Photo | 1208 | 72.2 | 8 | 72.7 |
| Value Bundle | 0 | 0 | 0 | 0 | ||
| Special Promotions | 22 | 1.3 | 0 | 0 | ||
| Other Beverage b | Photo | 843 | 86.1 | 10 | 90.9 | |
| Value Bundle | 0 | 0 | 0 | 0 | ||
| Special Promotions | 8 | 0.8 | 0 | 0 | ||
| Milk Based Beverages | Photo | 602 | 86.2 | 43 | 100.0 * | |
| Value Bundle | 0 | 0 | 0 | 0 | ||
| Special Promotions | 22 | 3.2 | 2 | 4.7 | ||
| Total Discretionary | Photo | 13,591 | 71.7 # | 1089 | 82.7 | |
| Value Bundle | 363 | 1.9 # | 47 | 3.6 | ||
| Special Promotions | 265 | 1.4 | 14 | 1.1 | ||
| Food (FFG) | Cereal-based mixed meal | Photo | 1618 | 68.4 | 82 | 60.3 |
| Value Bundle | 21 | 0.9 | 4 | 2.9 | ||
| Special Promotions | 28 | 1.2 | 1 | 0.7 | ||
| Vegetable-based mixed meal | Photo | 427 | 48.0 | 9 | 42.9 | |
| Value Bundle | 0 | 0 | 0 | 0 | ||
| Special Promotions | 8 | 0.9 | 0 | 0 | ||
| Meat or alternative-based mixed meal | Photo | 422 | 28.9 | 50 | 58.1 ** | |
| Value Bundle | 8 | 0.5 | 2 | 2.3 * | ||
| Special Promotions | 1 | 0.1 | 0 | 0 | ||
| Other Food c | Photo | 173 | 32.5 | 2 | 22.2 | |
| Value Bundle | 0 | 0 | 0 | 0 | ||
| Special Promotions | 2 | 0.4 | 0 | 0 | ||
| Beverage (FFG) | Water | Photo | 329 | 86.1 | 0 | 0 |
| Value Bundle | 0 | 0 | 0 | 0 | ||
| Special Promotions | 8 | 2.1 | 0 | 0 | ||
| Other Beverage d | Photo | 763 | 94.1 | 2 | 100.0 | |
| Value Bundle | 0 | 0 | 0 | 0 | ||
| Special Promotions | 32 | 3.9 | 0 | 0 | ||
| Juice | Photo | 400 | 83.0 | 0 | 0 | |
| Value Bundle | 0 | 0 | 0 | 0 | ||
| Special Promotions | 12 | 2.5 | 0 | 0 | ||
| Total FFG | Photo | 4132 | 59.7 | 145 | 57.1 | |
| Value Bundle | 29 | 0.4 | 6 | 2.4 | ||
| Special Promotions | 91 | 0.5 | 1 | 0.4 | ||
| Total | Photo | 17,723 | 68.5 | 1234 | 78.5 ** | |
| Value Bundle | 392 | 1.5 | 53 | 3.4 ** | ||
| Special Promotions | 356 | 1.4 | 15 | 1.0 | ||
a Confectionery, Discretionary snack food (Savoury)—Packaged, Discretionary snack food (Sweet) Packaged, Other snack food (other), Processed Meats. b Alcohol, Energy Drinks, Non-Sugar Sweetened Beverages, Rehydration Beverages (Electrolytes), Water Based Flavoured Beverage—sugar not determined. c Breads and Cereals, Dairy and alternatives, Fats/Oils, Fruit, Legumes, Meat and Alternatives, Soup, Vegetables, Vegetables (Other). d Body Building and Performance Beverages, Coffee, Milk/Milk Alternatives, Milk/Milk Alternative Based Beverages, Tea. 1 Percentages are within each Food & Beverage Category where displayed, otherwise within the Total. ** p < 0.001 compared to all menu items and their FFG or Discretionary counterpart. * p < 0.01 compared to all menu items and their FFG or Discretionary counterpart. # p < 0.001 compared to Total FFG (All Menu Items). Chi-squared tests with Bonferroni multiple comparisons correction were used to generate p values.
3.2.4. Value Bundles
Within all menu items, 1.5% (392/25,877) were a value bundle (Table 4). A higher proportion of discretionary menu items (1.9%, 363/18,955) were offered as a value bundle compared to FFG menu items (0.4%, 29/6922) (p < 0.001) (Table 4). Discretionary menu items were more likely (OR: 4.6, 95% CI 3.2–6.8) to be offered as a value bundle compared to a FFG menu item (Table 3). Baked goods/desserts (homemade or similar) made up 46% (181/392) of all value bundles, the largest category for this marketing attribute (Table 4). There was a significant difference in the number of value bundles within the popularized menu items compared to regular menu items (p < 0.001). Like complete menus, a higher proportion of discretionary popularized menu items (3.6%, 47/1317) were offered as a value bundle compared to FFG popularized menu items (2.4%, 6/254) (p < 0.001) (Table 4).
3.2.5. Special Promotions
Within complete menus, 1.4% (356/25,877) of the menu items included special promotions (Table 4). A higher proportion of discretionary menu items (74.4%, 265/356) included special promotions compared to FFG menu items (25.6%, 91/356) (Table 4). However, there was no significant difference in the number of special promotions within the discretionary menu items compared to FFG menu items (p = 0.610). Similarly, no significant difference was found in the number of special promotions within the popularized menu items compared to all menu items (p = 0.139).
3.2.6. Price
Table 5 shows the median prices (in NZD) of the (i) popularized and (ii) regular menu items, excluding catering and party packs and value bundles. The median price of the popularized menu items was significantly higher than regular menu items for savoury sauces, condiments, and spreads (p = 0.019), fried potato (or similar) (p < 0.001), baked goods/desserts (homemade or similar) (p < 0.001), discretionary vegetable-based mixed meals (p = 0.001), iced confectionery and dairy-based desserts (p < 0.001), FFG cereal-based mixed meals (p < 0.001), FFG vegetable-based mixed meals (p < 0.001) and discretionary other beverages (p = 0.003). However, the median price of the popularized menu items for FFG meat or alternative-based mixed meals, was significantly less than the regular menu items (p = 0.004). Additionally, the median price of the popularized menu items for discretionary cereal-based mixed meals was the same as regular menu items, hence no significant difference was found (p = 0.128).
Figure 2 compares the median price between categories with discretionary and FFG counterparts for all menu items. All menu items include both regular menu items (unpopularized) and popularized menu items which have been separately identified in Table 5. The median price for discretionary cereal-based mixed meals ($12.60) was higher than its FFG counterpart ($11.60). However, this price difference between discretionary and FFG cereal-based mixed meals was not significant (p = 0.607). On the other hand, the median price of both discretionary meat or alternative-based mixed meals ($16.00) and discretionary vegetable-based mixed meals ($12.20) was lower than their FFG counterpart ($19.00, p < 0.001 and $14.00, p < 0.001 respectively).
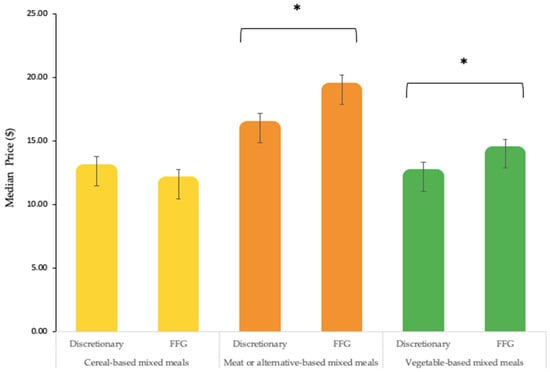
Figure 2.
Median price (in NZD) of all discretionary and Five Food Group (FFG) mixed meal menu items excluding catering and party packs, value bundles, combination menu items and menu items with price unavailable. All menu items include regular menu items and popularized menu items. Error bars display interquartile interval, * p < 0.001.
Table 5.
Median price (in NZD) of popularized and regular menu items for each food or beverage category. Regular menu items exclude popularized menu items. Catering and party packs, value bundles, combination menu items and menu items with price unavailable were excluded (N = 25,364).
Table 5.
Median price (in NZD) of popularized and regular menu items for each food or beverage category. Regular menu items exclude popularized menu items. Catering and party packs, value bundles, combination menu items and menu items with price unavailable were excluded (N = 25,364).
| Food or Beverage Group | Food or Beverage Category | Popularized Menu Items | Regular Menu Items | p-Value | ||||
|---|---|---|---|---|---|---|---|---|
| Median Price ($) | Q1 | Q3 | Median Price ($) | Q1 | Q3 | |||
| Food (Discretionary) | Cereal-based mixed meal | 12.60 | 10.20 | 16.00 | 12.60 | 8.95 | 15.90 | 0.128 |
| Meat or alternative based mixed meal | 15.98 | 8.20 | 18.97 | 16.00 | 10.00 | 19.90 | 0.865 | |
| Savoury Sauces, Condiments and Spreads | 5.00 | 3.13 | 8.00 | 1.50 | 0.50 | 4.00 | 0.019 * | |
| Fried Potato (or similar) | 6.99 | 5.25 | 9.90 | 4.99 | 3.83 | 7.43 | 0.000 ** | |
| Baked goods/desserts (homemade or similar) | 9.95 | 5.75 | 17.40 | 5.20 | 2.20 | 7.90 | 0.000 ** | |
| Vegetable-based mixed meal | 16.00 | 13.80 | 19.50 | 12.20 | 8.40 | 17.00 | 0.000 * | |
| Iced confectionary and dairy-based desserts | 12.99 | 6.90 | 15.24 | 6.10 | 4.90 | 12.99 | 0.000 ** | |
| Other Food a | 6.45 | 6.05 | 7.23 | 6.75 | 4.45 | 8.10 | 0.909 | |
| Food (FFG) | Cereal-based mixed meal | 16.99 | 13.00 | 18.50 | 11.60 | 9.80 | 16.99 | 0.000 ** |
| Vegetable-based mixed meal | 19.00 | 15.00 | 18.50 | 14.00 | 10.40 | 18.00 | 0.000 ** | |
| Meat or alternative based mixed meal | 17.95 | 15.99 | 21.25 | 19.00 | 16.90 | 21.90 | 0.004 * | |
| Food (FFG) | Other Food c | 5.90 | 2.75 | 7.45 | 4.00 | 2.59 | 8.00 | 0.639 |
| Beverage (Discretionary) | Sugar Sweetened Beverages | 5.65 | 3.00 | 6.45 | 4.60 | 4.00 | 5.40 | 0.103 |
| Other Beverage b | 6.35 | 5.70 | 6.90 | 5.40 | 4.40 | 5.80 | 0.003 * | |
| Discretionary Milk Based Beverages | 6.50 | 4.30 | 8.00 | 5.76 | 5.10 | 7.25 | 0.265 | |
| Beverage (FFG) | Water | - | - | - | 4.15 | 3.60 | 5.00 | - |
| Other Beverage d | 7.33 | 5.65 | - | 5.00 | 4.50 | 6.00 | 0.075 | |
| Juice | - | - | - | 4.80 | 4.10 | 5.00 | - | |
a Confectionery, Discretionary snack food (Savoury)—Packaged, Discretionary snack food (Sweet) Packaged, Other snack food (other), Processed Meats. b Alcohol, Energy Drinks, Non-Sugar Sweetened Beverages, Rehydration Beverages (Electrolytes), Water Based Flavoured Beverage—sugar not determined. c Breads and Cereals, Dairy and alternatives, Fats/Oils, Fruit, Legumes, Meat and Alternatives, Soup, Vegetables, Vegetables (Other). d Body Building and Performance Beverages, Coffee, Milk/Milk Alternatives, Milk/Milk Alternative Based Beverages, Tea. Q = Quartile. * p < 0.05. ** p < 0.001. Kruskal–Wallis tests with multiple comparisons corrections were used to generate the p-values.
3.2.7. Nutritional Information and Dietary Labelling
Nutritional information was available for 19.7% (5095/25,877) of all menu items and only energy (kJ/kcal) values were provided for most of these menu items. Out of 5096 menu items with nutritional information, 99% (5061/5095) were provided for Subway takeaway outlet menu items which included a link to their website for all nutritional information, including nutrition information panel, ingredients, and allergens for their complete menu. Dietary labelling was found for 714 menu items which comprised mostly of gluten-free, vegan, and vegetarian labels. Nutrition information was absent from all outlets except for one franchise outlet, Subway.
4. Discussion
This study is one arm of a multi-national study, and to our knowledge, the first to assess the nutritional quality and marketing attributes of menu items of popular independent and franchise restaurants and takeaway outlets on a market leading OFD platform in NZ. Discretionary food and beverages made up majority of the menus and compared to FFG menu items, were more likely to be in the popularized section, accompanied by a photo, offered as a value bundle, and included in special promotions. Nutritional and dietary labelling was also excluded from a large proportion of menu items from the restaurants and takeaway outlets. Additionally, discretionary mixed meals were less expensive than their FFG counterparts.
Approximately three-quarters (73.3%) of all menu items from popular independent and franchise restaurants and takeaway outlets were discretionary and were more likely to be popularized and marketed to the consumers on the OFD platform. Almost 9 out of 10 of the popular menu items were discretionary in Sydney and Auckland [19]. Likewise, 9 out of 10 of the popularized combination menu items included discretionary food/beverage items, hence classified as unhealthy. Findings from studies conducted by Poelman et al. [41] and Jaworowska et al. [42,43], also align with the results of our study, that a large proportion of menu items offered on OFD platforms are of poor nutritional quality. Regardless of outlet type (franchise or independent, restaurant or takeaway), there were no significant differences in the proportion of discretionary foods available. Discretionary menu items were 2 times more likely (OR: 2.0, 95% CI 1.7–2.2) to be popularized which means unhealthy food and beverages are more visible to consumers on the OFD platform when a food outlet is selected, compared to healthier menu items.
There is a possibility that the COVID-19 pandemic accelerated the use of OFD platforms [26,44,45]. Since all food outlets were forced to shut during the initial Alert Level 4 lockdown in NZ, including OFD services, consumers had no access to restaurants and takeaway foods during those seven weeks [46]. Once these restrictions were slightly eased under Level 3, permitting takeaway outlets and OFD platforms to resume, there was a significant increase in takeaway sales, including online, hence a predicted increase in consumption of unhealthy foods and beverages [47,48]. These reports also align with Uber’s yearly report which disclosed that their delivery bookings grew 113% in the second quarter of 2020 and revenue increased by 103% in August 2020 as compared to the previous year [49]. Uber also reported seeing a 30% increase in customers signing up for the service in the same year [50]. Furthermore, there was a shift in dietary patterns towards more discretionary foods and beverages, and a selection of unhealthier food options due to pandemic-related anxiety in NZ [46,51]. This raise concerns as an increase in consumption of energy-dense and nutrient poor foods further increases health risks such as obesity and NCDs [14]. Furthermore, the WHO Obesity Report 2022 has also reported that individuals carrying excess bodyweight and/or those with NCDs have shown to have an increased risk of mortality from COVID-19 [52].
Approximately half of the popularized menu items in NZ were discretionary cereal-based mixed meals such as burgers and pizza. For combination menu items, discretionary cereal-based mixed meals were included in more than half of the popularized combination menu items, however fried potato (or similar) was the most dominant food category and was included in approximately 7 out of 10 of the popularized combination menu items (Supplementary File S1). Another cross-sectional study conducted across three international cities also found that pizzas and burgers were the most common food options to be promoted and marketed on the platform [41]. Discretionary menu items are likely to be frequently purchased and remain under the popularized category for the individual food outlets, if the Uber Eats algorithm for popularized menu items is based on sales [53].
Discretionary menu items were more likely to be accompanied by a photo, offered as a value bundle, and have special promotions as compared to FFG menu items on Uber Eats. Uber Eats is therefore not only dominated by discretionary foods and beverages, but discretionary menu items are also largely subjected to the use of marketing attributes. This was also the case in Sydney, Australia [22]. Additionally, Uber Eats also reported a massive surge in “family meals” with bundles in 2021 for Australia and NZ, as more people were spending time at home [53]. Discretionary menu items were approximately five times more likely to be offered as a value bundle as compared to an FFG menu item. This raises public health concerns as value bundles increase the energy content of the meal without adding any beneficial nutrients [54]. Similarly, a 2020 study in Brazil reported that unhealthier foods were advertised more frequently and were marketed more predominantly using discounts, free deliveries, and combos, compared to healthier foods [28]. Another Australian study reported that marketing attributes such as price, appealing food images, and value for money food items significantly influence the dietary preferences of young people [16].
Images are strong influencers of dietary choice [16]. Popular OFD platforms have also reported that appealing photography of the menu items on the digital platform is a key factor in increasing consumer’s appetite and boosting sales [55]. A 2017 study in the US also reported that presenting attractive pictures of menu items increases consumers’ attitudes, purchasing intentions, and willingness to pay, therefore increasing sales and profit [56]. Despite multiple studies reporting that food and beverages with poor nutritional quality are more likely to have images, further research is required regarding how these images influence consumers’ purchasing and dietary behaviours on OFD platforms.
Special promotions and offers were another marketing characteristic analysed which was unique to this study. Special promotions are price-based promotions that provide consumers with discounts if they purchased food of up to a certain amount (i.e., ‘free delivery’ if cart total is up to $30). Discretionary menu items were more likely to have special promotions than FFG menu items. More recently, Uber has also introduced another feature for all its’ services called ‘Uber Pass’, a monthly subscription providing discounts and offers, including free delivery on food and groceries [57,58]. Since young adults are the largest and more frequent users of Uber Eats [20], they are also highly likely to have subscribed to this service considering expensive delivery charges on some food delivery. However, this data is not made publicly available.
According to previous research, consumers’ choice of food outlets on OFD platforms have shown to be influenced by average price when comparing within the same cuisine [59]. Considering that young individuals are the largest users of OFD platforms they are more likely to be price-sensitive given the limited budgets of full or part-time students [16]. Menu items from two of the three discretionary mixed meal categories were significantly less expensive than their comparable FFG category. The FFG cereal-based mixed meal was the only category where meals were cheaper than the discretionary counterparts. Similarly, the Australian study found that two out of three FFG mixed meal categories were significantly less expensive than their discretionary counterparts [22]. However, they also reported that despite the significant difference between the prices of healthy and unhealthy mixed meals, it is undetermined whether a difference of $1-$2 would make any difference in purchasing and it is unknown whether consumers choose healthier meals from a price perspective [22]. The common public perception is that healthy food is more expensive than unhealthy food [60,61], even though a study in NZ has shown that is not the case [62]. Moreover, as taste has also been shown to be an important characteristic in influencing dietary behaviours, there are high chances that the palatability of the food is more important to the consumers, especially when the price difference is not significant [16]. Interestingly, discretionary food/beverage categories that were popularized on Uber Eats, were significantly more expensive than the same food/beverage categories not popularized. Popular menu items are likely to be the ones that are more frequently sold [53].
The meat or alternative-based mixed meals were overall highly priced than both the cereal and vegetable-based mixed meals. This result was expected as meat is usually more expensive than vegetables [63].
Despite menu labelling being reported as an effective method of allowing consumers to make more informed choices when selecting food prepared away from home [64], not many food outlets have been shown to offer nutritional information on OFD platforms. The Australian study also reported only 0.2% of all menu items offering menu kilojoule labelling on restaurants/takeaway outlets on Uber Eats [22]. Most chain franchise outlets in Australia are subject to mandatory menu kilojoule labelling policy [5]. Nutrition information was basically absent from all outlets in NZ except for one franchise outlet, Subway, therefore, indicating how challenging it is for consumers to choose healthier menu items on OFD platforms such as Uber Eats. Mandatory kilojoule labelling is a possible policy intervention that could also be implemented in New Zealand
This current study in NZ provides us with an understanding of the digital food environment created by the leading OFD platform. The comprehensive classification system of 38 food and beverage categories used for nutritional analysis also enabled a deeper understanding of the nutritional quality of menu items available on the digital platform. Additionally, separate nutritional coding of the combination meals was a unique aspect of this study.
However, there are several limitations to this study that have arisen due to the nature and process of the research. Although the cross-sectional study design can be used to prove assumptions, the digital food environment is likely to evolve rapidly and frequently which can mean changes in results are highly likely if the same research were to be conducted again. Most of the restaurants and takeaway outlets included in the study were established in Auckland and so cannot be generalized to all of NZ. A further limitation was that we only assessed the 10 most popular independent and franchise restaurants and takeaway outlets identified in each suburb. Therefore, there is a possibility that some healthy outlets have been masked by the popular, predominantly unhealthy food outlets. Furthermore, since this study only examined the market leading OFD platform in NZ (i.e., Uber Eats), we may have excluded other OFD platforms with widespread usages such as ‘Delivereasy’ and ‘Menulog’ and any outlets exclusive to them. We did not explore whether there were any changes in the nutritional quality, marketing, or price of the menu items before and after the COVID-19 lockdown.
5. Conclusions
Our findings suggest that the menus from popular local independent and franchise restaurants and takeaway outlets on Uber Eats in NZ are dominated by menu items that are predominantly unhealthy, with a higher energy content and poor nutritional quality. These menu items appear to be largely available and exposed to the users through the extensive use of marketing attributes. They are also more likely to appeal to price-sensitive consumers. Special promotions were an additional marketing characteristic that was unique to this NZ study. The addition of this price-based promotional strategy highlights how rapidly OFD platforms invent new techniques to appeal to its users’ purchasing behaviours. In this current digitally led world, it is no surprise that OFD services are growing popularity, with a further acceleration since the start of the global pandemic. These services effectively meet the consumer’s demand for convenience, bringing their favourite cuisines and cravings at their fingertips by increasing availability and accessibility through such platforms, further promoting a sedentary lifestyle. The results of this study also align with the other arm of this study conducted in Australia, regarding the healthiness of the digital food environment. Furthermore, multiple studies over the years have raised concerns regarding the nutritional quality of foods offered on OFD platforms, and meals prepared outside of home being higher in energy, with an undesirable nutritional profile in general. Frequent consumption of fast-foods and takeaways with poor nutritional quality is a significant contributor to the alarming increase in prevalence of obesity and non-communicable diseases, especially for the young population. The overwhelming availability and promotion of discretionary menu items on Uber Eats are therefore likely to influence the nutritional quality of the food choices users make. However, we neither examined the consumption nor the sales of the menu items on Uber Eats, therefore, these associations of the unhealthy digital food environment with the health consequences remain hypothetical. Hence, further research is strongly advocated and the need for menu kilojoule labelling policies or similar public health interventions to enable consumers to use convenience for healthier options.
Supplementary Materials
The following supporting information can be downloaded at: https://www.mdpi.com/article/10.3390/nu14214567/s1. Table S1: Proportion of Discretionary and FFG for Combination menu items on Uber Eats. The proportion of food and beverage categories as part of combination menu items in popularized (N = 442 unique combination menu items) and regular (n = 3304 unique combination menu items) menu items from 305 unique local independent and franchise takeaway outlets. Regular menu items exclude popularized menu items.
Author Contributions
Conceptualization, A.K., C.W., S.S.J., M.A.-F., R.R. (Rajshri Roy), P.P., J.R., A.A.G. and S.R.P.; methodology, N.M., A.K., C.W., S.S.J., M.A.-F., V.C., R.R. (Rajshri Roy), R.R. (Rebecca Raeside), P.P., J.R., A.A.G. and S.R.P.; formal analysis, N.M. and R.R. (Rajshri Roy); writing—original draft preparation, N.M. and R.R. (Rajshri Roy); writing—review and editing, N.M., A.K., C.W., S.S.J., M.A.-F., V.C., R.R. (Rajshri Roy), R.R. (Rebecca Raeside), P.P., J.R., A.A.G. and S.R.P. All authors have read and agreed to the published version of the manuscript.
Funding
This research was funded by a University of Sydney Cardiovascular Initiative Catalyst Awards Seed Funding Grant for Bioengineering and Digital Science, and Charles Perkins Centre Early to Mid-Career Researcher Seed Funding Grant; National Health and Medical Research Council (NHMRC) of Australia and National Heart Foundation (NHF) Early Career Fellowship awarded to S.R.P. (APP1157438); and NHMRC Investigator Grant Level 2 [GNT2007946] awarded to J.R.; NHMRC Emerging Leader 1 Investigator Grant awarded to A.A.G. (APP1173784). MAF previously received funding from the Australian Research Council and Cancer Council NSW to investigate food prepared outside the home.
Institutional Review Board Statement
Not applicable.
Informed Consent Statement
Not applicable.
Data Availability Statement
Publicly available datasets were analysed in this study. This data can be found here: https://www.ubereats.com/nz (accessed on 14 April 2021).
Conflicts of Interest
The authors declare no conflict of interest.
References
- Overweight and Obesity. Available online: https://www.who.int/news-room/fact-sheets/detail/obesity-and-overweight (accessed on 7 February 2021).
- Obesity. Available online: https://ourworldindata.org/obesity#childhood-obesity (accessed on 7 February 2021).
- Ministry of Health. Annual Update of Key Results 2019/20: New Zealand Health Survey. Obesity Statistics. 2020. Available online: https://www.health.govt.nz/nz-health-statistics/health-statistics-and-data-sets/obesity-statistics (accessed on 11 March 2021).
- Lim, S.S.; Vos, T.; Flaxman, A.D.; Danaei, G.; Shibuya, K.; Adair-Rohani, H.; AlMazroa, M.A.; Amann, M.; Anderson, H.R.; Andrews, K.G.; et al. A comparative risk assessment of burden of disease and injury attributable to 67 risk factors and risk factor clusters in 21 regions, 1990–2010: A systematic analysis for the Global Burden of Disease Study 2010. Lancet 2012, 380, 2224–2260. [Google Scholar] [CrossRef]
- Bates, S.; Reeve, B.; Trevena, H. A narrative review of online food delivery in Australia: Challenges and opportunities for public health nutrition policy. Public Health Nutr. 2020, 9, 1–11. [Google Scholar] [CrossRef] [PubMed]
- Janssen, H.G.; Davies, I.G.; Richardson, L.D.; Stevenson, L. Determinants of takeaway and fast food consumption: A narrative review. Nutr. Res. Rev. 2018, 31, 16–34. [Google Scholar] [CrossRef] [PubMed]
- Malik, V.S.; Willett, W.C.; Hu, F.B. Global obesity: Trends, risk factors and policy implications. Nat. Rev. Endocrinol. 2013, 9, 13–27. [Google Scholar] [CrossRef]
- Botonaki, A.; Mattas, K. Revealing the values behind convenience food consumption. Appetite 2010, 55, 629–638. [Google Scholar] [CrossRef]
- Share of Children Who Ate Fast Food At Least Once in the Past Week in New Zealand as of June 2018, by Age. Available online: https://www.statista.com/statistics/763739/new-zealand-children-eating-fast-food-past-week-by-age/ (accessed on 12 March 2021).
- Kiwis Growing Taste for Takeaways and Eating Out. Available online: https://www.stats.govt.nz/news/kiwis-growing-taste-for-takeaways-and-eating-out (accessed on 18 March 2021).
- Food Price Index Review: 2020. Available online: https://www.stats.govt.nz/methods/food-price-index-review-2020 (accessed on 18 March 2021).
- Taher, A.K.; Evans, N.; Evans, C.E. The cross-sectional relationships between consumption of takeaway food, eating meals outside the home and diet quality in British adolescents. Public Health Nutr. 2019, 22, 63–73. [Google Scholar] [CrossRef]
- Smith, K.J.; McNaughton, S.A.; Gall, S.L.; Blizzard, L.; Dwyer, T.; Venn, A.J. Takeaway food consumption and its associations with diet quality and abdominal obesity: A cross-sectional study of young adults. Int. J. Behav. Nutr. Phys. Act. 2009, 6, 1–13. [Google Scholar] [CrossRef]
- Wellard-Cole, L.; Davies, A.; Allman-Farinelli, M. Contribution of foods prepared away from home to intakes of energy and nutrients of public health concern in adults: A systematic review. Crit. Rev. Food Sci. Nutr. 2022, 62, 5511–5522. [Google Scholar] [CrossRef]
- McCrory, M.A.; Harbaugh, A.G.; Appeadu, S.; Roberts, S.B. Fast-food offerings in the United States in 1986, 1991, and 2016 show large increases in food variety, portion size, dietary energy, and selected micronutrients. J. Acad. Nutr. Diet. 2019, 119, 923–933. [Google Scholar] [CrossRef]
- Allman-Farinelli, M.; Rahman, H.; Nour, M.; Wellard-Cole, L.; Watson, W.L. The role of supportive food environments to enable healthier choices when eating meals prepared outside the home: Findings from focus groups of 18 to 30-year-olds. Nutrients 2019, 11, 2217. [Google Scholar] [CrossRef]
- Kapoor, A.P.; Vij, M. Technology at the dinner table: Ordering food online through mobile apps. J. Retail. Consum. Serv. 2018, 43, 342–351. [Google Scholar] [CrossRef]
- Li, C.; Mirosa, M.; Bremer, P. Review of Online Food Delivery Platforms and their Impacts on Sustainability. Sustainability 2020, 12, 5528. [Google Scholar] [CrossRef]
- Partridge, S.R.; Gibson, A.A.; Roy, R.; Malloy, J.A.; Raeside, R.; Jia, S.S.; Singleton, A.C.; Mandoh, M.; Todd, A.R.; Wang, T.; et al. Junk Food on Demand: A Cross-Sectional Analysis of the Nutritional Quality of Popular Online Food Delivery Outlets in Australia and New Zealand. Nutrients 2020, 12, 3107. [Google Scholar] [CrossRef]
- Meal Delivery Services Double Usage in Only 18 Months. Available online: https://www.roymorgan.com/findings/8270-food-delivery-services-september-2019-202002030451 (accessed on 18 March 2021).
- Online Food Delivery—New Zealand. 2021. Available online: https://www.statista.com/outlook/dmo/eservices/online-food-delivery/new-zealand#revenue (accessed on 9 September 2022).
- Wang, C.; Korai, A.; Jia, S.S.; Allman-Farinelli, M.; Chan, V.; Roy, R.; Raeside, R.; Phongsavan, P.; Redfern, J.; Gibson, A.A.; et al. Hunger for Home Delivery: Cross-Sectional Analysis of the Nutritional Quality of Complete Menus on an Online Food Delivery Platform in Australia. Nutrients 2021, 13, 905. [Google Scholar] [CrossRef] [PubMed]
- National Health and Medical Research Council (NHMRC). Australian Dietary Guidelines; National Health and Medical Research Council: Canberra, Australia, 2013. [Google Scholar]
- Grubhub Releases Annual “Year In Food” Report Detailing Most Popular Dining Trends of 2018. Available online: https://www.prnewswire.com/news-releases/grubhub-releases-annual-year-in-food-report-detailing-most-popular-dining-trends-of-2018-300761123.html (accessed on 4 February 2022).
- Maimaiti, M.; Zhao, X.; Jia, M.; Ru, Y.; Zhu, S. How we eat determines what we become: Opportunities and challenges brought by food delivery industry in a changing world in China. Eur. J. Clin. Nutr. 2018, 72, 1282–1286. [Google Scholar] [CrossRef]
- How the Pandemic Put Food Delivery Firms in the Limelight in 2020. Available online: https://www.forbes.com/sites/jonathankeane/2020/12/15/how-the-pandemic-put-food-delivery-firms-in-the-limelight-in-2020/?sh=4207f7cc5eeb (accessed on 26 March 2021).
- Uber Eats’ U.S. Sales Surged 10% Last Week Thanks to Quarantines. Available online: https://www.theinformation.com/articles/uber-eats-u-s-sales-surged-10-last-week-thanks-to-quarantines?shared=7cb1826e590b7ab5 (accessed on 26 March 2021).
- Horta, P.M.; de Paula Matos, J.; Mendes, L.L. Digital food environment during the coronavirus disease 2019 (COVID-19) pandemic in Brazil: An analysis of food advertising in an online food delivery platform. Br. J. Nutr. 2020, 126, 1–6. [Google Scholar] [CrossRef]
- Breugelmans, E.; Campo, K.; Gijsbrechts, E. Shelf sequence and proximity effects on online grocery choices. Mark. Lett. 2007, 18, 117–133. [Google Scholar] [CrossRef]
- Campbell, S.; James, E.L.; Stacey, F.G.; Bowman, J.; Chapman, K.; Kelly, B. A mixed-method examination of food marketing directed towards children in Australian supermarkets. Health Promot. Int. 2012, 29, 267–277. [Google Scholar] [CrossRef]
- Wellard-Cole, L.; Davies, A.; Chen, J.; Jung, J.; Bente, K.B.; Kay, J.; Watson, W.L.; Hughes, C.; Rangan, A.; Yacef, K.; et al. The contribution of foods prepared outside the home to the diets of 18-to 30-year-old Australians: The MYMeals study. Nutrients 2021, 13, 1761. [Google Scholar] [CrossRef]
- New Zealand Government. Census Summary: Auckland Region. Available online: https://www.stats.govt.nz/tools/2018-census-place-summaries/auckland-region (accessed on 30 July 2021).
- Franchise Restaurants v/s Independent Restaurants: Which Route To Take. Available online: https://www.posist.com/restaurant-times/resources/franchise-outlet-vs-independent-restaurants-which-is-the-better-route.html (accessed on 17 August 2021).
- Michael Kay. The Definition of a Franchise Restaurant. 2017. Available online: https://bizfluent.com/list-5950936-benefits-international-franchising.html (accessed on 17 August 2021).
- Thornton, L.E.; Kavanagh, A.M. Association between fast food purchasing and the local food environment. Nutr. Diabetes 2012, 2, e53. [Google Scholar] [CrossRef]
- Moayyed, H.; Kelly, B.; Feng, X.; Flood, V. Evaluation of a ’healthiness’ rating system for food outlet types in Australian residential communities. Nutr. Diet. 2017, 74, 29–35. [Google Scholar] [CrossRef] [PubMed]
- Needham, C.; Orellana, L.; Allender, S.; Sacks, G.; Blake, M.R.; Strugnell, C. Food retail environments in Greater Melbourne 2008–2016: Longitudinal analysis of intra-city variation in density and healthiness of food outlets. Int. J. Environ. Res. Public Health 2020, 17, 1321. [Google Scholar] [CrossRef] [PubMed]
- Wellard-Cole, L.; Jung, J.; Kay, J.; Rangan, A.; Chapman, K.; Watson, W.L.; Hughes, C.; Mhurchu, C.N.; Bauman, A.; Gemming, L.; et al. Examining the Frequency and Contribution of Foods Eaten Away from Home in the Diets of 18-to 30-Year-Old Australians Using Smartphone Dietary Assessment (MYMeals): Protocol for a Cross-Sectional Study. JMIR Res. Protoc. 2018, 7, e24. [Google Scholar] [CrossRef] [PubMed]
- Eating and Activity Guidelines for NZ Adults. Available online: https://www.health.govt.nz/our-work/eating-and-activity-guidelines (accessed on 19 March 2021).
- Australian Bureau of Statistics—Discretionary Foods. Available online: https://www.abs.gov.au/ausstats/abs@.nsf/lookup/4363.0.55.001chapter65062011-13 (accessed on 31 August 2022).
- Poelman, M.P.; Thornton, L.; Zenk, S.N. A cross-sectional comparison of meal delivery options in three international cities. Eur. J. Clin. Nutr. 2020, 74, 1465–1473. [Google Scholar] [CrossRef]
- Jaworowska, A.; Blackham, T.M.; Long, R.; Taylor, C.; Ashton, M.; Stevenson, L.; Davies, I.G. Nutritional composition of takeaway food in the UK. Nutr. Food Sci. 2014, 44, 414–430. [Google Scholar] [CrossRef]
- Jaworowska, A.; Blackham, T.; Davies, I.G.; Stevenson, L. Nutritional challenges and health implications of takeaway and fast food. Nutr. Rev. 2013, 71, 310–318. [Google Scholar] [CrossRef]
- Agarwal, S.; Huang, P.; Luo, C.; Qin, Y.; Zhan, C. Assessment of Online Food Ordering and Delivery in Singapore During the COVID-19 Pandemic. JAMA Netw. Open 2021, 4, e2126466. [Google Scholar] [CrossRef]
- Smaldone, F.; D’Arco, M.; Marino, V.; Pellicano, M. Let Thy Food Be Thy Medicine: Exploring the Impact of Covid-19 Pandemic on the Online Food Delivery Industry. In The International Research & Innovation Forum; Springer: Berlin/Heidelberg, Germany, 2021. [Google Scholar]
- Gerritsen, S.; Egli, V.; Roy, R.; Haszard, J.; Backer, C.D.; Teunissen, L.; Cuykx, I.; Decorte, P.; Pabian, S.P.; Van Royen, K.; et al. Seven weeks of home-cooked meals: Changes to New Zealanders’ grocery shopping, cooking and eating during the COVID-19 lockdown. J. R. Soc. 2021, 51, S4–S22. [Google Scholar] [CrossRef]
- Lock, H. Customers Flocking for Fast Food Takeaways ‘Out of the Ordinary’. 2020. Available online: https://www.rnz.co.nz/news/business/415353/customers-flocking-for-fast-food-takeaways-out-of-the-ordinary (accessed on 4 February 2022).
- Sommerville, T.; Kerr-Lazenby, M. Covid-19: Long Queues for Fast Food as Auckland Moves to Alert Level 3. 2021. Available online: https://www.stuff.co.nz/auckland/local-news/126453468/covid19-long-queues-for-fast-food-as-auckland-moves-to-alert-level-3 (accessed on 4 February 2022).
- Uber Announces Results for Second Quarter 2020. Available online: https://investor.uber.com/news-events/news/press-release-details/2020/Uber-Announces-Results-for-Second-Quarter-2020/default.aspx (accessed on 26 March 2021).
- Uber Eats Demand Soars Due to COVID-19 Crisis. Available online: https://www.forbes.com/sites/marcochiappetta/2020/03/25/uber-eats-demand-soars-due-to-covid-19-crisis/?sh=1947ccf1580c (accessed on 26 March 2021).
- De Backer, C.; Teunissen, L.; Cuykx, I.; Decorte, P.; Pabian, S.; Gerritsen, S.; Matthys, C.; Al Sabbah, H.; Van Royen, K.; Corona Cooking Survey Study Group. An evaluation of the COVID-19 pandemic and perceived social distancing policies in relation to planning, selecting, and preparing healthy meals: An observational study in 38 countries worldwide. Front. Nutr. 2020, 7, 621726. [Google Scholar] [CrossRef]
- World Health Organization. Regional Office for Europe. (2022). WHO European Regional Obesity Report 2022. World Health Organization. Regional Office for Europe. Available online: https://apps.who.int/iris/handle/10665/353747 (accessed on 13 September 2022).
- The 2021 Uber Eats Cravings Report. 2022. Available online: https://www.uber.com/en-AU/blog/the-2021-uber-eats-cravings-report/ (accessed on 4 February 2022).
- Mackay, S.; Gontijo de Castro, T.; Young, L.; Shaw, G.; Ni Mhurchu, C.; Eyles, H. Energy, Sodium, Sugar and Saturated Fat Content of New Zealand Fast-Food Products and Meal Combos in 2020. Nutrients 2021, 13, 4010. [Google Scholar] [CrossRef]
- Parker, S. How Does Photography Impact Sales? 2018. Available online: https://foodscene.deliveroo.co.uk/restaurant-profiles/menu-photography-how-does-it-impact-sales.html (accessed on 9 February 2022).
- Hou, Y.; Yang, W.; Sun, Y. Do pictures help? The effects of pictures and food names on menu evaluations. Int. J. Hosp. Manag. 2017, 60, 94–103. [Google Scholar] [CrossRef]
- Uber Pass. Available online: https://www.uber.com/nz/en/ride/how-it-works/uber-pass/?%243p=a_custom_354088&_branch_match_id=1017254540600328819&_branch_referrer=H4sIAAAAAAAAAxXKTQuDIBgA4F9Tl7CyTN8GscPYZTAYwWA3eTUt6Usy2d8fe87PdJ4%2BXIpi187k6H2%2BuG0uPmP%2FfnynMcA1qVjtO5Q6hnNfZd2wEiCNenF6lm7ooKx0hUoRoIITxpESMJYRQZGVVjWloEOaiLvG1aMbt%2B6tzJG9MISsN6PbN1yyW%2F%2F8lzNuRvqoFhcmc8gQFe2sAsVbQwlta0EYEy2BigsyWFpzrm3DDfwAuB2zcMQAAAA%3D&uclick_id=802c2abb-8176-46a1-8ef4-71a40fb5071d&utm_campaign=Uber%20Pass%20Regional%20CRM&utm_medium=paid%20advertising&utm_source=CRM&~campaign=Uber%20Pass%20Regional%20CRM&~tune_publisher_sub1=fb8b69e1-1937-4479-8267-df1366cf56e8 (accessed on 2 February 2022).
- Kilpatrich, M. Uber Pass Offers Kiwis Savings for $14.99 Monthly Subscription Fee. 2021. Available online: https://www.newshub.co.nz/home/technology/2021/05/uber-pass-offers-kiwis-savings-for-14-99-monthly-subscription-fee.html (accessed on 2 February 2022).
- Schulz, E.; Bhui, R.; Love, B.C.; Brier, B.; Todd, M.T.; Gershman, S.J. Structured, uncertainty-driven exploration in real-world consumer choice. Proc. Natl. Acad. Sci. USA 2019, 116, 13903–13908. [Google Scholar] [CrossRef] [PubMed]
- Jo, J.; Lusk, J.L. If it’s healthy, it’s tasty and expensive: Effects of nutritional labels on price and taste expectations. Food Qual. Prefer. 2018, 68, 332–341. [Google Scholar] [CrossRef]
- Roser, M.; Ritchie, H. Food Prices. 2021. Available online: https://ourworldindata.org/food-prices (accessed on 19 February 2022).
- Chand, A.; Eyles, H.; Mhurchu, C.N. Availability and accessibility of healthier options and nutrition information at New Zealand fast food restaurants. Appetite 2012, 58, 227–233. [Google Scholar] [CrossRef] [PubMed]
- Food Prices in Auckland, New Zealand. Available online: https://www.numbeo.com/food-prices/in/Auckland (accessed on 19 February 2022).
- Littlewood, J.A.; Lourenço, S.; Iversen, C.L.; Hansen, G.L. Menu labelling is effective in reducing energy ordered and consumed: A systematic review and meta-analysis of recent studies. Public Health Nutr. 2016, 19, 2106–2121. [Google Scholar] [CrossRef] [PubMed]


Publisher’s Note: MDPI stays neutral with regard to jurisdictional claims in published maps and institutional affiliations. |
© 2022 by the authors. Licensee MDPI, Basel, Switzerland. This article is an open access article distributed under the terms and conditions of the Creative Commons Attribution (CC BY) license (https://creativecommons.org/licenses/by/4.0/).