
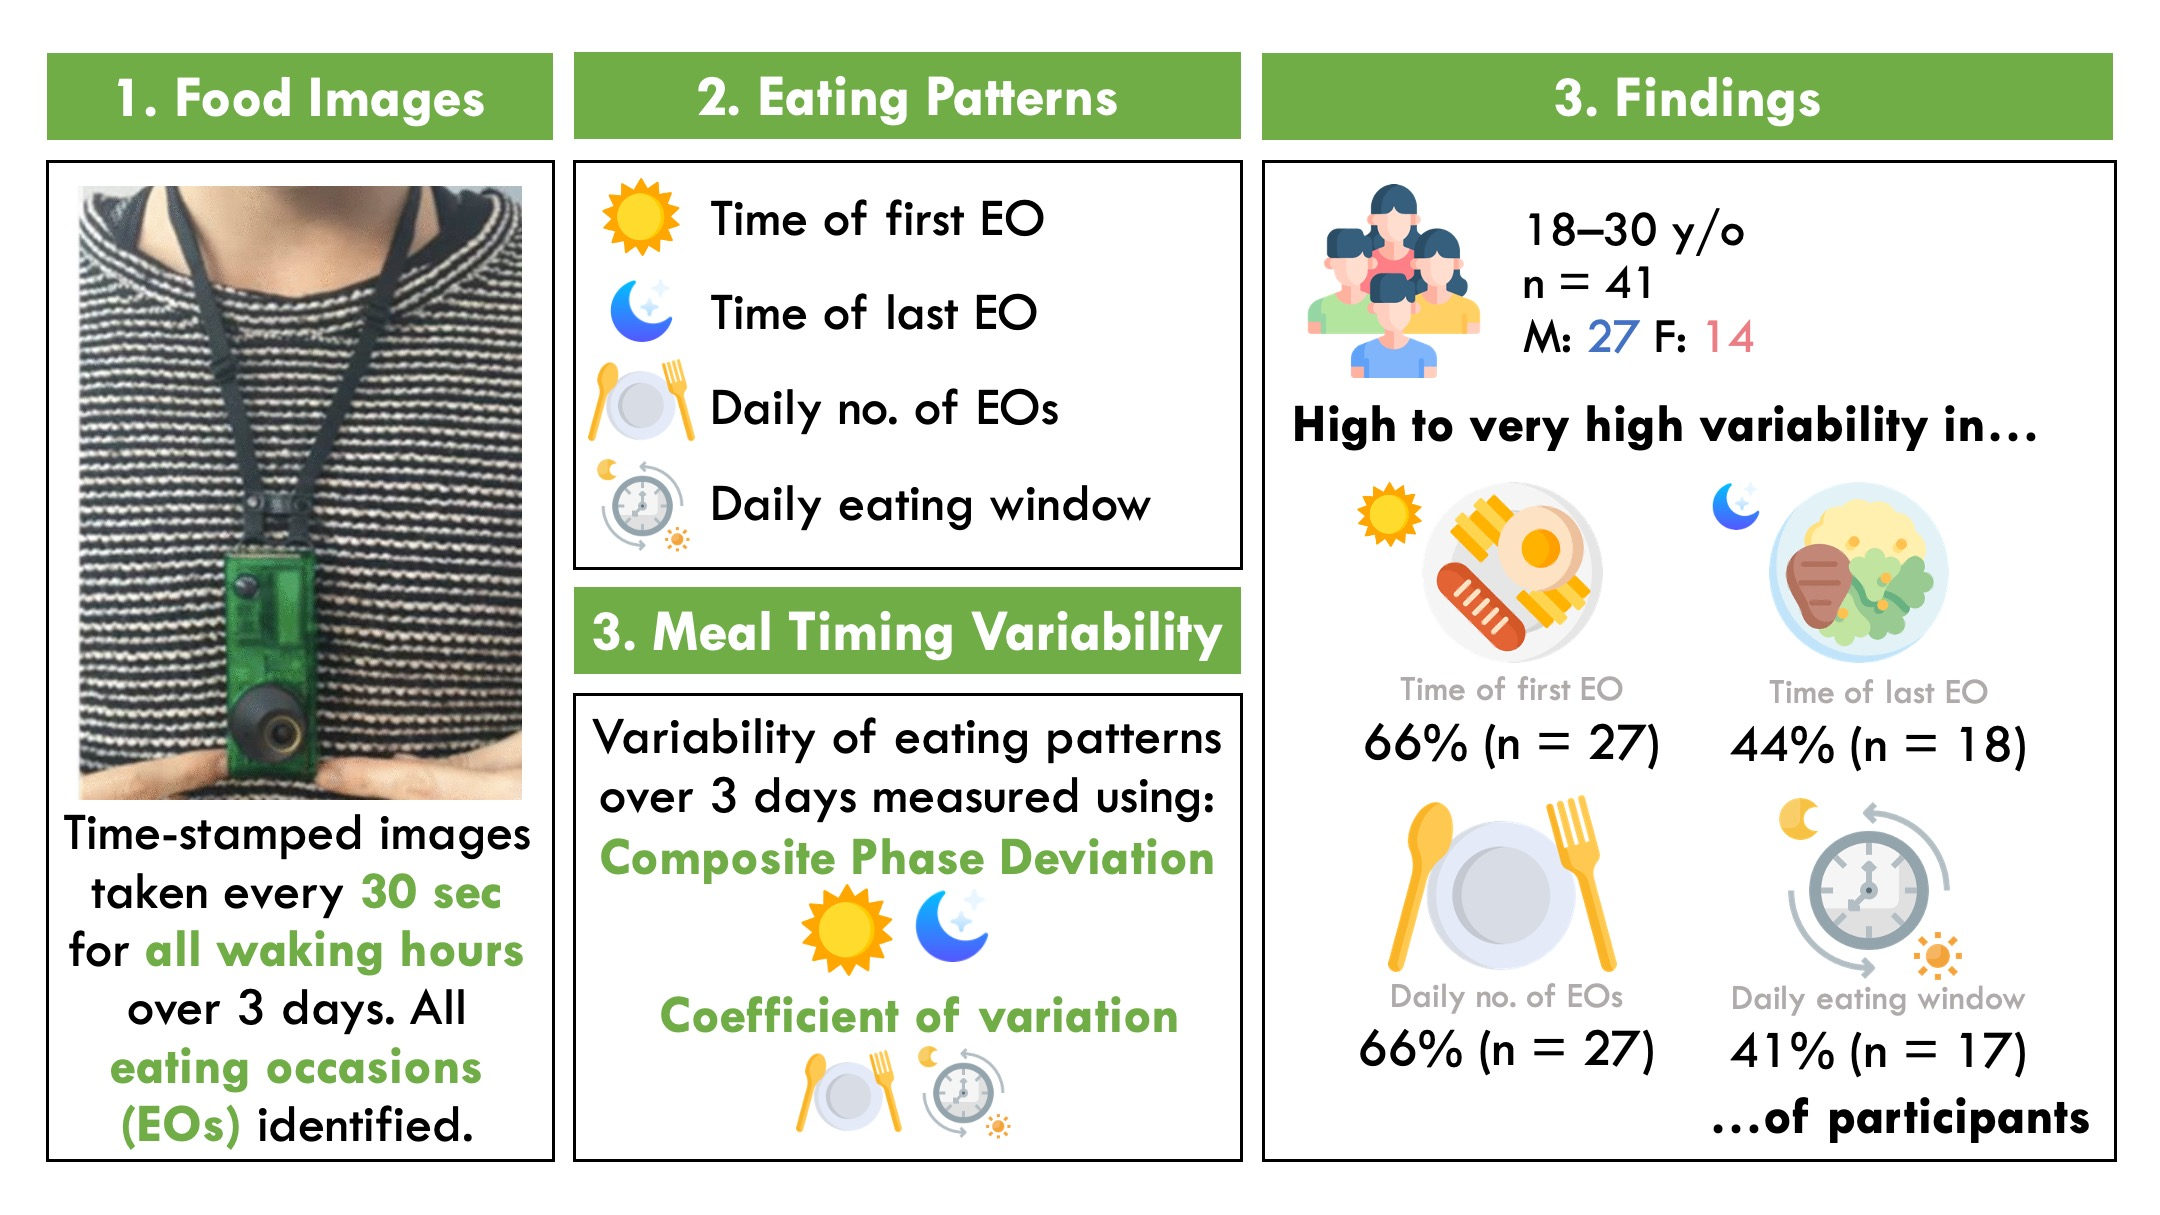
Wearable Cameras Reveal Large Intra-Individual Variability in Timing of Eating among Young Adults

 , ,
, ,  ,
,  , and
, and
Abstract

1. Introduction
2. Materials and Methods
2.1. Data Collection
2.2. Inclusion Criteria
2.3. Data Analysis
2.3.1. Meal Timing Variability Metrics
2.3.2. Statistics
3. Results
4. Discussion
4.1. Comparing Our Methods and Results with Previous Studies
4.2. Implications of Meal Timing Variability on Dietary Quality and Health
4.3. Strengths and Limitations
5. Conclusions
Supplementary Materials
Author Contributions
Funding
Institutional Review Board Statement
Informed Consent Statement
Data Availability Statement
Acknowledgments
Conflicts of Interest
References
- Dashti, H.S.; Scheer, F.A.J.L.; Saxena, R.; Garaulet, M. Timing of Food Intake: Identifying Contributing Factors to Design Effective Interventions. Adv. Nutr. 2019, 10, 606–620. [Google Scholar] [CrossRef] [PubMed]
- Winkler, G.; Döring, A.; Keil, U. Meal patterns in middle-aged men in Southern Germany: Results from the MONICA Augsburg dietary survey 1984/85. Appetite 1999, 32, 33–37. [Google Scholar] [PubMed]
- Kant, A.K.; Graubard, B.I. Within-person comparison of eating behaviors, time of eating, and dietary intake on days with and without breakfast: NHANES 2005–2010. Am. J. Clin. Nutr. 2015, 102, 661–670. [Google Scholar] [PubMed]
- Leech, R.M.; Worsley, A.; Timperio, A.; McNaughton, S.A. Temporal eating patterns: A latent class analysis approach. Int. J. Behav. Nutr. Phys. Act. 2017, 14, 3. [Google Scholar] [CrossRef]
- Gill, S.; Panda, S. A Smartphone App Reveals Erratic Diurnal Eating Patterns in Humans that Can Be Modulated for Health Benefits. Cell Metab. 2015, 22, 789–798. [Google Scholar]
- Paoli, A.; Tinsley, G.; Bianco, A.; Moro, T. The Influence of Meal Frequency and Timing on Health in Humans: The Role of Fasting. Nutrients 2019, 11, 719. [Google Scholar]
- St-Onge, M.-P.; Ard, J.; Baskin, M.L.; Chiuve, S.E.; Johnson, H.M.; Kris-Etherton, P.; Varady, K. Meal Timing and Frequency: Implications for Cardiovascular Disease Prevention: A Scientific Statement from the American Heart Association. Circulation 2017, 135, e96–e121. [Google Scholar] [CrossRef]
- Templeman, I.; Gonzalez, J.T.; Thompson, D.; Betts, J.A. The role of intermittent fasting and meal timing in weight management and metabolic health. Proc. Nutr. Soc. 2020, 79, 76–87. [Google Scholar] [CrossRef]
- Maugeri, A.; Vinciguerra, M. The Effects of Meal Timing and Frequency, Caloric Restriction, and Fasting on Cardiovascular Health: An Overview. J. Lipid Atheroscler. 2020, 9, 140–152. [Google Scholar]
- Ballon, A.; Neuenschwander, M.; Schlesinger, S. Breakfast Skipping Is Associated with Increased Risk of Type 2 Diabetes among Adults: A Systematic Review and Meta-Analysis of Prospective Cohort Studies. J. Nutr. 2018, 149, 106–113. [Google Scholar]
- Ma, X.; Chen, Q.; Pu, Y.; Guo, M.; Jiang, Z.; Huang, W.; Long, Y.; Xu, Y. Skipping breakfast is associated with overweight and obesity: A systematic review and meta-analysis. Obes. Res. Clin. Pract. 2020, 14, 1–8. [Google Scholar] [CrossRef]
- Wicherski, J.; Schlesinger, S.; Fischer, F. Association between Breakfast Skipping and Body Weight—A Systematic Review and Meta-Analysis of Observational Longitudinal Studies. Nutrients 2021, 13, 272. [Google Scholar] [CrossRef]
- Bonnet, J.P.; Cardel, M.I.; Cellini, J.; Hu, F.B.; Guasch-Ferré, M. Breakfast Skipping, Body Composition, and Cardiometabolic Risk: A Systematic Review and Meta-Analysis of Randomized Trials. Obesity 2020, 28, 1098–1109. [Google Scholar] [CrossRef]
- Kutsuma, A.; Nakajima, K.; Suwa, K. Potential Association between Breakfast Skipping and Concomitant Late-Night-Dinner Eating with Metabolic Syndrome and Proteinuria in the Japanese Population. Scientifica 2014, 2014, 253581. [Google Scholar] [CrossRef]
- Berg, C.; Lappas, G.; Wolk, A.; Strandhagen, E.; Torén, K.; Rosengren, A.; Thelle, D.; Lissner, L. Eating patterns and portion size associated with obesity in a Swedish population. Appetite 2009, 52, 21–26. [Google Scholar]
- Marinac, C.R.; Sears, D.D.; Natarajan, L.; Gallo, L.C.; Breen, C.I.; Patterson, R.E. Frequency and Circadian Timing of Eating May Influence Biomarkers of Inflammation and Insulin Resistance Associated with Breast Cancer Risk. PLoS ONE 2015, 10, e0136240. [Google Scholar] [CrossRef]
- Cahill, L.E.; Chiuve, S.E.; Mekary, R.A.; Jensen, M.K.; Flint, A.J.; Hu, F.B.; Rimm, E.B. Prospective study of breakfast eating and incident coronary heart disease in a cohort of male US health professionals. Circulation 2013, 128, 337–343. [Google Scholar]
- Tsuchida, Y.; Hata, S.; Sone, Y. Effects of a late supper on digestion and the absorption of dietary carbohydrates in the following morning. J. Physiol. Anthropol. 2013, 32, 9. [Google Scholar] [CrossRef]
- Pelletier, J.E.; Laska, M.N. Balancing healthy meals and busy lives: Associations between work, school, and family responsibilities and perceived time constraints among young adults. J. Nutr. Educ. Behav. 2012, 44, 481–489. [Google Scholar]
- Welton, S.; Minty, R.; O’Driscoll, T.; Willms, H.; Poirier, D.; Madden, S.; Kelly, L. Intermittent fasting and weight loss: Systematic review. Can. Fam. Phys. 2020, 66, 117–125. [Google Scholar]
- McHill, A.W.; Hilditch, C.J.; Fischer, D.; Czeisler, C.A.; Garaulet, M.; Scheer, F.A.J.L.; Klerman, E.B. Stability of the timing of food intake at daily and monthly timescales in young adults. Sci. Rep. 2020, 10, 20849. [Google Scholar] [CrossRef]
- Culnan, E.; Reid, K.J.; Zee, P.C.; Crowley, S.J.; Baron, K.G. Meal timing relative to DLMO: Associations with BMI and body fat. Sleep Health 2021, 7, 339–344. [Google Scholar]
- Reid, K.J.; Baron, K.G.; Zee, P.C. Meal timing influences daily caloric intake in healthy adults. Nutr. Res. 2014, 34, 930–935. [Google Scholar] [CrossRef]
- Zimmerman, A.R.; Johnson, L.; Brunstrom, J.M. Assessing “chaotic eating” using self-report and the UK Adult National Diet and Nutrition Survey: No association between BMI and variability in meal or snack timings. Physiol. Behav. 2018, 192, 64–71. [Google Scholar] [CrossRef]
- Meth, E.M.S.; van Egmond, L.T.; Moulin, T.C.; Cedernaes, J.; Rosqvist, F.; Benedict, C. Association of Daily Eating Duration and Day-To-Day Variability in the Timing of Eating With Fatal Cancer Risk in Older Men. Front. Nutr. 2022, 9, 889926. [Google Scholar]
- Gupta, N.J.; Kumar, V.; Panda, S. A camera-phone based study reveals erratic eating pattern and disrupted daily eating-fasting cycle among adults in India. PLoS ONE 2017, 12, e0172852. [Google Scholar] [CrossRef]
- Zhao, L.; Teong, X.T.; Liu, K.; Liu, B.; Melaku, Y.A.; Vincent, A.; Manoogian, E.; Panda, S.; Wittert, G.A.; Hutchinson, A.; et al. Eating architecture in adults at increased risk of type 2 diabetes: Associations with body fat and glycemic control. Br. J. Nutr. 2021, 128, 324–333. [Google Scholar] [CrossRef]
- Zerón-Rugerio, M.F.; Hernáez, Á.; Porras-Loaiza, A.P.; Cambras, T.; Izquierdo-Pulido, M. Eating Jet Lag: A Marker of the Variability in Meal Timing and Its Association with Body Mass Index. Nutrients 2019, 11, 2980. [Google Scholar] [CrossRef]
- Wittig, F.; Hummel, E.; Wenzler, G.; Heuer, T. Energy and macronutrient intake over the course of the day of German adults: A DEDIPAC-study. Appetite 2017, 114, 125–136. [Google Scholar] [CrossRef]
- Popp, C.J.; Curran, M.; Wang, C.; Prasad, M.; Fine, K.; Gee, A.; Nair, N.; Perdomo, K.; Chen, S.; Hu, L.; et al. Temporal Eating Patterns and Eating Windows among Adults with Overweight or Obesity. Nutrients 2021, 13, 4485. [Google Scholar] [PubMed]
- Makarem, N.; Sears, D.D.; St-Onge, M.P.; Zuraikat, F.M.; Gallo, L.C.; Talavera, G.A.; Castaneda, S.F.; Lai, Y.; Aggarwal, B. Variability in Daily Eating Patterns and Eating Jetlag Are Associated With Worsened Cardiometabolic Risk Profiles in the American Heart Association Go Red for Women Strategically Focused Research Network. J. Am. Heart Assoc. 2021, 10, e022024. [Google Scholar] [CrossRef] [PubMed]
- Fleischer, J.G.; Das, S.K.; Bhapkar, M.; Manoogian, E.N.C.; Panda, S. Associations between the timing of eating and weight-loss in calorically restricted healthy adults: Findings from the CALERIE study. Exp. Gerontol. 2022, 165, 111837. [Google Scholar] [CrossRef] [PubMed]
- Makarem, N.; Zuraikat, F.M.; Caceres, B.; Sears, D.D.; St-Onge, M.P.; Lai, Y.; Aggarwal, B. Variable Eating Patterns: A Potential Novel Risk Factor for Systemic Inflammation in Women. Ann. Behav. Med. 2022, kaac042. [Google Scholar] [CrossRef]
- Eicher-Miller, H.A.; Khanna, N.; Boushey, C.J.; Gelfand, S.B.; Delp, E.J. Temporal Dietary Patterns Derived among the Adult Participants of the National Health and Nutrition Examination Survey 1999–2004 Are Associated with Diet Quality. J. Acad. Nutr. Diet. 2016, 116, 283–291. [Google Scholar] [CrossRef]
- Mesas, A.E.; Muñoz-Pareja, M.; López-García, E.; Rodríguez-Artalejo, F. Selected eating behaviours and excess body weight: A systematic review. Obes. Rev. 2012, 13, 106–135. [Google Scholar] [CrossRef]
- Shin, A.; Lim, S.Y.; Sung, J.; Shin, H.R.; Kim, J. Dietary intake, eating habits, and metabolic syndrome in Korean men. J. Am. Diet. Assoc. 2009, 109, 633–640. [Google Scholar] [CrossRef]
- Sierra-Johnson, J.; Undén, A.L.; Linestrand, M.; Rosell, M.; Sjogren, P.; Kolak, M.; De Faire, U.; Fisher, R.M.; Hellénius, M.L. Eating meals irregularly: A novel environmental risk factor for the metabolic syndrome. Obesity 2008, 16, 1302–1307. [Google Scholar] [CrossRef]
- Wennberg, M.; Gustafsson, P.E.; Wennberg, P.; Hammarström, A. Irregular eating of meals in adolescence and the metabolic syndrome in adulthood: Results from a 27-year prospective cohort. Public Health Nutr. 2016, 19, 667–673. [Google Scholar] [CrossRef]
- König, L.M.; Van Emmenis, M.; Nurmi, J.; Kassavou, A.; Sutton, S. Characteristics of smartphone-based dietary assessment tools: A systematic review. Health Psychol. Rev. 2021, 1–25. [Google Scholar] [CrossRef]
- Chan, V.; Davies, A.; Wellard-Cole, L.; Lu, S.; Ng, H.; Tsoi, L.; Tiscia, A.; Signal, L.; Rangan, A.; Gemming, L.; et al. Using Wearable Cameras to Assess Foods and Beverages Omitted in 24 Hour Dietary Recalls and a Text Entry Food Record App. Nutrients 2021, 13, 1806. [Google Scholar] [CrossRef]
- Chan, V.; Wellard-Cole, L.; Davies, A.; Watson, W.; Hughes, C.; Chapman, K.; Signal, L.; Ni Mhurchu, C.; Wang, L.; D’Souza, D. The association of social and food preparation location context with the quality of meals and snacks consumed by young adults: Findings from the MYMeals wearable camera study. Eur. J. Nutr. 2022, 61, 3407–3422. [Google Scholar] [CrossRef] [PubMed]
- Wellard-Cole, L.; Davies, A.; Chen, J.; Jung, J.; Bente, K.B.; Kay, J.; Watson, W.L.; Hughes, C.; Rangan, A.; Yacef, K. The Contribution of Foods Prepared Outside the Home to the Diets of 18- to 30-Year-Old Australians: The MYMeals Study. Nutrients 2021, 13, 1761. [Google Scholar] [CrossRef] [PubMed]
- Davies, A.; Allman-Farinelli, M.; Owen, K.; Signal, L.; Hosking, C.; Wang, L.; Bauman, A. Feasibility Study Comparing Physical Activity Classifications from Accelerometers with Wearable Camera Data. Int. J. Environ. Res. Public Health 2020, 17, 9323. [Google Scholar] [CrossRef] [PubMed]
- Davies, A.; Chan, V.; Bauman, A.; Signal, L.; Hosking, C.; Gemming, L.; Allman-Farinelli, M. Using wearable cameras to monitor eating and drinking behaviours during transport journeys. Eur. J. Nutr. 2021, 60, 1875–1885. [Google Scholar] [CrossRef]
- Wellard-Cole, L.; Potter, M.; Jung, J.J.; Chen, J.; Kay, J.; Allman-Farinelli, M. A Tool to Measure Young Adults’ Food Intake: Design and Development of an Australian Database of Foods for the Eat and Track Smartphone App. JMIR Mhealth Uhealth 2018, 6, e12136. [Google Scholar] [CrossRef]
- Park, Y.; Dodd, K.W.; Kipnis, V.; Thompson, F.E.; Potischman, N.; Schoeller, D.A.; Baer, D.J.; Midthune, D.; Troiano, R.P.; Bowles, H.; et al. Comparison of self-reported dietary intakes from the Automated Self-Administered 24-h recall, 4-d food records, and food-frequency questionnaires against recovery biomarkers. Am. J. Clin. Nutr. 2018, 107, 80–93. [Google Scholar] [CrossRef]
- Wellard-Cole, L.; Jung, J.; Kay, J.; Rangan, A.; Chapman, K.; Watson, W.L.; Hughes, C.; Ni Mhurchu, C.; Bauman, A.; Gemming, L. Examining the Frequency and Contribution of Foods Eaten Away from Home in the Diets of 18- to 30-Year-Old Australians Using Smartphone Dietary Assessment (MYMeals): Protocol for a Cross-Sectional Study. JMIR Res. Protoc. 2018, 7, e24. [Google Scholar] [CrossRef]
- Australian Bureau of Statistics. Census of Population and Housing: Socio-Economic Indexes for Areas (SEIFA). 2016. Available online: http://www.abs.gov.au/ausstats/abs@.nsf/mf/2033.0.55.001 (accessed on 19 February 2022).
- Davies, A.; Wellard-Cole, A.; Rangan, A.; Allman-Farinelli, M. Validity of self-reported weight and height for BMI classification: A cross-sectional study among young adults. Nutrition 2020, 71, 110622. [Google Scholar] [CrossRef]
- Harris, P.A.; Taylor, R.; Thielke, R.; Payne, J.; Gonzalez, N.; Conde, J.G. Research electronic data capture (REDCap)—A metadata-driven methodology and workflow process for providing translational research informatics support. J. Biomed. Inform. 2009, 42, 377–381. [Google Scholar] [CrossRef]
- Fischer, D.; Vetter, C.; Roenneberg, T. A novel method to visualise and quantify circadian misalignment. Sci. Rep. 2016, 6, 38601. [Google Scholar] [CrossRef]
- Fischer, D.; McHill, A.W.; Sano, A.; Picard, R.W.; Barger, L.K.; Czeisler, C.A.; Klerman, E.B.; Phillips, A.J.K. Irregular sleep and event schedules are associated with poorer self-reported well-being in US college students. Sleep 2020, 43, zsz300. [Google Scholar] [CrossRef]
- Farshchi, H.R.; Taylor, M.A.; Macdonald, I.A. Beneficial metabolic effects of regular meal frequency on dietary thermogenesis, insulin sensitivity, and fasting lipid profiles in healthy obese women. Am. J. Clin. Nutr. 2005, 81, 16–24. [Google Scholar] [CrossRef]
- Farshchi, H.R.; Taylor, M.A.; Macdonald, I.A. Regular meal frequency creates more appropriate insulin sensitivity and lipid profiles compared with irregular meal frequency in healthy lean women. Eur. J. Clin. Nutr. 2004, 58, 1071–1077. [Google Scholar] [CrossRef]
- Zeballos, E.; Chelius, C. The effects of grazing on daily caloric intake and dietary quality. Int. J. Behav. Nutr. Phys. Act. 2021, 18, 163. [Google Scholar] [CrossRef]
- Fischer, D.; Klerman, E.B.; Phillips, A.J.K. Measuring sleep regularity: Theoretical properties and practical usage of existing metrics. Sleep 2021, 44, zsab103. [Google Scholar] [CrossRef]
- Claudino, J.G.; Gabbet, T.J.; de Sá Souza, H.; Simim, M.; Fowler, P.; de Alcantara Borba, D.; Melo, M.; Bottino, A.; Loturco, I.; D’Almeida, V.; et al. Which parameters to use for sleep quality monitoring in team sport athletes? A systematic review and meta-analysis. BMJ Open Sport Exerc. Med. 2019, 5, e000475. [Google Scholar] [CrossRef]
- Huang, T.; Mariani, S.; Redline, S. Sleep Irregularity and Risk of Cardiovascular Events: The Multi-Ethnic Study of Atherosclerosis. J. Am. Coll. Cardiol. 2020, 75, 991–999. [Google Scholar]
- Alhussain, M.H.; Macdonald, I.A.; Taylor, M.A. Irregular meal-pattern effects on energy expenditure, metabolism, and appetite regulation: A randomized controlled trial in healthy normal-weight women. Am. J. Clin. Nutr. 2016, 104, 21–32. [Google Scholar] [CrossRef]
- Pot, G.K.; Almoosawi, S.; Stephen, A.M. Meal irregularity and cardiometabolic consequences: Results from observational and intervention studies. Proc. Nutr. Soc. 2016, 75, 475–486. [Google Scholar] [CrossRef]
- Drapeau, V.; Gallant, A.R. Homeostatic and Circadian Control of Food Intake: Clinical Strategies to Prevent Overconsumption. Curr. Obes. Rep. 2013, 2, 93–103. [Google Scholar]
- Stokkan, K.A.; Yamazaki, S.; Tei, H.; Sakaki, Y.; Menaker, M. Entrainment of the circadian clock in the liver by feeding. Science 2001, 291, 490–493. [Google Scholar] [CrossRef]
- Tahara, Y.; Shibata, S. Chronobiology and nutrition. Neuroscience 2013, 253, 78–88. [Google Scholar] [CrossRef]
- Green, C.B.; Takahashi, J.S.; Bass, J. The meter of metabolism. Cell 2008, 134, 728–742. [Google Scholar] [CrossRef]
- Johnston, J.D. Physiological links between circadian rhythms, metabolism and nutrition. Exp. Physiol. 2014, 99, 1133–1137. [Google Scholar] [CrossRef]
- Wehrens, S.M.T.; Christou, S.; Isherwood, C.; Middleton, B.; Gibbs, M.A.; Archer, S.N.; Skene, D.J.; Johnston, J.D. Meal Timing Regulates the Human Circadian System. Curr. Biol. 2017, 27, 1768–1775.e3. [Google Scholar] [CrossRef]
- Turek, F.W.; Joshu, C.; Kohsaka, A.; Lin, E.; Ivanova, G.; McDearmon, E.; Laposky, A.; Losee-Olson, S.; Easton, A.; Jensen, D.R.; et al. Obesity and metabolic syndrome in circadian Clock mutant mice. Science 2005, 308, 1043–1045. [Google Scholar] [CrossRef]
- Johnston, J.D. Physiological responses to food intake throughout the day. Nutr. Res. Rev. 2014, 27, 107–118. [Google Scholar] [CrossRef]
- Guan, D.; Lazar, M.A. Interconnections between circadian clocks and metabolism. J. Clin. Investig. 2021, 131, e148278. [Google Scholar] [CrossRef]
- Livingstone, M.B.; Robson, P.J.; Wallace, J.M. Issues in dietary intake assessment of children and adolescents. Br. J. Nutr. 2004, 92 (Suppl. 2), S213–S222. [Google Scholar] [CrossRef]
- Westerterp, K.R.; Goris, A.H. Validity of the assessment of dietary intake: Problems of misreporting. Curr. Opin. Clin. Nutr. Metab. Care 2002, 5, 489–493. [Google Scholar] [CrossRef]
- Osadchiy, T.; Poliakov, I.; Olivier, P.; Rowland, M.; Foster, E. Progressive 24-Hour Recall: Usability Study of Short Retention Intervals in Web-Based Dietary Assessment Surveys. J. Med. Internet Res. 2020, 22, e13266. [Google Scholar] [CrossRef] [PubMed]
- Battaglia, B.; Lee, L.; Jia, S.S.; Partridge, S.R.; Allman-Farinelli, M. The Use of Mobile-Based Ecological Momentary Assessment (mEMA) Methodology to Assess Dietary Intake, Food Consumption Behaviours and Context in Young People: A Systematic Review. Healthcare 2022, 10, 1329. [Google Scholar] [CrossRef] [PubMed]
- Schembre, S.M.; Liao, Y.; O-Connor, S.G.; Hingle, M.D.; Shen, S.E.; Hamoy, K.G.; Huh, J.; Dunton, G.F.; Weiss, R.; Thomson, C.A.; et al. Mobile Ecological Momentary Diet Assessment Methods for Behavioral Research: Systematic Review. JMIR Mhealth Uhealth 2018, 6, e11170. [Google Scholar] [CrossRef]
- Wang, L.; Allman-Farinelli, M.; Yang, J.A.; Taylor, J.C.; Gemming, L.; Hekler, E.; Rangan, A. Enhancing Nutrition Care Through Real-Time, Sensor-Based Capture of Eating Occasions: A Scoping Review. Front. Nutr. 2022, 9, 852984. [Google Scholar] [CrossRef] [PubMed]
- Crochiere, R.J.; Zhang, F.Z.; Juarascio, A.S.; Goldstein, S.P.; Thomas, J.G.; Forman, E.M. Comparing ecological momentary assessment to sensor-based approaches in predicting dietary lapse. Transl. Behav. Med. 2021, 11, 2099–2109. [Google Scholar] [CrossRef] [PubMed]
- Thompson, F.E.; Subar, A.F.; Loria, C.M.; Reedy, J.L.; Baranowski, T. Need for technological innovation in dietary assessment. J. Am. Diet. Assoc. 2010, 110, 48–51. [Google Scholar] [CrossRef] [PubMed]
- Bell, B.M.; Alam, R.; Mondol, A.S.; Ma, M.; Emi, I.A.; Preum, S.M.; de la Haye, K.; Stankovic, J.A.; Lach, J.; Spruijt-Metz, D. Validity and Feasibility of the Monitoring and Modeling Family Eating Dynamics System to Automatically Detect In-field Family Eating Behavior: Observational Study. JMIR Mhealth Uhealth 2022, 10, e30211. [Google Scholar] [CrossRef] [PubMed]
- Gage, R.; Girling-Butcher, M.; Joe, E.; Smith, M.; Ni Mhurchu, C.; McKerchar, C.; Puloka, V.; McLean, R.; Signal, L. The Frequency and Context of Snacking among Children: An Objective Analysis Using Wearable Cameras. Nutrients 2020, 13, 103. [Google Scholar] [CrossRef]
- Australian Bureau of Statistics. National Health Survey: First Results. 2018. Available online: https://www.abs.gov.au/statistics/health/health-conditions-and-risks/national-health-survey-first-results/latest-release (accessed on 31 August 2022).
- Riley, M.D.; Hendrie, G.A.; Baird, D.L. Drink Choice is Important: Beverages Make a Substantial Contribution to Energy, Sugar, Calcium and Vitamin C Intake among Australians. Nutrients 2019, 11, 1389. [Google Scholar] [CrossRef]
- Malisova, O.; Bountziouka, V.; Zampelas, A.; Kapsokefalou, M. Evaluation of Drinks Contribution to Energy Intake in Summer and Winter. Nutrients 2015, 7, 3724–3738. [Google Scholar] [CrossRef]


| CPD (First and Last EO) | CV No. of EOs | CV Eating Window | ||||
|---|---|---|---|---|---|---|
| Cut-off | Hours | Cut-off | EOs | Cut-off | Hours | |
| Variability | ||||||
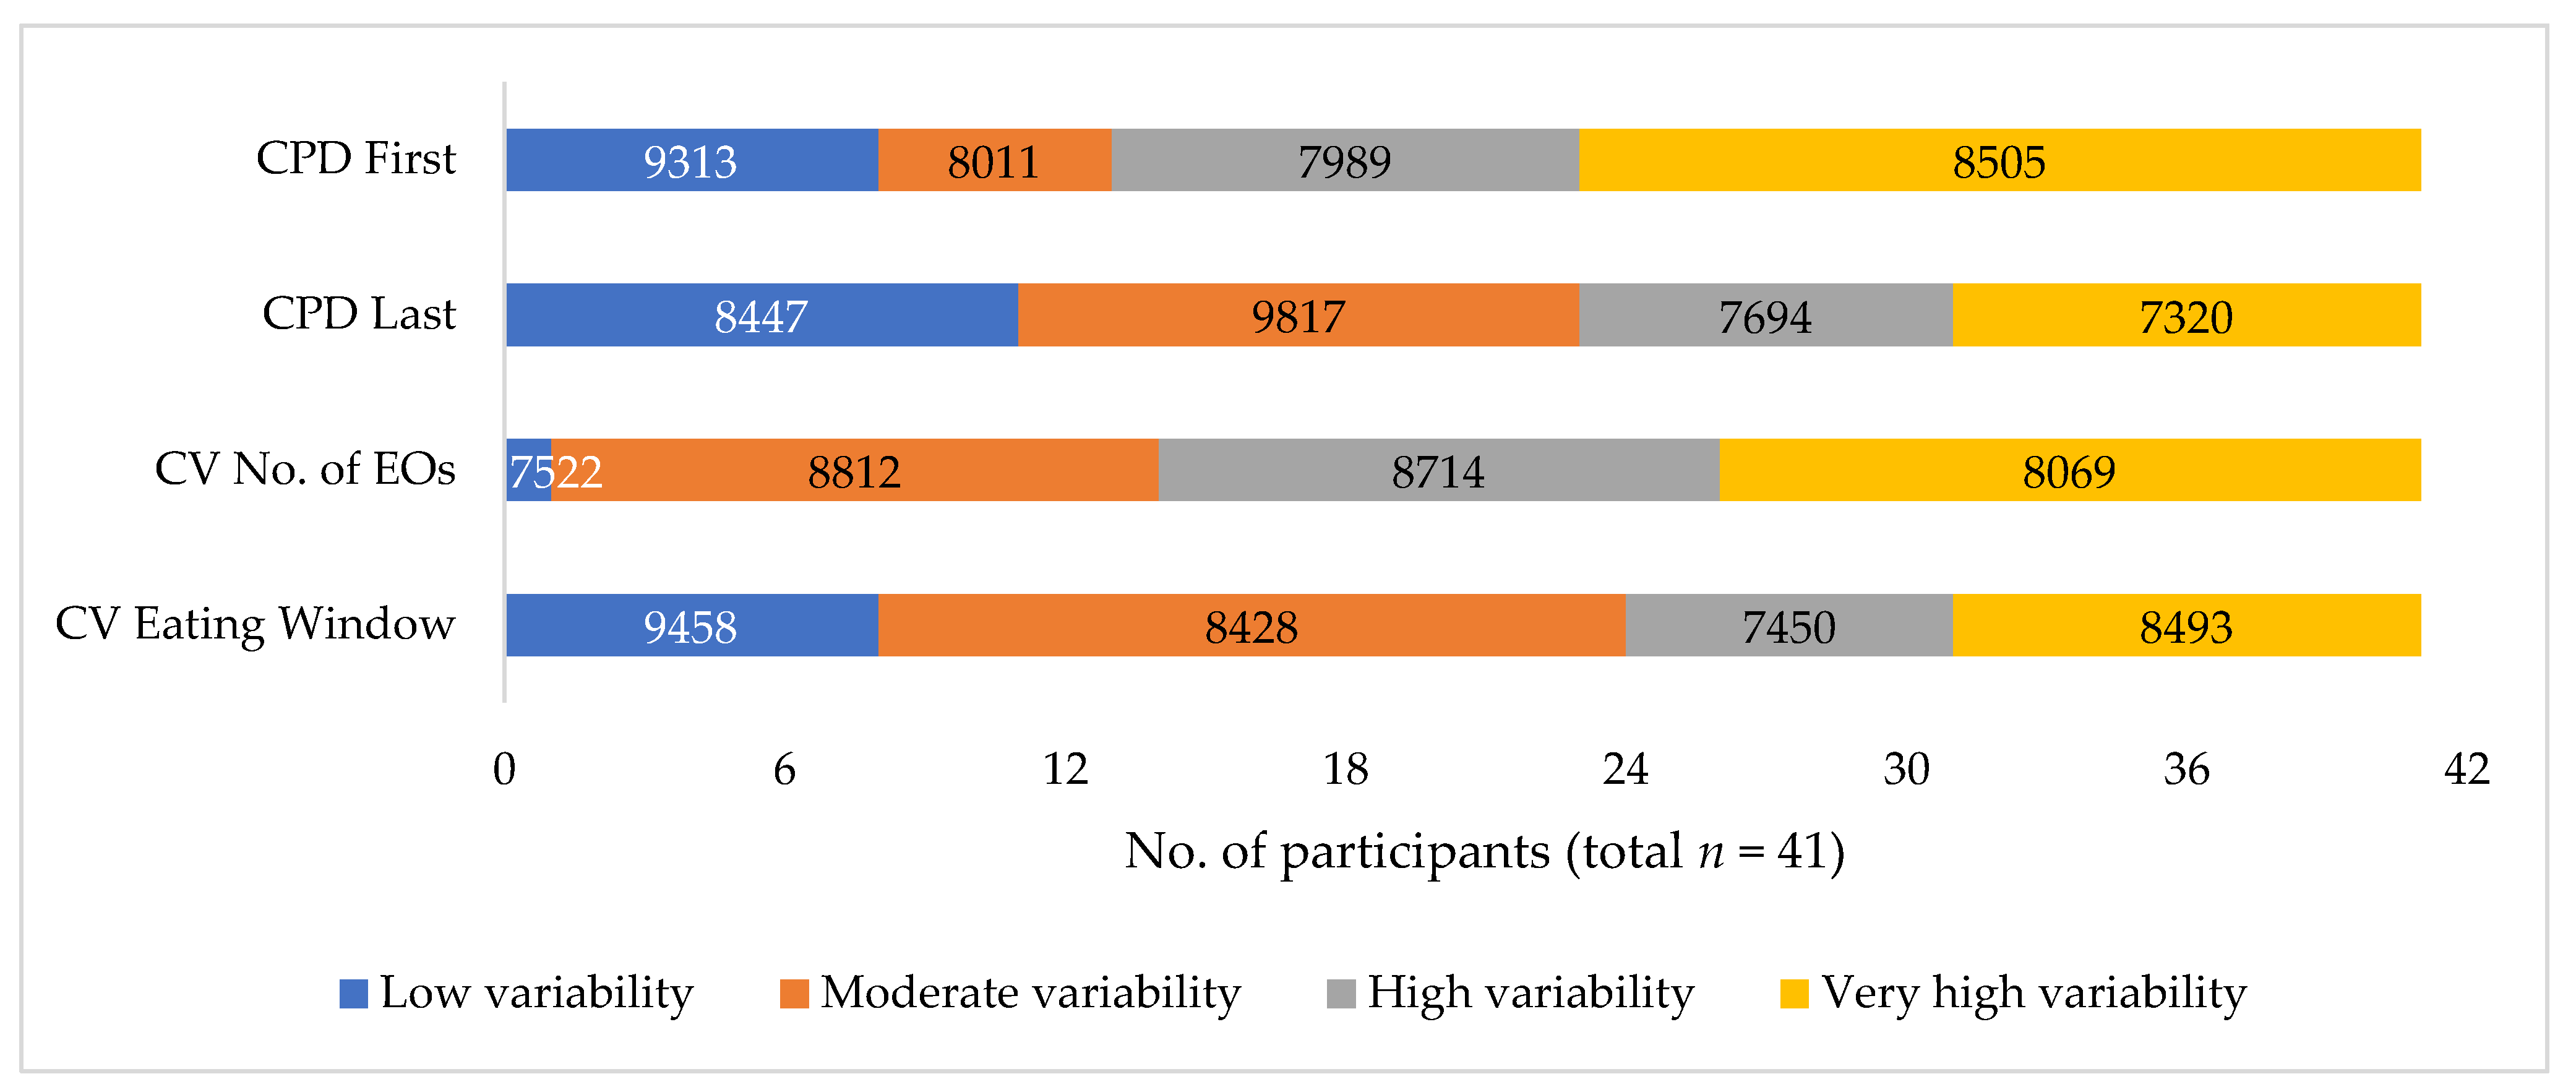
| Low | <1.15 | <2 h | <10% | <1 EO | <10% | <2 h |
| Moderate | 1.15–1.70 | 2–3 h | 11–20% | 1–2 EOs | 11–20% | 2–4 h |
| High | 1.71–2.40 | 3–4 h | 21–30% | 2–3 EOs | 21–30% | 4–5 h |
| Very high | >2.40 | > 4 h | >30% | >3 EOs | >30% | >5 h |
| All Participants (n = 41) | Female (n = 27) | Male (n = 14) | |
|---|---|---|---|
| Age (years) | |||
| 18–24 | 25 | 18 | 7 |
| 25–30 | 16 | 9 | 7 |
| Body Mass Index (BMI, kg/m2) | |||
| <18.5 | 0 | 0 | 0 |
| ≥18.5 < 25 | 28 | 20 | 8 |
| ≥25 < 30 | 7 | 3 | 4 |
| ≥30 | 6 | 4 | 2 |
| Socio-economic status (SES) | |||
| Higher | 22 | 13 | 9 |
| Lower | 19 | 14 | 5 |
| Highest education attained | |||
| Secondary school or less | 15 | 10 | 5 |
| Trade or diploma | 7 | 7 | 0 |
| University degree | 19 | 10 | 9 |
| Employment/study | |||
| Full-time study | 28 | 18 | 10 |
| Full-time work | 5 | 4 | 1 |
| Part-time study/work | 5 | 3 | 2 |
| Not studying or working | 3 | 2 | 1 |
| All Days (n = 123) | |||
|---|---|---|---|
| Mean | Min | Max | |
| Eating pattern metrics | |||
| Time of first EO (hh:mm) | 10:18 | 00:46 | 19:52 |
| Time of last EO (hh:mm) | 20:06 | 12:43 | 23:38 |
| No. of EOs per day | 4.7 | 1.0 | 9.0 |
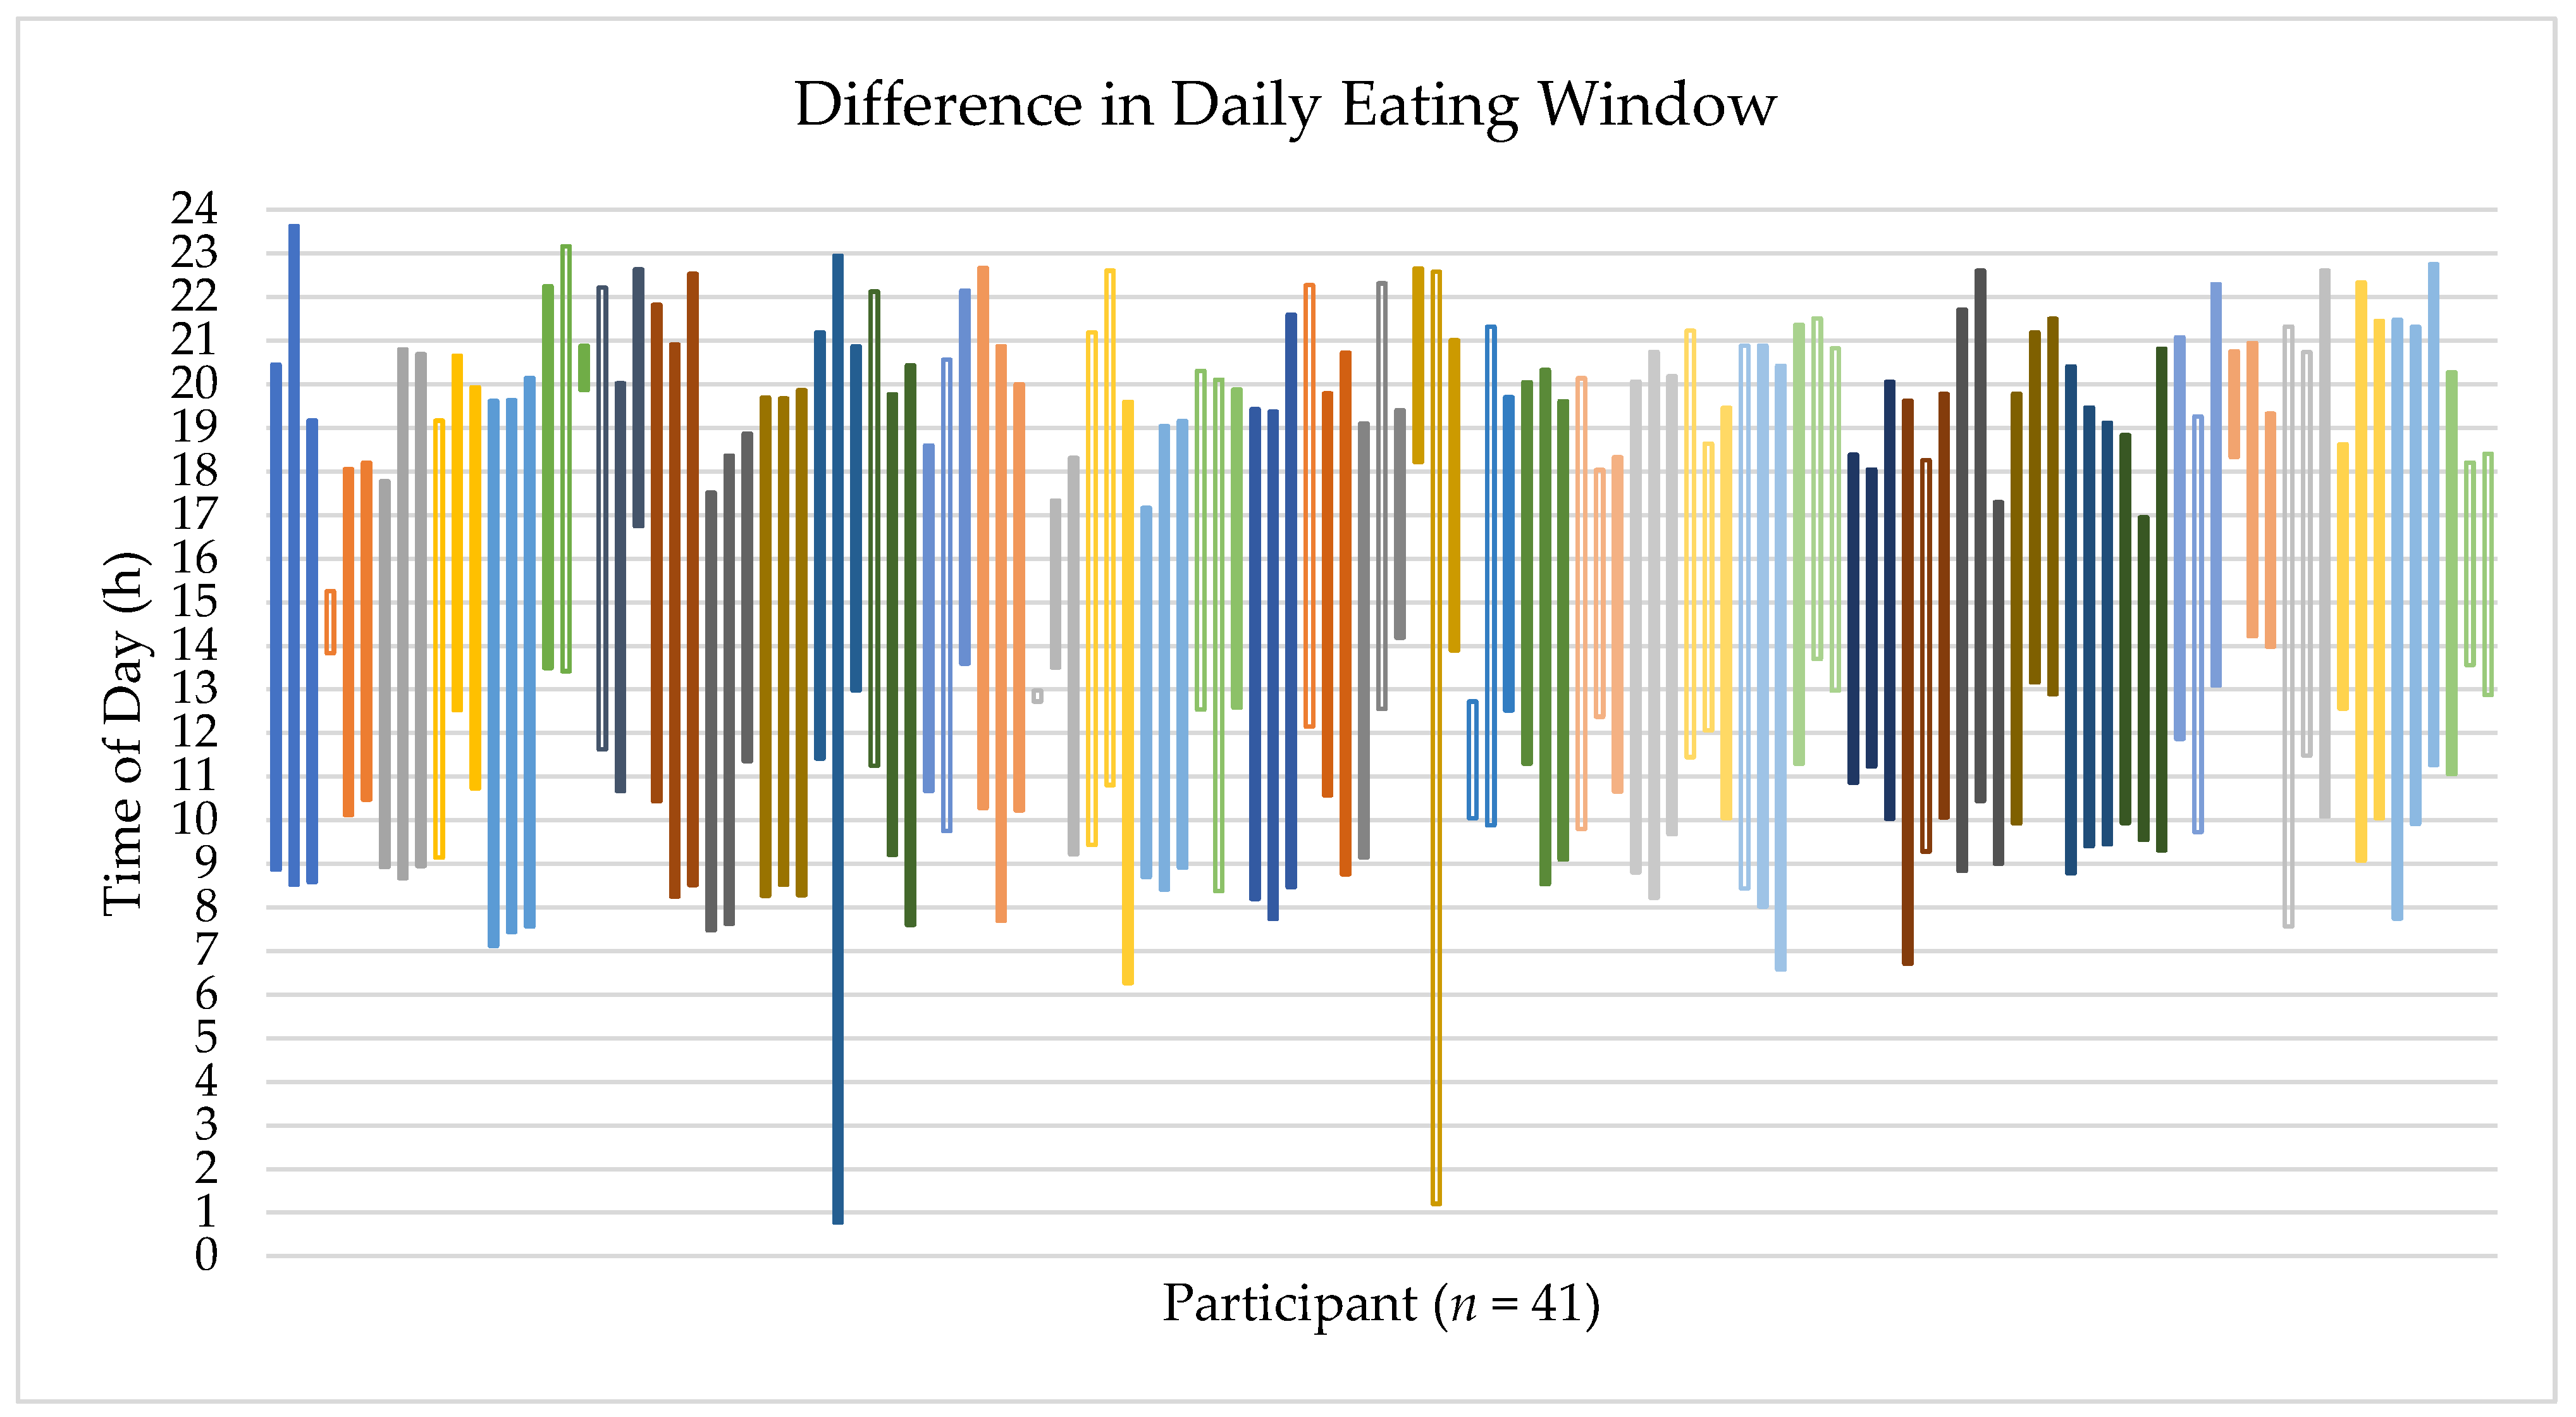
| Daily eating window (h) | 9.8 | 0.3 | 22.2 |
| Daily energy intake (kJ) | 8478 | 760 | 22,879 |
| Intra-individual variability metrics | |||
| CPD First (h) | 2.9 | 0.3 | 16.3 |
| CPD Last (h) | 1.8 | 0.2 | 5.8 |
| CV No. of EOs (%) | 28.3 | 0.0 | 78.1 |
| CV Eating Window (%) | 25.6 | 1.6 | 106.0 |
| Mean ± SD | p-Value | ||
|---|---|---|---|
| Body Mass Index (BMI) | <25 kg/m2 (n = 28) | ≥25 kg/m2 (n = 13) | |
| Time of first EO (hh:mm) | 10.58 ± 2.114 | 9.777 ± 1.021 | 0.338 |
| Time of last EO (hh:mm) | 20.00 ± 1.428 | 20.41 ± 1.116 | 0.589 |
| No. of EOs per day | 4.726 ± 1.247 | 4.615 ± 0.989 | 0.709 |
| Daily eating window (h) | 9.419 ± 2.463 | 10.63 ± 1.423 | 0.195 |
| Daily energy intake (kJ) | 8169 ± 2258 | 9143 ± 2487 | 0.311 |
| Mean ± SD | p-Value | ||
|---|---|---|---|
| Gender | Male (n = 14) | Female (n = 27) | |
| CPD First (h) | 4.128 ± 4.661 | 2.295 ± 1.772 | 0.176 |
| CPD Last (h) | 1.555 ± 0.805 | 2.009 ± 1.375 | 0.263 |
| CV No. of EOs (%) | 22.96 ± 9.909 | 31.00 ± 17.538 | 0.122 |
| CV Eating Window (%) | 24.82 ± 22.59 | 25.98 ± 24.43 | 0.883 |
| Body Mass Index (BMI) | <25 kg/m2 (n = 28) | ≥25 kg/m2 (n = 13) | |
| CPD First (h) | 2.466 ± 1.784 | 3.903 ± 4.922 | 0.325 |
| CPD Last (h) | 1.843 ± 1.310 | 1.879 ± 1.045 | 0.932 |
| CV No. of EOs (%) | 30.54 ± 16.75 | 23.32 ± 12.36 | 0.174 |
| CV Eating Window (%) | 24.68 ± 24.87 | 27.53 ± 21.19 | 0.723 |
| Socioeconomic Status (SES) | Top five deciles (n = 22) | Bottom five deciles (n = 19) | |
| CPD First (h) | 3.786 ± 4.012 | 1.920 ± 1.091 | 0.047 * |
| CPD Last (h) | 1.890 ± 1.327 | 1.813 ± 1.115 | 0.843 |
| CV No. of EOs (%) | 27.58 ± 14.97 | 29.03 ± 16.90 | 0.773 |
| CV Eating Window (%) | 28.07 ± 24.86 | 22.70 ± 22.23 | 0.474 |
Publisher’s Note: MDPI stays neutral with regard to jurisdictional claims in published maps and institutional affiliations. |
© 2022 by the authors. Licensee MDPI, Basel, Switzerland. This article is an open access article distributed under the terms and conditions of the Creative Commons Attribution (CC BY) license (https://creativecommons.org/licenses/by/4.0/).
Share and Cite
Wang, L.; Chan, V.; Allman-Farinelli, M.; Davies, A.; Wellard-Cole, L.; Rangan, A. Wearable Cameras Reveal Large Intra-Individual Variability in Timing of Eating among Young Adults. Nutrients 2022, 14, 4349. https://doi.org/10.3390/nu14204349
Wang L, Chan V, Allman-Farinelli M, Davies A, Wellard-Cole L, Rangan A. Wearable Cameras Reveal Large Intra-Individual Variability in Timing of Eating among Young Adults. Nutrients. 2022; 14(20):4349. https://doi.org/10.3390/nu14204349
Chicago/Turabian StyleWang, Leanne, Virginia Chan, Margaret Allman-Farinelli, Alyse Davies, Lyndal Wellard-Cole, and Anna Rangan. 2022. "Wearable Cameras Reveal Large Intra-Individual Variability in Timing of Eating among Young Adults" Nutrients 14, no. 20: 4349. https://doi.org/10.3390/nu14204349
APA StyleWang, L., Chan, V., Allman-Farinelli, M., Davies, A., Wellard-Cole, L., & Rangan, A. (2022). Wearable Cameras Reveal Large Intra-Individual Variability in Timing of Eating among Young Adults. Nutrients, 14(20), 4349. https://doi.org/10.3390/nu14204349