Observation of Traditional Caregiver-Infant Feeding Behaviours and Porridge and Energy Intakes during One Meal to Define Key Messages for Promoting Responsive Feeding in the Amparafaravola District, Rural Madagascar

 , and
, and
Abstract
:1. Introduction
2. Subjects, Materials and Methods
2.1. Ethical Aspects
2.2. Observational Study to Characterise Traditional Feeding Styles and Practices; Intake Measurement
2.2.1. Study Design, Location and Participants
2.2.2. Characteristics of the Porridge Used in the Study
2.2.3. Meal Observations and Intake Measurements
2.2.4. Meal Video-Recording Analysis
2.2.5. Anthropometric Measurements
2.2.6. Socio-Economical Characteristics and Feeding Practices
2.2.7. Data Management and Statistical Analysis
2.3. Validation of Key Messages for Responsive Feeding Promotion in the Amparafaravola District
2.3.1. Definition of the Key Messages and Creation of an Awareness-Raising Tool for Their Promotion
2.3.2. Assessment of the Key Message through Focus Group Discussion
2.3.3. Qualitative Data Analysis
3. Results
3.1. Traditional Feeding Styles and Porridge and Energy Intakes
3.1.1. Socio-Demographic and Anthropometric Characteristics of Participants
3.1.2. Breastfeeding and Complementary Feeding Practices
3.1.3. Characteristics of Mealtime, Feeding Practices, and Feeding Behaviours
3.1.4. Associations with Porridge and Energy Intakes
3.2. Development of Key Messages and an Awareness-Raising Tool to Promote Responsive Feeding and Validation in the Community
3.3. Assessment of the Key Messages’ Acceptability by the Local Community
4. Discussion
5. Conclusions
Author Contributions
Funding
Institutional Review Board Statement
Informed Consent Statement
Data Availability Statement
Acknowledgments
Conflicts of Interest
References
- UNICEF. The State of the World’s Children—A UNICEF Report. Malnutrition: Causes, consequences, and solutions. Nutr. Rev. 1998, 56, 115–123. [Google Scholar] [CrossRef]
- UNICEF. Improving Child Nutrition: The Achievable Imperative for Global Progress; UNICEF, Ed.; United Nations Children’s Fund: New York, NY, USA, 2013; ISBN 978-92-806-4686-3. [Google Scholar]
- UNICEF; WHO; WB. Levels and Trends in Child Malnutrition: UNICEF/WHO/The World Bank Group Joint Child Malnutrition Estimates: Key Findings of the 2021 Edition; World Health Organization: Geneva, Switzerland, 2021; ISBN 978-92-4-002525-7. [Google Scholar]
- INSTAT; UNICEF. Enquête Par Grappes À Indicateurs Multiples-MICS Madagascar, 2018, Rapport Final; INSTAT et UNICEF: Antananarivo, Madagascar, 2019. [Google Scholar]
- INSTAT; ICF. Macro Enquête Démographique et de Santé de Madagascar 2008–2009; INSTAT et ICF Macro: Antananarivo, Madagascar, 2010; p. 474. [Google Scholar]
- Stewart, C.P.; Iannotti, L.; Dewey, K.G.; Michaelsen, K.F.; Onyango, A.W. Contextualising Complementary Feeding in a Broader Framework for Stunting Prevention. Matern. Child Nutr. 2013, 9 (Suppl. 2), 27–45. [Google Scholar] [CrossRef]
- WHO. Complementary Feeding of Young Children in Developing Countries: A Review of Current Scientific Knowledge; Unicef/University of California-Davis/WHO/ORSTOM: Geneva, Switzerland, 1998. [Google Scholar]
- Mouquet-Rivier, C.; Traoré, T.; Soma, A.; Kaboré, C.; Trèche, S. Both encouraging feeding style and high energy density may increase energy intakes from fermented millet gruels eaten by infants and toddlers in Ouagadougou. Appetite 2016, 99, 245–253. [Google Scholar] [CrossRef] [PubMed]
- Trèche, S. Complementary Foods in Developing Countries: Importance, Required Characteristics, Constraints and Potential Strategies for Improvement. In Proceedings of the International Colloquium Promoting Growth and Development of under-Fives, Antwerpen, Belgium, 28–30 November 2001; pp. 132–148. [Google Scholar]
- Baye, K.; Tariku, A.; Mouquet-Rivier, C. Caregiver-infant’s feeding behaviours are associated with energy intake of 9–11 month-old infants in rural Ethiopia. Matern. Child Nutr. 2018, 14, e12487. [Google Scholar] [CrossRef] [Green Version]
- Golden, B.E.; Golden, M.H.N. Relationships among dietary quality, children’s appetites, growth stunting, and efficiency of growth in poor populations. Food Nutr. Bull. 1991, 13, 1–5. [Google Scholar] [CrossRef]
- Martorell, R.; Yarbrough, C.; Yarbrough, S.; Klein, R.E. The Impact of ordinary illnesses on the dietary intakes of malnourished children. Am. J. Clin. Nutr. 1980, 33, 345–350. [Google Scholar] [CrossRef] [PubMed] [Green Version]
- Humphrey, J.H. Child undernutrition, tropical enteropathy, toilets, and handwashing. Lancet 2009, 374, 1032–1035. [Google Scholar] [CrossRef]
- Crane, R.J.; Jones, K.D.J.; Berkley, J.A. Environmental Enteric Dysfunction: An Overview. Food Nutr. Bull. 2015, 36, S76–S87. [Google Scholar] [CrossRef] [PubMed]
- Trèche, S.; Mouquet-Rivier, C. Use of Amylases in Infant Food. In Enzymes as Additives or Processing Aids; Porta, R., Mariniello, L., Di Pierro, P., Eds.; Research Signpost: Villalonga, Spain, 2008; pp. 213–245. [Google Scholar]
- Kampstra, N.A.; Van Hoan, N.; Koenders, D.J.P.C.; Schoop, R.; Broersen, B.C.; Mouquet-Rivier, C.; Traoré, T.; Bruins, M.J.; de Pee, S. Energy and nutrient intake increased by 47–67% when amylase was added to fortified blended foods-a study among 12- to 35-month-old burkinabe children. Matern. Child Nutr. 2018, 14, e12459. [Google Scholar] [CrossRef] [Green Version]
- Allen, L.; World Health Organization; Food and Agriculture Organization of the United Nations. Guidelines on Food Fortification with Micronutrients; World Health Organization: Geneva, Switzerland; Food and Agriculture Organization of the United Nations: Rome, Italy, 2006. [Google Scholar]
- Vieu, M.C.; Traore, T.; Trèche, S. Effects of energy density and sweetness of gruels on Burkinabe infant energy intakes in free living conditions. Int. J. Food Sci. Nutr. 2001, 52, 213–218. [Google Scholar] [CrossRef] [PubMed]
- WHO; FAO (Eds.) Vitamin and Mineral Requirements in Human Nutrition, 2nd ed.; World Health Organization: Geneva, Switzerland; FAO: Rome, Italy, 2004; ISBN 978-92-4-154612-6. [Google Scholar]
- Lutter, C.K.; Dewey, K.G. Proposed nutrient composition for fortified complementary foods. J. Nutr. 2003, 133, 3011S–3020S. [Google Scholar] [CrossRef] [PubMed] [Green Version]
- GAIN. Guidelines for Complementary Foods and Complementary Food Supplements Supported by GAIN; Version 1; WHO: Geneva, Switzerland, 2011. [Google Scholar]
- Pérez-Escamilla, R.; Segura-Pérez, S.; Lott, M. Feeding guidelines for infants and young toddlers: A responsive parenting approach. Nutr. Today 2017, 52, 223–231. [Google Scholar] [CrossRef]
- Harbron, J.; Najaar, B. Responsive feeding: Establishing healthy eating behaviour early on in life. S. Afr. J. Clin. Nutr. 2013, 26 (Suppl. 3), S141–S149. [Google Scholar]
- PAHO; WHO. Guiding Principles for Complementary Feeding of the Breastfed Child; PAHO: Geneva, Switzerland; WHO: Geneva, Switzerland, 2003. [Google Scholar]
- WHO. Guiding Principles for Feeding Non-Breastfed Children 6–24 Months of Age; World Health Organization: Geneva, Switzerland, 2005; ISBN 978-92-4-159343-4. [Google Scholar]
- Lutter, C.K.; Grummer-Strawn, L.; Rogers, L. Complementary feeding of infants and young children 6 to 23 months of age. Nutr. Rev. 2021, 79, 825–846. [Google Scholar] [CrossRef]
- Aboud, F.E.; Shafique, S.; Akhter, S. A responsive feeding intervention increases children’s self-feeding and maternal responsiveness but not weight gain. J. Nutr. 2009, 139, 1738–1743. [Google Scholar] [CrossRef]
- Vazir, S.; Engle, P.; Balakrishna, N.; Griffiths, P.L.; Johnson, S.L.; Creed-Kanashiro, H.; Rao, S.F.; Shroff, M.R.; Bentley, M.E. Cluster-randomized trial on complementary and responsive feeding education to caregivers found improved dietary intake, growth and development among rural Indian toddlers: Responsive feeding, infant growth and development. Matern. Child Nutr. 2013, 9, 99–117. [Google Scholar] [CrossRef] [Green Version]
- Abebe, Z.; Haki, G.D.; Baye, K. Child feeding style is associated with food intake and linear growth in rural Ethiopia. Appetite 2017, 116, 132–138. [Google Scholar] [CrossRef]
- Sall, N.S.; Bégin, F.; Dupuis, J.B.; Bourque, J.; Menasria, L.; Main, B.; Vong, L.; Hun, V.; Raminashvili, D.; Chea, C.; et al. A measurement scale to assess responsive feeding among Cambodian young children. Matern. Child Nutr. 2020, 16, e12956. [Google Scholar] [CrossRef]
- Moore, A.C.; Akhter, S.; Aboud, F.E. Responsive complementary feeding in rural Bangladesh. Soc. Sci. Med. 2006, 62, 1917–1930. [Google Scholar] [CrossRef]
- de Onis, M.; Onyango, A.W.; Van den Broeck, J.; Chumlea, W.C.; Martorell, R. Measurement and standardization protocols for anthropometry used in the construction of a new international growth reference. Food Nutr. Bull. 2004, 25, S27–S36. [Google Scholar] [CrossRef]
- WHO. Indicators for Assessing Infant and Young Child Feeding Practices: Conclusions of a Consensus Meeting Held 6–8 November 2007 in Washington D.C., USA; World Health Organization (WHO): Washington, DC, USA, 2008; ISBN 978-92-4-159666-4. [Google Scholar]
- WHO; UNICEF; USAID; AED; UCDAVIS; IFPRI. Indicators for Assessing Infant and Young Child Feeding Practices. Parts II Measurement; World Health Organization: Geneva, Switzerland; Available online: http://www.who.int/nutrition/publications/infantfeeding/9789241599290/en/ (accessed on 14 November 2021).
- WHO. WHO Child Growth Standards: Length/Height-for-Age, Weight-for-Age, Weight-for-Length, Weight-for-Height and Body Mass Index-for-Age: Methods and Development. Available online: https://www.who.int/publications-detail-redirect/924154693X (accessed on 4 May 2021).
- WHO; UNICEF. Indicators for Assessing Infant and Young Child Feeding Practices: Definitions and Measurement Methods; IGO: Geneva, Switzerland, 2021; Licence: CC BYNC-SA 3.0. [Google Scholar]
- Van Hoan, N. Conditions d’utilisation d’un «cuiseur-extrudeur à très faible coût» pour la fabrication de farines infantiles au Vietnam. Ph.D. Thesis, Food Sciences and Nutrition, University of Montpellier, Montpellier, France, 2008. [Google Scholar]
- Donnen, P.; Dramaix, M.; Brasseur, D.; Mihanda, R.B.; Fazili, S.; Treche, S. High-energy-density gruels in the treatment of hospitalized children suffering from mainly protein malnutrition in Zaire. Food Nutr. Bull. 1996, 17, 10. [Google Scholar]
- Bennett, V.A.; Morales, E.; González, J.; Peerson, J.M.; de Romaña, G.L.; Brown, K.H. Effects of dietary viscosity and energy density on total daily energy consumption by young Peruvian children. Am. J. Clin. Nutr. 1999, 70, 285–291. [Google Scholar] [CrossRef] [PubMed]
- Hromi-Fiedler, A.J.; Carroll, G.J.; Tice, M.R.; Sandow, A.; Aryeetey, R.; Pérez-Escamilla, R. Development and testing of responsive feeding counseling cards to strengthen the UNICEF infant and young child feeding counseling package. Current Dev. Nutr. 2020, 4, nzaa117. [Google Scholar] [CrossRef] [PubMed]


| Frequency (%) | Mean ± SD | |
|---|---|---|
| Socio-demographic characteristics | ||
| Mother’s age (year) | 26.2 ± 7.3 | |
| Mother’s occupation | ||
| Employees | 6.9 | |
| Self-employed (agriculture, livestock, crafts, …) | 79.2 | |
| Without income | 13.9 | |
| Mother’s education | ||
| No school | 8.9 | |
| Primary school | 60.4 | |
| Secondary school and more | 30.7 | |
| Number of people per living room | 2.9 ± 1.5 | |
| Infant’s age (months) | 10.3 ± 0.9 | |
| Sex | ||
| Boys | 51.5 | |
| Girls | 48.5 | |
| Birth order | 2.4 ± 1.5 | |
| Infants’ nutritional status | ||
| Weight at birth (kg), n = 59 | 3.15 ± 0.61 | |
| Low birth weight (≤2.5 kg) | 15.3 | |
| Weight (kg) | 7.71 ± 1.02 | |
| Length (cm) | 68.5 ± 2.7 | |
| Weight-for-Length Z-score a | −0.45 ± 1.09 | |
| Length-for-Age Z-score a | −1.61 ± 0.99 | |
| Weight-for-Age Z-score a | −1.23 ± 1.08 | |
| Wasting | 7.9 | |
| Stunting | 36.6 | |
| Underweight | 26.7 | |
| Frequency (%) | Mean ± SD | |
|---|---|---|
| Exclusively breastfed for the first six months | 57.4 | |
| Age of introduction of porridge or solid food (months) | 6.2 ± 1.2 | |
| <6 months | 21.8 | |
| 6 months | 42.6 | |
| >6 months | 35.6 | |
| Breastfed the day before the survey | 100 | |
| Infants who ate foods from the following food groups in the previous day | ||
| Cereals, roots and tubers | 100 | |
| Vitamin A-rich fruits and vegetables | 70.3 | |
| Other fruits and vegetables | 53.5 | |
| Legumes and nuts | 36.6 | |
| Dairy products | 17.8 | |
| Flesh foods | 7.9 | |
| Eggs | 2.0 | |
| Dietary diversity | ||
| Dietary diversity score a | 4.0 ± 1.2 | |
| Minimum dietary diversity b | 10.9 | |
| Variables | Frequency (%) | Mean ± SD |
|---|---|---|
| Children breastfed after waking up in the morning | 72.3 | |
| Children ate something else before the study meal | 40.6 | |
| Children breastfed during the study meal | 39.6 | |
| Porridge DM content (g DM/100 g) | 22.9 ± 1.5 | |
| Porridge energy density (kcal/100 g) | 91.6 ± 6.0 | |
| Porridge intake (g/meal) | 98.5 ± 55.8 | |
| Porridge intake per kg body weight (g/kg BW/meal) | 12.8 ± 7.5 | |
| <10 g/kg BW/meal | 47.5 | |
| 10–20 g/kg BW/meal | 33.7 | |
| 20–30 g/kg BW/meal | 15.8 | |
| ≥30 g/kg BW/meal | 3.0 | |
| Energy intake (kcal/meal) | 90.0 ± 51.4 | |
| Energy intake <75 kcal/meal | 49.5 | |
| Duration of the meal (min) | 10.8 ± 3.9 | |
| Number of bites refused | 3.7 ± 3.5 | |
| Reason for ending the meal | ||
| There was some porridge left, but the child refused to continue eating | 86.1 | |
| There was some porridge left, but the caregiver decided that the meal was over | 5.9 | |
| There was no more porridge in the child’s bowl | 7.9 | |
| Health status of the child on the day of observation | ||
| In good shape | 60.4 | |
| Sick | 39.6 | |
| Assessment of the child’s usual appetite (mother’s opinion) | ||
| He/she has a small appetite | 15.8 | |
| He/she eats normally | 24.8 | |
| He/she has a big appetite | 59.4 | |
| Appetite of the child during the study meal compared to usual | ||
| Less than usual | 35.6 | |
| As usual | 46.5 | |
| More than usual | 17.8 |
| % Caregivers | % Children | |||
|---|---|---|---|---|
| Feeding Behaviour | Positive | Negative | Positive | Negative |
| Self-feeding | ||||
| Absent (0–1 time) | 90.1 | 85.1 | 76.2 | 98.0 |
| Present (2–4 times) | 6.9 | 12.9 | 17.8 | 2.0 |
| Frequent (≥5 times) | 3.0 | 2.0 | 5.9 | 0.0 |
| Responsive feeding | ||||
| Absent (0–1 time) | 49.5 | 99.0 | 13.9 | 26.7 |
| Present (2–4 times) | 43.6 | 1.0 | 55.4 | 56.4 |
| Frequent (≥5 times) | 6.9 | 0.0 | 30.7 | 16.8 |
| Active feeding | ||||
| Absent (0–1 time) | 4.0 | 80.2 | 5.0 | 72.3 |
| Present (2–4 times) | 13.9 | 16.8 | 22.8 | 27.7 |
| Frequent (≥5 times) | 82.2 | 3.0 | 72.3 | 0.0 |
| Social behaviour | ||||
| Absent (0–1 time) | 7.9 | 83.2 | 17.8 | 67.3 |
| Present (2–4 times) | 33.7 | 16.8 | 53.5 | 32.7 |
| Frequent (≥5 times) | 58.4 | 0.0 | 28.7 | 0.0 |
| Distraction | ||||
| Absent (0–1 time) | 75.2 | 85.1 | 63.4 | 88.1 |
| Present (2–4 times) | 20.8 | 14.9 | 30.7 | 11.9 |
| Frequent (≥5 times) | 4.0 | 0.0 | 5.9 | 0.0 |
| Overall feeding style | Frequency in caregiver–child pairs (%) | |||
| Responsive feeding | 6.9 | |||
| Active positive | 19.8 | |||
| Laissez-faire | 68.3 | |||
| Active negative | 5.0 | |||
| Variables | Porridge Intake g/kg BW | Energy Intake kcal/meal | ||
|---|---|---|---|---|
| p-Value | Coef. | p-Value | Coef. | |
| General characteristics of households and infants | ||||
| Infant’s weight | 0.020b | −1.73 | 0.913 b | −0.56 |
| WLZ | 0.002b | −2.15 | 0.069 b | −8.55 |
| LAZ | 0.019b | −1.77 | 0.470 b | −3.76 |
| WAZ | <0.001b | −2.50 | 0.080 b | −8.24 |
| Characteristics of the mealtime | ||||
| Duration of the feeding episode | <0.001b | +0.019 | <0.001b | +0.122 |
| Usual appetite of the child | 0.037a | +1.73 | 0.020a | +13.1 |
| Caregivers’ feeding behaviours | ||||
| Responsive feeding positive | 0.029b | +2.62 | 0.027b | +18.1 |
| Social behaviour positive | 0.056 b | +2.23 | 0.048b | + 15.7 |
| Sum of caregivers’ feeding behaviours | ||||
| Sum of positive behaviours | 0.010b | +1.29 | 0.016b | +8.26 |
| Infants’ feeding behaviours | ||||
| Responsive feeding positive | 0.033b | +2.45 | 0.031b | +16.9 |
| Responsive feeding negative | 0.006b | −3.09 | 0.006b | −21.2 |
| Active feeding positive | <0.001b | +5.73 | <0.001b | +39.1 |
| Social behaviour positive | 0.011b | +2.80 | 0.006b | +20.6 |
| Distraction positive | 0.008b | +3.26 | 0.012b | +21.0 |
| Sum of infants’ behaviours | ||||
| Sum of positive behaviours | <0.001b | +2.22 | <0.001b | +14.8 |
| Sum of negative behaviours | 0.017b | −1.45 | 0.012b | −10.3 |
| Overall feeding style | 0.031a | 0.023a | ||
| Laissez-faire | ||||
| Active negative | −3.84 | −25.8 | ||
| Active positive | +0.55 | 5.15 | ||
| Responsive feeding | +5.55 | 37.3 | ||
| Variable | Porridge Intake g/kg BW p-Value Mean ± SD | Energy Intake kcal/meal p-Value Mean ± SD |
|---|---|---|
| Caregiver’s age (years) | NS | X 2 |
| Child length (cm) | NS | X 2 |
| Weight-for-length Z-score | NS | NS |
| Length-for-age Z-score | NS | X 2 |
| Weight-for-age Z-score (WAZ) | p < 0.001 | NS |
| Underweight (WAZ < −2ET) (n = 27) | 18.0 ± 8.6 | |
| Not underweight (WAZ ≥ −2ET) (n = 74) | 10. 9 ± 6.1 | |
| Meal duration | p < 0.001 | p < 0.001 |
| ≤8.6 min (n = 36) | 8.3 ± 4.1 a | 61.1 ± 30.2 a |
| 8.7–11.9 min (n = 33) | 11.6 ± 6.1 b | 82.0 ± 46.0 b |
| ≥12.0 min (n = 32) | 19.0 ± 7.7 c | 130.5 ± 49.8 c |
| Child’s health status on the observation day | NS | X 2 |
| Usual child’s appetite as declared by mothers | p = 0.024 | p = 0.024 |
| Small appetite (n = 16) | 9.5 ± 8.5 a | 64.4 ± 43.3 a |
| Normal appetite (n = 25) | 11.0 ± 4.8 ab | 78.7 ± 30.3 ab |
| Big appetite (n = 60) | 14.4 ± 7.8 b | 101.4 ± 56.6 b |
| Feeding Behaviour Type | Porridge Intake g/kg BW p-Value Mean ± SD | Energy Intake kcal/meal p-Value Mean ± SD |
|---|---|---|
| Caregivers’ feeding behaviour | ||
| Self-feeding, positive | NS | x |
| Responsive feeding, positive | p = 0.029 | p = 0.027 |
| Absent (n = 50) | 11.9 ± 7.0 a | 82.9 ± 48.6 a |
| Present (n = 44) | 12.58 ± 7.0 ab | 90.0 ± 50.6 a |
| Frequent (n = 7) | 20.70 ± 10.1 c | 139.8 ± 50.6 b |
| Social behaviour, positive | x | NS |
| Sum of the caregivers’ positive behaviours | NS | NS |
| Infants’ feeding behaviour | ||
| Self-feeding, positive | NS | x |
| Responsive feeding, positive | NS | NS |
| Responsive feeding, negative | NS | NS |
| Active feeding, positive | p < 0.001 | p < 0.001 |
| Absent (n = 5) | 3.1 ± 0.99 a | 24.0 ± 7.5 a |
| Present (n = 23) | 9.0 ± 5.2 b | 63.8 ± 39.5 b |
| Frequent (n = 73) | 14.7 ± 7.4 c | 102.7 ± 49.6 c |
| Social behaviour, positive | NS | |
| Distraction, positive | p < 0.001 | p = 0.001 |
| Absent (n = 64) | 11.7 ± 6.3 a | 82.4 ± 44.6 a |
| Present (n = 31) | 13.6 ± 8.5 ab | 96.2 ± 60.2 ab |
| Frequent (n = 6) | 20.8 ± 9.8 b | 137.8 ± 41.4 b |
| Sum of the infants’ positive behaviours | NS | NS |
| Sum of the infants’ negative behaviours | p < 0.001 | p < 0.001 |
| Absent (n = 21) | 16.8 ± 9.9 b | 118.6 ± 67.7 b |
| Present (n = 27) | 12.9 ± 6.2 ab | 91.1 ± 43.4 ab |
| Frequent (n = 53) | 11.2 ± 6.6 a | 78.0 ± 42.8 a |
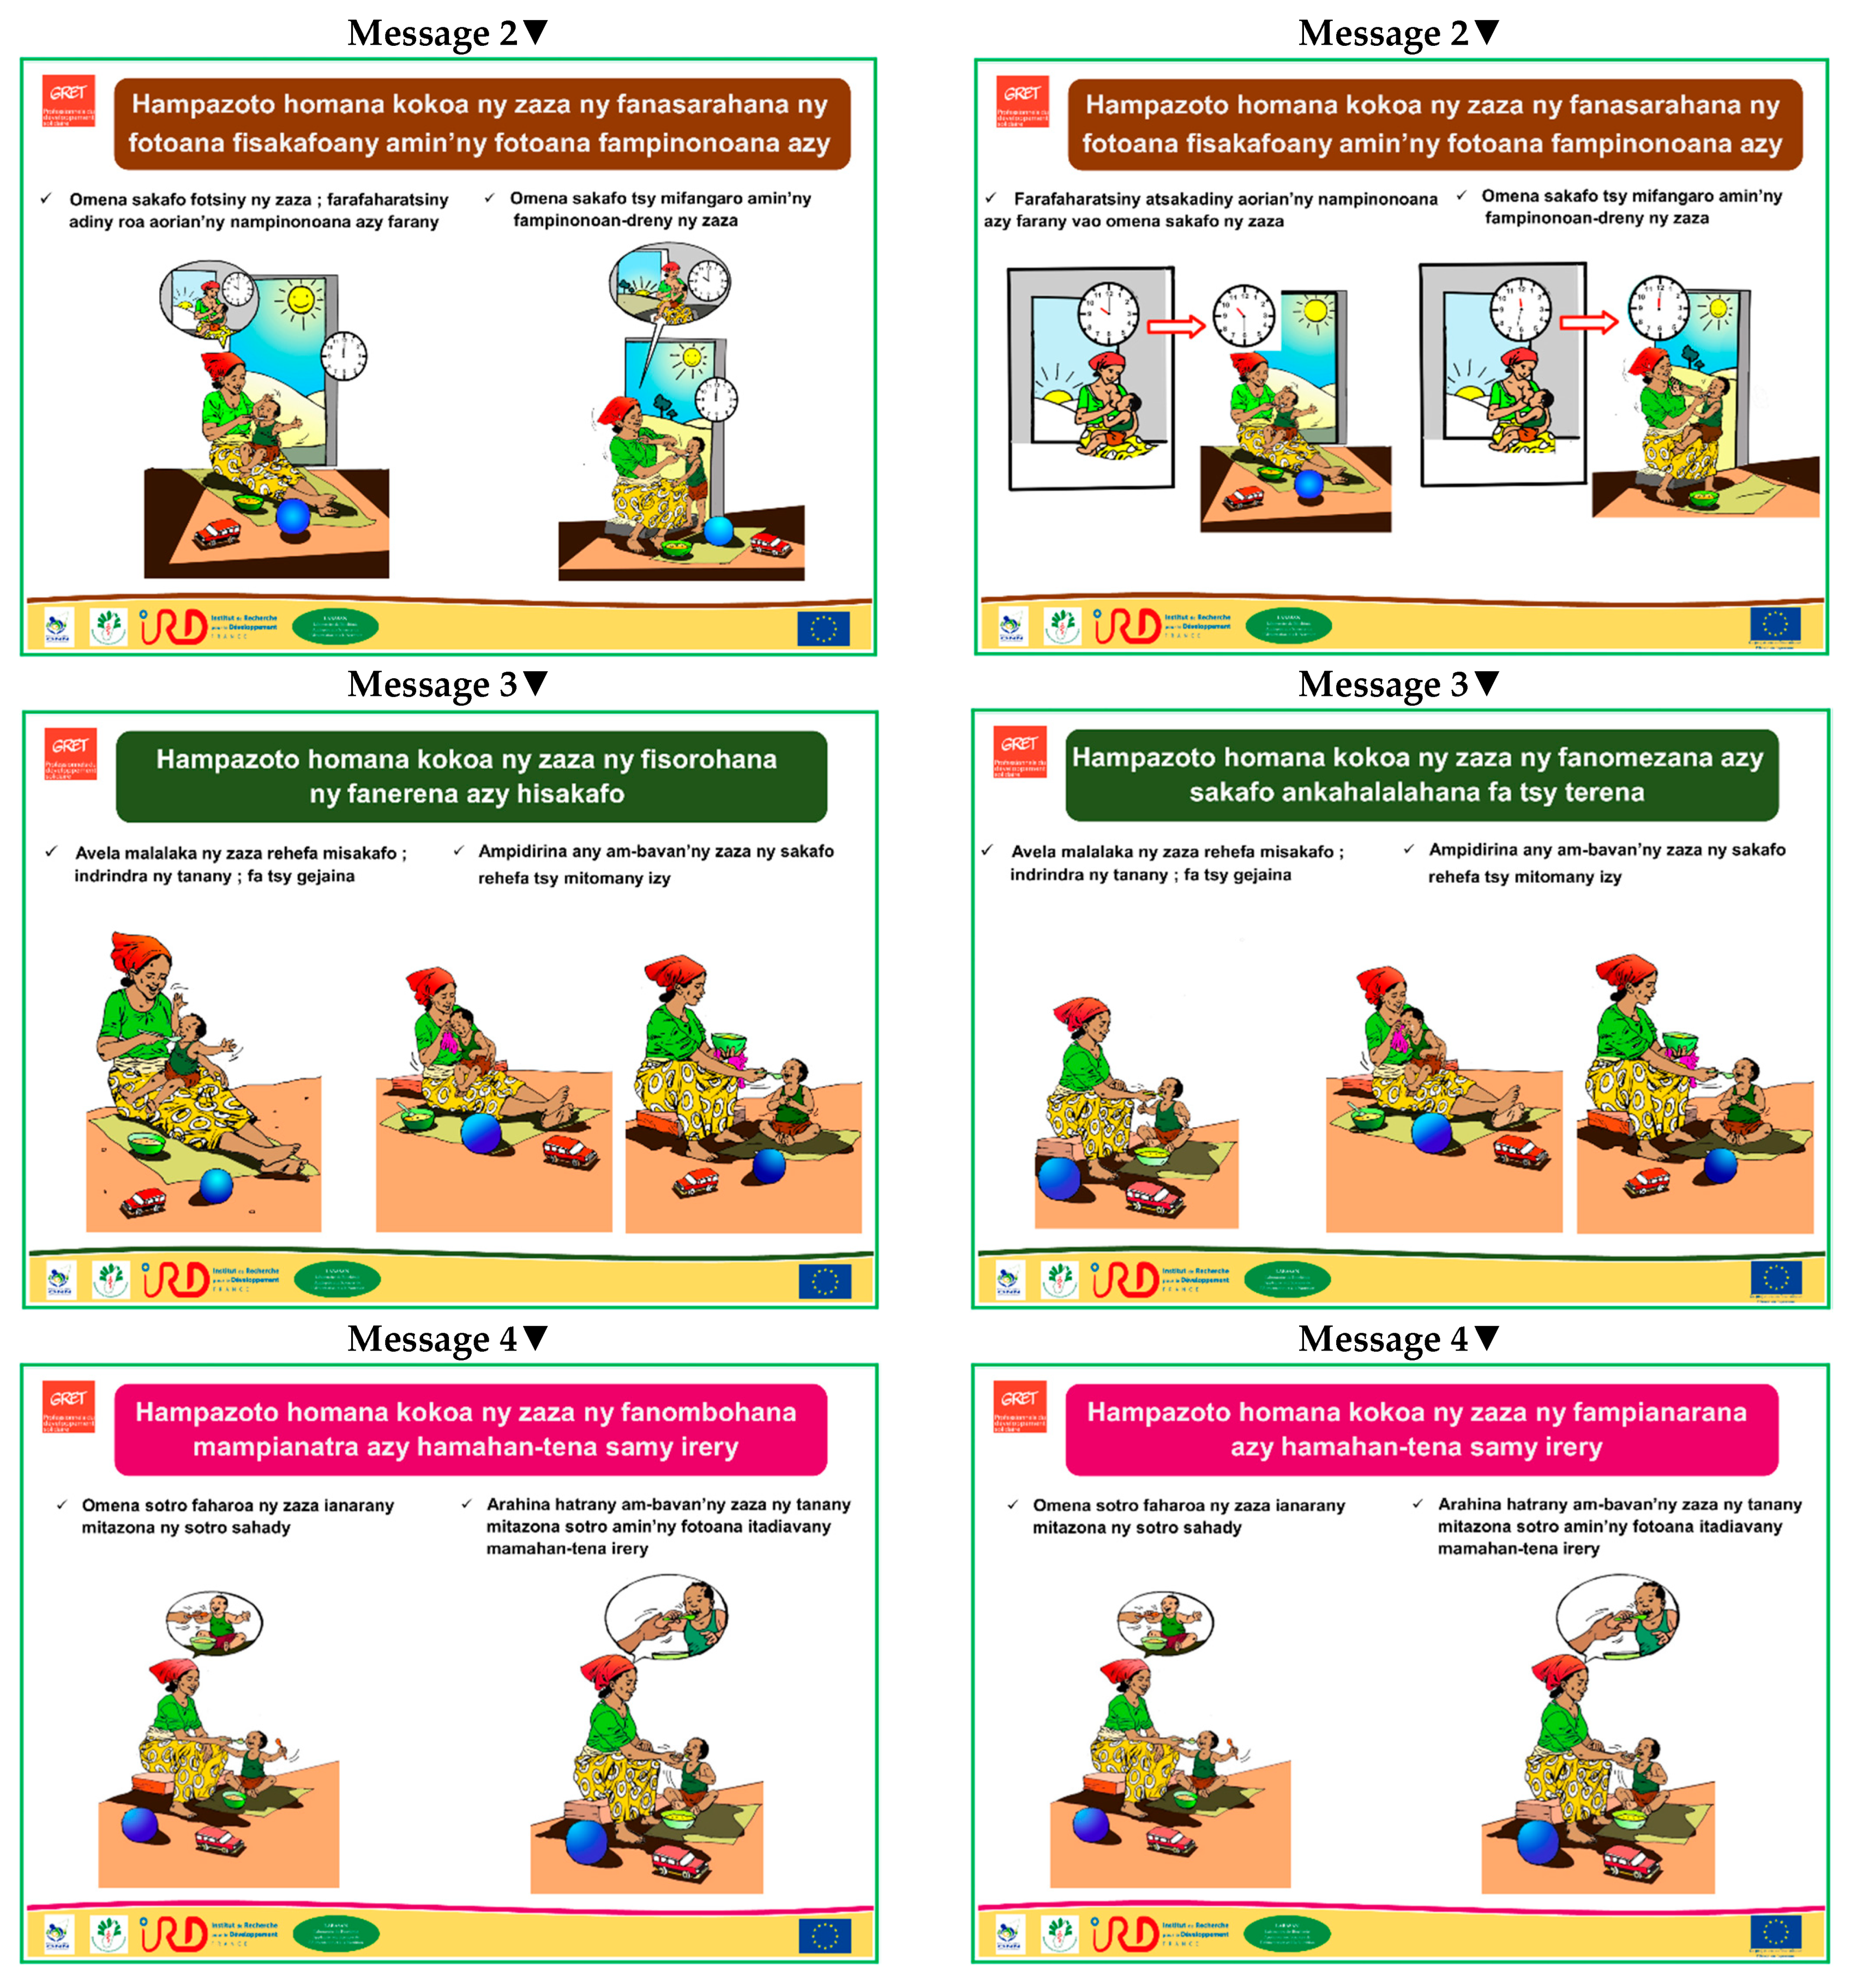
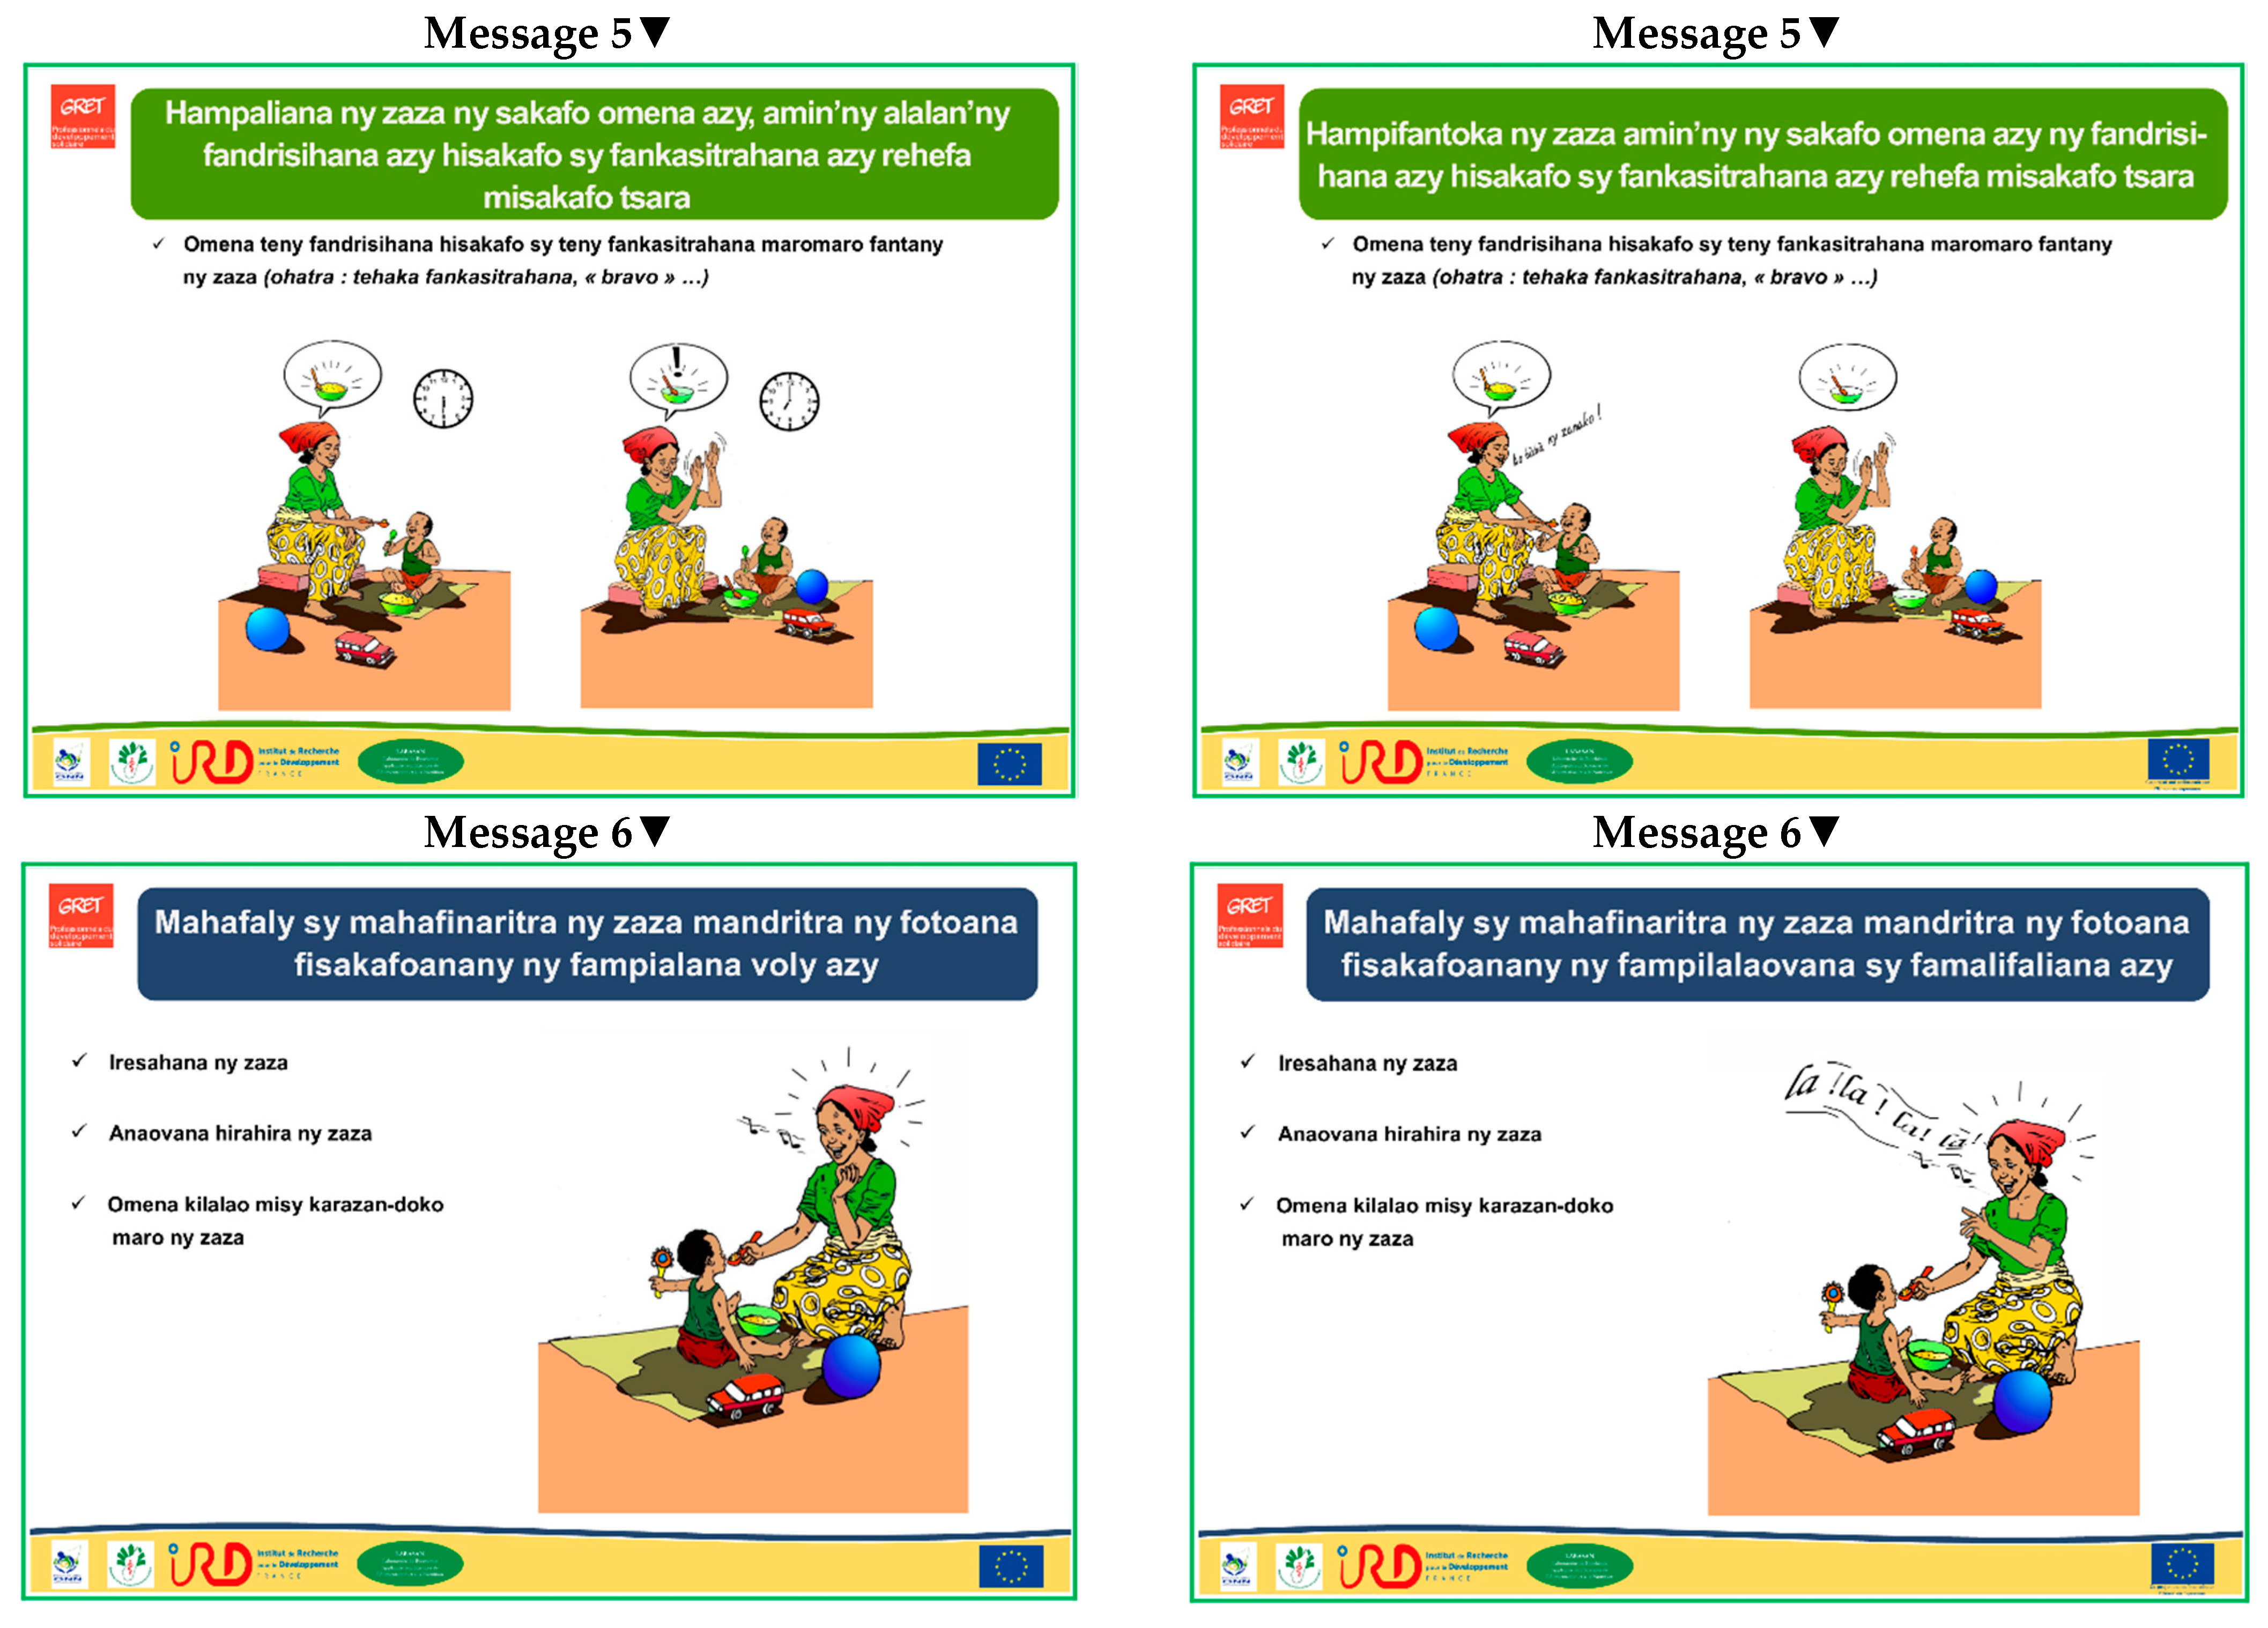
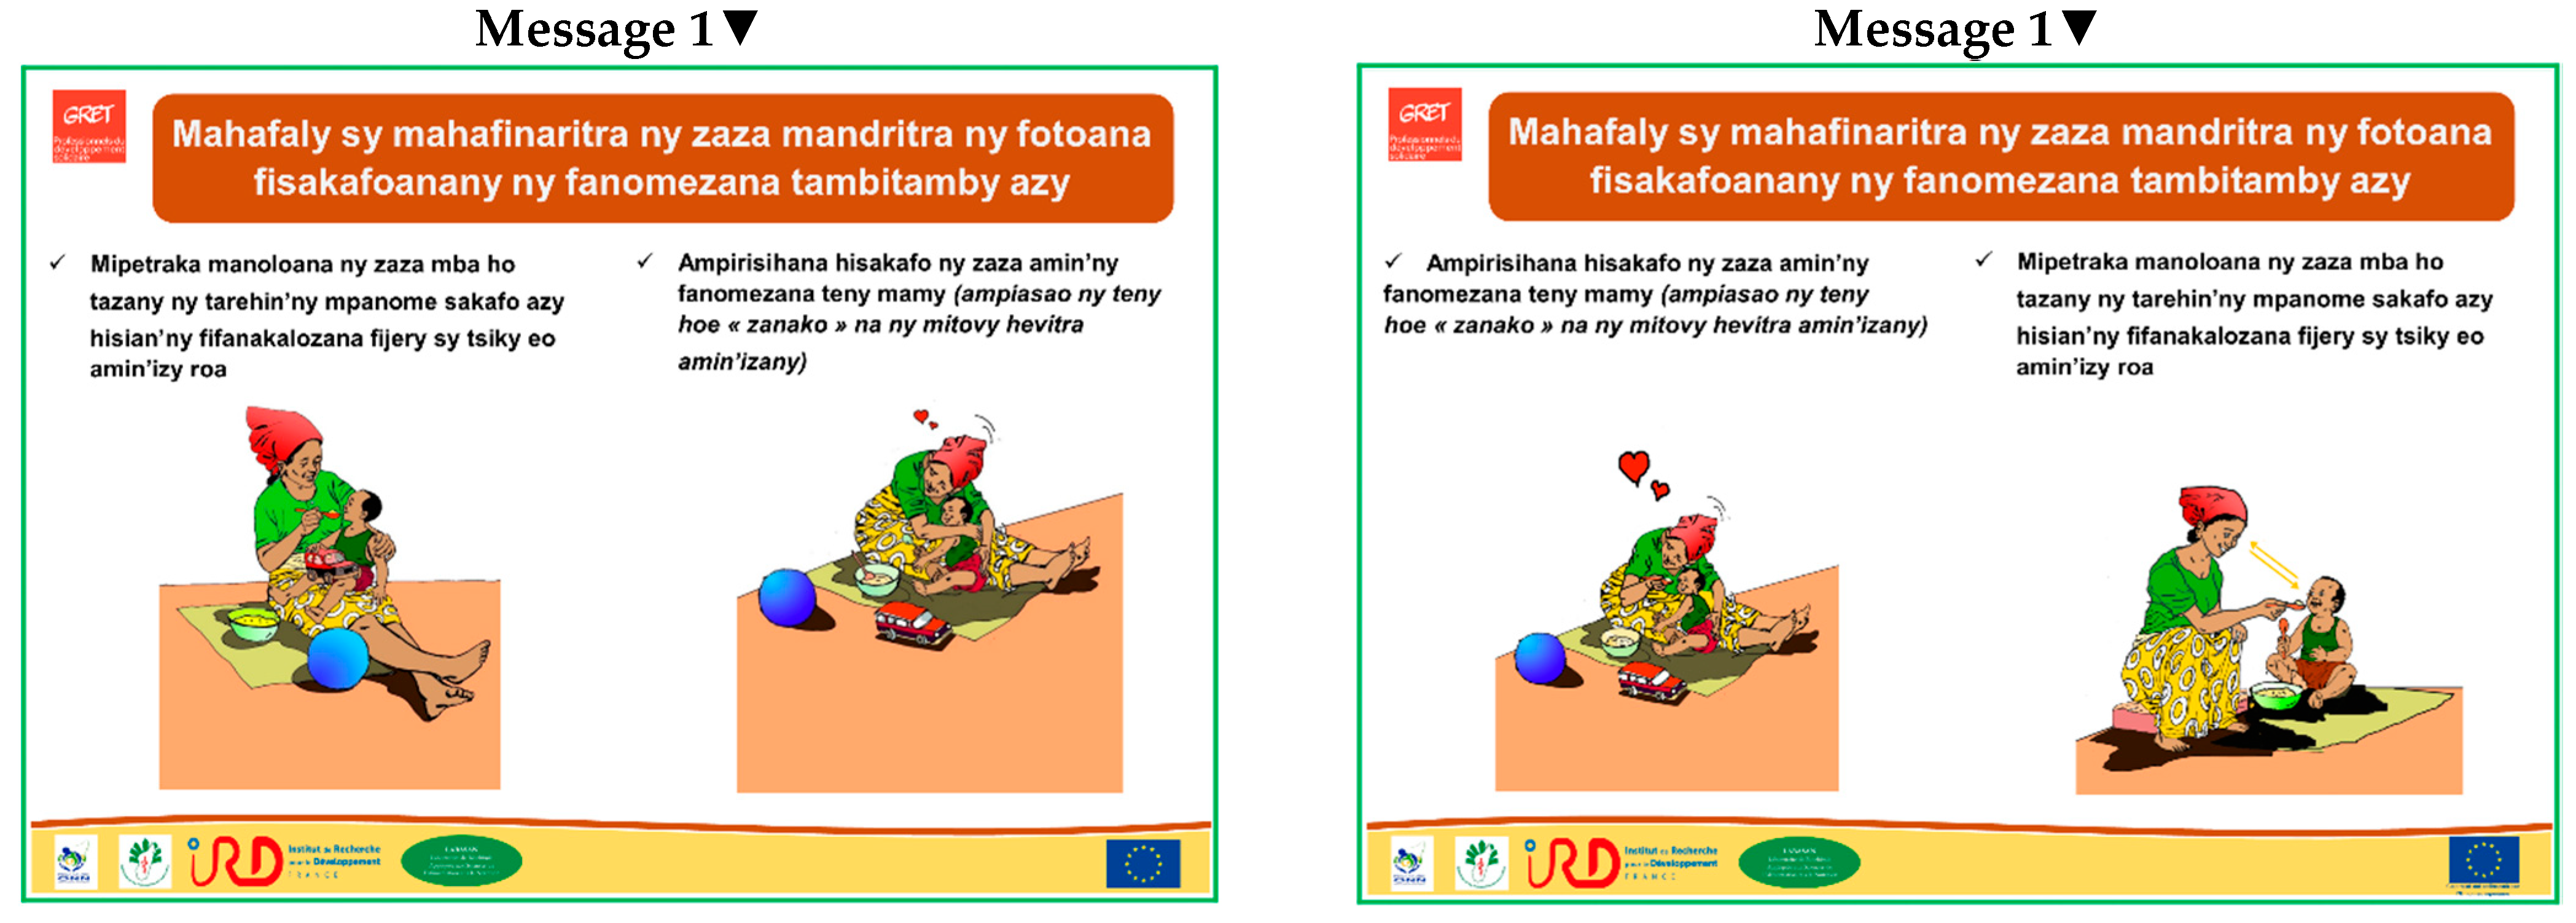
| Key Message | Examples of Recommended Practices |
|---|---|
| Key message 1 To allow the child to enjoy the time spent eating, make the mealtime a time for tender exchanges | Example 1: Turn your face towards the child during meals to allow the child to see your face, to promote eye-to-eye contact and smile exchanges. |
| Example 2: Encourage the child to eat with tender words (use the word “my baby” or equivalent). | |
| Key message 2 To increase the child’s appetite during meals, separate the moments of breastfeeding and feeding | Example 1: Wait for a while after breastfeeding before offering complementary food to your child. |
| Example 2: Breastfeed the child outside the mealtime. | |
| Key message 3 To increase the child’s appetite, avoid force-feeding | Example 1: Leave the child’s arms free when feeding. |
| Example 2: Only put food in the child’s mouth when the child agrees to eat, avoid putting food in the mouth of a crying child. | |
| Key message 4 To increase the child’s appetite, encourage self-feeding | Example 1: Give the child a second spoon during the meal so that the child can try to use it. |
| Example 2: Help the child to hold the spoon and guide the child’s hand to the mouth when the child tries eating alone. | |
| Key message 5 To increase the child’s interest in food, praise your child when eating well and encourage your child when not eating well | Example 1: Use words or signs of congratulation well-known by the child (bravo, hand clapping, etc.). |
| Key message 6 To allow the child to enjoy the meal, grab your child’s attention and distract your child | Example 1: Talk to your child. |
| Example 2: Sing a song known by the child. | |
| Example 3: Give to your child a clean colourful toy to handle. |
| All | Municipality 1 (with Health Centre 2) | Municipality 2 (with Health Centre 2) | Municipality 3 (with Health Centre 1) | ||||||||||
|---|---|---|---|---|---|---|---|---|---|---|---|---|---|
| FG1 | FG2 | FG3 | FG4 | FG5 | FG6 | FG7 | FG8 | FG9 | FG10 | FG11 | FG12 | ||
| Mother | Father | CHW a | OC b | Mother | Father | CHW | OC | Mother | Father | CHW | OC | ||
| (N = 98) | (n = 5) | (n = 4) | (n = 9) | (n = 3) | (n = 10) | (n = 7) | (n = 8) | (n = 10) | (n = 15) | (n = 11) | (n = 7) | (n = 9) | |
| Mean age (years) | 38.6 ± 13.1 | 29.8 ± 5.8 | 32.5 ± 9.0 | 47.7 ± 2.7 | 53.7 ± 10.1 | 24.1 ± 3.9 | 35.4 ± 3.4 | 51.5 ± 10.3 | 49.6 ± 12.2 | 26.2 ± 7.5 | 29.8 ± 4.9 | 45.6 ± 4.5 | 52.7 ± 8.6 |
| Sex (%) | |||||||||||||
| Women | 72 | 100 | - | 0 | 100 | 100 | - | 37 | 100 | 100 | - | 29 | 100 |
| Men | 28 | - | 100 | 100 | - | - | 100 | 63 | - | - | 100 | 71 | - |
| Main activity (%) | |||||||||||||
| Self-employed | 95 | 100 | 75 | 89 | 100 | 100 | 100 | 88 | 90 | 93 | 100 | 100 | 100 |
| Temporary job | 2 | 0 | 25 | 0 | 0 | 0 | 0 | 0 | 10 | 0 | 0 | 0 | 0 |
| No regular income | 3 | 0 | 0 | 11 | 0 | 0 | 0 | 12 | 0 | 7 | 0 | 0 | 0 |
| Permanent job | 0 | 0 | 0 | 0 | 0 | 0 | 0 | 0 | 0 | 0 | 0 | 0 | 0 |
| Education level (%) | |||||||||||||
| No school | 9 | 0 | 50 | 0 | 33 | 0 | 0 | 0 | 0 | 13 | 9 | 0 | 33 |
| Primary school | 38 | 0 | 50 | 67 | 67 | 20 | 0 | 0 | 10 | 80 | 72 | 0 | 56 |
| Secondary school | 50 | 100 | 0 | 22 | 0 | 80 | 72 | 100 | 90 | 7 | 18 | 100 | 11 |
| Higher education | 3 | 0 | 0 | 11 | 0 | 0 | 28 | 0 | 0 | 0 | 0 | 0 | 0 |
Publisher’s Note: MDPI stays neutral with regard to jurisdictional claims in published maps and institutional affiliations. |
© 2022 by the authors. Licensee MDPI, Basel, Switzerland. This article is an open access article distributed under the terms and conditions of the Creative Commons Attribution (CC BY) license (https://creativecommons.org/licenses/by/4.0/).
Share and Cite
Razafindratsima, Y.; Razakandrainy, A.; Fortin, S.; Ralison, C.; Mouquet-Rivier, C. Observation of Traditional Caregiver-Infant Feeding Behaviours and Porridge and Energy Intakes during One Meal to Define Key Messages for Promoting Responsive Feeding in the Amparafaravola District, Rural Madagascar. Nutrients 2022, 14, 361. https://doi.org/10.3390/nu14020361
Razafindratsima Y, Razakandrainy A, Fortin S, Ralison C, Mouquet-Rivier C. Observation of Traditional Caregiver-Infant Feeding Behaviours and Porridge and Energy Intakes during One Meal to Define Key Messages for Promoting Responsive Feeding in the Amparafaravola District, Rural Madagascar. Nutrients. 2022; 14(2):361. https://doi.org/10.3390/nu14020361
Chicago/Turabian StyleRazafindratsima, Yannick, Andrimampionona Razakandrainy, Sonia Fortin, Charlotte Ralison, and Claire Mouquet-Rivier. 2022. "Observation of Traditional Caregiver-Infant Feeding Behaviours and Porridge and Energy Intakes during One Meal to Define Key Messages for Promoting Responsive Feeding in the Amparafaravola District, Rural Madagascar" Nutrients 14, no. 2: 361. https://doi.org/10.3390/nu14020361
APA StyleRazafindratsima, Y., Razakandrainy, A., Fortin, S., Ralison, C., & Mouquet-Rivier, C. (2022). Observation of Traditional Caregiver-Infant Feeding Behaviours and Porridge and Energy Intakes during One Meal to Define Key Messages for Promoting Responsive Feeding in the Amparafaravola District, Rural Madagascar. Nutrients, 14(2), 361. https://doi.org/10.3390/nu14020361