
Weight Change during the Early Phase of Convalescent Rehabilitation after Stroke as a Predictor of Functional Recovery: A Retrospective Cohort Study

 , ,
, ,
Abstract
:1. Introduction
2. Materials and Methods
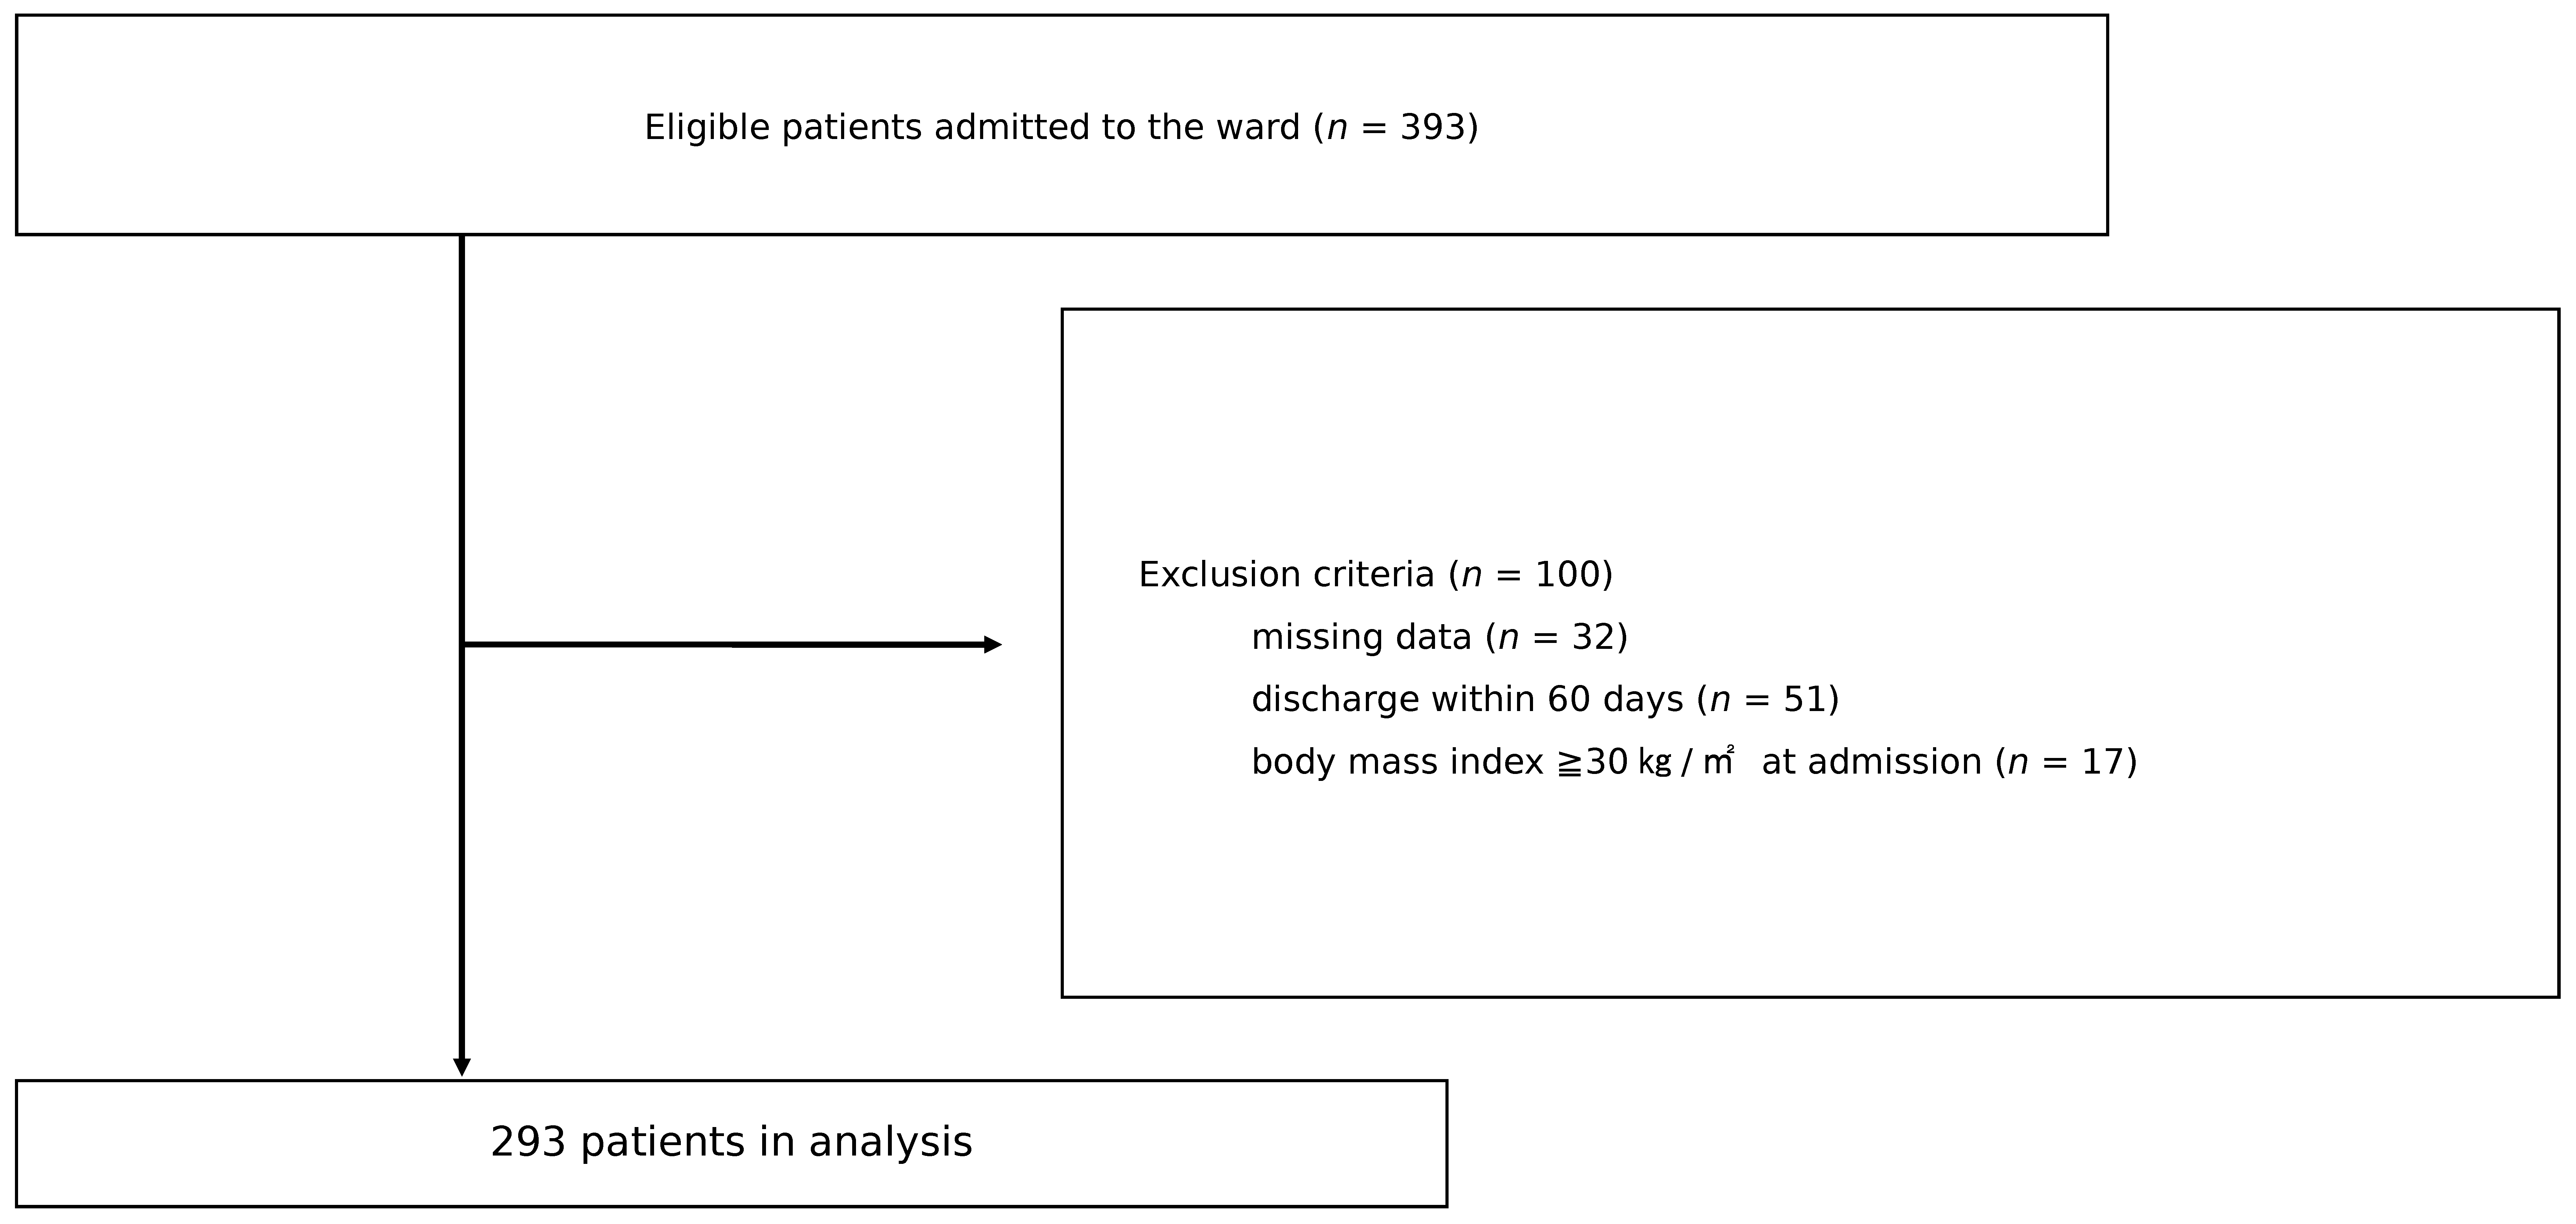
2.1. Participants and Setting
2.2. Cohorting
2.3. Data Collection
2.4. Outcome
2.5. Sample Size Calculation
2.6. Statistical Analysis
3. Results
4. Discussion
5. Conclusions
Author Contributions
Funding
Institutional Review Board Statement
Informed Consent Statement
Data Availability Statement
Conflicts of Interest
References
- Fried, L.P.; Tangen, C.M.; Walston, J.; Newman, A.B.; Hirsch, C.; Gottdiener, J.; Seeman, T.; Tracy, R.; Kop, W.J.; Burke, G.; et al. Frailty in older adults: Evidence for a phenotype. J. Gerontol. A Biol. Sci. Med. Sci. 2001, 56, M146–M156. [Google Scholar] [CrossRef]
- Lorenzi, M.; Bonassi, S.; Lorenzi, T.; Giovannini, S.; Bernabei, R.; Onder, G. A review of telomere length in sarcopenia and frailty. Biogerontology 2018, 19, 209–221. [Google Scholar] [CrossRef]
- Giovannini, S.; Onder, G.; Lattanzio, F.; Bustacchini, S.; Stefano, G.D.; Moresi, S.; Russo, A.; Bernabei, R.; Landi, F. Selenium Concentrations and Mortality Among Community-Dwelling Older Adults: Results from ilSIRENTE Study. J. Nutr. Health Aging 2018, 22, 608–612. [Google Scholar] [CrossRef]
- Giovannini, S.; Onder, G.; Leeuwenburgh, C.; Carter, C.; Marzetti, E.; Russo, A.; Capoluongo, E.; Pahor, M.; Bernabei, R.; Landi, F. Myeloperoxidase levels and mortality in frail community-living elderly individuals. J. Gerontol. A Biol. Sci. Med. Sci. 2010, 65, 369–376. [Google Scholar] [CrossRef] [PubMed] [Green Version]
- Gugganig, R.; Aeschbacher, S.; Leong, D.P.; Meyre, P.; Blum, S.; Coslovsky, M.; Beer, J.H.; Moschovitis, G.; Müller, D.; Anker, D.; et al. Frailty to predict unplanned hospitalization, stroke, bleeding, and death in atrial fibrillation. Eur. Heart J. Qual. Care Clin. Outcomes 2021, 25, 42–51. [Google Scholar] [CrossRef] [PubMed]
- Ensrud, K.E.; Ewing, S.K.; Taylor, B.C.; Fink, H.A.; Cawthon, P.M.; Stone, K.L.; Hillier, T.A.; Cauley, J.A.; Hochberg, M.C.; Rodondi, N.; et al. Comparison of 2 frailty indexes for prediction of falls, disability, fractures, and death in older women. Arch. Intern. Med. 2008, 168, 382–389. [Google Scholar] [CrossRef] [PubMed] [Green Version]
- Miyai, I.; Sonoda, S.; Nagai, S.; Takayama, Y.; Inoue, Y.; Kakehi, A.; Kurihara, M.; Ishikawa, M. Results of new policies for inpatient rehabilitation coverage in Japan. Neurorehabil. Neural Rep. 2011, 25, 540–547. [Google Scholar] [CrossRef] [PubMed]
- Wakabayashi, H.; Sakuma, K. Rehabilitation nutrition for sarcopenia with disability: A combination of both rehabilitation and nutrition care management. J. Cachexia Sarcopenia Muscle. 2014, 5, 269–277. [Google Scholar] [CrossRef]
- Nishioka, S.; Wakabayashi, H.; Kayashita, J.; Taketani, Y.; Momosaki, R. Predictive validity of the Mini Nutritional Assessment Short-Form for rehabilitation patients: A retrospective analysis of the Japan Rehabilitation Nutrition Database. J. Hum. Nutr. Diet. 2021, 34, 881–889. [Google Scholar] [CrossRef]
- Yoshimura, Y.; Wakabayashi, H.; Bise, T.; Nagano, F.; Shimazu, S.; Shiraishi, A.; Yamaga, M.; Koga, H. Sarcopenia is associated with worse recovery of physical function and dysphagia and a lower rate of home discharge in Japanese hospitalized adults undergoing convalescent rehabilitation. Nutrition 2019, 61, 111–118. [Google Scholar] [CrossRef]
- Nishioka, S.; Wakabayashi, H.; Nishioka, E.; Yoshida, T.; Mori, N.; Watanabe, R. Nutritional improvement correlates with recovery of activities of daily living among malnourished elderly stroke patients in the convalescent stage: A cross-sectional study. J. Acad. Nutr. Diet. 2016, 116, 837–843. [Google Scholar] [CrossRef]
- Nii, M.; Maeda, K.; Wakabayashi, H.; Tanaka, A. Nutritional improvement and energy intake are associated with functional recovery in patients after cerebrovascular disorders. J. Stroke Cerebrovasc. Dis. 2016, 25, 57–62. [Google Scholar] [CrossRef]
- Kishimoto, H.; Yozu, A.; Kohno, Y.; Oose, H. Nutritional improvement is associated with better functional outcome in stroke rehabilitation: A cross-sectional study using controlling nutritional status. J. Rehabil. Med. 2020, 52, jrm00029. [Google Scholar] [CrossRef] [Green Version]
- Rubenstein, L.Z.; Harker, J.O.; Salvà, A.; Guigoz, Y.; Vellas, B. Screening for undernutrition in geriatric practice: Developing the short- form mini-nutritional assessment (MNA- SF). J. Gerontol. A Biol. Sci. Med. Sci. 2001, 56, M366–M372. [Google Scholar] [CrossRef] [PubMed] [Green Version]
- Cereda, E.; Vanotti, A. The new Geriatric Nutritional Risk Index is a good predictor of muscle dysfunction in institutionalized older patients. Clin. Nutr. 2007, 26, 78–83. [Google Scholar] [CrossRef] [PubMed]
- Ignacio de Ulíbarri, J.; González-Madroño, A.; de Villar, N.G. CONUT: A tool for controlling nutritional status. First validation in a hospital population. Nutr. Hosp. 2005, 20, 38–45. [Google Scholar]
- Cederholm, T.; Jensen, G.L.; Correia, M.I.T.D.; Gonzalez, M.C.; Fukushima, R.; Higashiguchi, T.; Baptista, G.; Barazzoni, R.; Blaauw, R.; Coats, A.J.; et al. GLIM criteria for the diagnosis of malnutrition - A consensus report from the global clinical nutrition community. Clin. Nutr. 2019, 38, 1–9. [Google Scholar] [CrossRef] [PubMed] [Green Version]
- Kondrup, J.; Allison, S.P.; Elia, M.; Vellas, B.; Plauth, M. Educational and Clinical Practice Committee, European Society of Parenteral and Enteral Nutrition (ESPEN). ESPEN guidelines for nutrition screening 2002. Clin. Nutr. 2003, 22, 415–421. [Google Scholar] [CrossRef]
- Stratton, R.J.; Hackston, A.; Longmore, D.; Dixon, R.; Price, S.; Stroud, M.; King, C.; Elia, M. Malnutrition in hospital outpatients and inpatients: Prevalence, concurrent validity and ease of use of the ’malnutrition universal screening tool’ (’MUST’) for adults. Br. J. Nutr. 2004, 92, 799–808. [Google Scholar] [CrossRef]
- Detsky, A.S.; McLaughlin, J.R.; Baker, J.P.; Johnston, N.; Whittaker, S.; Mendelson, R.A.; Jeejeebhoy, K.N. What is subjective global assessment of nutritional status? J. Parenter. Enter. Nutr. 1987, 11, 8–13. [Google Scholar] [CrossRef] [Green Version]
- Kokura, Y.; Nishioka, S.; Okamoto, T.; Takayama, M.; Miyai, I. Weight gain is associated with improvement in activities of daily living in underweight rehabilitation inpatients: A nationwide survey. Eur. J. Clin. Nutr. 2019, 73, 1601–1604. [Google Scholar] [CrossRef]
- Biscetti, F.; Giovannini, S.; Straface, G.; Bertucci, F.; Angelini, F.; Porreca, C.; Landolfi, R.; Flex, A. RANK/RANKL/OPG pathway: Genetic association with history of ischemic stroke in Italian population. Eur. Rev. Med. Pharmacol. Sci. 2016, 20, 4574–4580. [Google Scholar]
- Krishnamurthi, R.V.; Feigin, V.L.; Forouzanfar, M.H.; Mensah, G.; Connor, M.; Bennett, D.; Moran, A.; Sacco, R.L.; Anderson, L.M.; Truelsen, T.; et al. Global and regional burden of first-ever ischaemic and haemorrhagic stroke during 1990–2010: Findings from the Global Burden of Disease Study 2010. Lancet Glob. Health 2013, 1, e259–e281. [Google Scholar] [CrossRef] [Green Version]
- Strazzullo, P.; D‘Elia, L.; Cairella, G.; Garbagnati, F.; Cappuccio, F.P.; Scalfi, L. Excess body weight and incidence of stroke: Meta-analysis of prospective studies with 2 million participants. Stroke 2010, 41, e418–e426. [Google Scholar] [CrossRef] [Green Version]
- Macdonald, S.; Journeay, W.; Uleryk, E. A systematic review of the impact of obesity on stroke inpatient rehabilitation functional outcomes. NeuroRehabilitation 2020, 46, 403–415. [Google Scholar] [CrossRef] [PubMed]
- Umehara, T.; Tanaka, R.; Tsunematsu, M.; Sugihara, K.; Moriuchi, Y.; Yata, K.; Muranaka, K.; Inoue, J.; Kohriyama, T.; Kakehashi, M. Can the Amount of Interventions during the Convalescent Phase Predict the Achievement of Independence in Activities of Daily Living in Patients with Stroke? A Retrospective Cohort Study. J. Stroke Cerebrovasc. Dis. 2018, 27, 2436–2444. [Google Scholar] [CrossRef] [Green Version]
- Yoshimura, Y.; Wakabayashi, H.; Nagano, F.; Bise, T.; Shimazu, S.; Shiraishi, A. Low Hemoglobin Levels are Associated with Sarcopenia, Dysphagia, and Adverse Rehabilitation Outcomes After Stroke. J. Stroke Cerebrovasc. Dis. 2020, 29, 105405. [Google Scholar] [CrossRef]
- Ottenbacher, K.J.; Hsu, Y.; Granger, C.V.; Fiedler, R.C. The reliability of the functional independence measure: A quantitative review. Arch. Phys. Med. Rehabil. 1996, 77, 1226–1232. [Google Scholar] [CrossRef]
- Charlson, M.E.; Pompei, P.; Ales, K.L.; MacKenzie, C.R. A new method of classifying prognostic comorbidity in longitudinal studies: Development and validation. J. Chronic. Dis. 1987, 40, 373–383. [Google Scholar] [CrossRef]
- Harris, J.A.; Benedict, F.G. A Biometric Study of Basal Metabolism in Man; Carnegie Institute of Washington: Washington, DC, USA, 1919. [Google Scholar]
- Faul, F.; Erdfelder, E.; Buchner, A.; Lang, A.G. G*Power 3: Statistical power analyses using G*Power 3.1: Tests for correlation and regression analyses. Behav. Res. Methods 2009, 41, 1149–1160. [Google Scholar] [CrossRef] [Green Version]
- Shimazu, S.; Yoshimura, Y.; Kudo, M.; Nagano, F.; Bise, T.; Shiraishi, A. Frequent and personalized nutritional support leads to improved nutritional status, activities of daily living, and dysphagia after stroke. Nutrition 2021, 83, 111091. [Google Scholar] [CrossRef] [PubMed]
- Nagano, F.; Yoshimura, Y.; Bise, T.; Shimazu, S.; Shiraishi, A. Muscle mass gain is positively associated with functional recovery in patients with sarcopenia after stroke. J. Stroke Cerebrovasc. Dis. 2020, 29, 105017. [Google Scholar] [CrossRef] [PubMed]

| Total (N = 293) | WMG (N = 176) | WL (N = 117) | p Value | ||
|---|---|---|---|---|---|
| Age, years, median [IQR] | 69 [60–78] | 70 [61–79] | 67 [56–76.5] | 0.041 | * |
| Sex: Male, n (%) | 178 (60.8) | 99 (55.6) | 79 (44.4) | 0.067 | † |
| Female, n (%) | 115 (39.2) | 77 (67.0) | 38 (33.0) | ||
| Stroke type | |||||
| Cerebral infarction, n (%) | 151 (51.5) | 85 (56.3) | 66 (43.7) | 0.333 | ‡ |
| Intracerebral hemorrhage, n (%) | 119 (40.6) | 75 (63.0) | 44 (37.0) | ||
| Subarachnoid hemorrhage, n (%) | 23 (7.8) | 16 (69.6) | 7 (30.4) | ||
| Days from onset to admission, d, median [IQR] | 36 [27.5–50] | 38 [30–51.75] | 35 [24–42.5] | 0.007 | * |
| Days from admission to cohorting, d, median [IQR] | 28 [21–35] | 28 [21.75–35] | 28 [21–34] | 0.482 | * |
| Serum albumin level on admission, mg/dL, median [IQR] | 3.9 [3.5–4.2] | 3.85 [3.4–4.2] | 4.1 [3.7–4.3] | 0.001 | * |
| Serum creatinine level on admission, mg/dL, median [IQR] | 0.7 [0.6–0.9] | 0.7 [0.6–0.9] | 0.7 [0.6–0.9] | 0.321 | * |
| CCI, median, [IQR] | 2 [2–3] | 2 [2–3] | 2 [2–3] | 0.969 | * |
| BMI at admission, kg/m2, mean (SD) | 22.1 ± 3.1 | 21.4 ± 3.0 | 23.0 ± 2.9 | <0.001 | § |
| Low BMI at admission (GLIM criteria for Asians) | |||||
| Yes, n, (%) | 50 (17.1) | 40 (22.7) | 10 (8.5) | 0.001 | † |
| No, n, (%) | 243 (82.9) | 136 (77.3) | 107 (91.5) | ||
| BMI at discharge, kg/m2, mean (SD) | 21.7 ± 2.7 | 21.6 ± 2.8 | 21.8 ± 2.6 | 0.587 | § |
| Energy intake, kcal/kg BW/day, mean (SD) | 26.5 ± 5.8 | 28.0 ± 5.8 | 24.2 ± 5.8 | <0.001 | § |
| Protein intake, g/kg BW/day, median [IQR] | 1.12 [0.97–1.28] | 1.19 [1.05–1.36] | 1.05 [0.92–1.17] | <0.001 | * |
| Energy intake/Basal energy expenditure, median [IQR] | 1.26 [1.11–1.38] | 1.30 [1.18–1.41] | 1.16 [1.00–1.30] | <0.001 | * |
| Rehabilitation therapy, min/day, median [IQR] | 137 [120–147] | 137 [118–148] | 137 [121–146] | 0.402 | * |
| FIM score on admission, median [IQR] | |||||
| Total FIM | 73 [49–96.5] | 70 [45–92] | 78 [53–101] | 0.088 | * |
| Motor FIM | 49 [28–68.5] | 46 [26.25–65] | 55 [35–71] | 0.073 | * |
| Cognitive FIM | 24 [17–30.5] | 24 [16–30] | 24 [17–31] | 0.342 | * |
| Length of hospital stay, days, median [IQR] | 124 [96–158] | 130.5 [100–155.75] | 120 [92.5–166.5] | 0.626 | * |
| FIM gain, median [IQR] | 24 [15–37] | 25.5 [15–38] | 23 [15–36] | 0.298 | * |
| Motor FIM gain, median [IQR] | 20 [11–30.5] | 21 [12–31] | 19 [10–27.5] | 0.232 | * |
| Factor | Standardized Coefficient | p-Value | VIF |
|---|---|---|---|
| Age | −0.125 | 0.037 | 1.526 |
| Sex | 0.031 | 0.590 | 1.449 |
| Stroke type | 0.009 | 0.878 | 1.305 |
| Days from onset | −0.212 | <0.001 | 1.449 |
| BMI | 0.133 | 0.011 | 1.142 |
| Serum albumin level on admission, mg/dL | 0.059 | 0.360 | 1.779 |
| Serum creatinine level on admission, mg/dL | −0.027 | 0.638 | 1.417 |
| Motor FIM at admission | −0.489 | <0.001 | 2.317 |
| CCI | −0.126 | 0.019 | 1.217 |
| Dysphagia | −0.166 | 0.006 | 1.552 |
| Length of stay | 0.208 | <0.001 | 1.404 |
| Rehabilitation therapy, min/day | 0.082 | 0.119 | 1.181 |
| WMG | 0.106 | 0.043 | 1.156 |
| Factor | Standardized Coefficient | p-Value | VIF |
|---|---|---|---|
| Age | −0.197 | 0.003 | 1.869 |
| Sex | 0.018 | 0.756 | 1.442 |
| Stroke type | 0.008 | 0.885 | 1.305 |
| Days from onset | −0.208 | 0.000 | 1.431 |
| BMI | 0.170 | 0.002 | 1.284 |
| Serum albumin level on admission, mg/dL | 0.037 | 0.559 | 1.747 |
| Serum creatinine level on admission, mg/dL | −0.021 | 0.715 | 1.414 |
| motor FIM at admission | −0.521 | <0.001 | 2.374 |
| CCI | −0.121 | 0.024 | 1.220 |
| Dysphagia | −0.142 | 0.021 | 1.614 |
| Length of stay | 0.194 | <0.001 | 1.420 |
| Rehabilitation therapy, min/day | 0.072 | 0.168 | 1.190 |
| EI/BEE | 0.169 | 0.005 | 1.529 |
Publisher’s Note: MDPI stays neutral with regard to jurisdictional claims in published maps and institutional affiliations. |
© 2022 by the authors. Licensee MDPI, Basel, Switzerland. This article is an open access article distributed under the terms and conditions of the Creative Commons Attribution (CC BY) license (https://creativecommons.org/licenses/by/4.0/).
Share and Cite
Kishimoto, H.; Nemoto, Y.; Maezawa, T.; Takahashi, K.; Koseki, K.; Ishibashi, K.; Tanamachi, H.; Kobayashi, N.; Kohno, Y. Weight Change during the Early Phase of Convalescent Rehabilitation after Stroke as a Predictor of Functional Recovery: A Retrospective Cohort Study. Nutrients 2022, 14, 264. https://doi.org/10.3390/nu14020264
Kishimoto H, Nemoto Y, Maezawa T, Takahashi K, Koseki K, Ishibashi K, Tanamachi H, Kobayashi N, Kohno Y. Weight Change during the Early Phase of Convalescent Rehabilitation after Stroke as a Predictor of Functional Recovery: A Retrospective Cohort Study. Nutrients. 2022; 14(2):264. https://doi.org/10.3390/nu14020264
Chicago/Turabian StyleKishimoto, Hiroshi, Yuka Nemoto, Takayuki Maezawa, Kazushi Takahashi, Kazunori Koseki, Kiyoshige Ishibashi, Hanako Tanamachi, Naoki Kobayashi, and Yutaka Kohno. 2022. "Weight Change during the Early Phase of Convalescent Rehabilitation after Stroke as a Predictor of Functional Recovery: A Retrospective Cohort Study" Nutrients 14, no. 2: 264. https://doi.org/10.3390/nu14020264
APA StyleKishimoto, H., Nemoto, Y., Maezawa, T., Takahashi, K., Koseki, K., Ishibashi, K., Tanamachi, H., Kobayashi, N., & Kohno, Y. (2022). Weight Change during the Early Phase of Convalescent Rehabilitation after Stroke as a Predictor of Functional Recovery: A Retrospective Cohort Study. Nutrients, 14(2), 264. https://doi.org/10.3390/nu14020264