Article

External Validation of Equations to Estimate Resting Energy Expenditure in Critically Ill Children and Adolescents with and without Malnutrition: A Cross-Sectional Study

by
George Briassoulis
1,2,*,
Efrossini Briassouli
3,
Stavroula Ilia
1,2 and
Panagiotis Briassoulis
1,4
1
Pediatric Intensive Care Unit, University Hospital, School of Medicine, University of Crete, 71110 Heraklion, Greece
2
Postgraduate Program “Emergency and Intensive Care in Children Adolescents and Young Adults”, School of Medicine, University of Crete, 71003 Heraklion, Greece
3
Infectious Diseases Department “MAKKA”, First Department of Paediatrics, “Aghia Sophia” Children’s Hospital, National and Kapodistrian University of Athens, 11527 Athens, Greece
4
Attikon University Hospital, School of Medicine, National and Kapodistrian University of Athens, 12462 Athens, Greece
*
Author to whom correspondence should be addressed.
Nutrients 2022, 14(19), 4149; https://doi.org/10.3390/nu14194149
Submission received: 5 September 2022 / Revised: 27 September 2022 / Accepted: 29 September 2022 / Published: 6 October 2022
(This article belongs to the Special Issue Nutrition and Critical Illness)

Abstract

:
We evaluated the validity of sixteen predictive energy expenditure equations for resting energy expenditure estimation (eREE) against measured resting energy expenditure using indirect calorimetry (REEIC) in 153 critically ill children. Predictive equations were included based on weight, height, sex, and age. The agreement between eREE and REEIC was analyzed using the Bland–Altman method. Precision was defined by the 95% limits of the agreement; differences > ±10% from REEIC were considered clinically unacceptable. The reliability was assessed by the intraclass correlation coefficient (Cronbach’s alpha). The influence of anthropometric, nutritional, and clinical variables on REEIC was also assessed. Thirty (19.6%) of the 153 enrolled patients were malnourished (19.6%), and fifty-four were overweight (10.5%) or obese (24.8%). All patients received sedation and analgesia. Mortality was 3.9%. The calculated eREE either underestimated (median 606, IQR 512; 784 kcal/day) or overestimated (1126.6, 929; 1340 kcal/day) REEIC compared with indirect calorimetry (928.3, 651; 1239 kcal/day). These differences resulted in significant biases of −342 to 592 kcal (95% limits of agreement (precision)−1107 to 1380 kcal/day) and high coefficients of variation (up to 1242%). Although predicted equations exhibited moderate reliability, the clinically acceptable ±10% accuracy rate ranged from only 6.5% to a maximum of 24.2%, with the inaccuracy varying from −31% to +71.5% of the measured patient’s energy needs. REEIC (p = 0.017) and eREE (p < 0.001) were higher in the underweight compared to overweight and obese patients. Apart from a younger age, malnutrition, clinical characteristics, temperature, vasoactive drugs, neuromuscular blockade, and energy intake did not affect REEIC and thereby predictive equations’ accuracy. Commonly used predictive equations for calculating energy needs are inaccurate for individual patients, either underestimating or overestimating REEIC compared with indirect calorimetry. Altogether these findings underscore the urgency for measuring REEIC in clinical situations where accurate knowledge of energy needs is vital.

1. Introduction

Accurate determination of resting energy expenditure (REE) in critically ill patients is vital because underfeeding and overfeeding are both associated with undesirable consequences. Cross-sectional and longitudinal studies have shown that mechanically ventilated children do not increase their metabolic rate during the acute phase of critical illness [1]. This finding supports the hypothesis that growth ceases during the metabolic response to critical illness or injury in children while little or no spontaneous respiratory effort or physical activity has an additional negative effect.
Predictive methods commonly used to estimate resting energy expenditure (eREE) in critically ill children are very imprecise and may lead to over- or underfeeding. Suggested equations for use in healthy children and adolescents are the Harris and Benedict [2], FAO/WHO/UNU [3], Institute for Medicine of the National Academies and Food and Nutrition Board (IOM) [4], and Schofield (height and weight, WHO) [5] equations, and the Henry (Oxford with weight and height) [6], Lawrence (Equation (3)) [7], and Kaneko [8] equations. Among the predictive equations based on age, weight, height, and sex in the pediatric population with overweight or obesity, the Dietz [9], Maffeis [10], Molnár [11], Muller [12], and Lazzer (Equation (1)) [13] equations have been reported [14]. In addition, the Mifflin equation [15] has been recently shown to be an accurate eREE equation in girls and boys without or with obesity [16]. Simplified equations reported for use in mechanically ventilated children [14,17] were the Caldwell–Kennedy equation [18], the White (Equation (2)) [19], and the Meyer (equation-C) [20]. Other equations have been either established for use in specific situations, such as anorexia nervosa or burn injuries, or were using changing indices, such as organ failures or non-standard anthropometric measurements [14]. Still, there are units using the Recommended Dietary Allowances (RDA) [21] for estimating REE in pediatric patients.
Recent nutritional guidelines recommend cautious use of estimating equations and increased surveillance for unintended caloric underfeeding and overfeeding [22]. Instead, REE should be measured by indirect calorimetry whenever possible [23,24]. Indirect calorimetry is a personalized noninvasive method that circumvents many of the problems associated with other modes of REE assessment. Since this method directly measures the conversion of energy to heat, there is no need to apply age-related, population-based data to individual critically ill children. Breath-by-breath indirect calorimeters measure volumetric oxygen consumption (VO2) and carbon dioxide production (VCO2) at 21–85% FiO2 reliably but with bias at 85% FiO2 [25]. We have previously shown that the E-COVX metabolic module connected to a CARESCAPE™ R860 ventilator could reliably record spirometry and metabolic indices as early as 5 min after suctioning using different ventilatory modes in sedated, mechanically ventilated children [26,27].
There are few external cross-validation studies of predictive energy expenditure (eREE) equations in critically ill children or adolescents [23,28,29]. The aim of the present study was to externally cross-validate simplified predictive equations in critically ill children, using online continuous REEIC measurements through indirect calorimetry. A secondary objective was to identify anthropometric, nutritional, or clinical factors that might influence REEIC, further affecting the accuracy of predictive equations in the acute phase of illness or injury.

2. Materials and Methods

2.1. Study Design

Critically ill children admitted to the academic Pediatric Intensive Care Unit (PICU) at the University Hospital, School of Medicine, University of Crete, Heraklion, from September 2014 through September 2018, and mechanically ventilated for ≥3 days were potential candidates to be enrolled in the study. The Ethics Committee of the Institutional Review Board approved the study (approval ID14494/2011/9-1-2012). All data were de-identified, and parents or guardians gave informed written consent. The study was conducted in accordance with the 1975 Declaration of Helsinki, as revised in 2013, following the International Conference on Harmonization (ICH)/Good Clinical Practice (GCP) standards [30].
In reporting this study, we used the STROBE Statement−Checklist for cross-sectional studies. Inclusion criteria: Hemodynamically stable, adequately sedated (Ramsey > 3), mechanically ventilated patients, with a Fractional Inspired Oxygen (FiO2) < 60%, a respiratory rate below 35 breaths-per-minute, and an endotracheal tube (ET) leak below 10% (inspiratory tidal volume (TVi) − expiratory tidal volume (TVe)/inspiratory TV × 100) were eligible for the study. Exclusion criteria: (1) Patients expected to be extubated within 48 h of admission; (2) on renal replacement therapy; (3) metabolic or endocrine disorders; (4) use of drugs known to affect energy expenditure, such as levothyroxine; (5) respiratory quotient (RQ) < 0.67 or > 1.3; and (6) unexpected interruption of the measurement (destabilization, need for intervention in the ventilation settings, or other).

2.2. Clinical Data

At the time of each metabolic measurement, the admission diagnosis, temperature, blood pressure, heart rate, sedation level by Ramsey scale, and main sedatives and vasoactive agents or inotropes were recorded. The last recorded temperature on a patient’s vital signs flowchart just before the REEIC measurement was documented. The severity of illness was assessed using the PRISM-III and the PELOD-2 scores [31], and the amount of care was assessed using the Therapeutic Intervention Scoring System (TISS) [32]. The ventilatory settings at the time of the measurement and the route of nutrition support, and the total calories received for the 24-h period before metabolic measurement were also recorded. Energy intake was calculated from recorded intakes of enteral or parenteral nutrition and glucose-containing maintenance fluids. Underfeeding and overfeeding were defined according to the European Society for Clinical Nutrition and Metabolism (ESPEN) guidelines as intakes of <70% or >110% of REEIC, respectively [33].

2.3. Anthropometry

The following anthropometric parameters were identified: age, sex, actual weight, ideal weight, height, and body mass index (BMI). Weight was measured using calibrated electronic bed scales. Ideal weight was defined as the weight for the 50th percentile of the actual height of each patient. BMI was calculated as kg/m2. Standard deviations scores, known as z-scores, of weight, height, and BMI for sex and age were calculated using WHO and CDC calculators [34]. Malnutrition indices were derived from the BMI for age and sex z scores obtained at admission. Underweight was defined as BMI for sex and age z-score < −1.644, normal weight as −1.644 ≤ BMI z-score < 1.036, overweight as 1.036 ≤ BMI z-score < 1.644, and obesity as BMI z-score ≥ 1.644.

2.4. Indirect Calorimetry

An integrated gas exchange module (E-COVX) into the ventilator (Carescape R860; GE Healthcare, Milwaukee, WI, USA) was used to measure REEIC through indirect calorimetry on PICU day 3 or 4. This module is able to reliably record spirometry and metabolic indices as early as 5 min after suctioning at different modes of ventilation [26,27]. It has no mixing chamber and sampling takes place with every breath. It has a fast differential paramagnetic O2 and infrared CO2 analyzer and a pneumotachograph housed in a connector, which measures inspired and expired volumes. In the P-Lite (15–300 mL) or D-Lite (>300 mL) flow sensor, located proximate to the Y-piece to the patients’ ET tube the flow measurement is based on the pressure drop across a special proprietary turbulent flow restrictor. It uses mathematical integration of flow and time-synchronized continuous gas sampling to provide data. The gas sample is continuously drawn from the connector to the gas analyzer unit of the module. Both O2 and CO2 measures are based on the side-stream principle. The E-COVX relies on tidal volume measurement for VO2 calculation. The pneumotachograph derives the tidal volume from the pressure difference across a fixed orifice, potentially influenced therefore by acute changes of resistance in the spirometry tubing and undetected leaks in the system. We consistently used a heat- and moisture-exchange filter alone, avoiding heated water bath humidification, followed by regular checks on the spirometry tubing and checks for tidal volume consistency between the module and the ventilator.
Measurements were made between 9 am and 12 pm when there had been a minimum of 45 min with no major physical activity, such as physiotherapy or dressing change. After an initial 10-min stabilization period, REEIC was measured for 30 min, during which time there was no interference with the child. The module uses the modified Weir formula (REEIC (kcal/day) = [3.941 × VO2 + 1.106 × VCO2] × 1440 and displays a 5-min average for REEIC but can display the 1-min averages with the S/5 Collect 1.0 software (Datex-Ohmeda, GE Healthcare, USA). Steady state was defined as a period of at least 5 min with less than 10% fluctuation in VO2 and VCO2, and less than 5% fluctuation in respiratory quotient (RQ), which is the ratio of VCO2: VO2. Measurements with RQ outside the physiologic range (>1.3 or <0.67) were excluded.

2.5. Prediction Equations

To avoid unpredictable anthropometric alterations and for logistic reasons, predictive equations were estimated at the same time in the morning, between 9 am–12 pm. The eREE equations for each patient were calculated using actual (or ideal in obese patients) weight using the following equations (Table S1, Supplementary Materials): Harris–Benedict [2], Schofield H-W (WHO) [5], FAO/WHO)/UNU [3], Henry (Oxford) [7], IOM [4], Lawrence (Equation (3)) [7], Kaneko [8], Dietz [9], Maffeis [10], Molnár [11], Muller [12], Mifflin [15], Caldwell–Kennedy [18], Lazzer (Equation (1)) [13], and the PICU-specific White (Equation (2)) [19] and Meyer (Equation (C)) [20]. The accuracy of these equations was defined as prediction values that fell within 90% to 110% of the measured REEIC (±10% accuracy). All other predictions falling outside this range were deemed inaccurate. As a control equation, the age-specific recommended dietary allowances (RDA) for healthy children were simultaneously calculated [21].
Basal metabolism was calculated based on the Schofield equation. The metabolic state for each patient was determined using the ratio of measured REEIC to eREE based on the Schofield equation, as has been previously suggested [35,36,37]. Patients were classified in the following metabolic patterns: normometabolic when REEIC/eREESchofield = 90–110%, hypometabolic when REEIC/eREESchofield < 90%, and hypermetabolic when REEIC/eREESchofiled > 110%.

2.6. Statistical Analysis

The normality of the distribution was assessed using the Shapiro–Wilk test. Descriptive data are reported as means and standard deviation (SD) or median and interquartile range (IQR) in case of skewed distributions, or as frequencies and percentages when appropriate. The accuracy of the eREE compared to REEIC measured by indirect calorimetry was assessed through the calculation of bias and precision. Bias was defined as the mean difference between the measurements obtained from the eREE and REEIC. Precision was defined by the 95% limits of the agreement including both systematic (bias) and random error. The percentage of predicted values of an equation within 10% of REEIC was considered a measure of accuracy on a cohort or sub-cohort level. The relative variability (dispersion) and repeatability were assessed by calculating the coefficient of variation (CV) which is the ratio of the standard deviation to the mean of the population. The reliability was assessed by the intraclass correlation coefficient (ICC), calculated using the two-way mixed (Cronbach’s alpha). ICC was interpreted as follows: below 0.50: poor; between 0.50 and 0.75: moderate; between 0.75 and 0.90: good; above 0.90: excellent [38]. A linear regression model (backward method) was adopted to examine whether any of the recorded anthropometric, clinical, and nutritional variables are independently associated with REEIC. We first used univariate models to test if any of the studied variables were related to REEIC, with just one explanatory variable at a time; afterward, all variables that had shown a relaxed p-value of less than or equal to 0.1 were included in the multivariable models. A two-sided significance level of 0.05 was used for statistical inference. Statistical analysis software (version 28; SPSS, Chicago, IL, USA) was used for all analyses and GraphPad Prism 9.0 (GraphPad Software, Inc., San Diego, CA, USA) was used for the Bland–Altman analyses and illustrations.

3. Results

3.1. Study Population

During the study period, 735 patients were admitted to the PICU, of which 176 were eligible for inclusion. However, 23 patients were not enrolled due to logistical reasons (n = 12), technical reasons (n = 7), or no informed consent (n = 4). Demographic, anthropometric, clinical, and metabolic characteristics are shown in Table 1.
Less than half of the patients (n = 69; 45.1%) had a BMI within the normal range for their sex and age. Thirty (19.6%) patients were underweight (19.6%), and fifty-four were overweight (10.5%) or obese (24.8%). All patients received sedation and analgesia. Mortality was 3.9%. Nutritional support was provided enterally (90.9%) or parenterally (9.1%). Patients’ feeding status on PICU day three revealed that two-thirds of the patients were either underfed (39.8%) or overfed (27.6%). Normal weight patients received targeted nutrition in only 36.7%, while 36.7% were underfed and 26.7% were overfed. In contrast, 55.6% of obese patients were underfed whereas 36% of underweight patients were overfed (Table 1).

3.2. Performance of Predictive Equations

The calculated eREE either underestimated (median 606, IQR 512; 784 kcal/day) or overestimated (1126.6, 929; 1340 kcal/day) REEIC compared with indirect calorimetry (928.3, 651; 1239 kcal/day). Comparison analysis between resting energy expenditure measured by indirect calorimetry and calculations through individual predictive equations are presented in Table 2.
The calculated age and sex-specific RDA, grossly overestimated REEIC )median 1320 (IQR 880; 2365) kcal/day). These differences resulted in significant biases of −342 to 592 kcal (95% limits of agreement (precision) −1107 to 1380 kcal/day). Even predictive equations with small bias (Molnar, Caldwell–Kennedy, Henry (Oxford), Meyer) exhibited extended dispersion of values as visualized by the 95% limits of agreement in the Bland–Altman plots (Figure 1). Compared to indirect calorimetry, old or new equations, irrelevant to the established age, nutrition, race, or illness-related status, presented a large bias and small precision, indicated by the wide 95% limits of agreement in the Bland–Altman plots (Figures S1–S3).
Paired eREE–REEIC differences were significant for most predictive equations (Wilcoxon matched-pairs signed rank test, medians of differences −282 to +627, p < 0.002) except for the Molnar, Caldwell–Kennedy, Henry (Oxford), Meyer equations (−8 to +137, p > 0.05). These equations, however, were also inaccurate, presenting a wide dispersion of values as expressed by a high coefficient of variation (809–1242%), in accordance with their high bias and limits of agreement (Table 2).
The equations’ reliability, as assessed by the ICC, although significant (p < 0.001), varied at moderate levels between 0.51 and 0.74 and was consistent across sub cohorts of obese, overweight, and underweight patients (Cronbach’s alpha, Table 3).
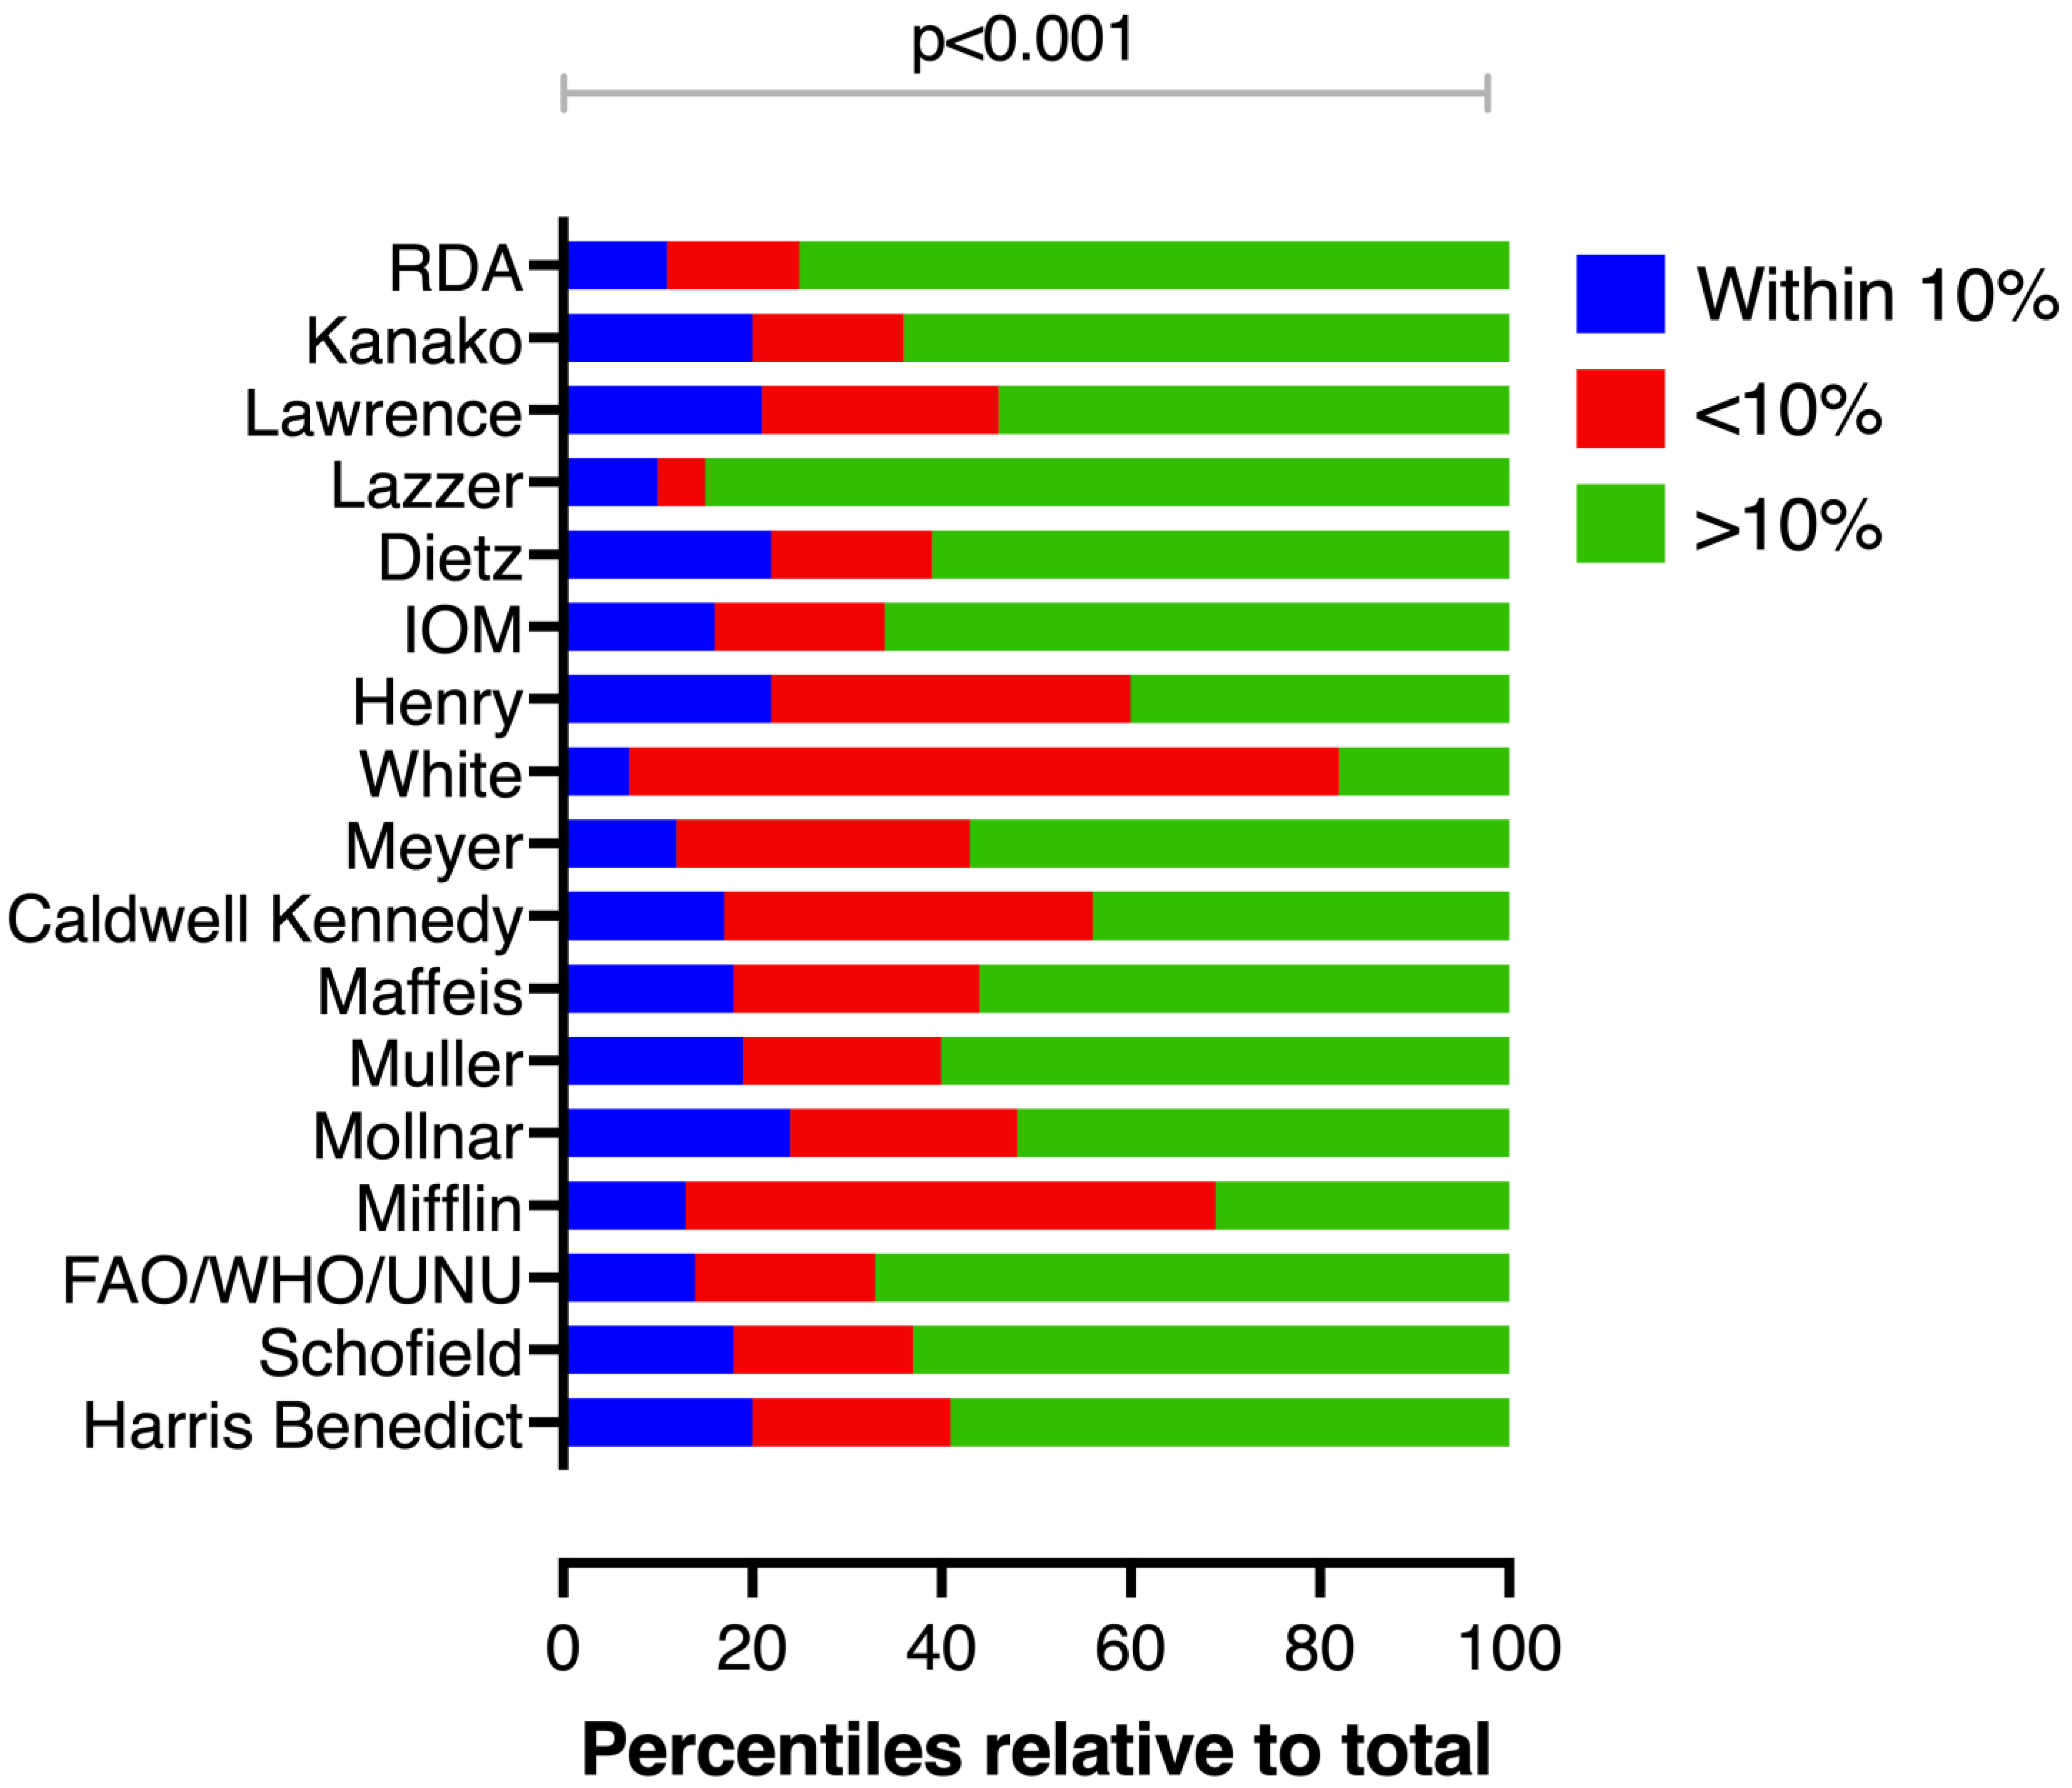
Despite the moderate reliability, the 10% accuracy rate ranged from 6.5% to a maximum of 24.2%, and it was significantly lower than an expected minimum accuracy overall and across nutrition status sub-cohorts (Table 3). Inaccuracy profile varied from underestimation (White, median −31%, IQR −44%; −9.5%) to overestimation (Lazzer, median 71.5%, IQR 28.6%; 138%) of the patient’s energy needs (p < 0.001) (Figure 2).

3.3. Malnutrition and Factors Independently Associated with REEIC

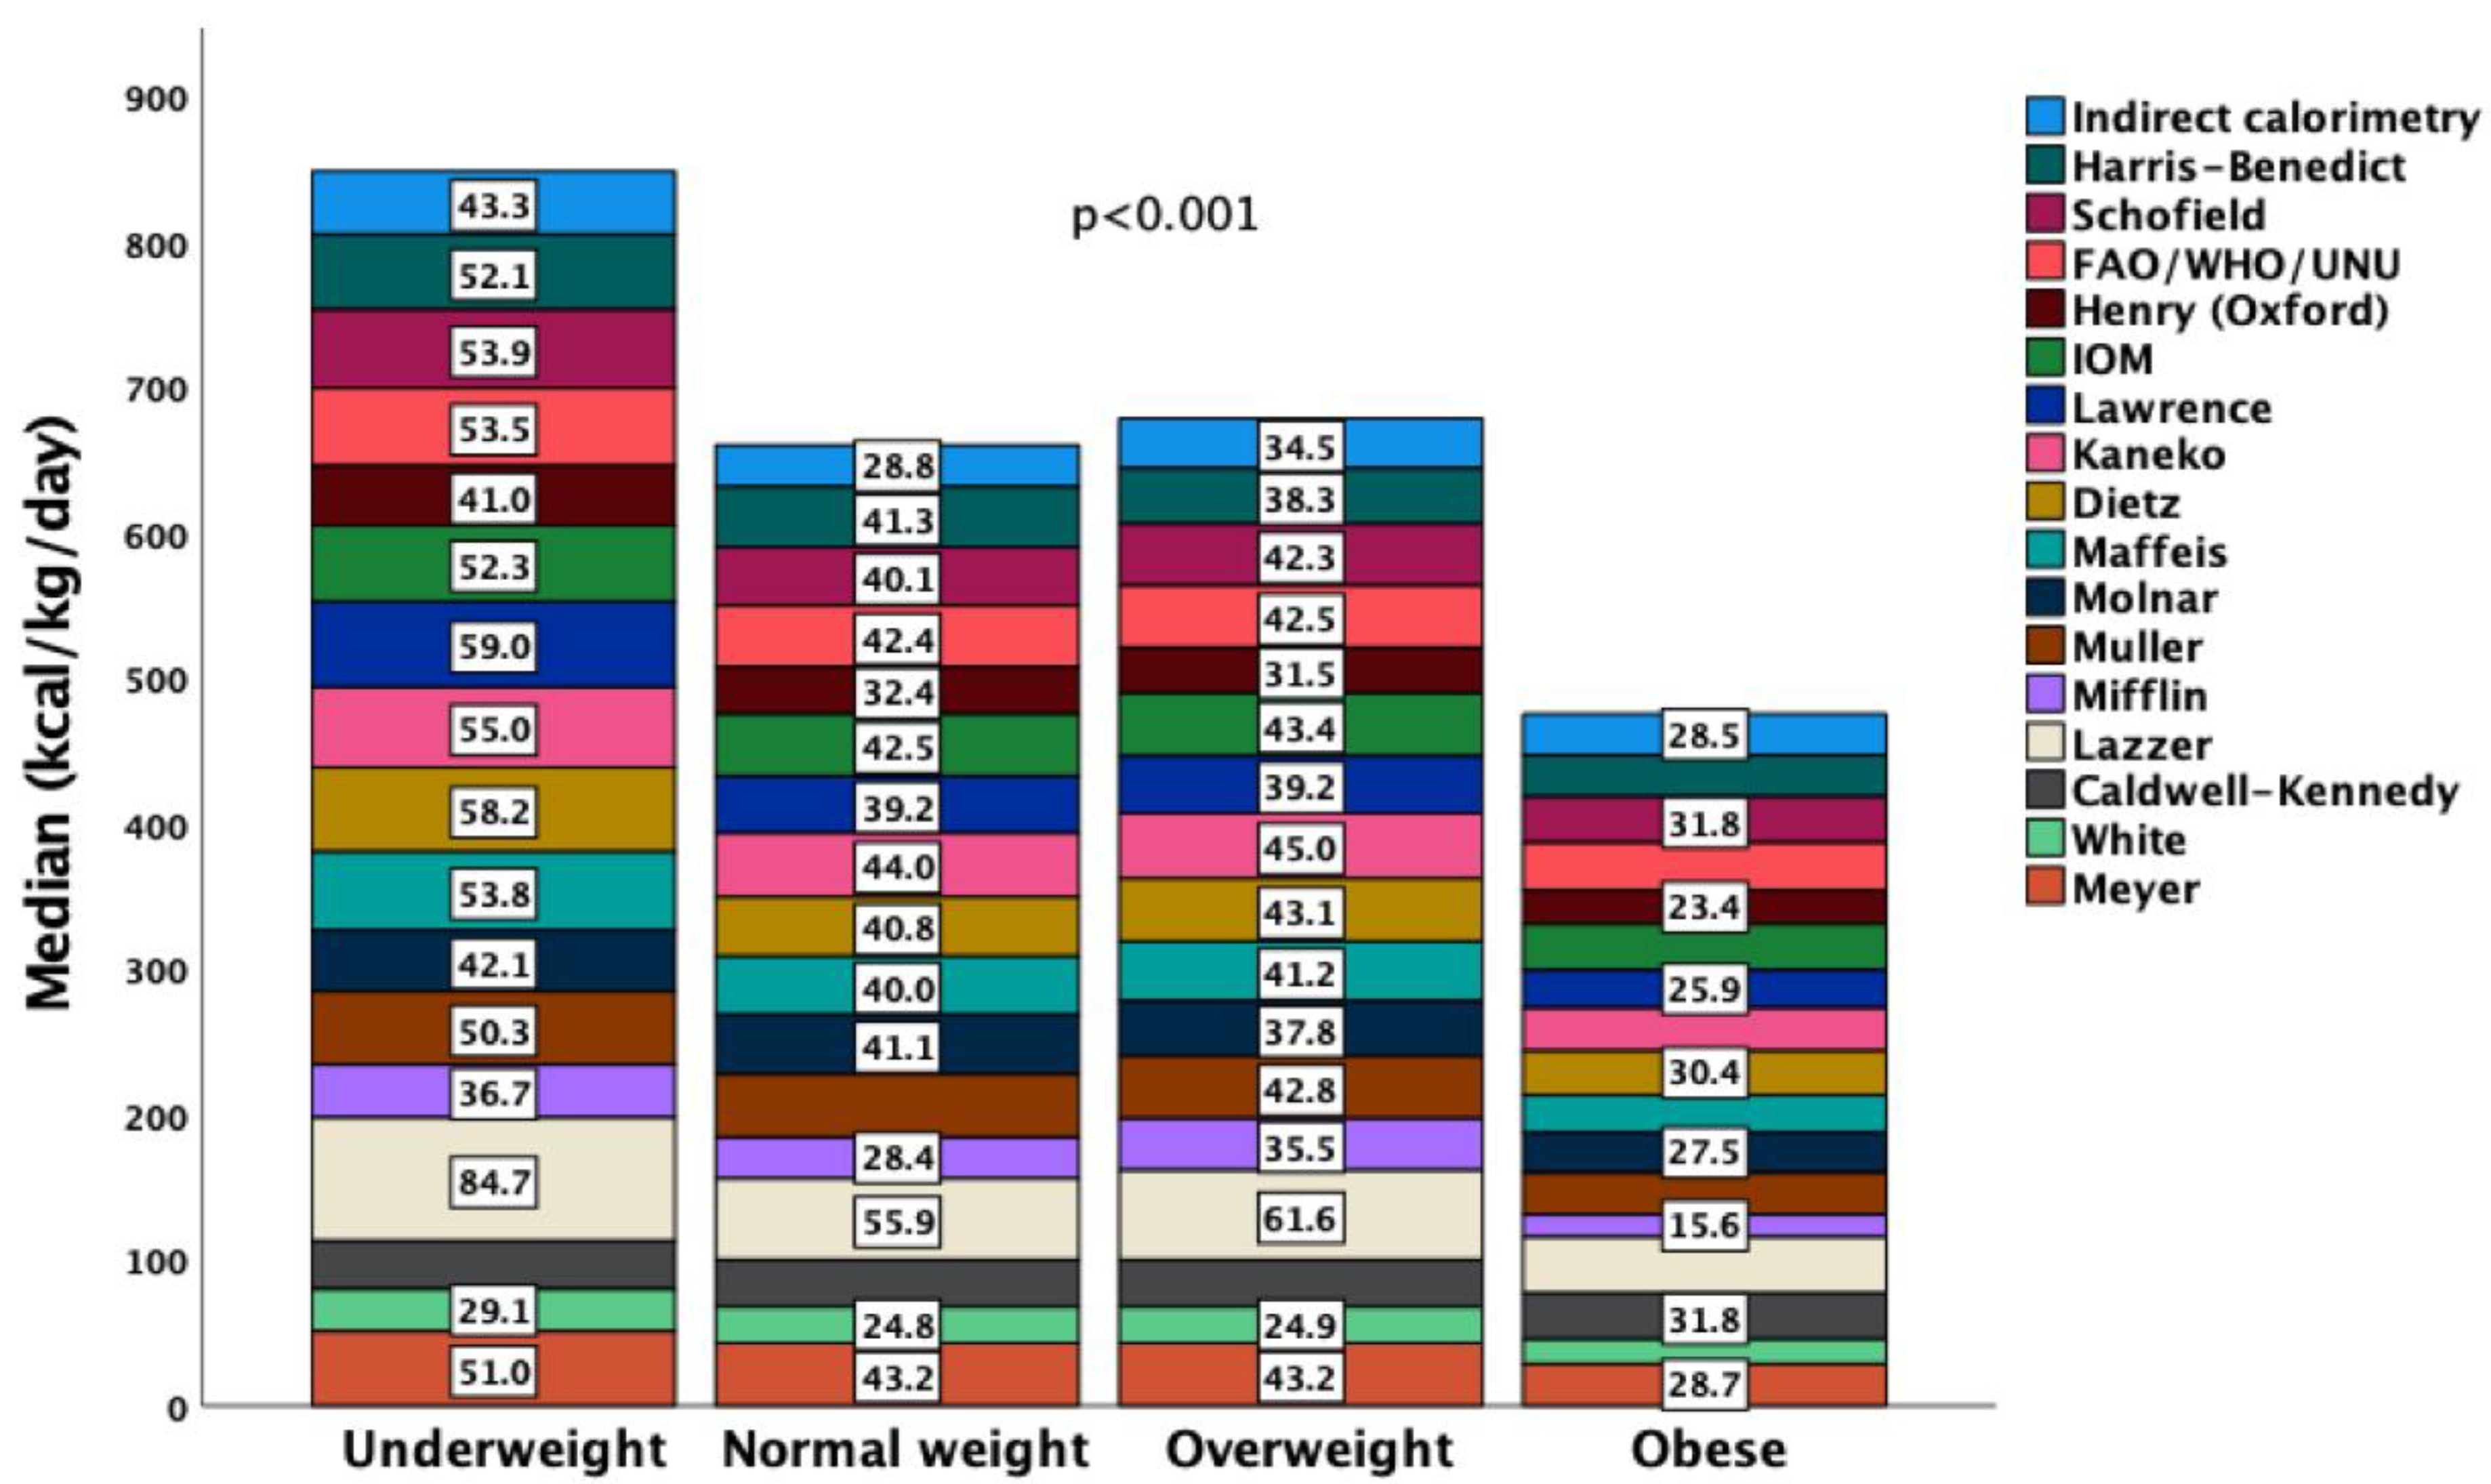
Measured by indirect calorimetry, REEIC (kcal/kg/day) was higher in the underweight and lower in the obese compared to other sub-cohorts (p = 0.017). All predicted equations also calculated higher kcal/kg/day in the underweight compared to overweight and obese patients (p < 0.001) (Figure 3).
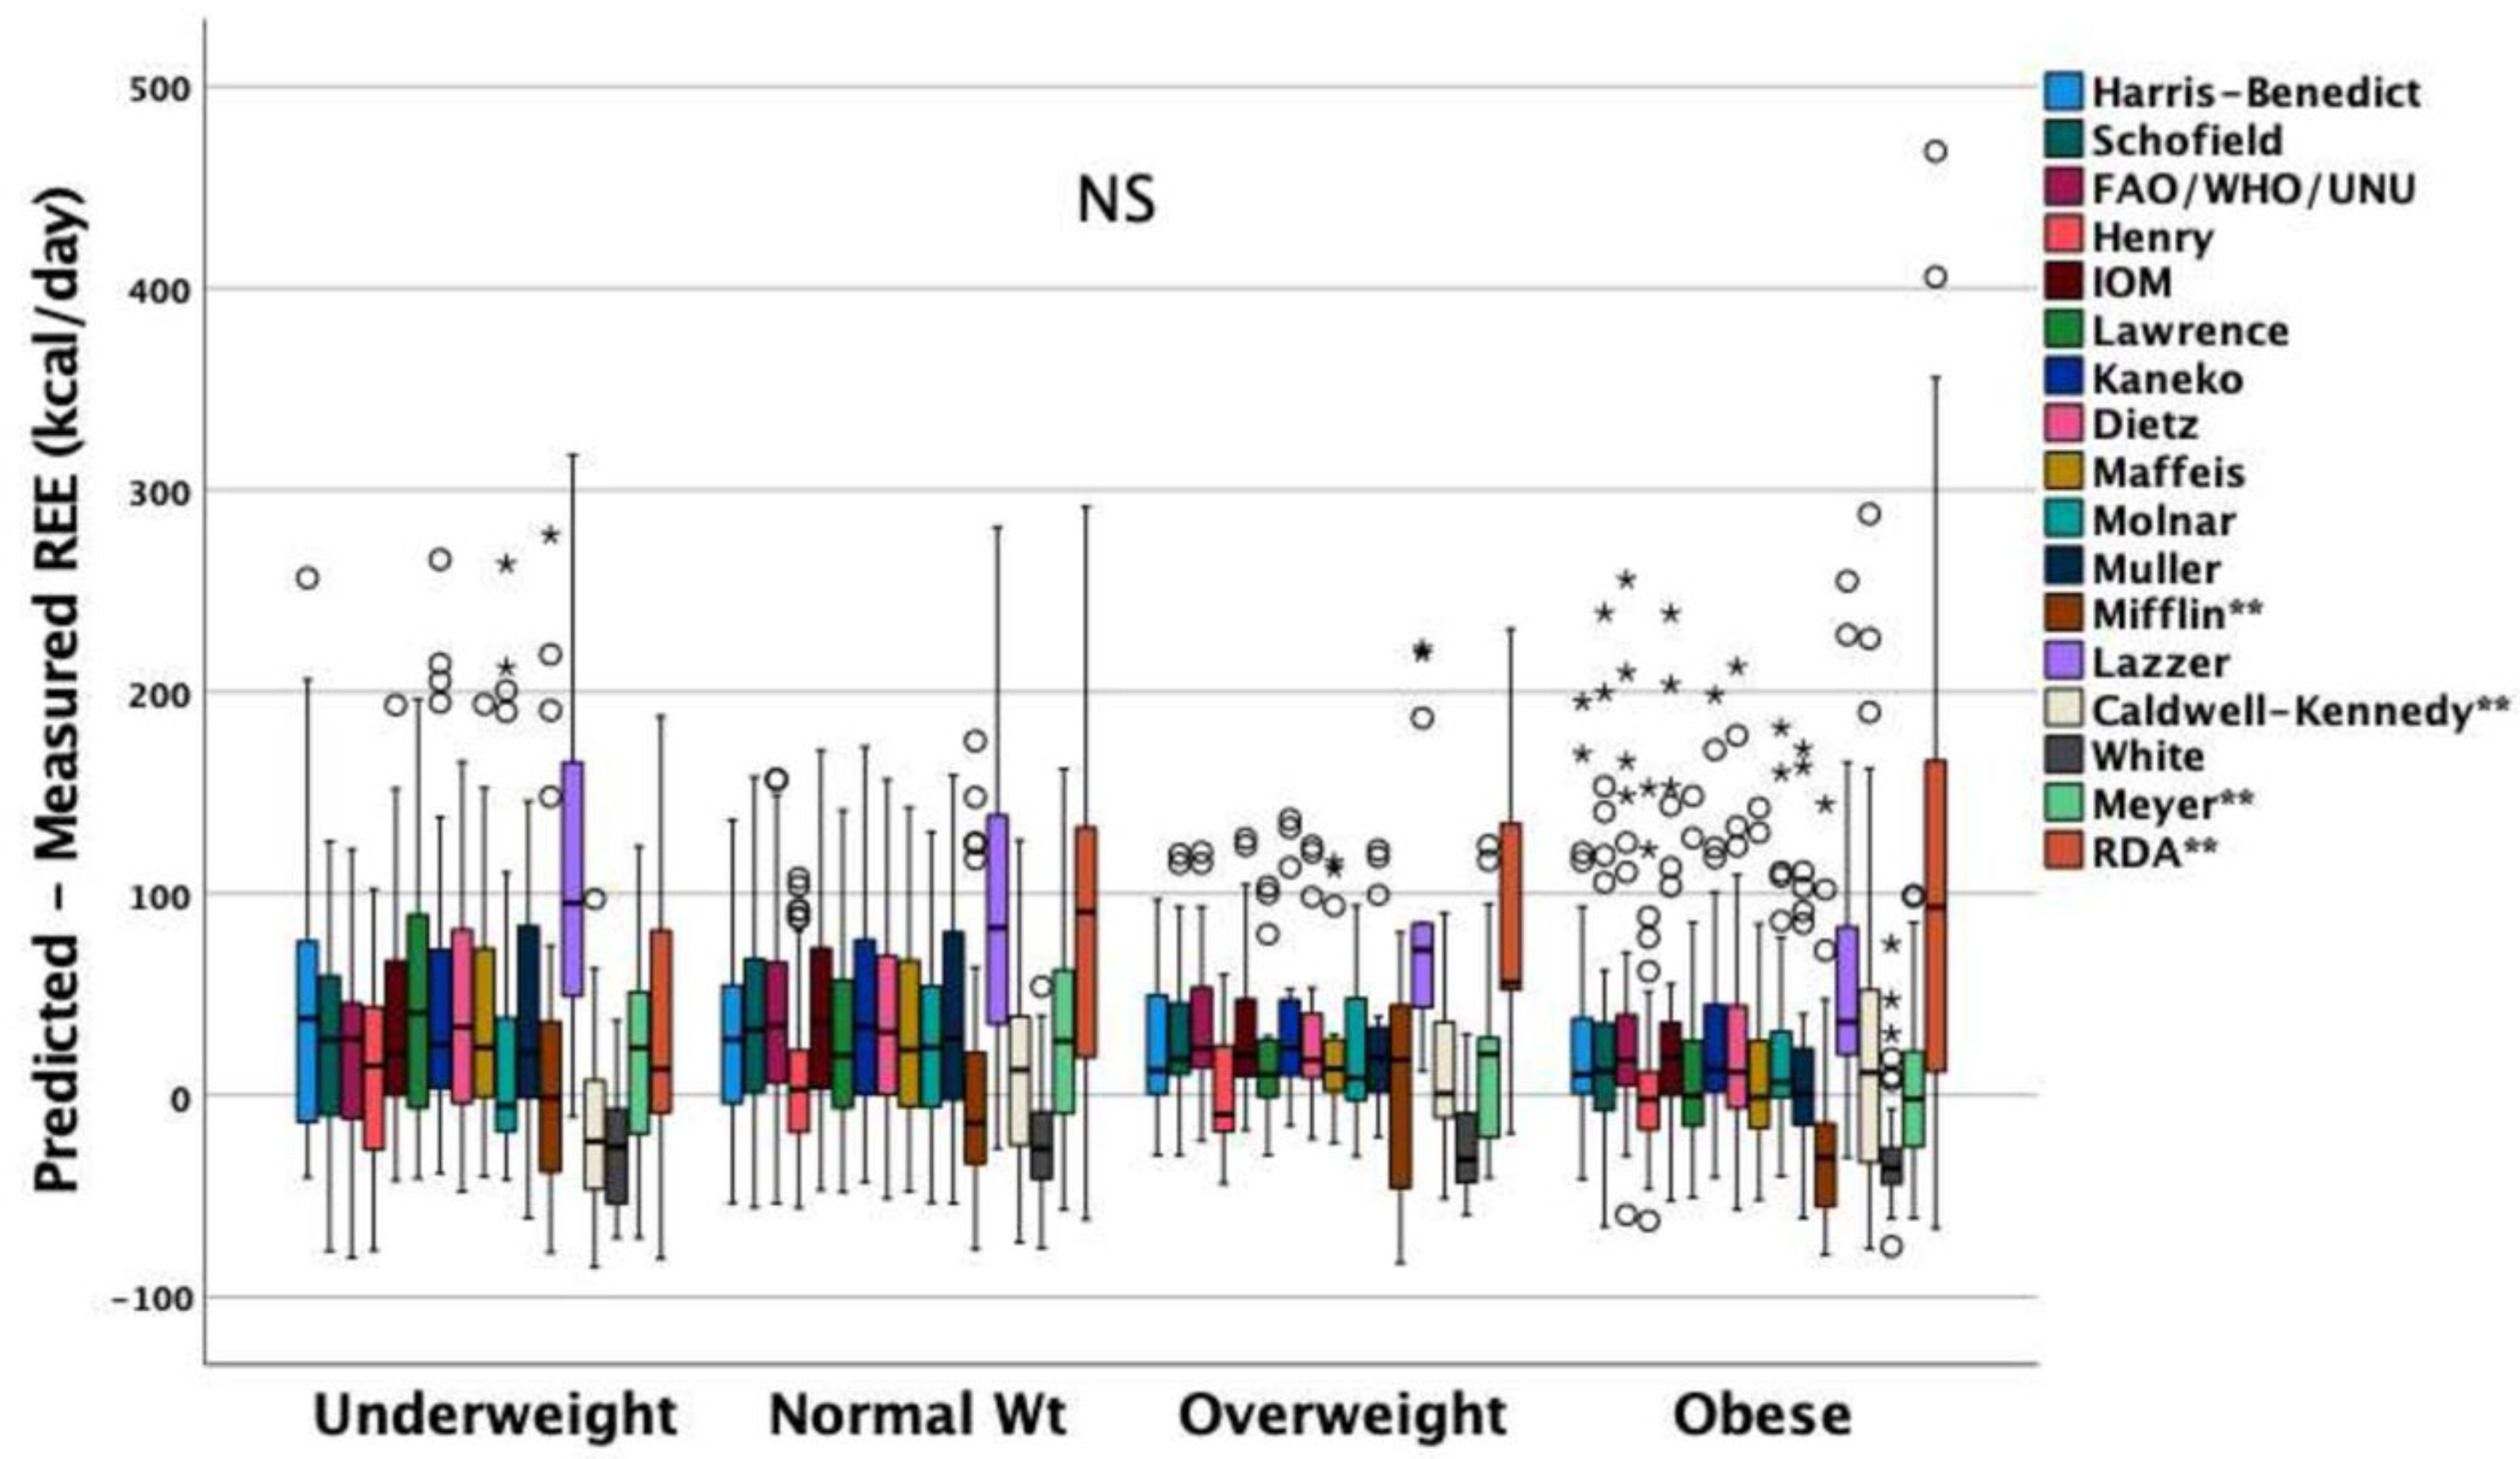
Paired eREE-REEIC differences did not differ among malnutrition groups for most predicted equations, apart from the Mifflin (p = 0.016), Caldwell–Kennedy (p = 0.039), Meyer (p = 0.042), and RDA (p < 0.01) equations (Figure 4).
In a linear regression model (stepwise, backward method), only a younger age (Beta −0.49, p < 0.001) was independently associated with the measured REEIC. None of the BMI nutrition status (overweight, obesity), the severity of illness (PRISM, TISS, PELOD), diagnostic category, outcome, temperature, heart rate, lactate, vasoactive drugs, neuromuscular blockade, or energy intake were independently associated with the REEIC.

4. Discussion

The accurate determination of energy needs in critically ill children is vital because underfeeding and overfeeding are both associated with undesirable consequences. Although IC is considered the gold standard for assessing REE in ICU patients, several predictive equations, developed from measured energy expenditure based on various numbers of healthy non-hospitalized subjects, are commonly used in clinical practice. In this study, we evaluated commonly used previously validated equations and found that even the most accurate equations had an unacceptably high error. We showed that recommended or not, PICU-related or not, the older or newly predictive equations presented large biases and small precisions, as indicated by the wide 95% limits of agreement in the Bland–Altman plots, significant paired differences, and high coefficients of variation. We also showed that although sixteen predicted equations exhibited moderate reliability, the clinically acceptable 10% accuracy rate ranged from only 6.5% to a maximum of 24.2%, with the inaccuracy varying from −31% to +71.5% of the measured patients’ energy needs. Finally, we demonstrated that, apart from a younger age, malnutrition, clinical characteristics, temperature, vasoactive drugs, neuromuscular blockade, and energy intake did not affect REEIC and thereby eREE.
A novel finding of this study is that the inaccuracy of the assessed predictive equations did not correlate with the established time (old or new), age range (pediatric, adult), malnutrition status, race, illness-related status (healthy, PICU), or recommendation by scientific societies (Schofield, WHO, IOM). For predicting energy requirements, the Schofield [5] and FAO/WHO/UNU [3] equations have been previously recommended for the healthy pediatric population [39], while in a population with obesity, the Molnár [11] and Dietz [9] equations performed most accurately. For patients receiving mechanical ventilator support, the Harris–Benedict predicted more accurately than other equations, but with a wide error range (±500 kcal) [17]. In our critically ill, mechanically ventilated patients, predicted equations either underestimated or overestimated REE, compared with measured REEIC. All predictions presented significant matched paired eREE-REEIC differences, a wide dispersion of values as expressed by high coefficients of variation, significant biases of −342 to 592 kcal, and poor precision (−1107 to 1380 kcal/day). Most of the equations overestimated REEIC, erroneously calculating higher energy needs of critically ill patients. Findings of previous studies using indirect calorimetry support our conclusion that children do not become hypermetabolic during critical illness [36] and that improved PICU-specific prediction methods are still imprecise in critically ill children [23,40,41,42,43].
Our data suggest that simple predictive equations may lead to overfeeding in critically ill children and less often to underfeeding. A U-shaped association between mortality and energy intake revealed the importance of personalized energy support and the need to prevent overfeeding and underfeeding [44]. Two recent meta-analyses showed a reduction in ICU mortality when feeding protocols were based on REEIC [45] compared to eREE [46]. Nutrition guidelines recommend measuring REE using a validated indirect calorimeter to guide nutritional support in critically ill infants and children after the acute phase [47]. Alternatively, the Schofield equation is recommended to estimate REE [47], which we showed to be one of the most inaccurate. Imprecise predictive equations that overestimated REEIC more than others were the RDA (95% limits of agreement −1101 to 2585 kcal/day), Lazzer (−196 to 1380 kcal/day), IOM (−593; 1011 kcal/day), Kaneko (−549 to 967 kcal/day), Schofield H-W (−652 to 1021 kcal/day), and Dietz-(598 to 959 kcal/day) equations. Although the FAO/WHO/UNU, Harris–Benedict, Maffeis, Lawrence, and Muller equations’ overestimation bias was smaller, they were inaccurate with wide 95% limits of agreement. Finally, the two equations that mostly underestimated REEIC were the White (−1107 to 422 kcal/day) and Mifflin (−966.8 to 575 kcal/day) equations.
In accordance with the results of the Vazquez Martinez study in the early postinjury period [17], we found the Caldwell–Kennedy equation to be among the four less inaccurate predictors of energy expenditure in ventilated, critically ill children. However, even the four predictive equations with the smallest bias, Molnar (−32 kcal/day), Caldwell–Kennedy (44 kcal/day), Henry (Oxford) (−47 kcal/day), and Meyer (47 kcal/day), exhibited extended dispersion of values as visualized by a high coefficient of variation (809-1242) and wide limits of agreement (+539.55; 1378.03 kcal/day). In the absence of IC, American Society for Parenteral and Enteral Nutrition (ASPEN) guidelines suggested that a published predictive equation or a simplistic weight-based equation (25–30 kcal/kg/d) be used in adults to determine energy requirements [48]. However, if predictive equations are used to estimate the energy need, hypocaloric nutrition (below 70% of eREE) should be preferred over isocaloric nutrition for the first week of ICU stay as per ESPEN guidelines [33].
In our series, more than half of the patients were malnourished, whereas two-thirds were underfed or overfed. In addition, both indirect calorimetry and predicted equations calculated higher kcal/kg in the underweight compared to overweight and obese patients. Following the same trend, obese patients were underfed (70.4%), whereas 36% of underweight patients were overfed. It has been suggested that patients who are at high nutrition risk or severely malnourished should be advanced to provide >80% of REEIC or eREE and protein within 48–72 h to achieve the clinical benefit of early enteral nutrition while monitoring for refeeding syndrome [48]. Hypocaloric parenteral nutrition dosing (80% of eREE) with adequate protein (≥1.2 g protein/kg/d) should also be considered in high-risk or severely malnourished patients requiring parenteral nutrition over the first week in ICU [48]. Regarding obesity, the guidelines suggest that the goal of enteral nutrition should not exceed 65%–70% of the target REEIC [48]. Personalized nutritional adjustments may impact PICU length of stay, readmission rates, quality of life [49], and long-term rehabilitation success [50]. Scientific societies recommend measuring REE by IC in malnourished children and/or suspected altered metabolism. According to these criteria, more than 70% of PICU patients are candidates for IC measurement [51]. Our finding that <25% of the equations predicted REEIC within ±10% of the indirect calorimetry REEIC exaggerates the results of a systematic review study, showing that no equation predicted REEIC within ±10% in >50% of observations [52].
Most of our patients were hypometabolic, in accordance with previously published data (5, 6, 15–17). Several factors have been implicated to explain the hypometabolism of critically ill children, such as coma, mechanical ventilation, analgesia, sedation, neuromuscular blockade, and malnutrition. It is the first time, however, to demonstrate that none of the malnutrition status, the severity of illness, diagnostic category, outcome, temperature, heart rate, lactate, vasoactive drugs, neuromuscular blockade, or energy intake were independently associated with the REEIC inaccuracy. In agreement with findings of an adult study in critically ill medical patients [53], we showed that only a younger age is independently associated with indirect calorimetry measurements in mechanically ventilated children. Accordingly, except for age, none of the estimated nutritional or clinical confounders might indirectly affect the REEIC-eREE difference. This hypothesis is further supported by the fact that PICU-related equations did not perform better than other predictive equations.
One of the limitations of this study is the small sample size, although it is in the upper range of similar studies, including sixteen predictive equations, older, recent, adult, pediatric, PICU-related, and nutrition status-related equations. In addition, the timing of the IC measurements in this prospective cross-sectional study only reflects the acute and not the recovery metabolic phase of illness. According to the ESPEN guidelines, every critically ill patient staying for more than 48 h in the ICU should be considered at risk for malnutrition [33]. We measured REE on ICU Day 3 or 4 since it has been previously shown that non-inhibitable endogenous energy is produced in the acute phase of critical illness due to a catabolic state [50]. Since the non-measurable, adapted to acute illness endogenous effect dissipates by Day 4 [54], it is recommended to commence early enteral nutrition within 24 h of admission [55], and to increase it in a stepwise fashion until the goal for delivery is achieved using a feeding protocol [47], to avoid overfeeding and mitochondrial exhaustion by targeting REEIC during the acute stress period [49,56]. Adult guidelines also recommend that hypocaloric nutrition (not exceeding 70% of REEIC) should be administered in the early phase of acute illness and that isocaloric nutrition should be progressively implemented after the early phase of acute illness [33]. Because of the unpredictable effects of a critical illness on metabolism, the considerable variation in REE, and the progressive hypermetabolism, IC should be used daily in assessing nutrition in ICU patients [57]. After the acute phase, energy intake should account for energy deficits, physical activity, or exercise, and growth [47]. Recently developed self-calibrating and simple-to-operate instruments, with implemented artificial intelligence, have built-in algorithms for the detection and deletion of aberrant periods of measurements resulting from breathing variability [58]. Future developments of metabolic cart technology to reliably monitor REEIC continuously in states of respiratory and circulatory instability, using various ventilatory settings, including non-invasive ventilation, are expected to facilitate the daily application of IC in an intensive care setting.

5. Conclusions

All available prediction equations for calculating energy needs are inaccurate for individual patients, either underestimating or overestimating REE compared with indirect calorimetry. Apart from a younger age, malnutrition, clinical characteristics, temperature, vasoactive drugs, neuromuscular blockade, and energy intake did not affect REEIC and thereby the accuracy of the predictive equations. Sixteen predictive equations may result in under- or overfeeding and cannot substitute for indirect calorimetry measurement of energy expenditure in guiding the personalization of nutrition delivery in pediatric intensive care patients.

Supplementary Materials

The following supporting information can be downloaded at: https://www.mdpi.com/article/10.3390/nu14194149/s1, Table S1: Predicted energy expenditure equations compared to indirect calorimetry for calculating energy expenditure in critically ill children; Figure S1: Bland–Altman plot whereby estimated by predicted equations’ resting energy expenditure (eREE) is compared to REE measured by IC (REEIC) at ICU Day-3 or 4. A. Harris– Benedict eREE compared to REEIC. B. Schofield (height and weight, WHO) eREE compared to REEIC. C. Mifflin eREE compared to REEIC. D. Muller eREE compared to REEIC. The solid line indicates the percentage of agreement bias (%) and the light shade with the fine dotted lines indicates the limits of agreement (bias ± (1.96 × SD) = precision). Dark shade represents the 95% confidence intervals of the mean (bias).; Figure S2: Bland–Altman plot whereby estimated by predicted equations’ resting energy expenditure (eREE) is compared to REE measured by IC (REEIC) at ICU Day-3 or 4. A. Maffeis eREE compared to REEIC. B. White (Equation (2)) eREE compared to REEIC. C. Institute for Medicine of the National Academies and Food and Nutrition Board (IOM) eREE compared to REEIC. D. Dietz eREE compared to REEIC. The solid line indicates the percentage of agreement bias (%) and the light shade with the fine dotted lines indicates the limits of agreement (bias ± (1.96 × SD) = precision). Dark shade represents the 95% confidence intervals of the mean (bias); Figure S3: Bland–Altman plot whereby estimated by predicted equations’ resting energy expenditure (eREE) is compared to REE measured by IC (REEIC) at ICU Day-3 or 4. A. FAO/WHO/UNU eREE compared to REEIC. B. Lazzer (Equation (1)) eREE compared to REEIC. C. Lawrence-3 eREE compared to REEIC. D. Kaneko eREE compared to REEIC. The solid line indicates the percentage of agreement bias (%) and the light shade with the fine dotted lines indicates the limits of agreement (bias ± (1.96 × SD) = precision). Dark shade represents the 95% confidence intervals of the mean (bias). References [2,3,4,5,6,7,8,9,10,11,12,13,15,17,18,19,20].

Author Contributions

Conceptualization, G.B. and P.B.; Methodology, G.B., E.B. and P.B.; Software, E.B. and G.B.; Formal analysis, G.B., S.I. and P.B.; Investigation, P.B., S.I. and G.B.; Resources: E.B. and G.B.; Writing—original draft preparation, G.B. and P.B.; Writing—review and editing, G.B., E.B., S.I. and P.B.; Supervision, S.I. and P.B. All authors have read and agreed to the published version of the manuscript.

Funding

This research received no external funding.

Institutional Review Board Statement

The study was conducted in accordance with the principles of the Declaration of Helsinki (last revised guidelines from 2013), following the International Conference on Harmonization (ICH)/Good Clinical Practice (GCP) standards for studies involving humans [30] and the Ethics Committee of the Institutional Review Board approved the study (approval ID14494/2011/9-1-2012).

Informed Consent Statement

Informed consent was obtained from all subjects involved in the study.

Data Availability Statement

The datasets generated and analyzed during the current study are not publicly available because the database is very extensive and includes data from other studies complementary to this, but are available from the corresponding authors upon reasonable request.

Acknowledgments

Thanks are due to all the patients who participated in the present study and their families, as well as to the ICU personnel.

Conflicts of Interest

The authors declare no conflict of interest.

References

  1. Taylor, R.M.; Cheeseman, P.; Preedy, V.; Baker, A.J.; Grimble, G. Can Energy Expenditure Be Predicted in Critically Ill Children? Pediatr. Crit. Care Med. 2003, 4, 176–180. [Google Scholar] [CrossRef] [PubMed]
  2. Harris, J.A.; Benedict, F.G. A Biometric Study of Human Basal Metabolism. Proc. Natl. Acad. Sci. USA 1918, 4, 370–373. [Google Scholar] [CrossRef] [PubMed] [Green Version]
  3. Energy and Protein Requirements. Report of a Joint FAO/WHO/UNU Expert Consultation. World Health Organ. Tech. Rep. Ser. 1985, 724, 1–206. [Google Scholar]
  4. Trumbo, P.; Schlicker, S.; Yates, A.A.; Poos, M. Food and Nutrition Board of the Institute of Medicine, The National Academies Dietary Reference Intakes for Energy, Carbohydrate, Fiber, Fat, Fatty Acids, Cholesterol, Protein and Amino Acids. J. Am. Diet. Assoc. 2002, 102, 1621–1630. [Google Scholar] [CrossRef]
  5. Schofield, W.N. Predicting Basal Metabolic Rate, New Standards and Review of Previous Work. Hum. Nutr. Clin. Nutr. 1985, 39, 5–41. [Google Scholar] [PubMed]
  6. Henry, C.J.K. Basal Metabolic Rate Studies in Humans: Measurement and Development of New Equations. Public Health Nutr. 2005, 8, 1133–1152. [Google Scholar] [CrossRef] [Green Version]
  7. Lawrence, J.C.; Lee, H.-M.; Kim, J.-H.; Kim, E.-K. Variability in Results from Predicted Resting Energy Needs as Compared to Measured Resting Energy Expenditure in Korean Children. Nutr. Res. 2009, 29, 777–783. [Google Scholar] [CrossRef]
  8. Kaneko, K.; Ito, C.; Koizumi, K.; Watanabe, S.; Umeda, Y.; Ishikawa-Takata, K. Resting Energy Expenditure (REE) in Six- to Seventeen-Year-Old Japanese Children and Adolescents. J. Nutr. Sci. Vitam. 2013, 59, 299–309. [Google Scholar] [CrossRef] [Green Version]
  9. Dietz, W.H.; Bandini, L.G.; Schoeller, D.A. Estimates of Metabolic Rate in Obese and Nonobese Adolescents. J. Pediatr. 1991, 118, 146–149. [Google Scholar] [CrossRef]
  10. Maffeis, C.; Schutz, Y.; Micciolo, R.; Zoccante, L.; Pinelli, L. Resting Metabolic Rate in Six- to Ten-Year-Old Obese and Nonobese Children. J. Pediatr. 1993, 122, 556–562. [Google Scholar] [CrossRef]
  11. Molnár, D.; Jeges, S.; Erhardt, E.; Schutz, Y. Measured and Predicted Resting Metabolic Rate in Obese and Nonobese Adolescents. J. Pediatr. 1995, 127, 571–577. [Google Scholar] [CrossRef]
  12. Müller, M.J.; Bosy-Westphal, A.; Klaus, S.; Kreymann, G.; Lührmann, P.M.; Neuhäuser-Berthold, M.; Noack, R.; Pirke, K.M.; Platte, P.; Selberg, O.; et al. World Health Organization Equations Have Shortcomings for Predicting Resting Energy Expenditure in Persons from a Modern, Affluent Population: Generation of a New Reference Standard from a Retrospective Analysis of a German Database of Resting Energy Expenditure. Am. J. Clin. Nutr. 2004, 80, 1379–1390. [Google Scholar] [CrossRef] [PubMed] [Green Version]
  13. Lazzer, S.; Patrizi, A.; De Col, A.; Saezza, A.; Sartorio, A. Prediction of Basal Metabolic Rate in Obese Children and Adolescents Considering Pubertal Stages and Anthropometric Characteristics or Body Composition. Eur. J. Clin. Nutr. 2014, 68, 695–699. [Google Scholar] [CrossRef] [PubMed]
  14. Fuentes-Servín, J.; Avila-Nava, A.; González-Salazar, L.E.; Pérez-González, O.A.; Servín-Rodas, M.D.C.; Serralde-Zuñiga, A.E.; Medina-Vera, I.; Guevara-Cruz, M. Resting Energy Expenditure Prediction Equations in the Pediatric Population: A Systematic Review. Front. Pediatr. 2021, 9, 795364. [Google Scholar] [CrossRef] [PubMed]
  15. Mifflin, M.D.; St Jeor, S.T.; Hill, L.A.; Scott, B.J.; Daugherty, S.A.; Koh, Y.O. A New Predictive Equation for Resting Energy Expenditure in Healthy Individuals. Am. J. Clin. Nutr. 1990, 51, 241–247. [Google Scholar] [CrossRef] [Green Version]
  16. Bedogni, G.; Bertoli, S.; De Amicis, R.; Foppiani, A.; De Col, A.; Tringali, G.; Marazzi, N.; De Cosmi, V.; Agostoni, C.; Battezzati, A.; et al. External Validation of Equations to Estimate Resting Energy Expenditure in 2037 Children and Adolescents with and 389 without Obesity: A Cross-Sectional Study. Nutrients 2020, 12, 1421. [Google Scholar] [CrossRef]
  17. Vazquez Martinez, J.L.; Martinez-Romillo, P.D.; Diez Sebastian, J.; Ruza Tarrio, F. Predicted versus Measured Energy Expenditure by Continuous, Online Indirect Calorimetry in Ventilated, Critically Ill Children during the Early Postinjury Period. Pediatr. Crit. Care Med. 2004, 5, 19–27. [Google Scholar] [CrossRef]
  18. Caldwell, M.D.; Kennedy-Caldwell, C. Normal Nutritional Requirements. Surg. Clin. N. Am. 1981, 61, 489–507. [Google Scholar] [CrossRef]
  19. White, M.S.; Shepherd, R.W.; McEniery, J.A. Energy Expenditure in 100 Ventilated, Critically Ill Children: Improving the Accuracy of Predictive Equations. Crit. Care Med. 2000, 28, 2307–2312. [Google Scholar] [CrossRef]
  20. Meyer, R.; Kulinskaya, E.; Briassoulis, G.; Taylor, R.M.; Cooper, M.; Pathan, N.; Habibi, P. The Challenge of Developing a New Predictive Formula to Estimate Energy Requirements in Ventilated Critically Ill Children. Nutr. Clin. Pract. 2012, 27, 669–676. [Google Scholar] [CrossRef]
  21. National Research Council (US). Subcommittee on the Tenth Edition of the Recommended Dietary Allowances Recommended Dietary Allowances, 10th ed.; The National Academies Collection: Reports Funded by National Institutes of Health; National Academies Press (US): Washington, DC, USA, 1989; ISBN 978-0-309-04633-6. [Google Scholar]
  22. Mehta, N.M.; Skillman, H.E.; Irving, S.Y.; Coss-Bu, J.A.; Vermilyea, S.; Farrington, E.A.; McKeever, L.; Hall, A.M.; Goday, P.S.; Braunschweig, C. Guidelines for the Provision and Assessment of Nutrition Support Therapy in the Pediatric Critically Ill Patient: Society of Critical Care Medicine and American Society for Parenteral and Enteral Nutrition. JPEN J. Parenter. Enter. Nutr. 2017, 41, 706–742. [Google Scholar] [CrossRef] [PubMed]
  23. Briassoulis, G.; Venkataraman, S.; Thompson, A.E. Energy Expenditure in Critically Ill Children. Crit. Care Med. 2000, 28, 1166–1172. [Google Scholar] [CrossRef] [PubMed]
  24. Hardy, C.M.; Dwyer, J.; Snelling, L.K.; Dallal, G.E.; Adelson, J.W. Pitfalls in Predicting Resting Energy Requirements in Critically Ill Children: A Comparison of Predictive Methods to Indirect Calorimetry. Nutr. Clin. Pract. 2002, 17, 182–189. [Google Scholar] [CrossRef] [PubMed]
  25. Poulsen, M.K.; Thomsen, L.P.; Kjaergaard, S.; Rees, S.E.; Karbing, D.S. Reliability of, and Agreement Between, Two Breath-by-Breath Indirect Calorimeters at Varying Levels of Inspiratory Oxygen. Nutr. Clin. Pract. 2019, 34, 767–774. [Google Scholar] [CrossRef] [PubMed]
  26. Briassoulis, G.; Briassoulis, P.; Michaeloudi, E.; Fitrolaki, D.-M.; Spanaki, A.-M.; Briassouli, E. The Effects of Endotracheal Suctioning on the Accuracy of Oxygen Consumption and Carbon Dioxide Production Measurements and Pulmonary Mechanics Calculated by a Compact Metabolic Monitor. Anesth. Analg. 2009, 109, 873–879. [Google Scholar] [CrossRef]
  27. Briassoulis, G.; Michaeloudi, E.; Fitrolaki, D.-M.; Spanaki, A.-M.; Briassouli, E. Influence of Different Ventilator Modes on Vo(2) and Vco(2) Measurements Using a Compact Metabolic Monitor. Nutrition 2009, 25, 1106–1114. [Google Scholar] [CrossRef]
  28. Jhang, W.K.; Park, S.J. Energy Expenditure in Mechanically Ventilated Korean Children: Single-Center Evaluation of a New Estimation Equation. Pediatr. Crit. Care Med. 2020, 21, e522–e529. [Google Scholar] [CrossRef]
  29. Verhoeven, J.J.; Hazelzet, J.A.; van der Voort, E.; Joosten, K.F. Comparison of Measured and Predicted Energy Expenditure in Mechanically Ventilated Children. Intensive Care Med. 1998, 24, 464–468. [Google Scholar] [CrossRef]
  30. World Medical Association. World Medical Association Declaration of Helsinki: Ethical Principles for Medical Research Involving Human Subjects. JAMA 2013, 310, 2191–2194. [Google Scholar] [CrossRef] [Green Version]
  31. Shen, Y.; Jiang, J. Meta-Analysis for the Prediction of Mortality Rates in a Pediatric Intensive Care Unit Using Different Scores: PRISM-III/IV, PIM-3, and PELOD-2. Front. Pediatr. 2021, 9, 712276. [Google Scholar] [CrossRef]
  32. Trope, R.; Vaz, S.; Zinger, M.; Sagy, M. An Updated Therapeutic Intervention Scoring System for Critically Ill Children Enables Nursing Workload Assessment with Insight Into Potential Untoward Events. J. Intensive Care Med. 2015, 30, 344–350. [Google Scholar] [CrossRef] [PubMed]
  33. Singer, P.; Blaser, A.R.; Berger, M.M.; Alhazzani, W.; Calder, P.C.; Casaer, M.P.; Hiesmayr, M.; Mayer, K.; Montejo, J.C.; Pichard, C.; et al. ESPEN Guideline on Clinical Nutrition in the Intensive Care Unit. Clin. Nutr. 2019, 38, 48–79. [Google Scholar] [CrossRef] [Green Version]
  34. CDC BMI Calculator for Child and Teen. Available online: https://www.cdc.gov/healthyweight/bmi/calculator.html (accessed on 3 August 2022).
  35. Coss-Bu, J.A.; Klish, W.J.; Walding, D.; Stein, F.; Smith, E.O.; Jefferson, L.S. Energy Metabolism, Nitrogen Balance, and Substrate Utilization in Critically Ill Children. Am. J. Clin. Nutr. 2001, 74, 664–669. [Google Scholar] [CrossRef] [PubMed] [Green Version]
  36. Briassoulis, G.; Venkataraman, S.; Thompson, A. Cytokines and Metabolic Patterns in Pediatric Patients with Critical Illness. Clin. Dev. Immunol. 2010, 2010, 354047. [Google Scholar] [CrossRef] [PubMed] [Green Version]
  37. Mehta, N.M.; Smallwood, C.D.; Joosten, K.F.M.; Hulst, J.M.; Tasker, R.C.; Duggan, C.P. Accuracy of a Simplified Equation for Energy Expenditure Based on Bedside Volumetric Carbon Dioxide Elimination Measurement–A Two-Center Study. Clin. Nutr. 2015, 34, 151–155. [Google Scholar] [CrossRef] [PubMed] [Green Version]
  38. Koo, T.K.; Li, M.Y. A Guideline of Selecting and Reporting Intraclass Correlation Coefficients for Reliability Research. J. Chiropr. Med. 2016, 15, 155–163. [Google Scholar] [CrossRef] [Green Version]
  39. Rodríguez, G.; Moreno, L.A.; Sarría, A.; Fleta, J.; Bueno, M. Resting Energy Expenditure in Children and Adolescents: Agreement between Calorimetry and Prediction Equations. Clin. Nutr. 2002, 21, 255–260. [Google Scholar] [CrossRef]
  40. Mehta, N.M.; Bechard, L.J.; Dolan, M.; Ariagno, K.; Jiang, H.; Duggan, C. Energy Imbalance and the Risk of Overfeeding in Critically Ill Children. Pediatr. Crit. Care Med. 2011, 12, 398–405. [Google Scholar] [CrossRef]
  41. Spanaki, A.M.; Tavladaki, T.; Dimitriou, H.; Kozlov, A.V.; Duvigneau, J.C.; Meleti, E.; Weidinger, A.; Papakonstantinou, E.; Briassoulis, G. Longitudinal Profiles of Metabolism and Bioenergetics Associated with Innate Immune Hormonal Inflammatory Responses and Amino-Acid Kinetics in Severe Sepsis and Systemic Inflammatory Response Syndrome in Children. JPEN J. Parenter. Enter. Nutr. 2018, 42, 1061–1074. [Google Scholar] [CrossRef]
  42. Briassoulis, G.; Briassouli, E.; Tavladaki, T.; Ilia, S.; Fitrolaki, D.M.; Spanaki, A.M. Unpredictable Combination of Metabolic and Feeding Patterns in Malnourished Critically Ill Children: The Malnutrition-Energy Assessment Question. Intensive Care Med. 2014, 40, 120–122. [Google Scholar] [CrossRef]
  43. Tavladaki, T.; Spanaki, A.M.; Dimitriou, H.; Kondili, E.; Choulaki, C.; Georgopoulos, D.; Briassoulis, G. Similar Metabolic, Innate Immunity, and Adipokine Profiles in Adult and Pediatric Sepsis Versus Systemic Inflammatory Response Syndrome-A Pilot Study. Pediatr. Crit. Care Med. 2017, 18, e494–e505. [Google Scholar] [CrossRef] [PubMed]
  44. Zusman, O.; Theilla, M.; Cohen, J.; Kagan, I.; Bendavid, I.; Singer, P. Resting Energy Expenditure, Calorie and Protein Consumption in Critically Ill Patients: A Retrospective Cohort Study. Crit. Care 2016, 20, 367. [Google Scholar] [CrossRef] [PubMed] [Green Version]
  45. Duan, J.-Y.; Zheng, W.-H.; Zhou, H.; Xu, Y.; Huang, H.-B. Energy Delivery Guided by Indirect Calorimetry in Critically Ill Patients: A Systematic Review and Meta-Analysis. Crit. Care 2021, 25, 88. [Google Scholar] [CrossRef] [PubMed]
  46. Pertzov, B.; Bar-Yoseph, H.; Menndel, Y.; Bendavid, I.; Kagan, I.; Glass, Y.D.; Singer, P. The Effect of Indirect Calorimetry Guided Isocaloric Nutrition on Mortality in Critically Ill Patients-a Systematic Review and Meta-Analysis. Eur. J. Clin. Nutr. 2022, 76, 5–15. [Google Scholar] [CrossRef] [PubMed]
  47. Tume, L.N.; Valla, F.V.; Joosten, K.; Jotterand Chaparro, C.; Latten, L.; Marino, L.V.; Macleod, I.; Moullet, C.; Pathan, N.; Rooze, S.; et al. Nutritional Support for Children during Critical Illness: European Society of Pediatric and Neonatal Intensive Care (ESPNIC) Metabolism, Endocrine and Nutrition Section Position Statement and Clinical Recommendations. Intensive Care Med. 2020, 46, 411–425. [Google Scholar] [CrossRef] [Green Version]
  48. McClave, S.A.; Taylor, B.E.; Martindale, R.G.; Warren, M.M.; Johnson, D.R.; Braunschweig, C.; McCarthy, M.S.; Davanos, E.; Rice, T.W.; Cresci, G.A.; et al. Guidelines for the Provision and Assessment of Nutrition Support Therapy in the Adult Critically Ill Patient: Society of Critical Care Medicine (SCCM) and American Society for Parenteral and Enteral Nutrition (A.S.P.E.N.). JPEN J. Parenter. Enter. Nutr. 2016, 40, 159–211. [Google Scholar] [CrossRef]
  49. De Waele, E.; van Zanten, A.R.H. Routine Use of Indirect Calorimetry in Critically Ill Patients: Pros and Cons. Crit. Care 2022, 26, 123. [Google Scholar] [CrossRef]
  50. Moonen, H.P.F.X.; Beckers, K.J.H.; van Zanten, A.R.H. Energy Expenditure and Indirect Calorimetry in Critical Illness and Convalescence: Current Evidence and Practical Considerations. J. Intensive Care 2021, 9, 8. [Google Scholar] [CrossRef]
  51. Kyle, U.G.; Arriaza, A.; Esposito, M.; Coss-Bu, J.A. Is Indirect Calorimetry a Necessity or a Luxury in the Pediatric Intensive Care Unit? JPEN J. Parenter. Enter. Nutr. 2012, 36, 177–182. [Google Scholar] [CrossRef]
  52. Jotterand Chaparro, C.; Moullet, C.; Taffé, P.; Laure Depeyre, J.; Perez, M.-H.; Longchamp, D.; Cotting, J. Estimation of Resting Energy Expenditure Using Predictive Equations in Critically Ill Children: Results of a Systematic Review. JPEN J. Parenter. Enter. Nutr. 2018, 42, 976–986. [Google Scholar] [CrossRef]
  53. Wewalka, M.; Schneeweiss, M.; Haselwanter, P.; Schneeweiss, B.; Zauner, C. Age-Dependent Differences in Energy Metabolism in the Acute Phase of Critical Illness. Nutrition 2022, 101, 111684. [Google Scholar] [CrossRef] [PubMed]
  54. Singer, P. Preserving the Quality of Life: Nutrition in the ICU. Crit. Care 2019, 23, 139. [Google Scholar] [CrossRef] [PubMed] [Green Version]
  55. Tume, L.N.; Ista, E.; Verbruggen, S.; Jotterand Chaparro, C.; Moullet, C.; Latten, L.; Marino, L.V.; Valla, F.V. Practical Strategies to Implement the ESPNIC Nutrition Clinical Recommendations into PICU Practice. Clin. Nutr. ESPEN 2021, 42, 410–414. [Google Scholar] [CrossRef] [PubMed]
  56. Briassoulis, G.C.; Zavras, N.J.; Hatzis MD, T.D. Effectiveness and Safety of a Protocol for Promotion of Early Intragastric Feeding in Critically Ill Children. Pediatr. Crit. Care Med. 2001, 2, 113–121. [Google Scholar] [CrossRef] [PubMed]
  57. Whittle, J.; Molinger, J.; MacLeod, D.; Haines, K.; Wischmeyer, P.E. LEEP-COVID Study Group Persistent Hypermetabolism and Longitudinal Energy Expenditure in Critically Ill Patients with COVID-19. Crit. Care 2020, 24, 581. [Google Scholar] [CrossRef] [PubMed]
  58. De Waele, E.; Jonckheer, J.; Wischmeyer, P. Indirect Calorimetry In Critical Illness: A New Standard of Care? Curr. Opin. Crit. Care 2021, 27, 334–343. [Google Scholar] [CrossRef] [PubMed]
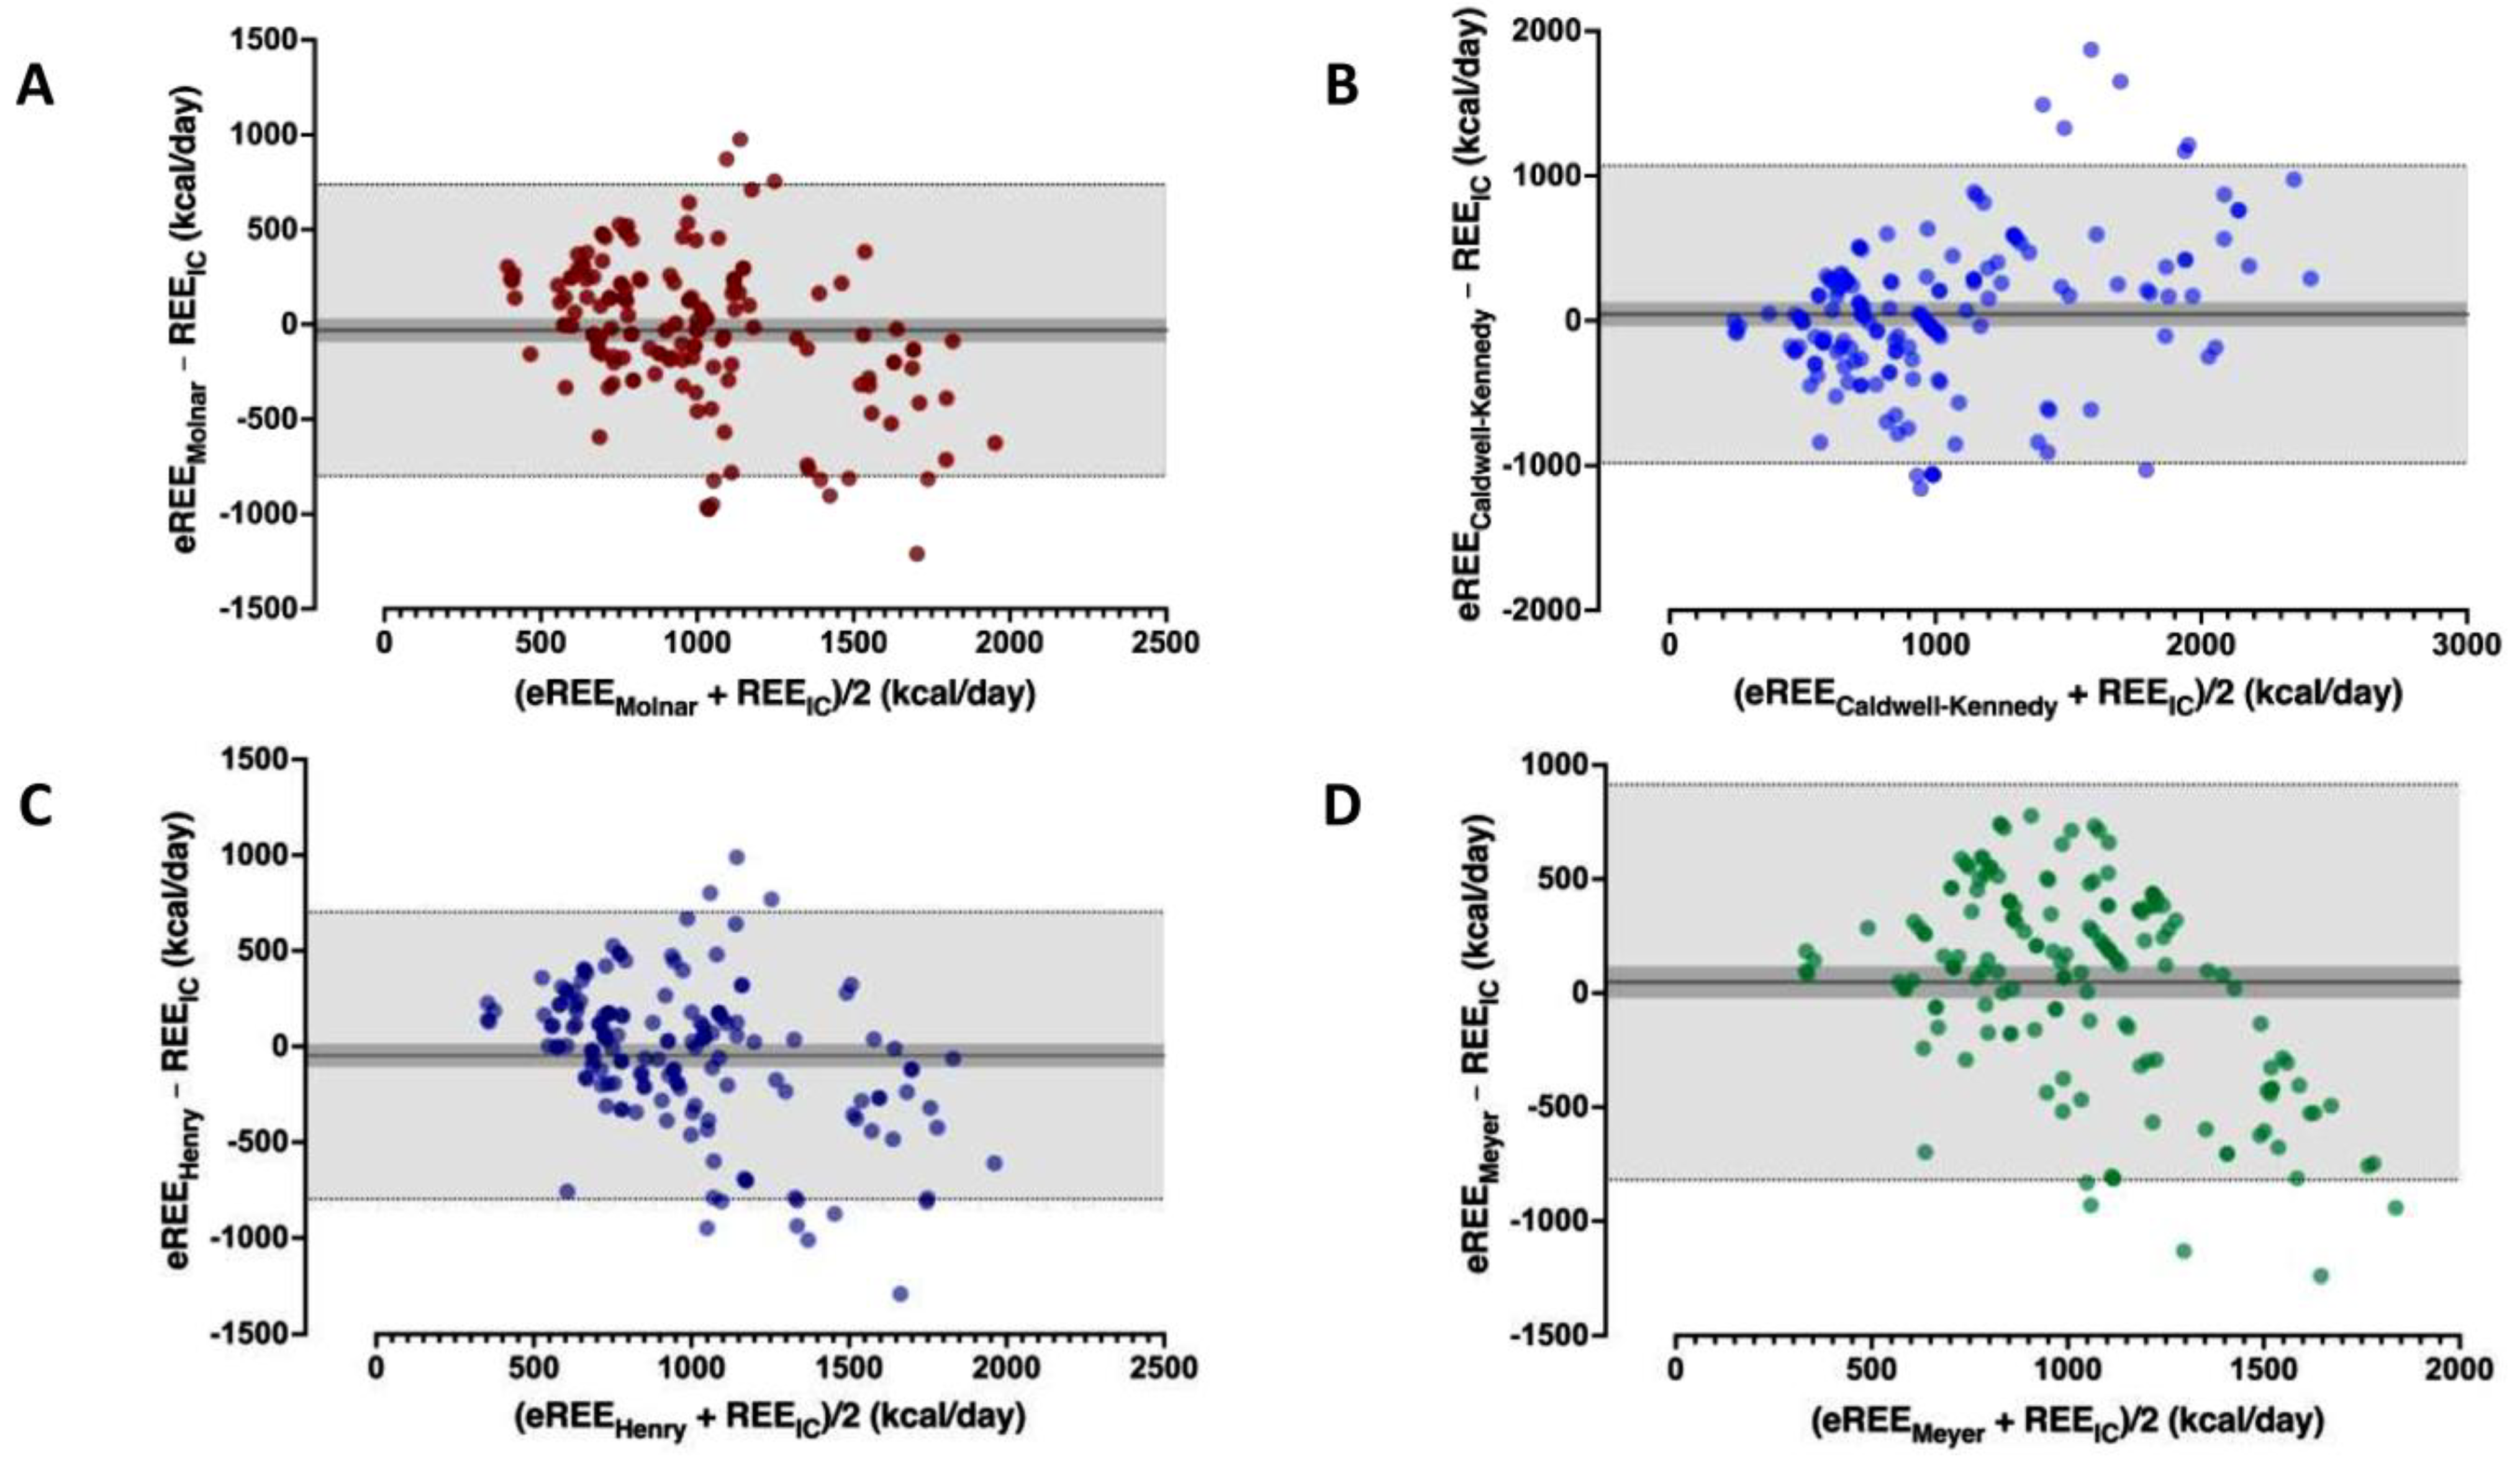
Figure 1. Bland–Altman plot whereby estimated by predicted equations’ resting energy expenditure (eREE) is compared to REE measured by IC (REEIC) at ICU Day-3 or 4. (A). Molnar eREE compared to REEIC. (B). Caldwell–Kennedy eREE compared to REEIC. (C). Henry (Oxford) eREE compared to REEIC. (D). Meyer equation-C eREE compared to REEIC. The solid line indicates the percentage of agreement bias (%) and the light shade with the fine dotted lines indicates the limits of agreement (bias ± (1.96 × SD) = precision). Dark shade represents the 95% confidence intervals of the mean (bias).
Nutrients 14 04149 g001
Figure 2. Percentages of estimated resting energy expenditure (eREE) values of an equation within 10% of resting energy expenditure measured by IC (REEIC) (blue color). Inaccuracy profiles varied from underestimation (red color) to overestimation (green color) of the patient’s energy needs. Clinically significant percentage error (eREE − REEIC)/ REEIC (%) was considered a difference of ≥ ±10% and it was significantly lower than an expected minimum accuracy of 50%.
Nutrients 14 04149 g002
Figure 3. Measured by indirect calorimetry resting energy expenditure (REEIC) (kcal/kg/day) was higher in the underweight and lower in the obese compared to other sub-cohorts (p = 0.017). All predicted equations also calculated higher kcal/kg/day in the underweight compared to overweight and obese patients (p < 0.001). Numbers in the white boxes indicate the medians of the equations.
Nutrients 14 04149 g003
Figure 4. Paired estimated by predicted equations’ resting energy expenditure (eREE) and REE measured by IC (REEIC) differences did not differ among malnutrition groups for most predicted equations, apart from the Mifflin (p = 0.016), Caldwell–Kennedy (p = 0.039), Meyer (p = 0.042), and RDA (p < 0.01) equations. The bold black line in box plots indicates the median per group, the bottom of the box indicates the 25th percentile and the top of the box represents the 75th percentile; the T-bars (whiskers) and horizontal lines show minimum and maximum values of the calculated non-outlier values; circles are the outliers, asterisks are the extreme outliers.
Nutrients 14 04149 g004
Table 1. Demographic and clinical characteristics.
N = 153
Demographic Clinical Data Indirect Calorimetry
Age (years)7.5 (5; 12.5)PRISM score9 (6; 15)REE (kcal/day)928 (651; 1238)
Sex (male/female)108/45, (70.6%/29.4%)TISS score41 (36; 46)REE (kcal/kg/day)32.3 (23.0; 48.3)
Anthropometric PELOD score7 (2; 18)VO2 (mL/min)134 (95.5; 176.8)
Body weight (kg)25 (16.5; 41.5)FiO2 (%)35 (30; 50)VCO2 (mL/min)111 (74.6; 153.2)
Height (cm)130 (111; 148)pH7.39 (7.35; 7.43)Respiratory Quotient0.85 (0.77; 0.91)
BMI (kg/m2)16.6 (15.2; 20.6)pO2 (mmHg)96 (87; 111)Metabolic state * (kcal/day)88.5 (69.7; 106.7)
z-score weight for age0.42 (−1.2; 1.2)pCO2 (mmHg)36 (33.5; 39.1)Metabolic pattern **
z-score height for age −0.03 (−0.54; 0.55)HCO3 (mEq/L)22.3 (19.6; 24.5)Normometabolic42 (27.5%)
z-score BMI for age 0.47 (−0.98; 1.65)Heart Rate (bpm)100 (80: 119)Hypometabolic82 (53.6%)
BMI nutrition status Respiratory rate (bpm)22 (18; 25.8)Hypermetabolic29 (19%)
Underweight 30 (19.6%)Systolic Blood Pressure (mmHg)97 (78; 107)Nutrition day 3
Normal BMI 69 (45.1%)Body Temperature (°C)37.2 (36.8; 37.8)Energy intake (kcal/day)720 (480; 1000)
Overweight 16 (10.5%)Neuromuscular blockade, yes 11/66 (16.7%)Energy intake (kcal/kg/day)27.4 (16; 41.7)
Obese 38 (24.8%)Vasoactive, yes 40/82 (56.3%)Energy intake/REE ratio
Clinical diagnosis Lactate (mg/dL)10.8 (6.3; 18)Energy intake/REE (%)88.2 (47.7; 112.9)
Respiratory failure40 (26.2%)Glucose (mg/dL)103 (93; 121)Feeding status
Sepsis27 (17.6%)Albumin (mg/dL)3.1 (2.7; 3.4)Adequate40/123 (32.5%)
Surgical11 (7.2%)C-Reactive Protein (mg/dL)8 (1.3; 16)Underfeeding49/123 (39.8%)
Organ failure4 (2.6%)Length of Stay (days)14 (6.5; 23.5)Overfeeding34/123 (27.6%)
Trauma41 (26.8%)Mechanical Ventilation (days)12 (5; 18)Underfeeding/Obese15/27 (55.6%)
Neurologic30 (19.6%)Mortality 6 (3.9%)Overfeeding/Underweight9/25 (36%)
Continuous variables are reported as 50th (median) and 25th and 75th percentiles (interquartile range, within brackets). Discrete variables are reported as the number and proportion (within brackets) of subjects with the characteristic of interest. BMI = Body Mass Index; PRISM, Pediatric Risk of Mortality; TISS = Therapeutic Intervention Scoring System; PELOD = Pediatric Logistic Organ Dysfunction; REE = Resting Energy Expenditure; VO2 = Volumetric Oxygen Consumption; VCO2 = Volumetric Carbon Dioxide Production. * Metabolic state = ratio of measured REEIC to eREE based on the Schofield equation. ** Normometabolic REEIC/eREESchofield = 90–110%; hypometabolic REEIC/eREESchofield < 90%; hypermetabolic when REEIC/eREESchofield > 110%.
Table 2. Comparison analysis between resting energy expenditure measured by indirect calorimetry and calculations through predictive equations (kcal/day).
REE (kcal/Day)Agreement-Precision *Paired Differences-Variability #
Compared Equation IQR 25thMedianIQR 75thMean BiasSDLimits of AgreementMedan of Differences IQR
25th; 75th
CV (%)p Value
n = 153
Indirect Calorimetry 651.35928.301238.39
Harris–Benedict920.171083.411263.46142391−624; 908174−48; 388275<0.001
Schofield H-W864.581057.301439.47185427−652; 1021191−41; 469231<0.001
FAO/WHO/UNU727.13935.251216.50146398−634; 926142−32; 430273<0.001
Henry (Oxford)739.37860.6541172.30−47383−798; 7035−236; 1768090.421
IOM937.551090.301404.64209409−593; 101120521; 481196<0.001
Lawrence885.64995.931296.8281384−672; 834130−119; 342475<0.002
Kaneko1016.621122.271357.78209387−549; 96721121; 468185<0.001
Dietz919.611072.041393.22181397−598; 959219−25; 434220<0.001
Maffeis921.371048.951215.1087388−673; 846127−134; 396448<0.002
Molnar929.431126.621339.89−32393−802; 739−8−207; 23512420.843
Muller869.151062.501471.1096393−674; 866111−120; 352410<0.001
Mifflin561.30769.901050.96−159.9393.3−966.8; 575−926−1235; −650201<0.001
Lazzer (equation 1)1346.001548.001831.00592402−196; 1380627385; 86968<0.001
Caldwell–Kennedy539.55806.371378.0344524−983; 107135−213; 29111870.358
White (equation 2)512.07606.06784.21−342390−1107; 422−282−520; −69114<0.001
Meyer (equation C)800.561054.001302.8647442−820; 915137−264; 3829350.058
RDA880.001320.002365.00742940−1101; 258556858; 1210127<0.001
Continuous variables are reported as median (interquartile range). Abbreviations: IQR = interquartile range; SD = Standard Deviation; CV = Coefficient of Variation; REE = Resting Energy Expenditure.* Bland–Altman; # Wilcoxon matched pairs signed rank test. Statistical significance was considered for p < 0.05.
Table 3. Reliability by intraclass correlation coefficient (average measures) and 10% accuracy of the studied equations of predicted energy expenditure in comparison to the resting energy expenditure measured by indirect calorimetry.
Reliability ^Accuracy #
Compared EquationAll
n = 153
Underweight n = 30Normal Weight
n = 69
Overweight n = 16Obese
n = 38
ICC (Average Measures)p ValueWithin ±10%<−10%>+10%p Value * W i t h i n  
± 10 %
p Value* W i t h i n  
± 10 %
p Value * W i t h i n  
± 10 %
p Value * W i t h i n  
± 10 %
p Value *
Harris–Benedict 0.699 (0.58; 0.78)<0.00120.320.958.8<0.0012/28<0.00113/56<0.0015/110.13411/27<0.01
Schofield0.73 (0.63; 0.80)<0.00117.61963.4<0.0015/25<0.00113/56<0.0012/140.0038/30<0.001
FAO/WHO/UNU0.74 (0.64; 0.81)<0.00114.41966.7<0.0013/27<0.00112/57<0.0011/15<0.0017/31<0.001
Henry (Oxford)0.70 (0.59; 0.78)<0.00121.637.940.50.0083/27<0.00117/52<0.0012/140.00312/260.023
IOM0.72 (0.61; 0.79)<0.00115.717.666.7<0.0014/26<0.00112/57<0.0013/130.0127/31<0.001
Lawrence0.65 (0.52; 0.75)<0.00120.924.854.2<0.0016/24<0.00112/57<0.0015/110.1349/329<0.001
Kaneko0.67 (0.55; 0.76)<0.00120.315.764.1<0.0016/24<0.00110/59<0.0013/130.01212/260.023
Dietz0.72 (0.61; 0.79)<0.00121.61761.4<0.0015/25<0.00110/59<0.0015/110.13411/270.009
Maffeis0.62 (0.47; 0.72)<0.00117.626.156.2<0.0015/25<0.00112/57<0.0014/120.0466/32<0.001
Molnar0.68 (0.56; 0.77)<0.00124.223.552.3<0.0016/24<0.00114/55<0.0015/110.13412/260.023
Muller0.67 (0.55; 0.76)<0.0011920.960.1<0.0013/27<0.00111/58<0.0013/130.01212/260.023
Mifflin0.68 (0.57; 0.77)<0.00113.155.631.4<0.0015/25<0.00110/59<0.0012/140.0033/35<0.001
Lazzer (equation 1)0.69 (0.58; 0.77)<0.0019.84.685.6<0.0014/26<0.0017/62<0.0010/16-4/34<0.001
Caldwell–Kennedy0.72 (0.61; 0.79)<0.0011738.644.4<0.0017/23<0.0017/62<0.0015/110.0037/31<0.001
White (equation 2)0.60 (0.46; 0.71)<0.0016.575.218.3<0.0012/28<0.0014/65<0.0011/15<0.0013/35<0.001
Meyer (equation C)0.51 (0.32; 0.64)<0.00112.430.756.9<0.0012/28<0.00111/58<0.0010/16-6/32<0.001
RDA0.58 (0.42; 0.69)<0.00110.514.475.2<0.0018/220.0114/65<0.0011/15<0.0013/35<0.001
Continuous variables are reported as median (interquartile range). Abbreviations: RDA = Recommended Dietary Allowances; ICC = Intraclass Correlation Coefficient. ^ Reliability by the Intraclass Correlation Coefficient using the two-way mixed consistency (average ICC measures identical to Cronbach’s Alpha values); # Clinically significant percentage error (REEVCO2 − REEIC)/REEIC (%); * Nonparametric x2 test; Statistical significance was considered for p < 0.05.
Publisher’s Note: MDPI stays neutral with regard to jurisdictional claims in published maps and institutional affiliations.