
Dietary Intake, Nutritional Adequacy, and Food Sources of Selected Antioxidant Minerals and Vitamins; and Their Relationship with Personal and Family Factors in Spanish Children Aged 1 to <10 Years: Results from the EsNuPI Study


 ,
,  ,
,  ,
,  ,
,  ,
,  and
and
Abstract
1. Introduction
2. Materials and Methods
2.1. Study Design and Methods
2.2. Dietary Assessment and Data Processing
2.3. Sociodemographic and Anthropometric Data
2.4. Physical Activity and Sedentary Behavior
2.5. Evaluation of Plausible Reporting and Misreporting (Under- and Over-Reporting)
2.6. Statistical Analysis
3. Results
3.1. Subjects Characteristics
3.2. Distribution of Total Antioxidant Minerals and Vitamins Intakes, and Adequacy to the Recommendations Set by EFSA
3.2.1. Zinc
3.2.2. Selenium
3.2.3. Vitamin A, Retinol, and Carotenoids
3.2.4. Vitamin C
3.2.5. Vitamin E
3.3. Association between Usual Intakes of Antioxidant Minerals and Vitamins with Personal and Family Factors
3.4. Food Groups Contributing to Antioxidant Minerals and Vitamins Intakes
3.4.1. Zinc
3.4.2. Selenium
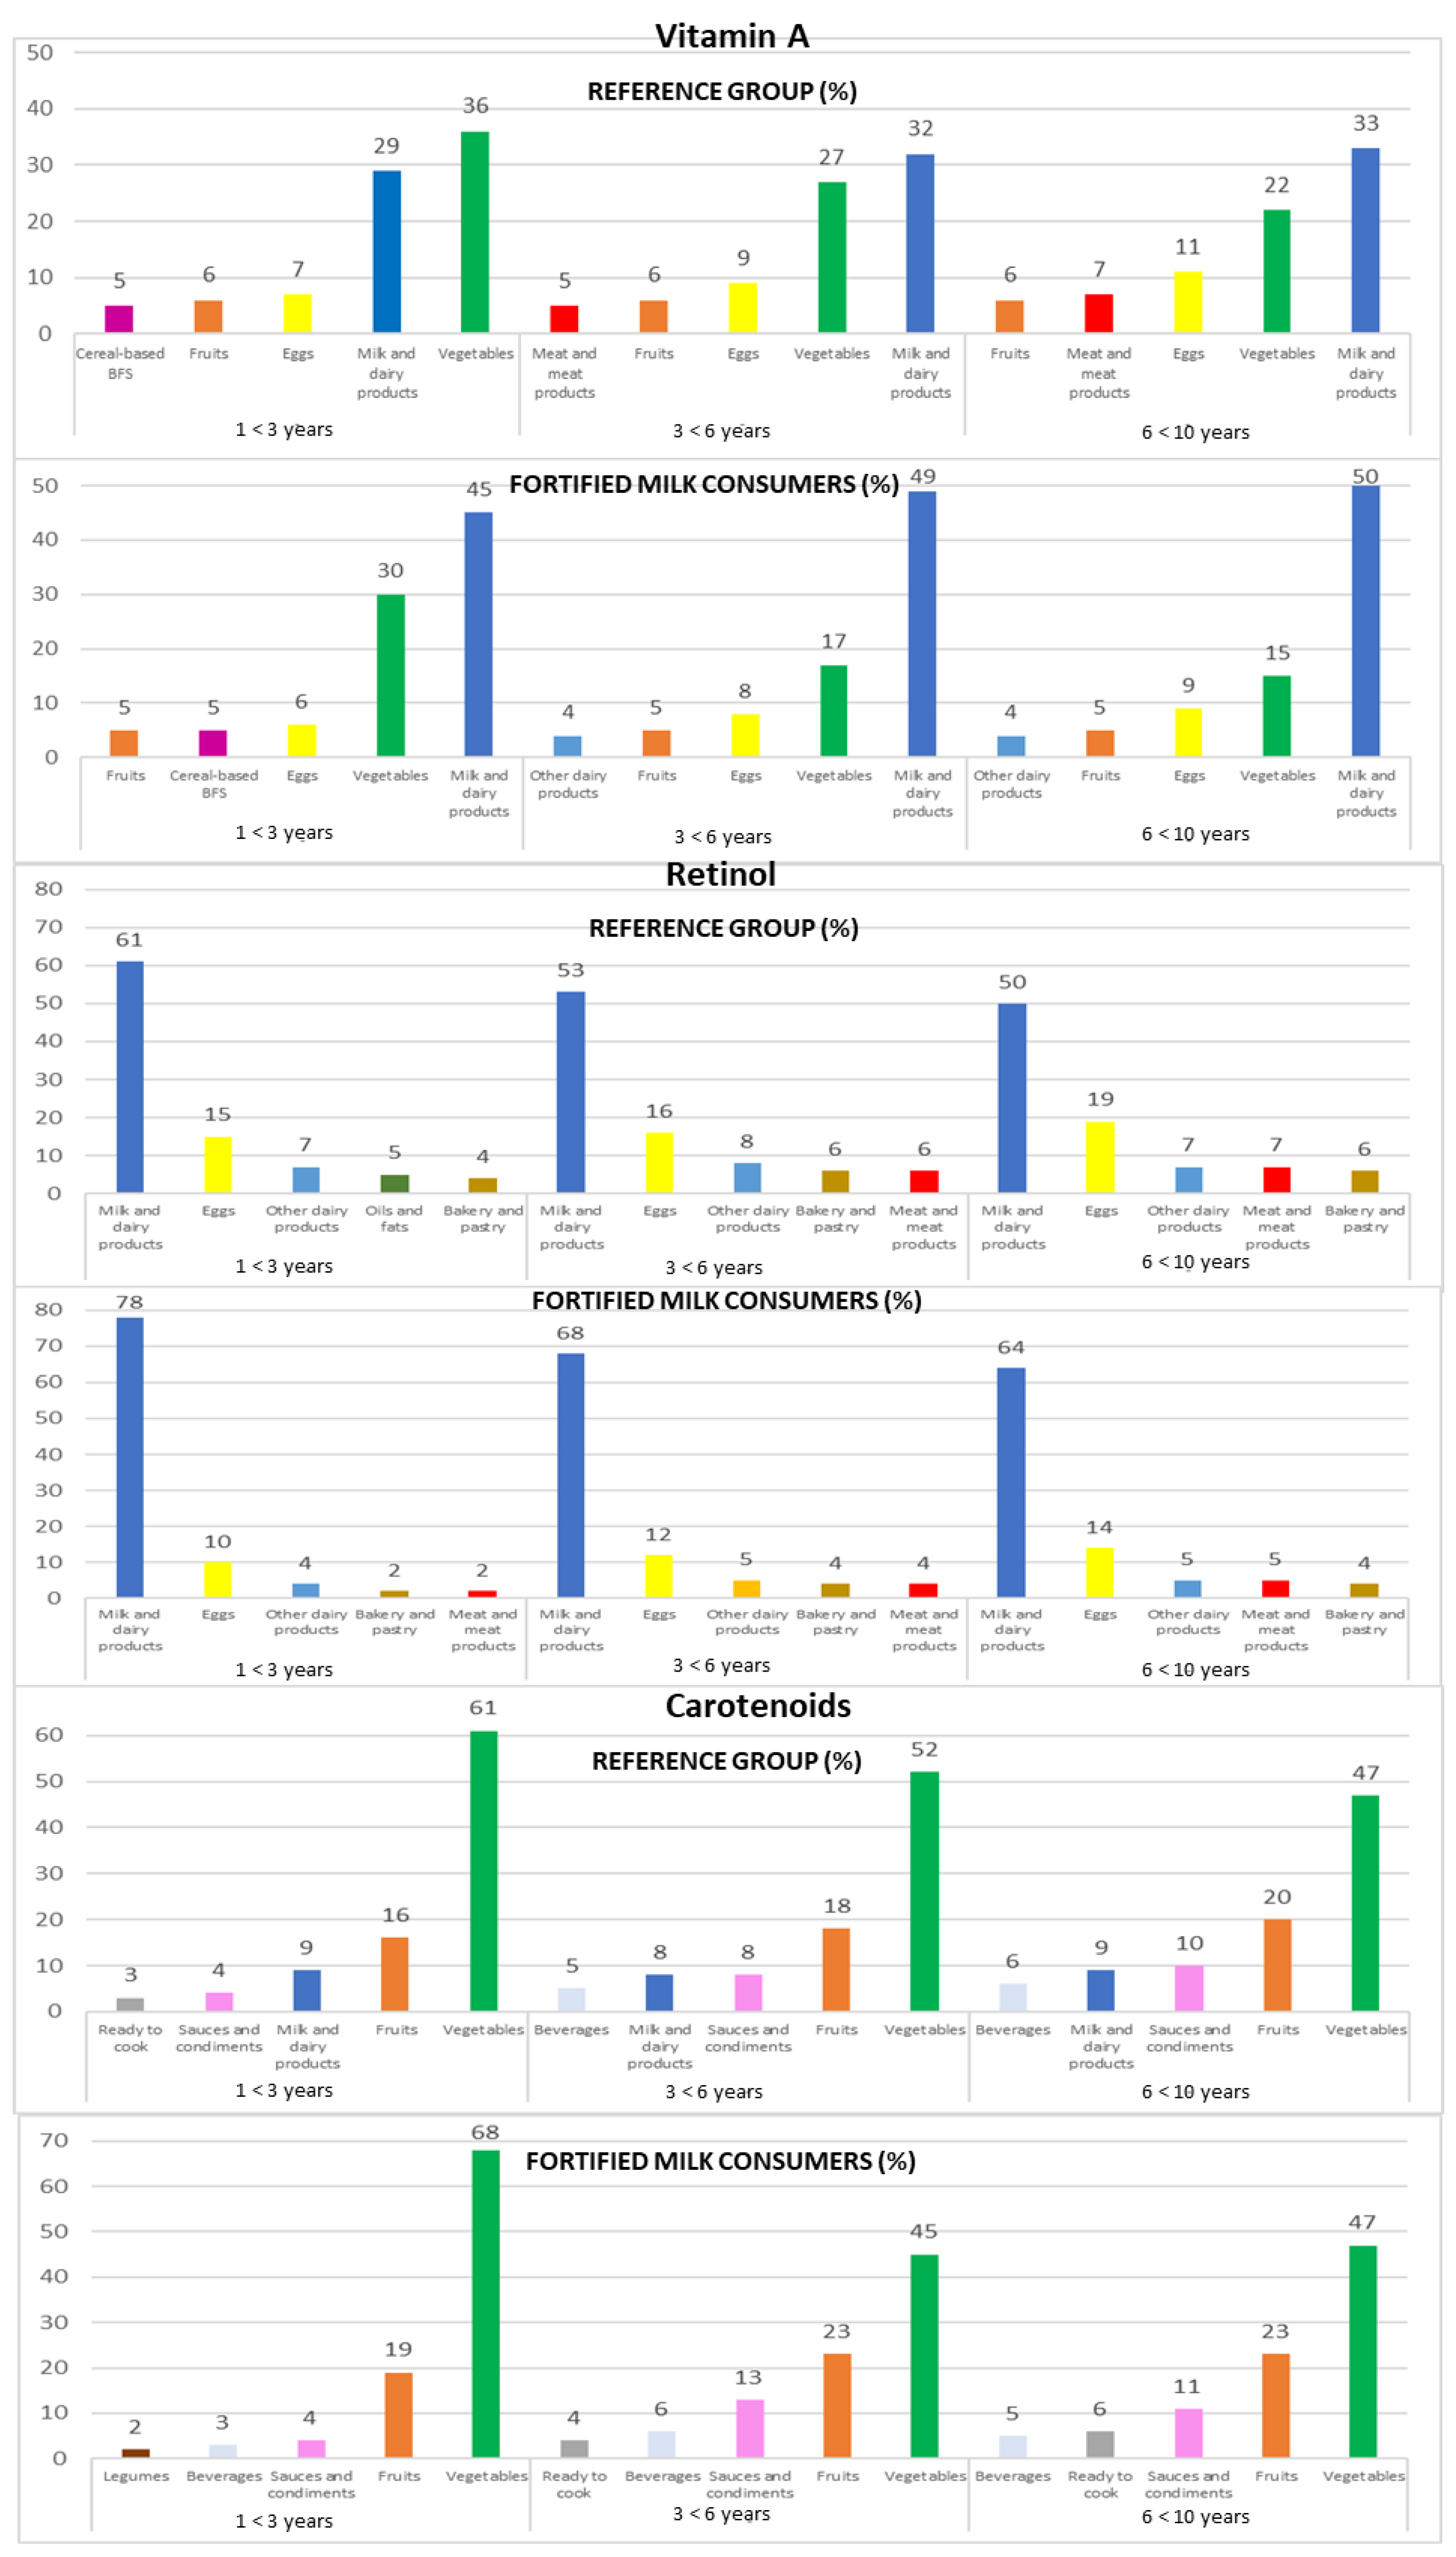
3.4.3. Vitamin A
3.4.4. Retinol
3.4.5. Carotenoids
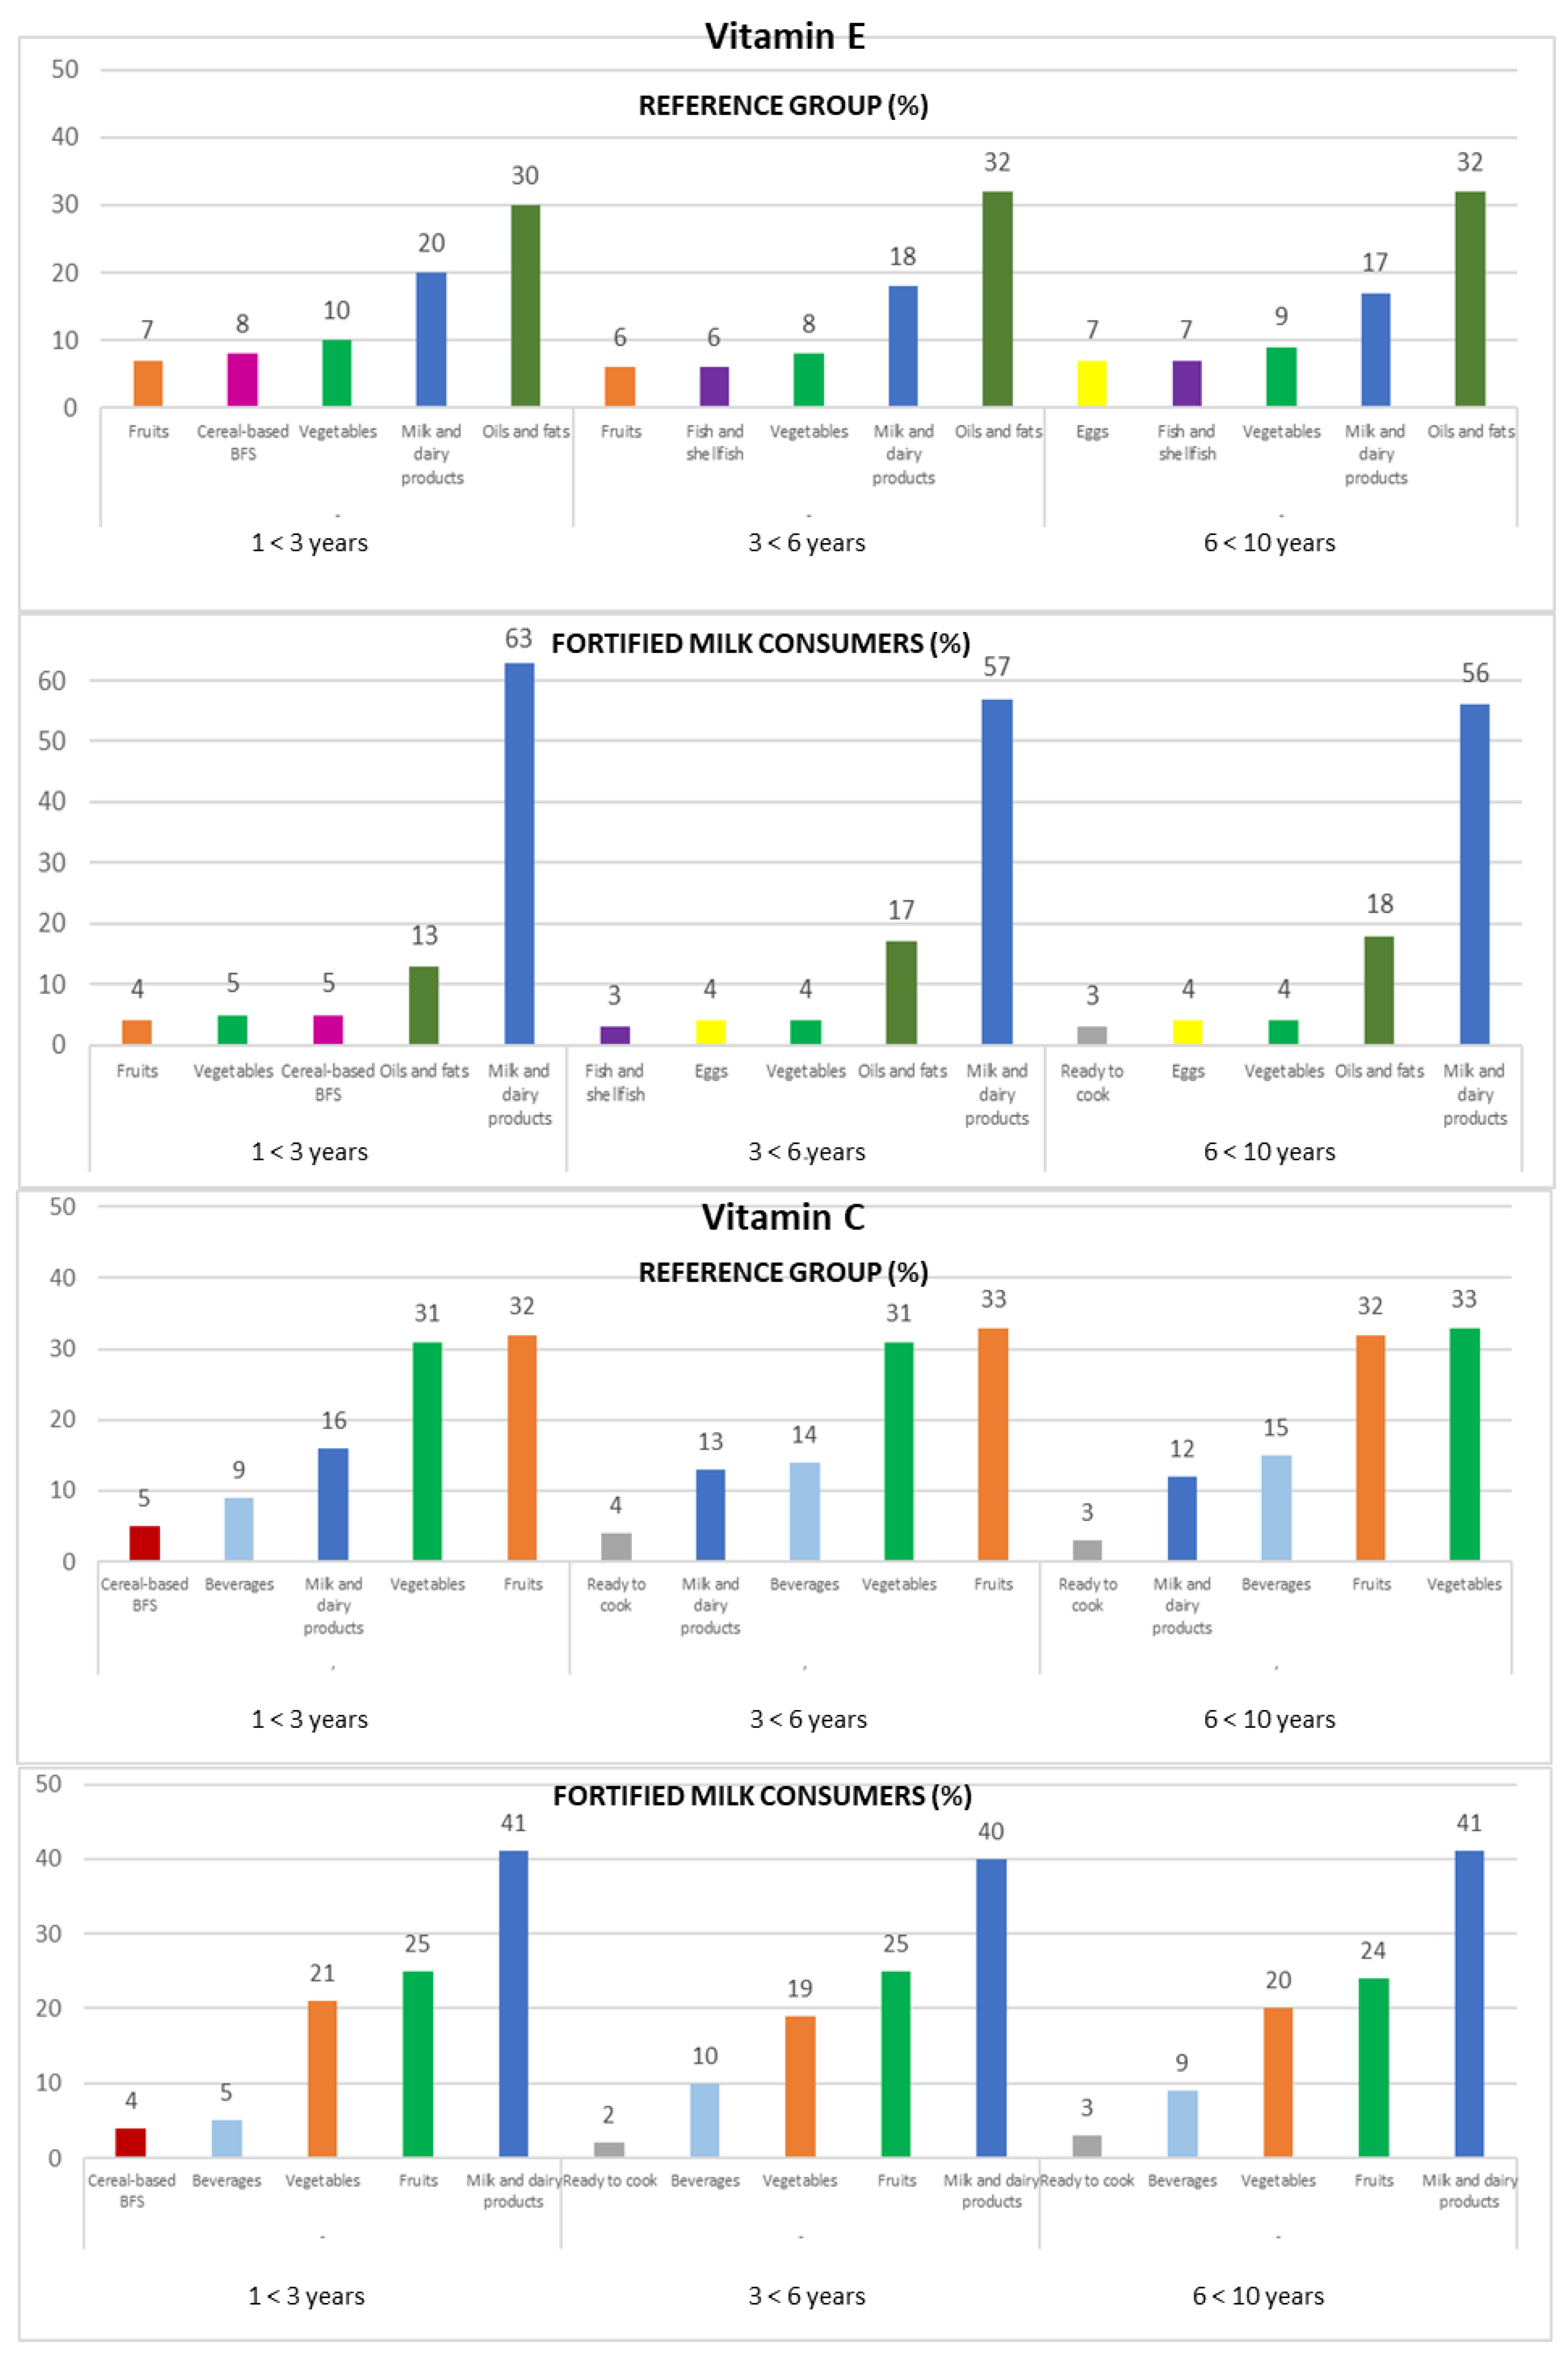
3.4.6. Vitamin C
3.4.7. Vitamin E
4. Discussion
Strengths and Limitations
5. Conclusions
Supplementary Materials
Author Contributions
Funding
Institutional Review Board Statement
Informed Consent Statement
Acknowledgments
Conflicts of Interest
References
- Guz-Mark, A.; Shamir, R. Growth in Chronic Diseases. World Rev. Nutr. Diet. 2022, 125, 125–137. [Google Scholar]
- Banna, J.; Bersamin, A. Community Involvement in Design, Implementation and Evaluation of Nutrition Interventions to Reduce Chronic Diseases in Indigenous Populations in the U.S.: A Systematic Review. Int. J. Equity Health 2018, 17, 116. [Google Scholar] [CrossRef] [PubMed]
- Carvalho, C.A.; Fonsêca, P.C.; Priore, S.E.; Sdo, C.F.; Novaes, J.F. Food Consumption and Nutritional Adequacy in Brazilian Children: A Systematic Review. Rev. Paul. Pediatr. 2015, 33, 211–221. [Google Scholar] [CrossRef]
- Hernández-Alcaraz, C.; Shamah-Levy, T.; Romero-Martínez, M.; Sepúlveda-Amor, J.; Aguilar-Salinas, C.A.; Rivera-Dommarco, J.; Kershenobich-Stalnikowitz, D.; Hernández-Ávila, M.; Barquera, S. Subsample for the Analysis of Chronic Diseases with Biomarkers, National Survey of Health and Nutrition 2016. Salud Publica Mex. 2020, 62, 504–510. [Google Scholar] [CrossRef]
- Eslami, O.; Khoshgoo, M.; Shidfar, F. Dietary Phytochemical Index and Overweight/Obesity in Children: A Cross-Sectional Study. BMC Res. Notes 2020, 13, 132. [Google Scholar] [CrossRef] [PubMed]
- Pérez-Torres, I.; Castrejón-Téllez, V.; Soto, M.E.; Rubio-Ruiz, M.E.; Manzano-Pech, L.; Guarner-Lans, V. Oxidative Stress, Plant Natural Antioxidants, and Obesity. Int. J. Mol. Sci. 2021, 22, 1786. [Google Scholar] [CrossRef] [PubMed]
- Tobore, T.O. Towards a Comprehensive Theory of Obesity and a Healthy Diet: The Causal Role of Oxidative Stress in Food Addiction and Obesity. Behav. Brain Res. 2020, 384, 112560. [Google Scholar] [CrossRef] [PubMed]
- Azizi-Soleiman, F.; Khoshhali, M.; Heidari-Beni, M.; Qorbani, M.; Kelishadi, R. Association between Dietary Antioxidant Quality Score and Anthropometric Measurements in Children and Adolescents: The Weight Disorders Survey of the CASPIAN-IV Study. J. Trop. Pediatr. 2021, 67, 1–7. [Google Scholar] [CrossRef] [PubMed]
- Lefranc, C.; Friederich-Persson, M.; Palacios-Ramirez, R.; Cat, A.N.D. Mitochondrial Oxidative Stress in Obesity: Role of the Mineralocorticoid Receptor. J. Endocrinol. 2018, 238, R143–R159. [Google Scholar] [CrossRef]
- Rahman, I.; Biswas, S.K.; Kode, A. Oxidant and Antioxidant Balance in the Airways and Airway Diseases. Eur. J. Pharmacol. 2006, 533, 222–239. [Google Scholar] [CrossRef]
- Kryston, T.B.; Georgiev, A.B.; Pissis, P.; Georgakilas, A.G. Role of Oxidative Stress and DNA Damage in Human Carcinogenesis. Mutat. Res. Fundam. Mol. Mech. Mutagen. 2011, 711, 193–201. [Google Scholar] [CrossRef] [PubMed]
- Barbosa, K.B.F.; Bressan, J.; Zulet, M.A.; Hernández, J.A.M. Influence of Dietary Intake on Plasma Biomarkers of Oxidative Stress in Humans. An. Sist. Sanit. Navar. 2008, 31, 259–280. [Google Scholar] [PubMed]
- Bjørklund, G.; Chirumbolo, S. Role of Oxidative Stress and Antioxidants in Daily Nutrition and Human Health. Nutrition 2017, 33, 311–321. [Google Scholar] [CrossRef] [PubMed]
- Jones, D.P. Radical-Free Biology of Oxidative Stress. Am. J. Physiol. Cell Physiol. 2008, 295, C849–C868. [Google Scholar] [CrossRef]
- Biobaku, F.; Ghanim, H.; Batra, M.; Dandona, P. Macronutrient-Mediated Inflammation and Oxidative Stress: Relevance to Insulin Resistance, Obesity, and Atherogenesis. J. Clin. Endocrinol. Metab. 2019, 104, 6118–6128. [Google Scholar] [CrossRef] [PubMed]
- Karam, B.S.; Chavez-Moreno, A.; Koh, W.; Akar, J.G.; Akar, F.G. Oxidative Stress and Inflammation as Central Mediators of Atrial Fibrillation in Obesity and Diabetes. Cardiovasc. Diabetol. 2017, 16, 120. [Google Scholar] [CrossRef] [PubMed]
- Powis, G.; Mustacich, D.; Coon, A. The Role of the Redox Protein Thioredoxin in Cell Growth and Cancer. Free Radic. Biol. Med. 2000, 29, 312–322. [Google Scholar] [CrossRef]
- Poljsak, B.; Šuput, D.; Milisav, I. Achieving the Balance between ROS and Antioxidants: When to Use the Synthetic Antioxidants. Oxid. Med. Cell. Longev. 2013, 2013, 956792. [Google Scholar] [CrossRef] [PubMed]
- Valko, M.; Leibfritz, D.; Moncol, J.; Cronin, M.T.D.; Mazur, M.; Telser, J. Free Radicals and Antioxidants in Normal Physiological Functions and Human Disease. Int. J. Biochem. Cell Biol. 2007, 39, 44–84. [Google Scholar] [CrossRef]
- Liu, Z.; Ren, Z.; Zhang, J.; Chuang, C.C.; Kandaswamy, E.; Zhou, T.; Zuo, L. Role of ROS and Nutritional Antioxidants in Human Diseases. Front. Physiol. 2018, 9, 477. [Google Scholar] [CrossRef] [PubMed]
- Nagel, G.; Linseisen, J.; van Gils, C.H.; Peeters, P.H.; Boutron-Ruault, M.C.; Clavel-Chapelon, F.; Romieu, I.; Tjønneland, A.; Olsen, A.; Roswall, N.; et al. Dietary β-Carotene, Vitamin C and E Intake and Breast Cancer Risk in the European Prospective Investigation into Cancer and Nutrition (EPIC). Breast Cancer Res. Treat. 2010, 119, 753–765. [Google Scholar] [CrossRef] [PubMed]
- Jiang, L.; Yang, K.; Tian, J.; Guan, Q.; Yao, N.; Cao, N.; Mi, D.; Wu, J.; Ma, B.; Yang, S. Efficacy of Antioxidant Vitamins and Selenium Supplement in Prostate Cancer Prevention: A Meta-Analysis of Randomized Controlled Trials. Nutr. Cancer 2010, 62, 719–727. [Google Scholar] [CrossRef] [PubMed]
- Carrión-García, C.J.; Guerra-Hernández, E.J.; García-Villanova, B.; Serafini, M.; Sánchez, M.-J.; Amiano, P.; Molina-Montes, E. Plasma Non-Enzymatic Antioxidant Capacity (NEAC) in Relation to Dietary NEAC, Nutrient Antioxidants and Inflammation-Related Biomarkers. Antioxidants 2020, 9, 301. [Google Scholar] [CrossRef] [PubMed]
- Dalmau, J.; Moráis, A.; Martínez, V.; Peña-Quintana, L.; Varea, V.; Martínez, M.J.; Soler, B. Evaluación de La Alimentación y Consumo de Nutrientes en Menores de 3 Años. Estudio Piloto ALSALMA. An. Pediatría 2014, 81, 22–31. [Google Scholar] [CrossRef] [PubMed]
- López-Sobaler, A.M.; Aparicio, A.; González-Rodríguez, L.G.; Cuadrado-Soto, E.; Rubio, J.; Marcos, V.; Sanchidrián, R.; Santos, S.; Pérez-Farinós, N.; Dal Re, M.Á.; et al. Adequacy of Usual Vitamin and Mineral Intake in Spanish Children and Adolescents: ENALIA Study. Nutrients 2017, 9, 131. [Google Scholar] [CrossRef] [PubMed]
- Olza, J.; Aranceta-Bartrina, J.; González-Gross, M.; Ortega, R.M.; Serra-Majem, L.; Varela-Moreiras, G.; Gil, Á. Reported Dietary Intake and Food Sources of Zinc, Selenium, and Vitamins a, e and c in the Spanish Population: Findings from the ANIBES Study. Nutrients 2017, 9, 697. [Google Scholar] [CrossRef] [PubMed]
- Bailey, A.D.L.; Fulgoni, V.L.; Shah, N.; Patterson, A.C.; Gutierrez-Orozco, F.; Mathews, R.S.; Walsh, K.R. Nutrient Intake Adequacy from Food and Beverage Intake of US Children Aged 1–6 Years from NHANES 2001–2016. Nutrients 2021, 13, 827. [Google Scholar] [CrossRef] [PubMed]
- Hilger, J.; Goerig, T.; Weber, P.; Hoeft, B.; Eggersdorfer, M.; Carvalho, N.C.; Goldberger, U.; Hoffmann, K. Micronutrient Intake in Healthy Toddlers: A Multinational Perspective. Nutrients 2015, 7, 6938–6955. [Google Scholar] [CrossRef] [PubMed]
- Tabacchi, G.; Wijnhoven, T.M.A.; Branca, F.; Román-Viñas, B.; Ribas-Barba, L.; Ngo, J.; García-Álvarez, A.; Serra-Majem, L. How is the Adequacy of Micronutrient Intake Assessed across Europe? A Systematic Literature Review. Br. J. Nutr. 2009, 101, S29–S36. [Google Scholar] [CrossRef] [PubMed]
- Hoeft, B.; Weber, P.; Eggersdorfer, M. Micronutrients—A Global Perspective on Intake, Health Benefits and Economics. Int. J. Vitam. Nutr. Res. 2012, 82, 316–320. [Google Scholar] [CrossRef]
- Royo-Bordonada, M.A.; Gorgojo, L.; Martín-Moreno, J.M.; Garcés, C.; Rodríguez-Artalejo, F.; Benavente, M.; Mangas, A.; de Oya, M. Spanish Children’s Diet: Compliance with Nutrient and Food Intake Guidelines. Eur. J. Clin. Nutr. 2003, 57, 930–939. [Google Scholar] [CrossRef]
- Hojsak, I.; Bronsky, J.; Campoy, C.; Domellöf, M.; Embleton, N.; Mis, N.F.; Hulst, J.; Indrio, F.; Lapillonne, A.; Mølgaard, C.; et al. Young Child Formula: A Position Paper by the ESPGHAN Committee on Nutrition. J. Pediatr. Gastroenterol. Nutr. 2018, 66, 177–185. [Google Scholar] [CrossRef]
- Lovell, A.L.; Davies, P.S.W.; Hill, R.J.; Milne, T.; Matsuyama, M.; Jiang, Y.; Chen, R.X.; Grant, C.C.; Wall, C.R. A Comparison of the Effect of a Growing Up Milk-Lite (GUMLi) v. Cows’ Milk on Longitudinal Dietary Patterns and Nutrient Intakes in Children Aged 12–23 Months: The GUMLi Randomised Controlled Trial. Br. J. Nutr. 2019, 121, 678–687. [Google Scholar] [CrossRef] [PubMed]
- European Food Safety Authority (EFSA). Dietary Reference Values for the European Union. Available online: https://multimedia.efsa.europa.eu/drvs/index.htm (accessed on 1 September 2020).
- Madrigal, C.; Soto-Méndez, M.J.; Hernández-Ruiz, Á.; Ruiz, E.; Valero, T.; Ávila, J.M.; Lara-Villoslada, F.; Leis, R.; de Victoria, E.M.; Moreno, J.M.; et al. Dietary and Lifestyle Patterns in the Spanish Pediatric Population (One to <10 Years Old): Design, Protocol, and Methodology of the EsNuPI Study. Nutrients 2019, 11, 3050. [Google Scholar] [CrossRef] [PubMed]
- Moreiras, O.; Carbajal, A.; Cabrera, L. Ingestas Diarias Recomendadas de Energía y Nutrientes Para La Población Española. Tablas de Composición de Alimentos, 19th ed.; Anaya, S.G., Ed.; Ediciones Pirámide: Madrid, Spain, 2018. [Google Scholar]
- Ruiz-López, M.D.; de Martínez Victoria, E.; Gil, A. Guía Fotográfica de Porciones de Alimentos Consumidos En España; Fundación Iberoamericana de Nutrición, Ed.; FINUT: Granada, Spain, 2019. [Google Scholar]
- Fundación Española de la Nutrición. (FEN). Software VD-FEN 2.1 Programa de Valoración Dietética de La FEN; FEN: Madrid, Spain, 2013. [Google Scholar]
- Nusser, S.M.; Carriquiry, A.L.; Dodd, K.W.; Fuller, W.A. A Semiparametric Transformation Approach to Estimating Usual Daily Intake Distributions. J. Am. Stat. Assoc. 1996, 91, 1440–1449. [Google Scholar] [CrossRef]
- Camargo, D.M.; Santisteban, S.; Paredes, E.; Flórez, M.A.; Bueno, D. Confiabilidad de Un Cuestionario Para Medir La Actividad Física y Los Comportamientos Sedentarios En Niños Desde Preescolar Hasta Cuarto Grado de Primaria. Biomedica 2015, 35, 347–356. [Google Scholar] [CrossRef] [PubMed]
- Goldberg, G.R.; Black, A.E.; Jebb, S.A.; Cole, T.J.; Murgatroyd, P.R.; Coward, W.A.; Prentice, A.M. Critical Evaluation of Energy Intake Data Using Fundamental Principles of Energy Physiology: 1. Derivation of Cut-off Limits to Identify under-Recording. Eur. J. Clin. Nutr. 1991, 45, 569–581. [Google Scholar]
- Madrigal, C.; Soto-Méndez, M.J.; Hernández-Ruiz, Á.; Valero, T.; Ávila, J.M.; Ruiz, E.; Villoslada, F.L.; Leis, R.; de Victoria, E.M.; Moreno, J.M.; et al. Energy Intake, Macronutrient Profile and Food Sources of Spanish Children Aged One to <10 Years—Results from the EsNuPI Study. Nutrients 2020, 12, 893. [Google Scholar] [CrossRef]
- European Food Safety Authority (EFSA). Example of a Protocol for Identification of Misreporting (under- and Overreporting of Energy Intake) Based on the PILOT-PANEU Project. Available online: https://www.efsa.europa.eu/sites/default/files/efsa_rep/blobserver_assets/3944A-8-2-1.pdf (accessed on 20 January 2022).
- Samaniego-Vaesken, M.D.L.; Partearroyo, T.; Valero, T.; Rodriguez, P.; Soto-Méndez, M.J.; Hernández-Ruiz, Á.; Lara Villoslada, F.; Leis, R.; de Victoria, E.M.; Moreno, J.M.; et al. Carbohydrates, Starch, Total Sugar, Fiber Intakes and Food Sources in Spanish Children Aged One to <10 Years—Results from the EsNuPI Study. Nutrients 2020, 12, 3171. [Google Scholar] [CrossRef]
- Plaza-Díaz, J.; Molina-Montes, E.; Soto-Méndez, M.J.; Madrigal, C.; Hernández-Ruiz, Á.; Valero, T.; Villoslada, F.L.; Leis, R.; de Victoria, E.M.; Moreno, J.M.; et al. Clustering of Dietary Patterns and Lifestyles Among Spanish Children in the EsNuPI Study (†). Nutrients 2020, 12, 2536. [Google Scholar] [CrossRef]
- Sales, C.; Fontanelli, M.; Vieira, D.; Marchioni, D.; Fisberg, R. Inadequate Dietary Intake of Minerals: Prevalence and Association with Socio-Demographic and Lifestyle Factors. Br. J. Nutr. 2017, 117, 267–277. [Google Scholar] [CrossRef] [PubMed]
- Guerendiain, M.; Mayneris-Perxachs, J.; Montes, R.; López-Belmonte, G.; Martín-Matillas, M.; Castellote, A.I.; Martín-Bautista, E.; Martí, A.; Martínez, J.A.; Moreno, L.; et al. Relation between Plasma Antioxidant Vitamin Levels, Adiposity and Cardio-Metabolic Profile in Adolescents: Effects of a Multidisciplinary Obesity Programme. Clin. Nutr. 2017, 36, 209–217. [Google Scholar] [CrossRef] [PubMed]
- Hess, S.Y. National Risk of Zinc Deficiency as Estimated by National Surveys. Food Nutr. Bull. 2017, 38, 3–17. [Google Scholar] [CrossRef] [PubMed]
- Ghisolfi, J.; Fantino, M.; Turck, D.; de Courcy, G.P.; Vidailhet, M. Nutrient Intakes of Children Aged 1-2 Years as a Function of Milk Consumption, Cows’ Milk or Growing-up Milk. Public Health Nutr. 2013, 16, 524–534. [Google Scholar] [CrossRef] [PubMed]
- Rangan, A.M.; Samman, S. Zinc Intake and Its Dietary Sources: Results of the 2007 Australian National Children’s Nutrition and Physical Activity Survey. Nutrients 2012, 4, 611–624. [Google Scholar] [CrossRef]
- Navia, B.; Ortega, R.M.; Perea, J.M.; Aparicio, A.; López-Sobaler, A.M.; Rodríguez-Rodríguez, E. Selenium Status in a Group of Schoolchildren from the Region of Madrid, Spain. J. Hum. Nutr. Diet. 2014, 27, 239–246. [Google Scholar] [CrossRef]
- Stoffaneller, R.; Morse, N.L. A Review of Dietary Selenium Intake and Selenium Status in Europe and the Middle East. Nutrients 2015, 7, 1494–1537. [Google Scholar] [CrossRef] [PubMed]
- Wei, X.; Peng, R.; Cao, J.; Kang, Y.; Qu, P.; Liu, Y.; Xiao, X.; Li, T. Serum Vitamin A Status Is Associated with Obesity and the Metabolic Syndrome among School-Age Children in Chongqing, China. Asia Pac. J. Clin. Nutr. 2016, 25, 563–570. [Google Scholar] [CrossRef] [PubMed]
- Mitsopoulou, A.V.; Magriplis, E.; Dimakopoulos, I.; Karageorgou, D.; Bakogianni, I.; Chourdakis, M.; Ntouroupi, T.; Tsaniklidou, S.M.; Argyri, K.; Panagiotakos, D.B.; et al. Micronutrient Intakes and Their Food Sources among Greek Children and Adolescents. Public Health Nutr. 2020, 23, 2314–2326. [Google Scholar] [CrossRef] [PubMed]
- Zaragoza-Jordana, M.; Closa-Monasterolo, R.; Luque, V.; Ferré, N.; Grote, V.; Koletzko, B.; Pawellek, I.; Verduci, E.; ReDionigi, A.; Socha, J.; et al. Micronutrient Intake Adequacy in Children from Birth to 8 Years. Data from the Childhood Obesity Project. Clin. Nutr. 2018, 37, 630–637. [Google Scholar] [CrossRef] [PubMed]
- European Food Safety Authority. Scientific Opinion on Dietary Reference Values for Vitamin A. EFSA J. 2015, 13, 4028. [Google Scholar] [CrossRef]
- Chouraqui, J.P.; Tavoularis, G.; Turck, D.; Ferry, C.; Feillet, F. Mineral and Vitamin Intake of Infants and Young Children: The Nutri-Bébé 2013 Survey. Eur. J. Nutr. 2020, 59, 2463–2480. [Google Scholar] [CrossRef] [PubMed]
- Tveden-Nyborg, P.; Lykkesfeldt, J. Does Vitamin C Deficiency Result in Impaired Brain Development in Infants? Redox Rep. 2009, 14, 2–6. [Google Scholar] [CrossRef]
- Arrigoni, O.; de Tullio, M.C. Ascorbic Acid: Much More than Just an Antioxidant. Biochim. Biophys. Acta BBA Gen. Subj. 2002, 1569, 1–9. [Google Scholar] [CrossRef]
- Schleicher, R.L.; Carroll, M.D.; Ford, E.S.; Lacher, D.A. Serum Vitamin C and the Prevalence of Vitamin C Deficiency in the United States: 2003–2004 National Health and Nutrition Examination Survey (NHANES). Am. J. Clin. Nutr. 2009, 90, 1252–1263. [Google Scholar] [CrossRef]
- Mosdol, A.; Erens, B.; Brunner, E.J. Estimated Prevalence and Predictors of Vitamin C Deficiency within UK’s Low-Income Population. J. Public Health 2008, 30, 456–460. [Google Scholar] [CrossRef]
- Langlois, K.; Cooper, M.; Colapinto, C.K. Vitamin C Status of Canadian Adults: Findings from the 2012/2013 Canadian Health Measures Survey. Health Rep. 2016, 27, 3–10. [Google Scholar] [PubMed]
- Morales-Suarez-Varela, M.; Peraita-Costa, I.; Llopis-Morales, A.; Picó, Y.; Bes-Rastrollo, M.; Llopis-Gonzalez, A. Total Sugar Intake and Macro and Micronutrients in Children Aged 6–8 Years: The ANIVA Study. Nutrients 2020, 12, 349. [Google Scholar] [CrossRef]
- Jordão, K.S.L.U.; Assumpção, D.; Barros, M.B.A.; Filho, A.A.B. Vitamin e Intake and Food Sources in Adolescent Diet: A Cross-Sectional Population-Based Study TT-Consumo de Vitamina e e Fontes Alimentares Na Dieta de Adolescentes: Um Estudo Transversal de Base Populacional. Rev. Paul. Pediatr. 2021, 39, e2019295. [Google Scholar] [CrossRef]
- Castiglione, D.; Platania, A.; Conti, A.; Falla, M.; D’Urso, M.; Marranzano, M. Dietary Micronutrient and Mineral Intake in the Mediterranean Healthy Eating, Ageing, and Lifestyle (MEAL) Study. Antioxidants 2018, 7, 79. [Google Scholar] [CrossRef] [PubMed]
- Man, A.W.C.; Li, H.; Xia, N. Impact of Lifestyles (Diet and Exercise) on Vascular Health: Oxidative Stress and Endothelial Function. Oxid. Med. Cell. Longev. 2020, 2020, 1496462. [Google Scholar] [CrossRef] [PubMed]
- Pisoschi, A.M.; Pop, A.; Iordache, F.; Stanca, L.; Predoi, G.; Serban, A.I. Oxidative Stress Mitigation by Antioxidants—An Overview on Their Chemistry and Influences on Health Status. Eur. J. Med. Chem. 2021, 209, 112891. [Google Scholar] [CrossRef]
- Sánchez-Rodríguez, M.A.; Mendoza-Núñez, V.M. Oxidative Stress Indexes for Diagnosis of Health or Disease in Humans. Oxid. Med. Cell. Longev. 2019, 2019, 1–32. [Google Scholar] [CrossRef]
- Murer, S.B.; Aeberli, I.; Braegger, C.P.; Gittermann, M.; Hersberger, M.; Leonard, S.W.; Taylor, A.W.; Traber, M.G.; Zimmermann, M.B. Antioxidant Supplements Reduced Oxidative Stress and Stabilized Liver Function Tests but Did Not Reduce Inflammation in a Randomized Controlled Trial in Obese Children and Adolescents. J. Nutr. 2014, 144, 193–201. [Google Scholar] [CrossRef] [PubMed]
- Petek, T.H.; Petek, T.; Močnik, M.; Varda, N.M. Systemic Inflammation, Oxidative Stress and Cardiovascular Health in Children and Adolescents: A Systematic Review. Antioxidants 2022, 11, 894. [Google Scholar] [CrossRef]
- Mason, S.A.; Wadley, G.D.; Keske, M.A.; Parker, L. Effect of Mitochondrial-targeted Antioxidants on Glycaemic Control, Cardiovascular Health, and Oxidative Stress in Humans: A Systematic Review and Meta-analysis of Randomized Controlled Trials. Diabetes Obes. Metab. 2022, 24, 1047–1060. [Google Scholar] [CrossRef]
- Gajewska, J.; Ambroszkiewicz, J.; Szamotulska, K.; Klemarczyk, W.; Weker, H.; Chełchowska, M. Associations between Antioxidant Vitamin Status, Dietary Intake, and Retinol-Binding Protein 4 Levels in Prepubertal Obese Children after 3-Month Weight Loss Therapy. JCRPE J. Clin. Res. Pediatr. Endocrinol. 2021, 13, 187–197. [Google Scholar] [CrossRef]
- Lechuga-Sancho, A.M.; Gallego-Andujar, D.; Ruiz-Ocaña, P.; Visiedo, F.M.; Saez-Benito, A.; Schwarz, M.; Segundo, C.; Mateos, R.M. Obesity Induced Alterations in Redox Homeostasis and Oxidative Stress Are Present from an Early Age. PLoS ONE 2018, 13, e0191547. [Google Scholar] [CrossRef] [PubMed]
- Faienza, M.F.; Francavilla, R.; Goffredo, R.; Ventura, A.; Marzano, F.; Panzarino, G.; Marinelli, G.; Cavallo, L.; di Bitonto, G. Oxidative Stress in Obesity and Metabolic Syndrome in Children and Adolescents. Horm. Res. Paediatr. 2012, 78, 158–164. [Google Scholar] [CrossRef] [PubMed]
- Vergara, D.; Scoditti, E.; Aziz, A.A.; Giudetti, A.M. Editorial: Dietary Antioxidants and Metabolic Diseases. Front. Nutr. 2021, 8, 9358–9371. [Google Scholar] [CrossRef]
- Manach, C.; Donovan, J.L. Invited Review. Free Radic. Res. 2004, 38, 771–785. [Google Scholar] [CrossRef]
- Pietta, P.-G. Flavonoids as Antioxidants. J. Nat. Prod. 2000, 63, 1035–1042. [Google Scholar] [CrossRef] [PubMed]
- Dinkova-Kostova, A.T.; Kostov, R.V. Glucosinolates and Isothiocyanates in Health and Disease. Trends Mol. Med. 2012, 18, 337–347. [Google Scholar] [CrossRef] [PubMed]
- Heber, D.; Lu, Q.-Y. Overview of Mechanisms of Action of Lycopene. Exp. Biol. Med. 2002, 227, 920–923. [Google Scholar] [CrossRef] [PubMed]
- Trujillo-Mayol, I.; Guerra-Valle, M.; Casas-Forero, N.; Sobral, M.M.C.; Viegas, O.; Alarcón-Enos, J.; Ferreira, I.M.; Pinho, O. Western Dietary Pattern Antioxidant Intakes and Oxidative Stress: Importance during the SARS-CoV-2/COVID-19 Pandemic. Adv. Nutr. 2021, 12, 670–681. [Google Scholar] [CrossRef] [PubMed]
- Hernández-Ruiz, A.; García-Villanova, B.; Hernández, E.J.G.; Amiano, P.; Azpiri, M.; Molina-Montes, E. Description of indexes based on the adherence to the mediterranean dietary pattern: A Review. Nutr. Hosp. 2015, 32, 18721884. [Google Scholar]
- Hernández-Ruiz, A.; García-Villanova, B.; Guerra-Hernández, E.; Amiano, P.; Sánchez, M.-J.; Dorronsoro, M.; Molina-Montes, E. Comparison of the Dietary Antioxidant Profiles of 21 a Priori Defined Mediterranean Diet Indexes. J. Acad. Nutr. Diet. 2018, 118, 2254–2268.e8. [Google Scholar] [CrossRef] [PubMed]
- Li, T.; You, J.; Pean, J.; Lluch, A.; Eussen, S.; Delaere, F.; Bindels, J.G.; Dai, Y. The Contribution of Milks and Formulae to Micronutrient Intake in 1–3 Years Old Children in Urban China: A Simulation Study. Asia Pac. J. Clin. Nutr. 2019, 28, 558–566. [Google Scholar] [CrossRef]
- Walton, J.; Flynn, A. Nutritional Adequacy of Diets Containing Growing up Milks or Unfortified Cow’s Milk in Irish Children (Aged 12–24 Months). Food Nutr. Res. 2013, 57, 21836. [Google Scholar] [CrossRef] [PubMed]
- Zhang, J.; Wang, D.; Zhang, Y. Patterns of the Consumption of Young Children Formula in Chinese Children Aged 1–3 Years and Implications for Nutrient Intake. Nutrients 2020, 12, 1672. [Google Scholar] [CrossRef]
- Mak, T.N.; Angeles-Agdeppa, I.; Tassy, M.; Capanzana, M.V.; Offord, E.A. Contribution of Milk Beverages to Nutrient Adequacy of Young Children and Preschool Children in the Philippines. Nutrients 2020, 12, 392. [Google Scholar] [CrossRef] [PubMed]


| Reference Group (REF) | Fortified Milk Consumers (FMCs) | ||||||
|---|---|---|---|---|---|---|---|
| Total | Boys | Girls | Total | Boys | Girls | ||
| n = 707 | n = 357 | n = 350 | n = 741 | n = 371 | n = 370 | ||
| Age, mean ± SD (years) | 1 to <3 years | 1.52 ± 0.50 | 1.60 ± 0.49 | 1.44 ± 0.50 | 1.46 ± 0.50 | 1.44 ± 0.50 | 1.48 ± 0.50 |
| 3 to <6 years | 3.87 ± 0.82 | 3.85 ± 0.82 | 3.89 ± 0.83 | 3.79 ± 0.82 | 3.81 ± 0.83 | 3.76 ± 0.82 | |
| 6 to <10 years | 7.60 ± 1.12 | 7.55 ± 1.11 | 7.66 ± 1.12 | 7.57 ± 1.10 | 7.61 ± 1.11 | 7.53 ± 1.09 | |
| 1 to <3 years | 162 (22.9) * | 84 (23.5) * | 78 (22.3) * | 294 (39.7) * | 144 (38.8) * | 150 (40.5) * | |
| Age group, n (%) | 3 to <6 years | 244 (34.5) * | 122 (34.2) * | 122 (34.9) * | 262 (35.4) * | 128 (34.5) * | 134 (36.2) * |
| 6 to <10 years | 301 (42.6) * | 151 (42.3) * | 150 (42.9) * | 185 (25) * | 99 (26.7) * | 86 (23.2) * | |
| Anthropometric characteristics, median (IQR) | Z-BMI/Age | 0.6 (−0.3–1.5) | 0.6 (−0.3–1.5) | 0.6 (−0.3–1.4) | 0.5 (−0.3–(−1.4) | 0.45 (−0.3–1.4) | 0.5 (−0.3–1.4) |
| Z-Weight/Age | 0.5 (−0.3–1.2) | 0.4 (−0.4–1.2) | 0.6 (−0.3–1.3) | 0.6 (−0.3–1.4) | 0.6 (−0.1–1.4) | 0.5 (−0.3–1.4) | |
| Z-Height/Age | −0.3 (−1.2–(−0.9)) | −0.2 (−1.1–1.0) | −0.4 (−1.3–0.7) | −0.4 ** (−1.4–0.6) | −0.4 ** (−1.4–0.6) | −0.4 (−1.5–0.6) | |
| PAL, median (IQR) | 1 to <3 years | 1.6 (1.3–1.8) | 1.6 (1.4–1.8) | 1.5 (1.3–1.8) | 1.5(1.3–1.7) | 1.5 (1.3–1.8) | 1.5(1.3–1.7) |
| 3 to <6 years | 1.6 (1.4–1.7) | 1.6 (1.4–1.7) | 1.5 (1.4–1.7) | 1.5 (1.4–1.7) | 1.5(1.4–1.7) | 1.5(1.4–1.7) | |
| 6 to <10 years | 1.6 (1.4–1.7) | 1.6 (1.4–1.8) | 1.6 (1.5–1.7) | 1.6 (1.5–1.7) | 1.6(1.5–1.8) | 1.6(1.5–1.7) | |
| Size of the municipality, n (%) | 50.001 a 300.000 people | 376 (53.2) | 193 (54.1) | 183 (52.3) | 406 (54.8) | 204 (55.0) | 202 (54.6) |
| >300.000 people | 331 (46.8) | 164 (45.9) | 167 (47.7) | 335 (45.2) | 167 (45.0) | 168 (45.4) | |
| Highest level of education achieved by one of the parents, n (%) | ≤10 years of education | 23 (3.3) | 10 (2.9) | 13 (3.8) | 14 (1.9) | 7 (1.9) | 7 (1.9) |
| Secondary education | 416 (60.5) | 219 (62.9) | 197 (57.9) | 414 (57.0) | 208 (57.5) | 206 (56.6) | |
| University studies | 249 (36.2) | 119 (34.2) | 130 (38.2) | 298 (41.0) | 147 (40.6) | 151 (41.5) | |
| Family income, n (%) | Low (<1500 EUR) | 171 (24.2) | 79 (22.1) | 92 (26.3) | 163 (22.0) | 84 (22.6) | 79 (21.4) |
| Medium (1501 to 2000 EUR) | 126 (17.8) | 67 (18.8) | 59 (16.9) | 134 (18.1) | 64 (17.3) | 70 (18.9) | |
| High (>2000 EUR) | 226 (32.0) | 123 (34.5) | 103 (29.4) | 238 (32.1) | 110 (29.6) | 128 (34.6) | |
| No answer/doesn’t know | 184 (26.0) | 88 (24.6) | 96 (27.4) | 206 (27.8) | 113 (30.5) | 93 (25.1) | |
| Number of feeding bottles or glasses of milk per day, n (%) | Less than 2 | 222 (32.9) | 110 (32.0) | 115 (33.8) | 178 (24.1) | 92 (24.9) | 86 (23.3) |
| 2 o more | 459 (67.1) | 234 (68.0) | 225 (66.2) | 561 (75.9) | 278 (75.1) | 283 (76.7) | |
| Reference Group (REF) | |||||||
| 1 to <3 Years n = 162 | 3 to <6 Years n = 244 | 6 to <10 Years n = 301 | |||||
| Median | IQR | Median | IQR | Median | IQR | p | |
| Zinc (mg/day) | 5.1 a | 2.1 | 6.9 b | 1.7 | 7.9 c | 2.8 | <0.001 |
| Selenium (µg/kg) | 38 a | 27 | 58 b | 19 | 70 c | 21 | <0.001 |
| Vitamin A (µg/day) ~ | 495 | 401 | 499 | 400 | 450 | 391 | 0.473 |
| Retinol (µg RE/day) ~ | 202 a | 166 | 238 b | 184 | 242 b | 233 | <0.001 |
| Carotenoids (µg/day) ~ | 1383 a | 2000 | 1106 a | 1541 | 743 b | 1304 | <0.001 |
| Vitamin C (mg/day) | 78 a | 44 | 69 b | 33 | 71 ab | 42 | 0.021 |
| Vitamin E (mg/day) | 3.9 a | 2.4 | 4.7 b | 2.4 | 4.7 b | 2.6 | 0.002 |
| Fortified Milk Consumers (FMCs) | |||||||
| 1 to <3 years n = 162 | 3 to <6 years n = 244 | 6 to <10 years n = 301 | |||||
| Median | IQR | Median | IQR | Median | IQR | p | |
| Zinc (mg/day) | 6.5 a* | 2.1 | 8.6 b* | 3.1 | 10.9 c* | 5.0 | <0.001 |
| Selenium (µg/kg) | 37 a | 20 | 54 b* | 15 | 67 c* | 20 | <0.001 |
| Vitamin A (µg/day) ~ | 693 * | 360 | 596 * | 359 | 605 * | 327 | 0.473 |
| Retinol (µg RE/day) ~ | 368 a* | 179 | 372 b* | 198 | 410 b* | 284 | <0.001 |
| Carotenoids (µg/day) ~ | 1492 a | 1879 | 666 a* | 1384 | 763 b | 1049 | <0.001 |
| Vitamin C (mg/day) | 119 a* | 33 | 107 b* | 49 | 110 ab* | 56 | 0.021 |
| Vitamin E (mg/day) | 8.4 a* | 2.8 | 8.9 b* | 3.5 | 9.6 b* | 3.9 | <0.001 |
| Reference Group (REF) | ||||||||||
| 1 to <3 Years n = 162 | 3 to <6 Years n = 244 | 6 to <10 Years n = 301 | ||||||||
| % <AR | % >AR | % >UL | % <AR | % >AR | % >UL | % <AR | % >AR | % >UL | p | |
| Zinc | 14.8 | 72.2 | 13.0 | 1.2 | 82.0 | 16.8 | 14.6 | 81.7 | 3.7 | <0.001 |
| Selenium | 5.6 | 80.9 a | 13.6 | 0 | 79.1 a | 20.9 | 0.3 | 97.0 b | 2.7 | <0.001 |
| Vitamin A | 10.5 | 68.5 | 21.0 | 10.2 | 75.4 | 14.3 | 22.9 | 69.4 | 7.6 | <0.001 |
| Vitamin C | 1.2 | 98.8 a | 0 | 0.0 | 100 a | 0 | 7.0 | 93.0 b | 0 | <0.001 |
| Vitamin E | 79.6 | 20.4 a | 0 | 97.1 | 2.9 b | 0 | 95.0 | 5.0 b | 0 | <0.001 |
| Fortified Milk Consumers (FMCs) | ||||||||||
| 1 to <3 years n = 294 | 3 to <6 years n = 262 | 6 to <10 years n = 185 | ||||||||
| % <AR | % >AR | % >UL | % <AR | % >AR | % >UL | % <AR | % >AR | % >UL | p | |
| Zinc | 0.7 * | 63.9 a | 35.4 * | 1.1 | 43.5 *b | 55.3 * | 4.3 * | 57.8 *a | 37.8 * | <0.001 |
| Selenium | 3.4 | 87.4 a | 9.2 | 0 | 90.1 *a | 9.9 * | 0.5 | 97.3 b | 2.2 | <0.001 |
| Vitamin A | 0.7 * | 65.3 a | 34.0 * | 2.3 * | 81.7 b | 16.0 | 10.8 * | 83.8 *b | 5.4 | <0.001 |
| Vitamin C | 0.0 | 100 | 0 | 0.0 | 100 | 0 | 0.5 * | 99.5 * | 0 | 0.000 |
| Vitamin E | 9.2 * | 90.8 *a | 0 * | 53.8 * | 46.2 *b | 0 | 42.7 * | 57.3 *b | 0 | <0.001 |
| Reference Group (REF) | Fortified Milk Consumers (FMCs) | |||||||
|---|---|---|---|---|---|---|---|---|
| Total n = 687 | Total n = 726 | |||||||
| (g/day) | Mean | β | CI (95%) | p | Mean | β | CI (95%) | p |
| Zinc | 6.9294 | 8.4380 | ||||||
| Geographical area | −0.053 | (−0.130)–0.024 | 0.003 * | 0.021 | (−0.078)–0.120 | 0.675 | ||
| Family income | 0.087 | (−0.091)–0.266 | 0.001 * | −0.004 | (−0.240)–0.232 | 0.973 | ||
| Higher level of parents’ education | 0.012 | (−0.124)–0.147 | 0.000 * | −0.010 | (−0.190)–0.169 | 0.908 | ||
| Selenium | 58.9901 | 51.5507 | ||||||
| Geographical area | −1.235 | (−2.066)–(−0.404) | 0.004 * | −0.496 | (−1.245)–0.252 | 0.193 | ||
| Family income | 1.412 | (−0.511)–3.334 | 0.003 * | 1.428 | (−0.357)–3.212 | 0.117 | ||
| Higher level of parents’ education | 0.147 | (−1.315)–1.609 | 0.000 * | −0.786 | (−2.142)–0.570 | 0.256 | ||
| Vitamin A | 625.8606 | 719.4928 | ||||||
| Geographical area | −6.088 | (−23.872)–11.696 | 0.502 | −0.607 | (−14.012)–12.798 | 0.929 | ||
| Family income | 14.509 | (−26.639)–55.656 | 0.489 | 3.467 | (−28.493)–35.427 | 0.831 | ||
| Higher level of parents’ education | 36.387 | 5.099–67.675 | 0.023 * | −2.160 | (−26.448)–22.127 | 0.861 | ||
| Vitamin C | 73.8804 | 107.0817 | ||||||
| Geographical area | 2.086 | 0.786–3.387 | 0.002 * | 2.577 | 1.210–3.944 | 0.000 * | ||
| Family income | 0.420 | (−2.589)–3.429 | 0.784 | 1.951 | (−1.308)–5.210 | 0.240 | ||
| Higher level of parents’ education | 3.122 | 0.834–5.410 | 0.008 * | 0.535 | (−1.942)–3.012 | 0.672 | ||
| Vitamin E | 4.8900 | 8.6167 | ||||||
| Geographical area | −0.108 | (−0.203)–(−0.013) | 0.026 * | −0.078 | (−0.183)–0.026 | 0.141 | ||
| Family income | 0.107 | (−0.113)–0.327 | 0.342 | −0.107 | (−0.355)–0.142 | 0.399 | ||
| Higher level of parents’ education | −0.079 | (−0.246)–0.089 | 0.356 | 0.035 | (−0.154)–0.223 | 0.719 | ||
Publisher’s Note: MDPI stays neutral with regard to jurisdictional claims in published maps and institutional affiliations. |
© 2022 by the authors. Licensee MDPI, Basel, Switzerland. This article is an open access article distributed under the terms and conditions of the Creative Commons Attribution (CC BY) license (https://creativecommons.org/licenses/by/4.0/).
Share and Cite
Madrigal, C.; Soto-Méndez, M.J.; Hernández-Ruiz, Á.; Ruiz-López, M.D.; Samaniego-Vaesken, M.d.L.; Partearroyo, T.; Varela-Moreiras, G.; Gil, Á. Dietary Intake, Nutritional Adequacy, and Food Sources of Selected Antioxidant Minerals and Vitamins; and Their Relationship with Personal and Family Factors in Spanish Children Aged 1 to <10 Years: Results from the EsNuPI Study. Nutrients 2022, 14, 4132. https://doi.org/10.3390/nu14194132
Madrigal C, Soto-Méndez MJ, Hernández-Ruiz Á, Ruiz-López MD, Samaniego-Vaesken MdL, Partearroyo T, Varela-Moreiras G, Gil Á. Dietary Intake, Nutritional Adequacy, and Food Sources of Selected Antioxidant Minerals and Vitamins; and Their Relationship with Personal and Family Factors in Spanish Children Aged 1 to <10 Years: Results from the EsNuPI Study. Nutrients. 2022; 14(19):4132. https://doi.org/10.3390/nu14194132
Chicago/Turabian StyleMadrigal, Casandra, María José Soto-Méndez, Ángela Hernández-Ruiz, María Dolores Ruiz-López, María de Lourdes Samaniego-Vaesken, Teresa Partearroyo, Gregorio Varela-Moreiras, and Ángel Gil. 2022. "Dietary Intake, Nutritional Adequacy, and Food Sources of Selected Antioxidant Minerals and Vitamins; and Their Relationship with Personal and Family Factors in Spanish Children Aged 1 to <10 Years: Results from the EsNuPI Study" Nutrients 14, no. 19: 4132. https://doi.org/10.3390/nu14194132
APA StyleMadrigal, C., Soto-Méndez, M. J., Hernández-Ruiz, Á., Ruiz-López, M. D., Samaniego-Vaesken, M. d. L., Partearroyo, T., Varela-Moreiras, G., & Gil, Á. (2022). Dietary Intake, Nutritional Adequacy, and Food Sources of Selected Antioxidant Minerals and Vitamins; and Their Relationship with Personal and Family Factors in Spanish Children Aged 1 to <10 Years: Results from the EsNuPI Study. Nutrients, 14(19), 4132. https://doi.org/10.3390/nu14194132