
A Scoping Review: Urinary Markers of Metabolic Maturation in Preterm Infants and Future Interventions to Improve Growth

 ,
,  , , and
Abstract
1. Introduction
2. Materials and Methods
2.1. Preparing to Scope the Literature and Protocol Development
2.2. Protocol Development
2.3. Data Sources Searched
2.4. The Search Strategy
2.5. Study Selection
2.6. Data Extraction and Charting
2.7. Collating, Summarising and Reporting Results
3. Results
3.1. Study Characteristics
3.2. Narrative Data Synthesis
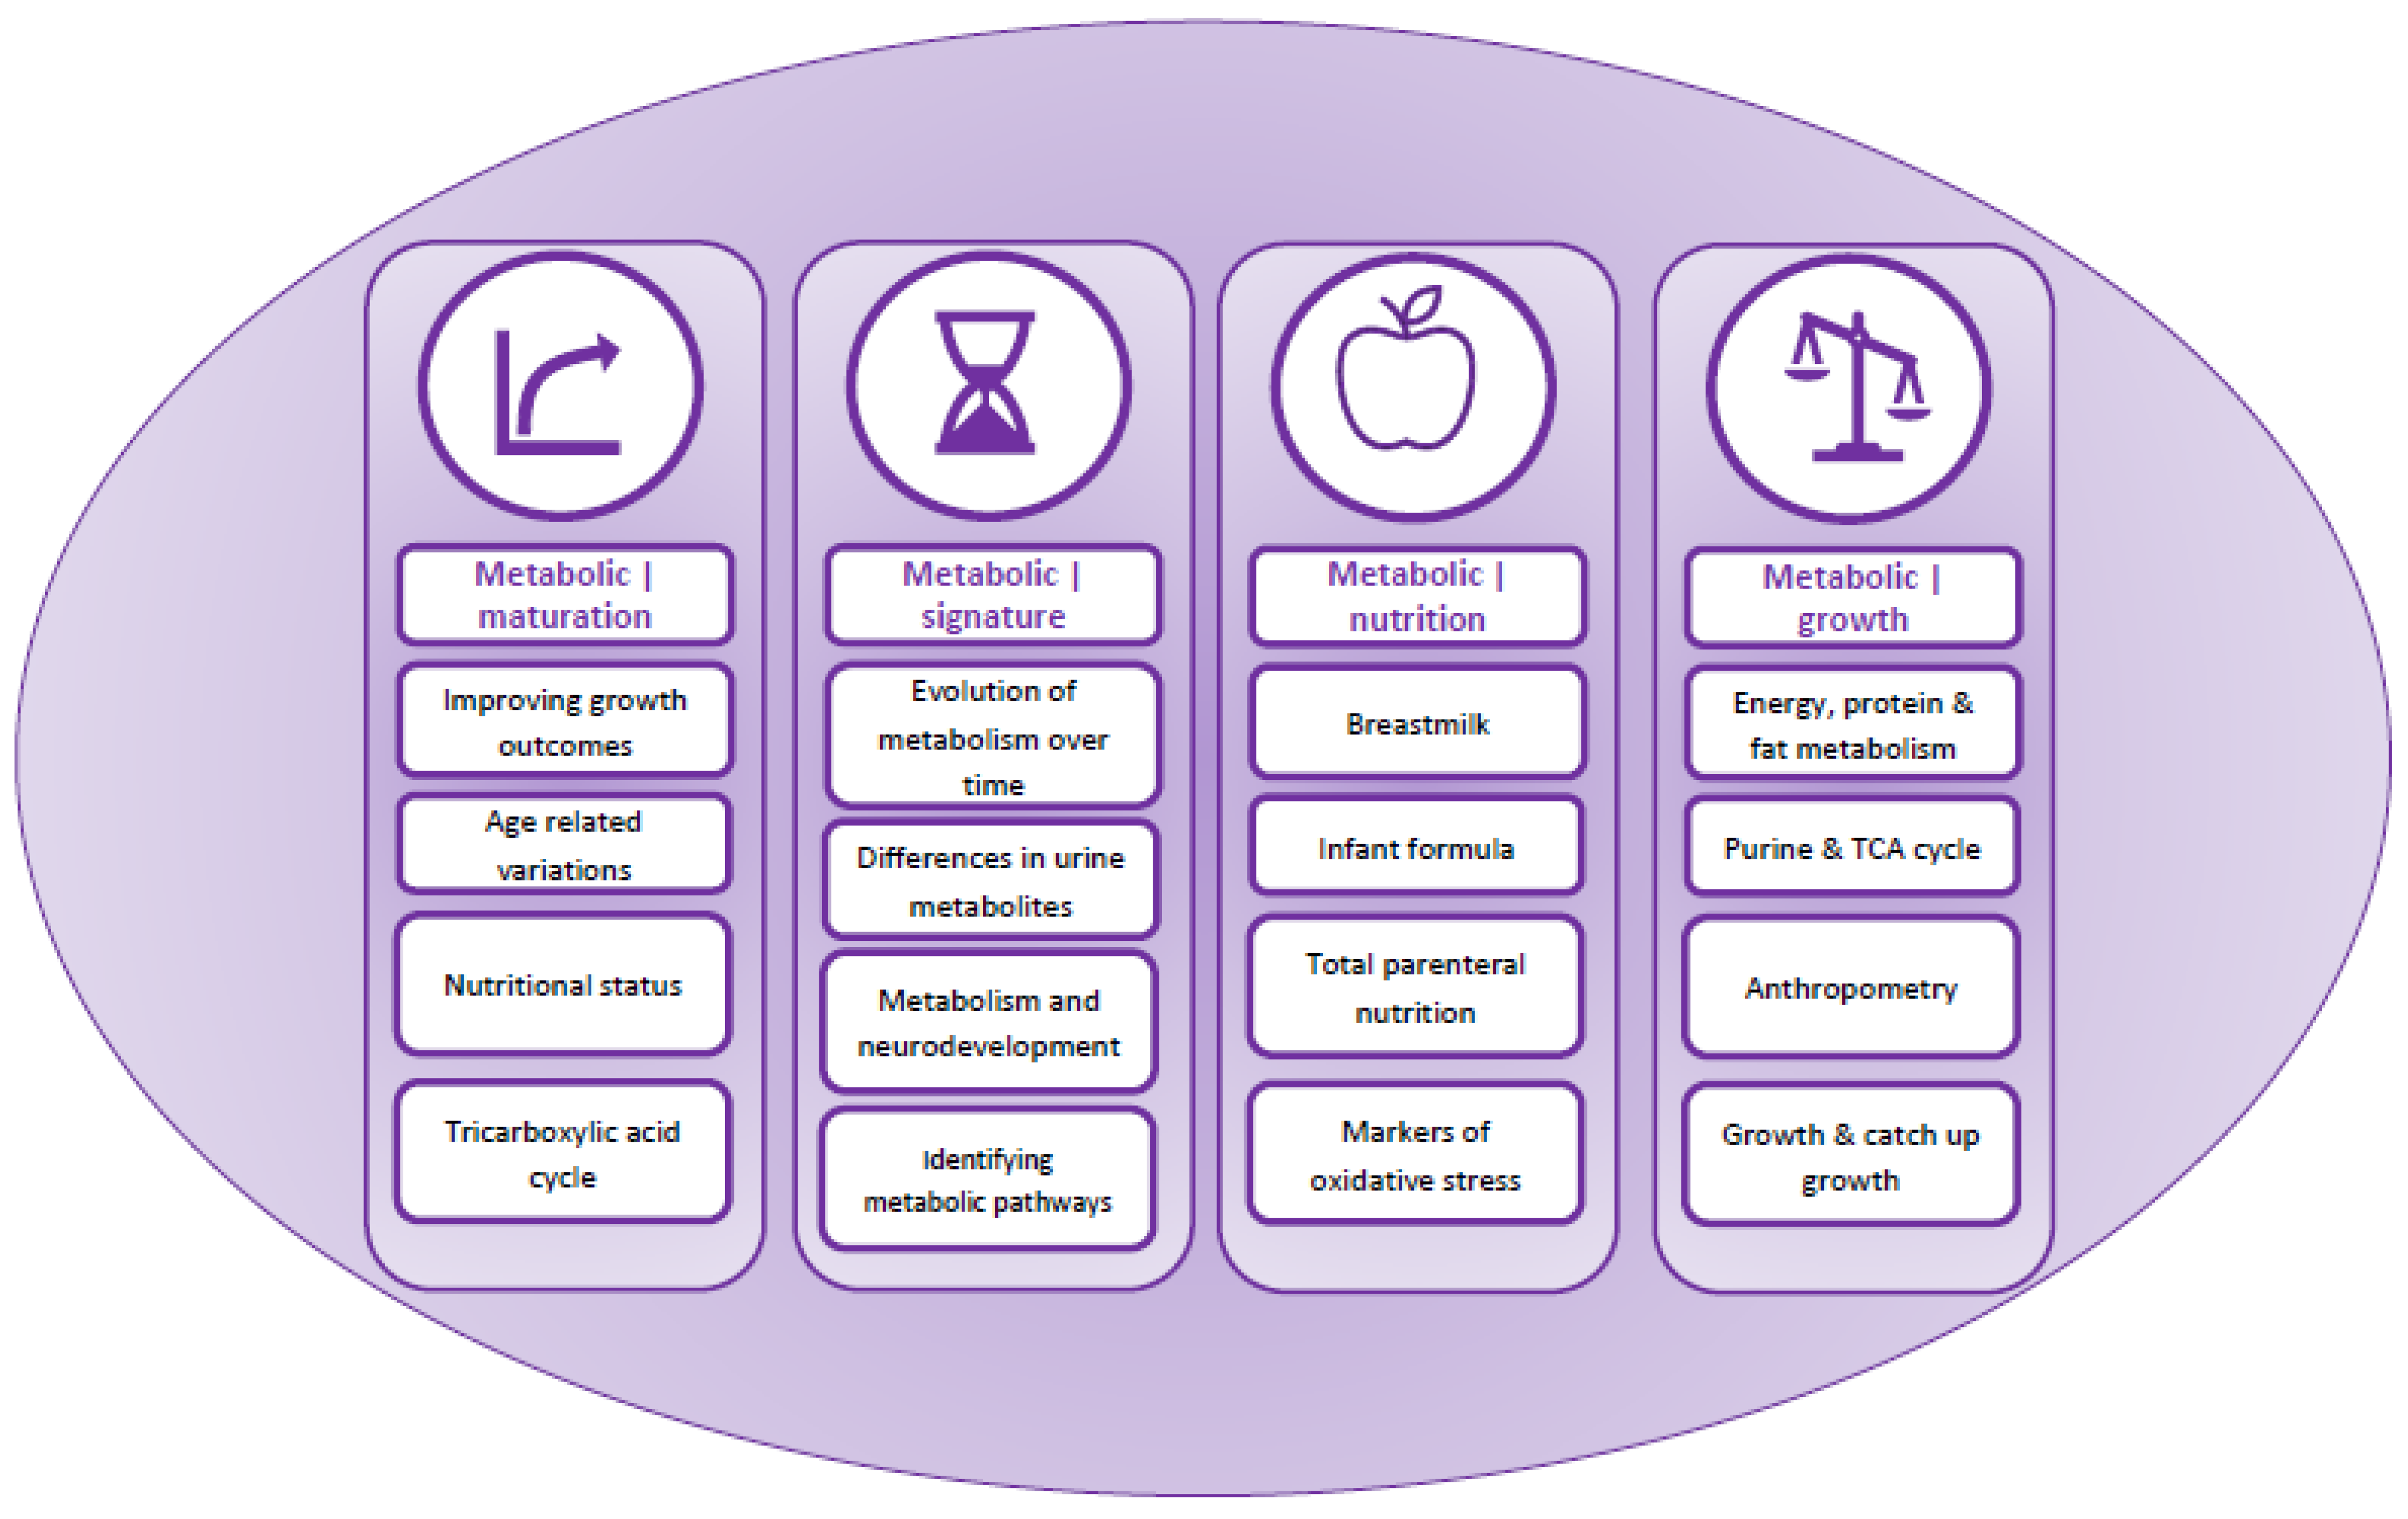
3.3. Content Analysis and Overarching Themes
3.4. Category 1: Metabolic|Maturation
3.5. Category 2: Metabolic|Signatures
3.6. Category 3: Metabolic|Nutrition
3.7. Category 4: Metabolic|Growth
4. Discussion
5. Limitations
6. Future Research Priorities
7. Conclusions
Author Contributions
Funding
Institutional Review Board Statement
Acknowledgments
Conflicts of Interest
Appendix A

| Section | Item | PRISMA-ScR Checklist Item | Reported on Page |
|---|---|---|---|
| Title | |||
| Title | 1 | Identify the report as a scoping review. | 1 |
| Abstract | |||
| Structured summary | 2 | Provide a structured summary that includes (as applicable): background, objectives, eligibility criteria, sources of evidence, charting methods, results, and conclusions that relate to the review questions and objectives. | 1 |
| Introduction | |||
| Rationale | 3 | Describe the rationale for the review in the context of what is already known. Explain why the review questions/objectives lend themselves to a scoping review approach. | 3 |
| Objectives | 4 | Provide an explicit statement of the questions and objectives being addressed with reference to their key elements (e.g., population or participants, concepts, and context) or other relevant key elements used to conceptualize the review questions and/or objectives. | 3 |
| Methods | |||
| Protocol and registration | 5 | Indicate whether a review protocol exists; state if and where it can be accessed (e.g., a Web address); and if available, provide registration information, including the registration number. | 4 |
| Eligibility criteria | 6 | Specify characteristics of the sources of evidence used as eligibility criteria (e.g., years considered, language, and publication status), and provide a rationale. | 4 |
| Information sources * | 7 | Describe all information sources in the search (e.g., databases with dates of coverage and contact with authors to identify additional sources), as well as the date the most recent search was executed. | 4 |
| Search | 8 | Present the full electronic search strategy for at least 1 database, including any limits used, such that it could be repeated. | 4 |
| Selection of sources of evidence † | 9 | State the process for selecting sources of evidence (i.e., screening and eligibility) included in the scoping review. | 4 |
| Data charting process ‡ | 10 | Describe the methods of charting data from the included sources of evidence (e.g., calibrated forms or forms that have been tested by the team before their use, and whether data charting was done independently or in duplicate) and any processes for obtaining and confirming data from investigators. | 4 |
| Data items | 11 | List and define all variables for which data were sought and any assumptions and simplifications made. | 4 |
| Critical appraisal of individual sources of evidence § | 12 | If done, provide a rationale for conducting a critical appraisal of included sources of evidence; describe the methods used and how this information was used in any data synthesis (if appropriate). | 4 |
| Synthesis of results | 13 | Describe the methods of handling and summarizing the data that were charted. | 4 |
| Results | |||
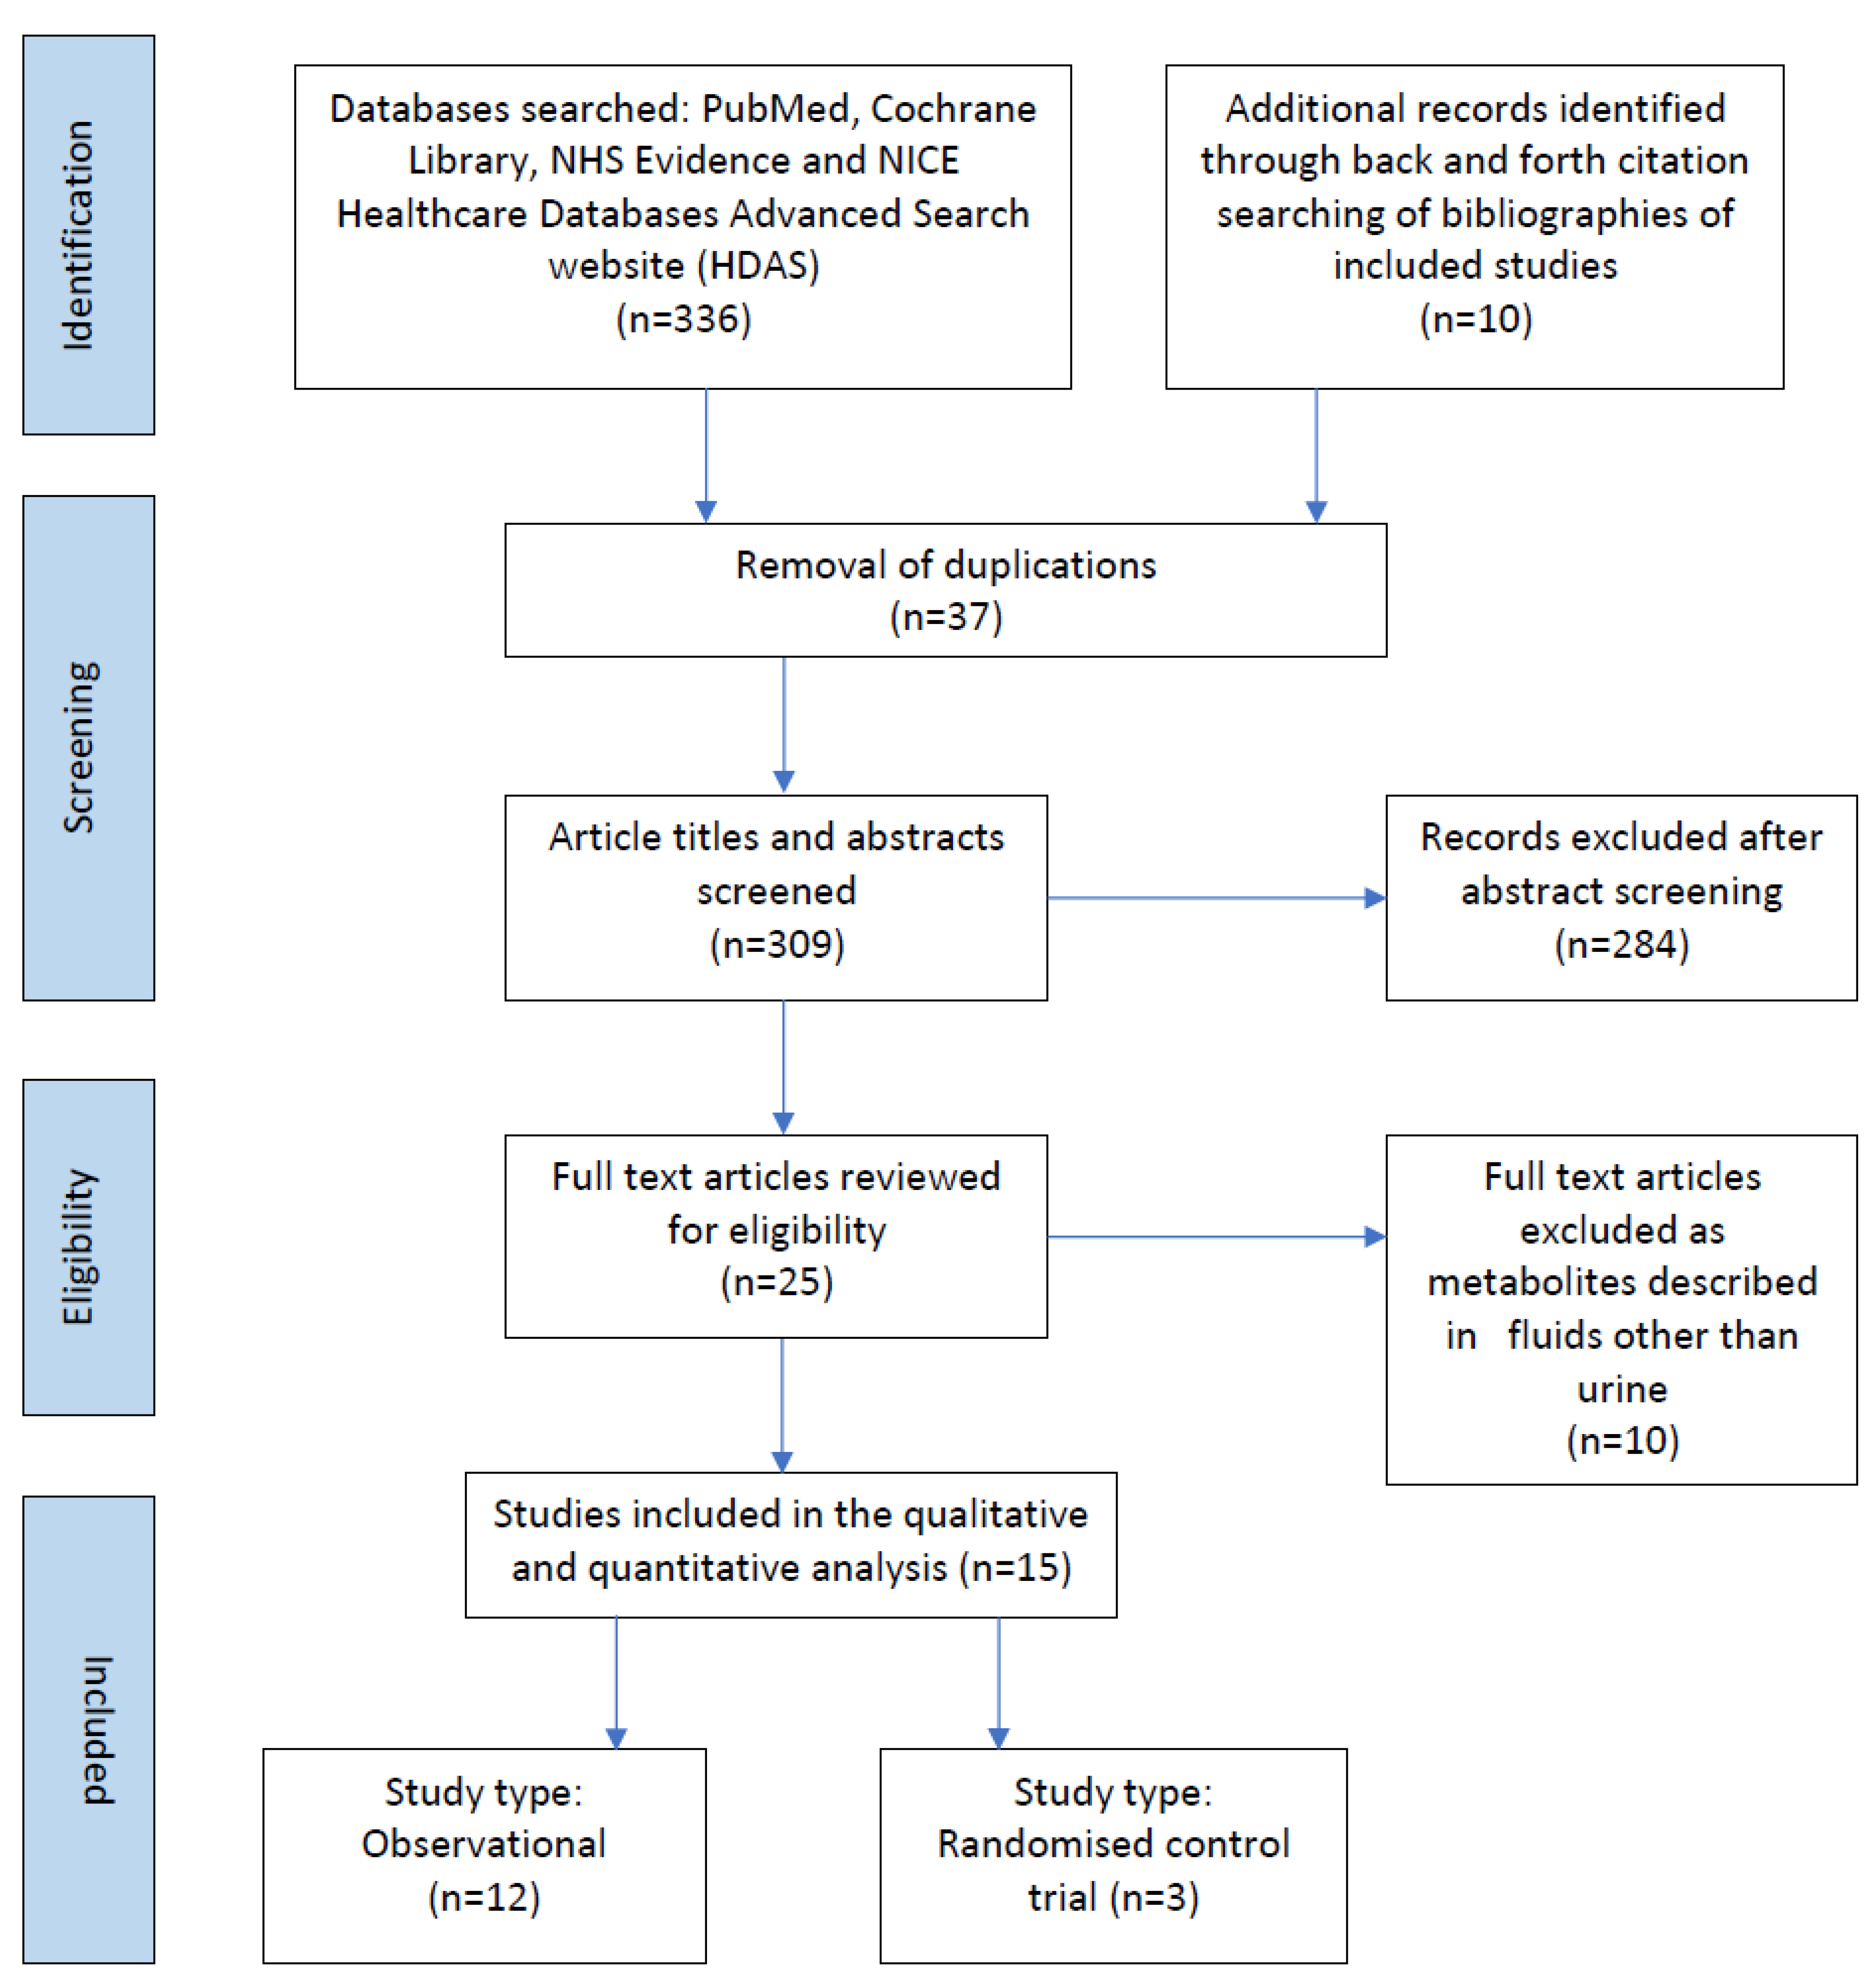
| Selection of sources of evidence | 14 | Give numbers of sources of evidence screened, assessed for eligibility, and included in the review, with reasons for exclusions at each stage, ideally using a flow diagram. | 6 |
| Characteristics of sources of evidence | 15 | For each source of evidence, present characteristics for which data were charted and provide the citations. | 7 |
| Critical appraisal within sources of evidence | 16 | If done, present data on critical appraisal of included sources of evidence (see item 12). | 7 |
| Results of individual sources of evidence | 17 | For each included source of evidence, present the relevant data that were charted that relate to the review questions and objectives. | 7 |
| Synthesis of results | 18 | Summarize and/or present the charting results as they relate to the review questions and objectives. | 7 |
| Discussion | |||
| Summary of evidence | 19 | Summarize the main results (including an overview of concepts, themes, and types of evidence available), link to the review questions and objectives, and consider the relevance to key groups. | 26 |
| Limitations | 20 | Discuss the limitations of the scoping review process. | 30 |
| Conclusions | 21 | Provide a general interpretation of the results with respect to the review questions and objectives, as well as potential implications and/or next steps. | 31 |
| Funding | |||
| Funding | 22 | Describe sources of funding for the included sources of evidence, as well as sources of funding for the scoping review. Describe the role of the funders of the scoping review. | 31 |
Appendix B
| Study Selection Criteria (PICOTS) | ||
|---|---|---|
| Inclusion Criteria | Exclusion Criteria | |
| Population |
|
|
| Intervention |
|
|
| Comparison |
|
|
| Outcome |
|
|
| Timing |
|
|
| Setting |
|
|
| Search Strategy | ||
| Search words |
| |
| Limits |
| |
| Year range |
| |
| Search example: PUBMED |
| |
| Expanded search terms | (“infant, premature”[MeSH Terms] OR (“infant”[All Fields] AND “premature”[All Fields]) OR “premature infant”[All Fields] OR (“preterm”[All Fields] AND “infants”[All Fields]) OR “preterm infants”[All Fields] OR (“infant, premature”[MeSH Terms] OR (“infant”[All Fields] AND “premature”[All Fields]) OR “premature infant”[All Fields] OR (“premature”[All Fields] AND “infants”[All Fields]) OR “premature infants”[All Fields])) AND (((“urinary tract”[MeSH Terms] OR (“urinary”[All Fields] AND “tract”[All Fields]) OR “urinary tract”[All Fields] OR “urinary”[All Fields]) AND (“metabolome”[MeSH Terms] OR “metabolome”[All Fields] OR “metabolomes”[All Fields] OR “metabolomics”[MeSH Terms] OR “metabolomics”[All Fields] OR “metabolomic”[All Fields])) OR ((“urinary tract”[MeSH Terms] OR (“urinary”[All Fields] AND “tract”[All Fields]) OR “urinary tract”[All Fields] OR “urinary”[All Fields]) AND (“metabolite”[All Fields] OR “metabolite s”[All Fields] OR “metabolites”[All Fields]))) AND (“growth and development”[MeSH Subheading] OR (“growth”[All Fields] AND “development”[All Fields]) OR “growth and development”[All Fields] OR “growth”[All Fields] OR “growth”[MeSH Terms] OR “growths”[All Fields] OR (“weight gain”[MeSH Terms] OR (“weight”[All Fields] AND “gain”[All Fields]) OR “weight gain”[All Fields])) AND (((“metabolic”[All Fields] OR “metabolical”[All Fields] OR “metabolically”[All Fields] OR “metabolics”[All Fields] OR “metabolism”[MeSH Terms] OR “metabolism”[All Fields] OR “metabolisms”[All Fields] OR “metabolism”[MeSH Subheading] OR “metabolic networks and pathways”[MeSH Terms] OR (“metabolic”[All Fields] AND “networks”[All Fields] AND “pathways”[All Fields]) OR “metabolic networks and pathways”[All Fields] OR “metabolities”[All Fields] OR “metabolization”[All Fields] OR “metabolize”[All Fields] OR “metabolized”[All Fields] OR “metabolizer”[All Fields] OR “metabolizers”[All Fields] OR “metabolizes”[All Fields] OR “metabolizing”[All Fields]) AND (“maturate”[All Fields] OR “maturated”[All Fields] OR “maturating”[All Fields] OR “maturation”[All Fields] OR “maturational”[All Fields] OR “maturations”[All Fields] OR “maturative”[All Fields] OR “mature”[All Fields] OR “matured”[All Fields] OR “maturer”[All Fields] OR “maturers”[All Fields] OR “matures”[All Fields] OR “maturing”[All Fields] OR “maturities”[All Fields] OR “maturity”[All Fields])) OR ((“metabolic”[All Fields] OR “metabolical”[All Fields] OR “metabolically”[All Fields] OR “metabolics”[All Fields] OR “metabolism”[MeSH Terms] OR “metabolism”[All Fields] OR “metabolisms”[All Fields] OR “metabolism”[MeSH Subheading] OR “metabolic networks and pathways”[MeSH Terms] OR (“metabolic”[All Fields] AND “networks”[All Fields] AND “pathways”[All Fields]) OR “metabolic networks and pathways”[All Fields] OR “metabolities”[All Fields] OR “metabolization”[All Fields] OR “metabolize”[All Fields] OR “metabolized”[All Fields] OR “metabolizer”[All Fields] OR “metabolizers”[All Fields] OR “metabolizes”[All Fields] OR “metabolizing”[All Fields]) AND (“maturate”[All Fields] OR “maturated”[All Fields] OR “maturating”[All Fields] OR “maturation”[All Fields] OR “maturational”[All Fields] OR “maturations”[All Fields] OR “maturative”[All Fields] OR “mature”[All Fields] OR “matured”[All Fields] OR “maturer”[All Fields] OR “maturers”[All Fields] OR “matures”[All Fields] OR “maturing”[All Fields] OR “maturities”[All Fields] OR “maturity”[All Fields])))Translations preterm infants: “infant, premature”[MeSH Terms] OR (“infant”[All Fields] AND “premature”[All Fields]) OR “premature infant”[All Fields] OR (“preterm”[All Fields] AND “infants”[All Fields]) OR “preterm infants”[All Fields]premature infants: “infant, premature”[MeSH Terms] OR (“infant”[All Fields] AND “premature”[All Fields]) OR “premature infant”[All Fields] OR (“premature”[All Fields] AND “infants”[All Fields]) OR “premature infants”[All Fields]Urinary: “urinary tract”[MeSH Terms] OR (“urinary”[All Fields] AND “tract”[All Fields]) OR “urinary tract”[All Fields] OR “urinary”[All Fields]metabolomics: “metabolome”[MeSH Terms] OR “metabolome”[All Fields] OR “metabolomes”[All Fields] OR “metabolomics”[MeSH Terms] OR “metabolomics”[All Fields] OR “metabolomic”[All Fields]urinary: “urinary tract”[MeSH Terms] OR (“urinary”[All Fields] AND “tract”[All Fields]) OR “urinary tract”[All Fields] OR “urinary”[All Fields]metabolites: “metabolite”[All Fields] OR “metabolite’s”[All Fields] OR “metabolites”[All Fields]Growth: “growth and development”[Subheading] OR (“growth”[All Fields] AND “development”[All Fields]) OR “growth and development”[All Fields] OR “growth”[All Fields] OR “growth”[MeSH Terms] OR “growths”[All Fields]weight gain: “weight gain”[MeSH Terms] OR (“weight”[All Fields] AND “gain”[All Fields]) OR “weight gain”[All Fields]Metabolic: “metabolic”[All Fields] OR “metabolical”[All Fields] OR “metabolically”[All Fields] OR “metabolics”[All Fields] OR “metabolism”[MeSH Terms] OR “metabolism”[All Fields] OR “metabolisms”[All Fields] OR “metabolism”[Subheading] OR “metabolic networks and pathways”[MeSH Terms] OR (“metabolic”[All Fields] AND “networks”[All Fields] AND “pathways”[All Fields]) OR “metabolic networks and pathways”[All Fields] OR “metabolities”[All Fields] OR “metabolization”[All Fields] OR “metabolize”[All Fields] OR “metabolized”[All Fields] OR “metabolizer”[All Fields] OR “metabolizers”[All Fields] OR “metabolizes”[All Fields] OR “metabolizing”[All Fields] maturation: “maturate”[All Fields] OR “maturated”[All Fields] OR “maturating”[All Fields] OR “maturation”[All Fields] OR “maturational”[All Fields] OR “maturations”[All Fields] OR “maturative”[All Fields] OR “mature”[All Fields] OR “matured”[All Fields] OR “maturer”[All Fields] OR “maturers”[All Fields] OR “matures”[All Fields] OR “maturing”[All Fields] OR “maturities”[All Fields] OR “maturity”[All Fields]metabolic: “metabolic”[All Fields] OR “metabolical”[All Fields] OR “metabolically”[All Fields] OR “metabolics”[All Fields] OR “metabolism”[MeSH Terms] OR “metabolism”[All Fields] OR “metabolisms”[All Fields] OR “metabolism”[Subheading] OR “metabolic networks and pathways”[MeSH Terms] OR (“metabolic”[All Fields] AND “networks”[All Fields] AND “pathways”[All Fields]) OR “metabolic networks and pathways”[All Fields] OR “metabolities”[All Fields] OR “metabolization”[All Fields] OR “metabolize”[All Fields] OR “metabolized”[All Fields] OR “metabolizer”[All Fields] OR “metabolizers”[All Fields] OR “metabolizes”[All Fields] OR “metabolizing”[All Fields] maturity: “maturate”[All Fields] OR “maturated”[All Fields] OR “maturating”[All Fields] OR “maturation”[All Fields] OR “maturational”[All Fields] OR “maturations”[All Fields] OR “maturative”[All Fields] OR “mature”[All Fields] OR “matured”[All Fields] OR “maturer”[All Fields] OR “maturers”[All Fields] OR “matures”[All Fields] OR “maturing”[All Fields] OR “maturities”[All Fields] OR “maturity”[All Fields] | |
References
- Preterm Birth. Available online: http://www.who.int/news-room/fact-sheets/detail/preterm-birth (accessed on 24 April 2022).
- Demerath, E.W.; Johnson, W.; Davern, B.A.; Anderson, C.G.; Shenberger, J.S.; Misra, S.; Ramel, S.E. New body composition reference charts for preterm infants. Am. J. Clin. Nutr. 2016, 105, 70–77. [Google Scholar] [CrossRef]
- Ashton, J.; Johnson, M.J.; Pond, J.; Crowley, P.; Dimitrov, B.D.; Pearson, F.; Beattie, R.M. Assessing the growth of preterm infants using detailed anthropometry. Acta Paediatr. 2017, 106, 889–896. [Google Scholar] [CrossRef] [PubMed]
- Agostoni, C.; Buonocore, G.; Carnielli, V.P.; De Curtis, M.; Darmaun, D.; Decsi, T.; Domellöf, M.; Embleton, N.D.; Fusch, C.; Genzel-Boroviczeny, O.; et al. Enteral Nutrient Supply for Preterm Infants: Commentary From the European Society of Paediatric Gastroenterology, Hepatology and Nutrition Committee on Nutrition. J. Pediatr. Gastroenterol. Nutr. 2010, 50, 85–91. [Google Scholar] [CrossRef] [PubMed]
- Young, A.; Beattie, R.M.; Johnson, M.J. Optimising growth in very preterm infants: Reviewing the evidence. Arch. Dis. Child. Fetal Neonatal Ed. Published online First: 28 February. 2022. [Google Scholar] [CrossRef]
- Mayneris-Perxachs, J.; Swann, J.R. Metabolic phenotyping of malnutrition during the first 1000 days of life. Eur. J. Nutr. 2018, 58, 909–930. [Google Scholar] [CrossRef]
- Simeoni, U.; Yzydorczyk, C.; Siddeek, B.; Benahmed, M. Epigenetics and neonatal nutrition. Early Hum. Dev. 2014, 90, S23–S24. [Google Scholar] [CrossRef]
- Chiu, C.-Y.; Yeh, K.-W.; Lin, G.; Chiang, M.-H.; Yang, S.-C.; Chao, W.-J.; Yao, T.-C.; Tsai, M.-H.; Hua, M.-C.; Liao, S.-L.; et al. Metabolomics Reveals Dynamic Metabolic Changes Associated with Age in Early Childhood. PLoS ONE 2016, 11, e0149823. [Google Scholar] [CrossRef] [PubMed]
- Ramel, S.; Rao, R. Hyperglycemia in Extremely Preterm Infants. NeoReviews 2020, 21, e89–e97. [Google Scholar] [CrossRef] [PubMed]
- van der Lugt, N.M.; Smits-Wintjens, V.E.H.J.; van Zwieten, P.H.T.; Walther, F.J. Short and long term outcome of neonatal hyperglycemia in very preterm infants: A retrospective follow-up study. BMC Pediatr. 2010, 10, 52. [Google Scholar] [CrossRef]
- Ni, Y.; Beckmann, J.; Hurst, J.R.; Morris, J.K.; Marlow, N. Size at birth, growth trajectory in early life, and cardiovascular and metabolic risks in early adulthood: EPICure study. Arch. Dis. Child. Fetal Neonatal Ed. 2021, 106, 149–155. [Google Scholar] [CrossRef]
- Heidemann, L.A.; Procianoy, R.S.; Silveira, R.C. Prevalence of metabolic syndrome-like in the follow-up of very low birth weight preterm infants and associated factors. J. Pediatr. 2019, 95, 291–297. [Google Scholar] [CrossRef]
- Giallourou, N.; Fardus-Reid, F.; Panic, G.; Veselkov, K.; McCormick, B.J.J.; Olortegui, M.P.; Ahmed, T.; Mduma, E.; Yori, P.P.; Mahfuz, M.; et al. Metabolic maturation in the first 2 years of life in resource-constrained settings and its association with postnatal growth. Sci. Adv. 2020, 6, eaay5969. [Google Scholar] [CrossRef] [PubMed]
- Dahlgren, A.F.; Pan, A.; Lam, V.; Gouthro, K.C.; Simpson, P.M.; Salzman, N.H.; Nghiem-Rao, T.H. Longitudinal changes in the gut microbiome of infants on total parenteral nutrition. Pediatr. Res. 2019, 86, 107–114. [Google Scholar] [CrossRef] [PubMed]
- Atkinson, S.A.; Shah, J.K.; McGee, C.; Steele, B.T. Mineral excretion in premature infants receiving various diuretic therapies. J. Pediatr. 1988, 113, 540–545. [Google Scholar] [CrossRef]
- Grace, E.; Hilditch, C.; Gomersall, J.; Collins, C.T.; Rumbold, A.; Keir, A.K. Safety and efficacy of human milk-based fortifier in enterally fed preterm and/or low birthweight infants: A systematic review and meta-analysis. Arch. Dis. Child. Fetal Neonatal Ed. 2020, 106, 137–142. [Google Scholar] [CrossRef]
- Boscarino, G.; Conti, M.G.; Di Chiara, M.; Bianchi, M.; Onestà, E.; Faccioli, F.; Deli, G.; Repole, P.; Oliva, S.; Cresi, F.; et al. Early Enteral Feeding Improves Tolerance of Parenteral Nutrition in Preterm Newborns. Nutrients 2021, 13, 3886. [Google Scholar] [CrossRef]
- Moltu, S.J.; Bronsky, J.; Embleton, N.; Gerasimidis, K.; Indrio, F.; Köglmeier, J.; de Koning, B.; Lapillonne, A.; Norsa, L.; Verduci, E.; et al. Nutritional Management of the Critically Ill Neonate: A Position Paper of the ESPGHAN Committee on Nutrition. J. Pediatr. Gastroenterol. Nutr. 2021, 73, 274–289. [Google Scholar] [CrossRef] [PubMed]
- Clish, C.B. Metabolomics: An emerging but powerful tool for precision medicine. Mol. Case Stud. 2015, 1, a000588. [Google Scholar] [CrossRef]
- Blanton, L.V.; Charbonneau, M.R.; Salih, T.; Barratt, M.J.; Venkatesh, S.; Ilkaveya, O.; Subramanian, S.; Manary, M.J.; Trehan, I.; Jorgensen, J.M.; et al. Gut bacteria that prevent growth impairments transmitted by microbiota from malnourished children. Science 2016, 351, aad3311. [Google Scholar] [CrossRef]
- Subramanian, S.; Huq, S.; Yatsunenko, T.; Haque, R.; Mahfuz, M.; Alam, M.A.; Benezra, A.; DeStefano, J.; Meier, M.F.; Muegge, B.; et al. Persistent gut microbiota immaturity in malnourished Bangladeshi children. Nature 2014, 510, 417–421. [Google Scholar] [CrossRef]
- Zheng, J.; Zhang, L.; Johnson, M.; Mandal, R.; Wishart, D.S. Comprehensive Targeted Metabolomic Assay for Urine Analysis. Anal. Chem. 2020, 92, 10627–10634. [Google Scholar] [CrossRef] [PubMed]
- Yang, Y.-N. Current concepts of very low birth weight infants with extra-uterine growth restriction. Pediatr. Neonatol. 2022, 63, 3–4. [Google Scholar] [CrossRef]
- Freemark, M. Metabolomics in Nutrition Research: Biomarkers Predicting Mortality in Children with Severe Acute Malnutrition. Food Nutr. Bull. 2015, 36, S88–S92. [Google Scholar] [CrossRef]
- Owino, V.; Ahmed, T.; Freemark, M.; Kelly, P.; Loy, A.; Manary, M.; Loechl, C. Environmental Enteric Dysfunction and Growth Failure/Stunting in Global Child Health. Pediatrics 2016, 138, e20160641. [Google Scholar] [CrossRef]
- Bourdon, C.; Lelijveld, N.; Thompson, D.; Dalvi, P.S.; Gonzales, G.B.; Wang, D.; Alipour, M.; Wine, E.; Chimwezi, E.; Wells, J.C.; et al. Metabolomics in plasma of Malawian children 7 years after surviving severe acute malnutrition: “ChroSAM” a cohort study. eBioMedicine 2019, 45, 464–472. [Google Scholar] [CrossRef] [PubMed]
- Moco, S.; Collino, S.; Rezzi, S.; Martin, F.-P. Metabolomics perspectives in pediatric research. Pediatr. Res. 2013, 73, 570–576. [Google Scholar] [CrossRef]
- Munn, Z.; Peters, M.D.J.; Stern, C.; Tufanaru, C.; McArthur, A.; Aromataris, E. Systematic review or scoping review? Guidance for authors when choosing between a systematic or scoping review approach. BMC Med. Res. Methodol. 2018, 18, 143. [Google Scholar] [CrossRef] [PubMed]
- Tricco, A.C.; Lillie, E.; Zarin, W.; O’Brien, K.K.; Colquhoun, H.; Levac, D.; Moher, D.; Peters, M.D.J.; Horsley, T.; Weeks, L.; et al. PRISMA Extension for Scoping Reviews (PRISMA-ScR): Checklist and Explanation. Ann. Intern. Med. 2018, 169, 467–473. [Google Scholar] [CrossRef]
- Marino, L.; Valla, F.; Beattie, R.; Verbruggen, S. Micronutrient status during paediatric critical illness: A scoping review. Clin. Nutr. 2020, 39, 3571–3593. [Google Scholar] [CrossRef]
- Arksey, H.; O’Malley, L. Scoping studies: Towards a methodological framework. Int. J. Soc. Res. Methodol. 2005, 8, 19–32. [Google Scholar] [CrossRef]
- Levac, D.; Colquhoun, H.; O’Brien, K.K. Scoping studies: Advancing the methodology. Implement. Sci. 2010, 5, 69. [Google Scholar] [CrossRef] [PubMed]
- Popay, J. Guidance on the Conduct of Narrative Synthesis in Systematic Reviews A Product from the ESRC Methods Programme. Lancaster Univeristy. Available online: https://www.lancaster.ac.uk/media/lancaster-university/content-assets/documents/fhm/dhr/chir/NSsynthesisguidanceVersion1-April2006.pdf (accessed on 9 June 2022).
- Hülsemann, J.; Kordass, U.; Sander, G.; Schmidt, E.; Schöch, G. 3-Methylhistidine/Creatinine Ratio in Urine from Low-Birth-Weight Infants. Ann. Nutr. Metab. 1988, 32, 44–51. [Google Scholar] [CrossRef] [PubMed]
- Georgakopoulou, I.; Chasapi, S.A.; Bariamis, S.E.; Varvarigou, A.; Spraul, M.; Spyroulias, G.A. Metabolic changes in early neonatal life: NMR analysis of the neonatal metabolic profile to monitor postnatal metabolic adaptations. Metabolomics 2020, 16, 58. [Google Scholar] [CrossRef] [PubMed]
- Atzori, L.; Antonucci, R.; Barberini, L.; Locci, E.; Marincola, F.C.; Scano, P.; Cortesi, P.; Agostiniani, R.; Defraia, R.; Weljie, A.; et al. 1H NMR-based metabolomic analysis of urine from preterm and term neonates. Front. Biosci. 2011, 3, 1005–1012. [Google Scholar] [CrossRef] [PubMed]
- Moltu, S.J.; Sachse, D.; Blakstad, E.W.; Strømmen, K.; Nakstad, B.; Almaas, A.N.; Westerberg, A.C.; Rønnestad, A.; Brække, K.; Veierød, M.B.; et al. Urinary Metabolite Profiles in Premature Infants Show Early Postnatal Metabolic Adaptation and Maturation. Nutrients 2014, 6, 1913–1930. [Google Scholar] [CrossRef]
- Buck, A.; Kayacelebi, A.A.; Chobanyan-Jürgens, K.; Illsinger, S.; Bohnhorst, B.; Beckmann, B.; Hanff, E.; Das, A.M.; Tsikas, D.; Lücke, T. Comprehensive analysis of the l-arginine/l-homoarginine/nitric oxide pathway in preterm neonates: Potential roles for homoarginine and asymmetric dimethylarginine in foetal growth. Amino Acids 2017, 49, 783–794. [Google Scholar] [CrossRef]
- Hao, H.; Li, S.; Zhou, W.; Wang, H.; Liu, M.; Shi, C.; Chen, J.; Xiao, X. Metabolic products in urine of preterm infants characterized via gas chromatography-mass spectrometry. Int. J. Clin. Exp. Med. 2015, 8, 16454–16462. [Google Scholar]
- Ledo, A.; Arduini, A.; Asensi, M.A.; Sastre, J.; Escrig, R.; Brugada, M.; Aguar, M.; Saenz, P.; Vento, M. Human milk enhances antioxidant defenses against hydroxyl radical aggression in preterm infants. Am. J. Clin. Nutr. 2008, 89, 210–215. [Google Scholar] [CrossRef]
- Muñoz-Hoyos, A.; Molina-Carballo, A.; Macías, M.; Rodríguez-Cabezas, T.; Martín-Medina, E.; Narbona-López, E.; Valenzuela-Ruiz, A.; Acuña-Castroviejo, D. Comparison between tryptophan methoxyindole and kynurenine metabolic pathways in normal and preterm neonates and in neonates with acute fetal distress. Eur. J. Endocrinol. 1998, 139, 89–95. [Google Scholar] [CrossRef]
- Shoji, H.; Taka, H.; Kaga, N.; Ikeda, N.; Hisata, K.; Miura, Y.; Shimizu, T. Choline-related metabolites influenced by feeding patterns in preterm and term infants. J. Matern. Fetal Neonatal Med. 2020, 33, 230–235. [Google Scholar] [CrossRef]
- Shoji, H.; Shimizu, T.; Shinohara, K.; Oguchi, S.; Shiga, S.; Yamashiro, Y. Suppressive effects of breast milk on oxidative DNA damage in very low birthweight infants. Arch. Dis. Child. Fetal Neonatal Ed. 2004, 89, F136–F138. [Google Scholar] [CrossRef] [PubMed]
- Diaz, S.O.; Pinto, J.; Barros, A.S.; Morais, E.; Duarte, D.; Negrão, F.; Pita, C.; Almeida, M.D.C.; Carreira, I.M.; Spraul, M.; et al. Newborn Urinary Metabolic Signatures of Prematurity and Other Disorders: A Case Control Study. J. Proteome Res. 2015, 15, 311–325. [Google Scholar] [CrossRef]
- Farkouh, C.R.; Merrill, J.D.; Ballard, P.L.; Ballard, R.A.; Ischiropoulos, H.; Lorch, S.A. Urinary Metabolites of Oxidative Stress and Nitric Oxide in Preterm and Term Infants. Neonatology 2006, 90, 233–242. [Google Scholar] [CrossRef] [PubMed]
- Koletzko, B.; Sauerwald, U.; Keicher, U.; Saule, H.; Wawatschek, S.; Böhles, H.; Bervoets, K.; Fleith, M.; Crozier-Willi, G. Fatty acid profiles, antioxidant status, and growth of preterm infants fed diets without or with long-chain polyunsaturated fatty acids. Eur. J. Nutr. 2003, 42, 243–253. [Google Scholar] [CrossRef]
- Giribaldi, M.; Peila, C.; Coscia, A.; Cavallarin, L.; Antoniazzi, S.; Corbu, S.; Maiocco, G.; Sottemano, S.; Cresi, F.; Bertino, G.M.E.; et al. Urinary Metabolomic Profile of Preterm Infants Receiving Human Milk with Either Bovine or Donkey Milk-Based Fortifiers. Nutrients 2020, 12, 2247. [Google Scholar] [CrossRef] [PubMed]
- Morniroli, D.; Dessì, A.; Giannì, M.L.; Roggero, P.; Noto, A.; Atzori, L.; Lussu, M.; Fanos, V.; Mosca, F. Is the body composition development in premature infants associated with a distinctive nuclear magnetic resonance metabolomic profiling of urine? J. Matern. Fetal Neonatal Med. 2019, 32, 2310–2318. [Google Scholar] [CrossRef] [PubMed]
- Kiani, A.K.; Paolacci, S.; Calogero, A.E.; Cannarella, R.; Di Renzo, G.C.; Gerli, S.; Della Morte, C.; Busetto, G.M.; De Berardinis, E.; Del Giudice, F.; et al. From Myo-inositol to D-chiro-inositol molecular pathways. Eur. Rev. Med. Pharm. Sci. 2021, 25, 2390–2402. [Google Scholar]
- Wang, W.; Wu, Z.; Dai, Z.; Yang, Y.; Wang, J.; Wu, G. Glycine metabolism in animals and humans: Implications for nutrition and health. Amino Acids 2013, 45, 463–477. [Google Scholar] [CrossRef] [PubMed]
- Varkey, A.; Devi, S.; Mukhopadhyay, A.; Kamat, N.G.; Pauline, M.; Dharmar, M.; Holt, R.R.; Allen, L.H.; Thomas, T.; Keen, C.L.; et al. Metabolome and microbiome alterations related to short-term feeding of a micronutrient-fortified, high-quality legume protein-based food product to stunted school age children: A randomized controlled pilot trial. Clin. Nutr. 2020, 39, 3251–3261. [Google Scholar] [CrossRef]
- Koletzko, B.; Chourdakis, M.; Grote, V.; Hellmuth, C.; Prell, C.; Rzehak, P.; Uhl, O.; Weber, M. Regulation of Early Human Growth: Impact on Long-Term Health. Ann. Nutr. Metab. 2014, 65, 101–109. [Google Scholar] [CrossRef]
- Stevens, A.; Bonshek, C.; Whatmore, A.; Butcher, I.; Hanson, D.; De Leonibus, C.; Shaikh, G.; Brown, M.; O’Shea, E.; Victor, S.; et al. Insights into the pathophysiology of catch-up compared with non-catch-up growth in children born small for gestational age: An integrated analysis of metabolic and transcriptomic data. Pharm. J. 2014, 14, 376–384. [Google Scholar] [CrossRef]
- Dessì, A.; Atzori, L.; Noto, A.; Visser, G.H.A.; Gazzolo, D.; Zanardo, V.; Barberini, L.; Puddu, M.; Ottonello, G.; Atzei, A.; et al. Metabolomics in newborns with intrauterine growth retardation (IUGR): Urine reveals markers of metabolic syndrome. J. Matern. Neonatal Med. 2011, 24, 35–39. [Google Scholar] [CrossRef] [PubMed]
- Dessì, A.; Marincola, F.C.; Pattumelli, M.G.; Ciccarelli, S.; Corbu, S.; Ossicini, C.; Fanos, V. Investigation of the 1H-NMR based urine metabolomic profiles of IUGR, LGA and AGA newborns on the first day of life. J. Matern. Fetal Neonatal Med. 2014, 27 (Suppl. 2), 13–19. [Google Scholar] [CrossRef] [PubMed]
- Marincola, F.C.; Dessì, A.; Pattumelli, M.G.; Corbu, S.; Ossicini, C.; Ciccarelli, S.; Agostino, R.; Mussap, M.; Fanos, V. (1)H NMR-based urine metabolic profile of IUGR, LGA, and AGA newborns in the first week of life. Clin. Chim. Acta Int. J. Clin. Chem. 2015, 451 Pt A, 28–34. [Google Scholar] [CrossRef]
- Barberini, L.; Noto, A.; Fattuoni, C.; Grapov, D.; Casanova, A.; Fenu, G.; Gaviano, M.; Carboni, R.; Ottonello, G.; Crisafulli, M.; et al. Urinary metabolomics (GC-MS) reveals that low and high birth weight infants share elevated inositol concentrations at birth. J. Matern. Neonatal Med. 2014, 27, 20–26. [Google Scholar] [CrossRef] [PubMed]
- Liu, J.; Chen, X.X.; Li, X.W.; Fu, W.; Zhang, W.Q. Metabolomic Research on Newborn Infants With Intrauterine Growth Restriction. Medicine 2016, 95, e3564. [Google Scholar] [CrossRef]
- Irving, S.Y.; Ravishankar, C.; Miller, M.; Chittams, J.; Stallings, V.; Medoff-Cooper, B. Anthropometry Based Growth and Body Composition in Infants with Complex Congenital Heart Disease. Clin. Nurs. Res. 2022, 31, 931–940. [Google Scholar] [CrossRef]
- Young, A.; Brown, L.K.; Ennis, S.; Beattie, R.M.; Johnson, M.J. Total body water in full-term and preterm newborns: Systematic review and meta-analysis. Arch. Dis. Child. Fetal Neonatal Ed. 2021, 106, 542–548. [Google Scholar] [CrossRef]
- Ueland, P.M. Choline and betaine in health and disease. J. Inherit. Metab. Dis. 2010, 34, 3–15. [Google Scholar] [CrossRef]
- Scalabre, A.; Jobard, E.; Demède, D.; Gaillard, S.; Pontoizeau, C.; Mouriquand, P.; Elena-Herrmann, B.; Mure, P.-Y. Evolution of Newborns’ Urinary Metabolomic Profiles According to Age and Growth. J. Proteome Res. 2017, 16, 3732–3740. [Google Scholar] [CrossRef]
- Cesare Marincola, F.; Corbu, S.; Lussu, M.; Noto, A.; Dessì, A.; Longo, S.; Civardi, E.; Garofoli, F.; Grenci, B.; Mongini, E.; et al. Impact of Early Postnatal Nutrition on the NMR Urinary Metabolic Profile of Infant. J. Proteome Res. 2016, 15, 3712–3723. [Google Scholar] [CrossRef] [PubMed]


| Title | Author, Year, Published | Methodology | Study Numbers | Patient Characteristics & Inclusion Criteria | Exclusion Criteria | Study Aim/Method | Main Findings | Over Arching Theme |
|---|---|---|---|---|---|---|---|---|
| 3-Methylhistidine/creatinine ratio in urine from low-birth-weight infants: Statistical analysis | Hulsemann et al., 1988 [34], Annals of Nutrition & Metabolism | Observational cohort, single centre | 30 (23 preterm + 7 term SGA) | Preterm infants (GA 30–36 weeks, age: 9–83 days postpartum) Term SGA infants (2–30 days postpartum) | Infants with major clinical problems (undefined), any infant cared for in the intensive care ward | To assess if the urinary 3-methylhistidine/creatinine ratio is constant over 24 h, as well a statistical analysis of the observed variability in this ratio among different children and in the same child on different days. | 1. Diurnal variation of the 3-methylhistidine/creatinine ratio is negligible in any given individual 2. Variability is found as a function of the day of sampling-hypothesised to be due to the corresponding current metabolic state of the individual 3. Infants with stagnating or decreasing weight had higher 3-methylhistidine/creatinine ratios and so this can potentially be used to assess current metabolic state in low-birth-weight infants. | 4 |
| Metabolic changes in early neonatal life: NMR analysis of the neonatal metabolic profile to monitor postnatal metabolic adaptations | Georgakopoulou et al., 2020 [35], Metabolomics | Observational cohort, 2 centre | 153 (141 term 12 late preterm) | Term infants (GA 37–40 weeks) Late preterm (GA 35–37 weeks) | Nil specifically mentioned | H NMR spectroscopy was used to compare the metabolic urinary profiles from the first and third days of life, assessing the impact of; delivery mode, prematurity, maternal smoking, gender, nutrition, and neonatal jaundice. | 1. From day 1 to day 3 multiple changes are noted in the urinary metabolic profiles of healthy term infants. Specifically stronger signals of creatinine, taurine, myo-inositol and weaker signals of creatine and glycine are seen on the first day of life when compared to the third day of life. 2. Trends in differentiation of metabolite levels between late preterm and term infants and observed at day 1 but lost by day 3. 3. There are specific differences between the urinary metabolic profiles of male and female infants, as well of those whose mothers who smoked during pregnancy. | 1, 2 |
| H1 NMR-based metabolomic analysis of urine from preterm and term neonates | Atzori et al. [36]. 2011 Frontiers in Bioscience | Observational cohort, 2 centre | 67 (26 term + 41 preterm infants) | Term infants (GA 37–40 weeks) Preterm infants (GA < 37 weeks) | Nil specifically mentioned | H1 NMR spectroscopy was used to analyse the urinary metabolic profiles of term and preterm infants, from samples collected within the first 12 h of life, to identify any gestational age-related differences. | 1. The urinary H1 NMR profile of premature neonates is different to that of full-term neonates. 2. Profiles also vary between different groups of preterm infants. (Those born at 23–32 weeks compared to those of 33–36 weeks GA). 3. Individual metabolites discriminating between the groups were: Hippurate, tryptophan, phenylalanine, malate, tyrosine, hydroxybutyrate, N-acetyl-glutamate, and proline. It is therefore suggested that amino acid biosynthesis and metabolism are the key metabolic mechanisms underlying foetal and perinatal maturation processes. | 2 |
| Urinary metabolite profiles in premature infants show early postnatal metabolic adaptation and maturation. | Moltu et al. [37]. 2014 Nutrients | Randomised control Trial, 2 centre | 50 (24 intervention, 26 control) | Preterm infants with birth weight (BW) < 1500 g: Intervention: GA 28.1 weeks (25.0–33.6) BW 940 g (460–1311) Control: GA 28.5 weeks (24.0–32.6) BW 1083 g (571–1414) (mean, range) | Congenital malformations, chromosomal abnormalities, critical illnesses with short life expectancy, clinical syndromes known to affect growth and development | To use H NMR spectroscopy to assess the urinary metabolic profile of premature infants randomised to either a standard or an enhanced diet. | 1. Enhanced nutrition did not appear to affect the urinary metabolic profiles greater than individual variation. 2. Infants given enhanced nutrition show greater growth velocity, but no changes in their urinary metabolic profile. 3. In all infants the glucogenic amino acids glycine, threonine, hydroxyproline and tyrosine, as well as the metabolites of the TCA (succinate, oxoglutarate, fumarate and citrate) increased during the early postnatal period. 4. The metabolite changes correlated with gestational age at birth and chronological age. 5. Threonine and glycine levels were elevated in first-week urine samples of the small for gestational age infants compared to appropriate for gestational age infants. 6.Neither sex nor the presence of infections had a significant effect on metabolic profile. | 1, 3, 4 |
| Comprehensive analysis of the l-arginine/l-homoarginine/nitric oxide pathway in preterm neonates: potential roles for homoarginine and asymmetric dimethylarginine in foetal growth | Buck et al. [38]. 2017 Amino Acids | Observational cohort, single centre, healthy preterm infants | 106 | 51 male infants and 55 female infants, GA 23 + 6–36 + 1 weeks, Group 1: n = 31 GA 23 + 6–29 + 6 BW 1.025 ± 0.292 kg, Group 2: n = 75 GA 30 + 0–36 + 1 BW 1.800 ± 0.288 kg. | Infection, sepsis, intraventricular haemorrhage > 2°, congenital disorders and/or chromosomal aberrations, pulmonary hypertension, mandatory ventilation, and infant respiratory distress syndrome > 3° | To investigate and describe the Arg/hArg/NO pathway in healthy preterm infants. | All enterally fed with formula or a combination of breast/formula milk. 10 had additional PN 1. ADMA (asymmetric dimethylarginine) and hArg (l-homoarginine) plasma levels were significantly higher in the extremely preterm infants than preterm infants’ group. 2. Urinary ADMA, SDMA and hArg did not correlate with GA, weight, or head circumference in either group. 3. There was no difference with respect to Arg in the plasma or nitrite/nitrate in the plasma or urine. 4. hArg seems to be of higher significance for the female than for the male foetus. Therefore, it is proposed that ADMA and hArg are involved in foetal growth, and that this manner is dependent on the gender | 2 |
| Metabolic products in urine of preterm infants characterized via gas chromatography-mass spectrometry | Hao et al. [39]. 2015 International Journal of Clinical and Experimental Medicine | Observational case–control, single centre | 92 (45 term + 47 preterm) | Term infants: GA 37–41 weeks Preterm infants: GA 28–36 weeks Note: All infants were formula fed from the 3rd postnatal hour | Foetal distress, birth asphyxia, neonatal complications within the first 6 postnatal hours, APGAR score < 8, abnormal blood gas or lactate, requirement for medical treatment. Maternal medical history of chronic or infectious disease, malnutrition, smoking, alcohol, or drug use. | To characterise the metabolic products of urine associated with preterm birth using gas chromatography on samples obtained within the first 24 h of life. Specifically, the levels of urinary lysine, phenylalanine, histidine, ornithine, fumaric acid, malic acid, succinic acid, lactose, stearic acid, and 4-hydro phenylacetic acid in the urine of preterm infants was compared to that of term. | 1. Normalized concentrations of all measured metabolites were significantly lower in preterm infants when compared to full-term infants, some were undetectable. (Lysine, phenylalanine, histidine, ornithine, fumaric acid, malic acid, succinic acid, lactose, stearic acid and 4-hydroxyphenylacetic acid). 2. Inferred that Amino acid, carbohydrate and fatty acid metabolism defects exist in preterm infants. | 2 |
| Human milk enhances antioxidant defences against hydroxyl radical aggression in preterm infants | Ledo et al. [40]. 2009 American Journal for Clinical Nutrition | Observational case–control, single centre | 83 (Human milk n = 29 Preterm formula n = 34 Term control group n = 20) | Human milk: GA 32 weeks (26, 36) Formula: GA 33 weeks (29, 36) (GA median (95% CI) BW: Human milk 1495 ± 497 g Formula fed: 1743 ± 435.1 g | Acute perinatal or chronic postnatal disease: currently on supplemental oxygen, medications, mineral, or vitamin supplementation, blood transfusion in the 2 weeks prior to enrolment, severe congenital abnormality, chromosomal abnormality, required GI surgery, required PN | To determine the effect of human milk on markers of oxidative stress. | 1. Preterm: GA < 37 weeks, Full enteral feeding either exclusively with human milk (own mother’s milk or donor) or with preterm formula, consistent and adequate weight gain the week before enrolment; Controls: healthy, term, fed human milk 2. Both preterm groups, when compared with term new-borns, had significantly higher urinary markers of oxidative stress. 3. The formula fed preterm infants eliminated significantly higher amounts of 8-oxodG and o-Tyr than the preterm infants fed human milk, leading to the conclusion that prematurity is associated with protracted oxidative stress, from which human milk is partially protective 4. When all the data was combined there was a significant correlation between markers of oxidative stress and birth weight. | 2, 3, 4 |
| Comparison between tryptophan methoxy indole and kynurenine metabolic pathways in normal and preterm neonates and in neonates with acute foetal distress | Munoz-Hoyas [41] 1998 European Journal of Endocrinology | Observational cohort, single centre | Total 112: 42 control, 30 preterm, 40 foetal distress | Preterm: < 37 weeks GA, Term infants suffering from foetal distress, Healthy term controls Mothers had one or more of; high risk pregnancy, obstetric antecedents or pregnancy diseases | Neurological or endocrine pathology | To analyse the kynurenine and methoxy indole metabolic pathways of tryptophan to identify changes in premature neonates and in neonates suffering from foetal distress. | 1. Diurnal differences exist cord in blood melatonin concentration and the urinary excretion of kynurenine- with greater concentrations of Kynurenine in the day and greater concentrations of Melatonin at night. This diurnal pattern is blunted in preterm infants and those with foetal distress. | 2 |
| Choline-related metabolites influenced by feeding patterns in preterm and term infants | Shoji et al. [42]. 2018 The Journal of Maternal-Foetal & Neonatal Medicine | Observational cohort, single centre | 39 (13 term breast fed, 6 term formula fed, 11 preterm breastfed, 9 preterm mixed feeding) | Term Breast: GA 39.2 ± 1.2 weeks BW 2962.8 ± 296.9 g Term formula: GA 38.1 ± 0.1 weeks, BW 2997.3 ± 181.2 g Preterm Breast: 29.7 ± 1.4 weeks, BW 1139.4 ± 260.1 g Preterm mixed: 30.1 ± 1.0 weeks, BW1223.6 ± 238.2 g (mean ± SD) | Term: Perinatal complications including asphyxia, infection, bleeding, Preterm: Major congenital abnormalities, metabolic disorders, maternal diabetes requiring insulin, chronic hypertension, or intrauterine infection | To examine the choline status of term and preterm infants using analysis of urinary excretion of choline metabolites. (Choline, N, N-dimethylglycine, Sarcosine, and Betaine) | 1. Type of feeding affects choline metabolism 2. Urinary excretion of choline metabolites (Choline, N, N-dimethylglycine, Sarcosine, and Betaine) was significantly higher in term breast fed infants than term formula fed infants. 3. Urinary excretion of Choline, Betaine, and Sarcosine was not significantly different between the preterm breast fed and term breast fed infants. | 3 |
| Suppressive effects of breast milk on oxidative DNA damage in very low birthweight infants | Shoji 2003 et al. [43] Archives of Disease in Childhood Foetal and Neonatal Edition | Observational case control, single centre, | 29 (15 breast fed, 14 formula fed) | Breast fed: 8 male 7 female, mean GA 29.2 weeks SD 2.3, mean BW 1231 g, SD 298 Formula fed: 8 male 6 female, mean GA 28.7 weeks SD 2.0, mean BW 1182 g SD 281 Birth weight < 1500 g, cared for in neonatal intensive care unit, | Congenital abnormalities | To examine the antioxidant effects of breast milk in very low birth weight infants | 1. 8-OHdG is known to be a marker for in vivo oxidative DNA damage. 2. Urinary 8-OHdG excretion at 14 and 28 days of age is significantly lower than that at 2 and 7 days of age in breast fed infants. 3. Urinary 8-OHdG excretion is also lower at days 14 and 28 in breast fed infants when compared to formula fed infants. 4. In formula fed infants there is no significant difference in urinary 8-OHdG excretion at 2, 7, 14, and 28 days of age. Conclusion: Evidence of the antioxidant effect of human milk in very low birth weight infants. | 3 |
| New-born Urinary Metabolic Signatures of Prematurity and Other Disorders: A Case Control Study | Diaz et al. [44]. 2016 Journal of Proteome Research | Observationalcase control, single centre | 148: (46 Controls, 102 with specific disorders as listed: (1) late preterm = 17, (2) Respiratory depression = 10, (3) LGA = 18, (4) Congenital malformation = 9 (5) PROM = 33 and (6) Jaundice = 12.) | Healthy Controls + New-borns with specific disorders as follows: Late Preterm infants (GA 33–36 weeks) Infants with respiratory depression following delivery, LGA, congenital malformations, PROM, jaundice | Nil specifically mentioned | To assess, by H NMR spectroscopy, the urinary metabolic signature of prematurity whilst also examining potential confounders and signature specificity by comparing with the metabolic signatures of other disorders. | 1. Overall the metabolic signature of prematurity was comprised of changes in 25 identified, and several more unassigned, metabolites. Those identified suggest disturbances in nucleotide metabolism, lung surfactants biosynthesis and renal function, along with enhancement of TCA cycle activity, fatty acids oxidation, and oxidative stress. 2. Gender and mode of delivery impact urinary metabolic profile. 3. Profile changes were also noted for new-borns experiencing respiratory depression, LGA and malformations but these were distinct from the changes of prematurity. | 2, 4 |
| Urinary metabolites of oxidative stress and nitric oxide in preterm and term infants | Farkouh et al. [45]. 2006 Biology of the Neonate | Observational cohort, 2 centre study | 102 (82 preterm 20 term) | Preterm: GA 27.4 ± 2.6 weeks BW 1048 ± 407 g Term: GA 38.4 ± 1.6 weeks BW 3210 ± 4467 g (mean ± SD) | All: Major congenital abnormality, chromosomal anomaly, received iNO or multivitamin supplementation, Term controls: SGA, requiring medical support | To determine the effects of clinical interventions in preterm infants on markers of oxidative stress and nitric oxide metabolism. The substrate markers measured were levels of urinary peroxides and nitrates/nitrites, respectively. | 1. Premature infants had significantly higher urinary peroxide levels than term infants. Urinary nitrite/nitrate levels were not significantly different. 2. Infants receiving PN had significantly higher urinary peroxide levels than those not receiving PN. 3. Administration of Indomethacin resulted in lower nitrate and nitrite levels. 4. Receiving mechanical ventilation or high inhaled Fi02 did not affect either marker. | 2, 3 |
| Fatty acid profiles, antioxidant status, and growth of preterm infants fed diets without or with long-chain polyunsaturated fatty acids: a randomized clinical trial | Koletzko et al. [46]. 2003 European Journal of Nutrition | Double blind, randomised control trial | Total: 46 (29 formula fed-15 LCP supplemented formula, 14 low LCP formula, 17 breast fed controls) | Preterm, ‘stable’ clinical condition, BW < 1800 g Breast Fed Controls: GA 31 ± 2 weeks, BW 1440 ± 288 g, Supplemented formula: GA 30 ± 2 weeks, BW 1145 ± 288 g, Unsupplemented formula: GA 30 ± 3 weeks, BW 1177 ± 344 g. (mean ± SD) | Artificial ventilation, need for supplemental oxygen with Fi02 > 0.3, presence of apparent genetic, gastrointestinal, or metabolic disorders | To examine the effect of an infant formula enriched with n-6 and n-3 long chain polyunsaturated fatty acids on plasma fatty acids, antioxidant studies and growth in preterm infants. Antioxidant status was assessed using urinary malondialdehyde as a marker of oxidative stress. | 1. Plasma long chain polyunsaturated fatty acid levels similar to those of breast fed infants can be achieved with a supplemented formula. 2. Urinary malondialdehyde excretion was significantly higher from formula fed infants than infants fed human milk. There was however no difference between the formula fed groups, suggesting there to be no adverse effects of the enriched formula with regard to oxidative stress. 3. No difference in growth was seen between the groups over the study period. | 3, 4 |
| Urinary metabolomic profile of preterm infants receiving human milk with either bovine or donkey milk-based fortifiers | Giribaldi et al. [47]. 2020 Nutrients | Single blinded, randomised control trial | 54 (Bovine-Human milk = 27, Donkey-Human milk = 27) | GA < 32 weeks and/or BW ≤ 1500 g Bovine-Human milk: BW 1174 g (326), Donkey-Human milk: BW 1227 g (302) (mean g (SD)) | Severe gastrointestinal pathology, chromosomal abnormality, major congenital abnormality, metabolic disease, disseminated intravascular coagulopathy, patent ductus arteriosus, renal failure | To analyse the urinary metabolome of infants fed human milk fortified with bovine and donkey milk-based fortifiers. The metabolic profiles were analysed at day 1 and day 21 of the intervention using H NMR spectroscopy. | 1. The urinary metabolic profiles of preterm and very low birth weight infants show postnatal adaptation. Changes common to all infants studied included: increasing urinary betaine, citrate, succinate, formate, alpha-ketoglutarate and N, N-dimethylglycine, and decreasing N-acetyl tyrosine. 2. Bovine and donkey milk fortifiers give distinct urinary metabolic profiles, due to the differing nutrient qualities. There was higher excretion of galactose in the donkey milk group but higher carnitine, choline, lysine, and leucine in the bovine group. | 1, 3 |
| Is the body composition development in premature infants associated with a distinctive nuclear magnetic resonance metabolomic profiling of urine? | Morniroli et al. [46] 2019 The Journal of Maternal-Fetal & Neonatal Medicine | Observational cohort, single centre | 20 (13 preterm, 7 term) | GA ≤ 32 weeks, singleton pregnancy, exclusively formula fed Preterm: BW 1113.4 g (CI 956.8–1270) GA 29.7 (CI 28.6–30.8) Term: BW 3285 g (CI 2907–3663) GA 38.7 (CI 37.9–39.5) | Congenital malformations, chromosomal abnormalities, chronic lung disease, necrotizing enterocolitis, Papillae grade intraventricular haemorrhage > 2 or any renal, endocrine, or cardiac congenital disease | To compare the metabolomic profile of preterm infants at term and at 3 months with that of term infants, and to determine if there is any association with body composition development. | 1. At term-corrected age, fat mass, both in terms of percentage and absolute content, was significantly higher in preterm infants than in full-term infants. At 3 months corrected the body composition parameters were similar between the two groups. 2. There were significant differences in the urinary metabolic profiles of the two groups. At term corrected the preterm group exhibited higher urinary citrate, choline/phosphocholine, lactate, betaine, and glucose but lower myo-inositol, creatinine, dimethylamine, and ethanolamine. At 3 months corrected the preterm group exhibited higher urinary creatinine, choline/phosphocholine and lactate and a lower betaine, glycine, and citrate. | 1, 2, 4 |
| Theme | Comparison | Key Findings | Associated Metabolic Pathways |
|---|---|---|---|
| 1. Metabolic Maturation | Preterm infants’ maturation over time |
|
|
| Term and later preterm infants from day 1 to day 3 of life |
|
| |
| 2. Metabolic Signatures | Preterm infants’ vs. Term Infants | During first 24 h of life:
|
|
| 3. Nutrition | Formula vs. Human milk |
|
|
| Parenteral nutrition (PN) vs. Enteral feeding |
| ||
| 4. Growth | Birth weight |
|
|
| Preterm vs. term infants |
| ||
| Preterm infants SGA |
| ||
| Preterm infants with stagnating or decreasing weight |
| ||
| Preterm infants vs. term infants |
|
Publisher’s Note: MDPI stays neutral with regard to jurisdictional claims in published maps and institutional affiliations. |
© 2022 by the authors. Licensee MDPI, Basel, Switzerland. This article is an open access article distributed under the terms and conditions of the Creative Commons Attribution (CC BY) license (https://creativecommons.org/licenses/by/4.0/).
Share and Cite
Marino, L.V.; Paulson, S.; Ashton, J.J.; Weeks, C.; Young, A.; Pappachan, J.V.; Swann, J.; Johnson, M.J.; Beattie, R.M. A Scoping Review: Urinary Markers of Metabolic Maturation in Preterm Infants and Future Interventions to Improve Growth. Nutrients 2022, 14, 3957. https://doi.org/10.3390/nu14193957
Marino LV, Paulson S, Ashton JJ, Weeks C, Young A, Pappachan JV, Swann J, Johnson MJ, Beattie RM. A Scoping Review: Urinary Markers of Metabolic Maturation in Preterm Infants and Future Interventions to Improve Growth. Nutrients. 2022; 14(19):3957. https://doi.org/10.3390/nu14193957
Chicago/Turabian StyleMarino, Luise V., Simone Paulson, James J. Ashton, Charlotte Weeks, Aneurin Young, John V. Pappachan, Jonathan Swann, Mark J. Johnson, and Robert Mark Beattie. 2022. "A Scoping Review: Urinary Markers of Metabolic Maturation in Preterm Infants and Future Interventions to Improve Growth" Nutrients 14, no. 19: 3957. https://doi.org/10.3390/nu14193957
APA StyleMarino, L. V., Paulson, S., Ashton, J. J., Weeks, C., Young, A., Pappachan, J. V., Swann, J., Johnson, M. J., & Beattie, R. M. (2022). A Scoping Review: Urinary Markers of Metabolic Maturation in Preterm Infants and Future Interventions to Improve Growth. Nutrients, 14(19), 3957. https://doi.org/10.3390/nu14193957