Abstract
Despite continuous growth in dietary pattern research, the relative importance of each dietary component in the overall pattern and their joint effects on mortality risk have not been examined adequately. We explored the individual and joint associations of multiple food groups with all-cause and cause-specific mortality (cardiovascular disease (CVD) or cancer), by analyzing data from a cohort of 3995 Hong Kong Chinese older adults in the Mr. Osteoporosis (OS) and Ms. OS Study. Cox proportional hazards models were used to examine the associations of food groups with mortality risk. The individual and joint contribution of food groups to mortality risk has been quantified by a machine learning approach, i.e., the Quantile G-Computation. When comparing the highest with the lowest quartile of intake, dark green and leafy vegetables (hazard ratio (HR) = 0.82, 95% confidence interval (CI) = 0.70 to 0.96, Ptrend = 0.049), fruit (HR = 0.79, 95% CI = 0.68 to 0.93, Ptrend = 0.006), legumes (HR = 0.75, 95% CI = 0.63 to 0.87, Ptrend = 0.052), mushroom and fungi (HR = 0.76, 95% CI = 0.65 to 0.88, Ptrend = 0.023), soy and soy products (HR = 0.77, 95% CI = 0.66 to 0.90, Ptrend = 0.143), and whole grains (HR = 0.76, 95% CI = 0.65 to 0.89, Ptrend = 0.008) were inversely associated with all-cause mortality. Legume intake was associated with a lower risk of CVD mortality, while fruit, nuts, soy and soy products were associated with a lower risk of cancer mortality. From the Quantile G-Computation, whole grains, legumes, fruits, mushroom and fungi, soy and soy products had a higher relative weighting on mortality risk, and the joint effect of food groups was inversely associated with the mortality risk due to all-causes (HR = 0.39, 95% CI = 0.27 to 0.55), CVD (HR = 0.78, 95% CI = 0.67 to 0.91), and cancer (HR = 0.31, 95% CI = 0.15 to 0.65). From a sex-stratified analysis, most associations between food groups (whole grains, legumes, fruits, mushroom and fungi, soy and soy products) and mortality risk remained significant among men. In conclusion, whole grains, legumes, fruits, mushroom and fungi, soy and soy products were the main contributors to a reduction in mortality risk, and their joint effects were stronger than individual food groups. Moreover, the sex-specific association of sweets and desserts with cancer mortality may be worth further investigation.
1. Introduction
Maintaining a healthy diet is a major lifestyle factor in preventing multiple chronic diseases, including diabetes, cardiovascular diseases (CVD), and cancer [1]. While multiple studies have evaluated the relationships between individual nutrients and health, emerging evidence has suggested dietary patterns to explain the interactions between different foods and food components [2]. There are some common features of healthy dietary patterns, including the consumption of wholegrain cereals, fruits, and vegetables, that are recommended by the World Health Organization Global Strategy on Diet, Physical Activity, and Health [3], and cholesterol-lowering foods, namely oats, barley, nuts, and plant protein foods (e.g., soy and other legumes) [4]. In addition, a higher adherence to plant-based diets, especially those rich in a variety of plant foods (whole grains, fruits, vegetables, nuts, legumes, and vegetable oils), may be associated with decreased weight gain and lower adiposity in prospective cohorts among the general population [5,6].
Despite continuous growth in dietary pattern research, there are some limitations in the current statistical approaches to analyzing the association between dietary patterns and health outcomes. First, the health effects of the specific dietary component could be diluted within the total dietary pattern [7], while the relative importance of each component in the overall pattern is seldom verified by a quantitative approach [8]. Second, the associations between healthy dietary patterns and health outcomes are mainly examined by conventional regression models, such as logistic regression and Cox proportional hazards regression. Although regression analysis can adjust for multiple confounders, these models have not accounted for the synergy of dietary factors on health outcomes [9].
To address the knowledge gap, sophisticated statistical methods that can investigate the single and joint effects of dietary components on health in a prospective study are necessary. A few studies in recent years have explored the interaction effects of food groups on cardiovascular health and pregnancy outcomes [10,11]. In the present study, we aim to supplement the traditional analytic methods of nutritional epidemiology using Quantile G-Computation, a machine-learning-based approach that can examine the influence of dietary factors on disease outcomes as a mixture of exposures. The findings will help to reveal new diet–disease relationships in a sex-specific manner and identify beneficial or detrimental food groups that are specific to different populations.
2. Materials and Methods
2.1. Study Design and Population
We analyzed data from a prospective cohort, the Mr. Osteoporosis and Ms. Osteoporosis Study in Hong Kong (Mr. OS and Ms. OS study), and evaluated the associations of food groups with all-cause and cause-specific mortality [12]. The Mr. OS and Ms. OS study is a prospective cohort study that recruited 4000 community-living Hong Kong Chinese men and women aged at least 65 years in the period 2001–2003 [12]. The target was to recruit a stratified sample that equally assigned the cohort into three age groups (65–69, 70–74, and ≥75 years). Compared with the general elderly population in Hong Kong in this age group, the participants had higher educational levels (9.8% vs. 3.8% with tertiary education), a higher proportion that were married (70.7% vs. 59.9%) and a slightly lower proportion of those living alone (10.8% vs. 11.3%) [13]. The Mr. OS and Ms. OS study was conducted according to the guidelines laid down in the Declaration of Helsinki, and all procedures involving human subjects were approved by the Clinical Research Ethics Committee of the Chinese University of Hong Kong (CRE: 2003.102). This study is reported as per the Strengthening the Reporting of Observational Studies in Epidemiology (STROBE) guideline for nutritional epidemiology (Table S1).
2.2. Dietary Assessment
A dietary assessment was conducted at a baseline level using a validated food frequency questionnaire (FFQ) (OS FFQ hereafter) with 280 food items validated against 24 h dietary recalls [14,15]. Each participant was asked to respond to the FFQ by trained personnel in a face-to-face interview, answering how often they consumed each food item each day or each week, and the size of each portion, over the past year. A pictorial catalogue with individual food portions was provided as a guide. The daily amount of consumption of 34 food groups (in grams/day) including fruits, vegetables, whole grains, refined grain, eggs, milk and milk products, poultry, and red and processed meat, etc., was calculated. The consumption of each food group in quartiles (Q) is set out in Table S2.
2.3. Ascertainment of Mortality Outcomes
Data on the mortality statistics of all participants were obtained from the Death Registry of the Department of Health of Hong Kong and collected through to 31 March 2017 [13]. Causes of death were defined by the International Classification of Disease (ICD) version 10 codes, and classified as all-cause, CVD-specific (I00–I99) and cancer-specific (C00–D49) mortality [14].
2.4. Covariates
Demographic, lifestyle, and health information were all collected at a baseline level, including the education level (secondary school or below vs. post-secondary education), smoking habits (never, former or current smoker), alcohol consumption (≥12 drinks of beer, wine, including Chinese wine, or liquor over the previous year), physical activity, dietary intake, and medical history (diabetes, hypertension, stroke, heart attack, angina, congestive heart failure or cancer). Physical activity levels were evaluated using the Physical Activity Scale for the Elderly (PASE), and a higher PASE score represented a higher intensity of physical activity in which the older adults engaged [16]. Body weight was measured using the Physician Balance Beam Scale (Healthometer, McCook, NE, USA) to the nearest 0.1 kg, with participants wearing a light gown. Height was measured to the nearest 0.1 cm using the Holtain Harpenden Stadiometer (Holtain Ltd., Pembrokeshire Wales, UK), which was used to compute body mass index (BMI).
2.5. Statistical Analysis
Baseline characteristics were stratified by sex (men or women) using means with standard deviations for continuous variables and frequencies with percentages for categorical variables. To compare baseline characteristics, the Mann–Whitney U test was used for continuous variables and χ2 test for categorical variables. We performed three stages of data analyses to identify the individual and joint associations in food groups that had the most substantial influence on mortality risk (Figure S1). Since 10 out of 34 (29.4%) food groups had ≥50% participants with zero intake and may have complicated the result interpretation, we included 24 (70.6%) food groups that at least half of the study population had consumed for further analysis (Table S2).
In stage 1, we used the elastic net penalty regression to identify the most important food groups that were associated with mortality outcomes (all-cause, CVD, and cancer) [17]. The elastic net model can perform selection, and enable the inclusion of collinear predictors through combining the least absolute shrinkage and the selection operator and ridge. We performed a 10-fold cross validation to acquire the minimum mean squared error (MSE) for an unbiased and robust estimate of prediction accuracy [18]. A set of elastic net coefficients (βEN) were estimated by minimizing the MSE. The βEN represented the change in mean outcome variables per increment of each food group. If the absolute value of βEN had not shrunk to zero with a minimum MSE, the related food group was selected [19]. We performed elastic net penalty regressions separately for each mortality outcome to select the set of food groups.
In stage 2, participants were categorized into Q according to the consumption of each food group, with the lowest Q serving as the reference group. Cox proportional hazards models were used to estimate hazard ratios (HRs) and 95% confidence intervals (CIs) for the associations between the food group consumption Q and mortality outcomes. The Cox proportional hazards models were adjusted for sex (men vs. women), age, dietary energy, BMI, physical activity (all continuous variables), medical history (yes or no), smoking habits (never, former or current smokers), alcohol drinking (yes or no), and education level (post-secondary education vs. secondary school or below). We also applied subgroup analyses by sex. Trend analysis was performed by assigning median values to each food group quartile and treating it as a continuous variable in the regression model [20].
In stage 3, we applied the Quantile G-Computation, a machine-learning method, to evaluate the importance of each food group and their joint effects on the risk of mortality [21,22]. The qgcomp.cox.noboot function in the R qgcomp package was used to estimate the exposure effects, which firstly categorizes all food groups into Q, then assigns each food group with a positive or negative weight on their relationship with the outcomes. If the included food groups were associated with mortality in different directions, the positive or negative weights were interpreted as the percentage of exposure effects that had a positive or inverse association with mortality outcomes, with the positive and negative weights each adding up to one. In addition, a qgcomp index was computed based on the variable-specific coefficients for each included food group, and the association between the index and the risk of mortality was examined [21,22]. In other words, the qgcomp index summarized the joint effect of increasing one quartile of each food group with a negative (positive) weight with the cause-specific mortality risk, and the overall effect was presented as HR (95% CI). The Quantile G-Computation was adjusted for sex, age, dietary energy, body mass index, physical activity, medical history, smoking habits, alcohol drinking, and education level. We repeated all analyses in both men and women.
Statistical tests were two-sided and p < 0.05 was considered statistically significant. All statistical analyses were conducted with R 4.1.2 (R Foundation for Statistical Computing, Vienna, Austria).
3. Results
3.1. Characteristics of the Study Participants
After excluding five people with missing information on dietary intake or covariates, 3995 (99.9%) participants were included in the analyses. During a median (interquartile range) of 13.75 (11.60 to 14.51) years of follow-up, we documented 1370 cases (34.3%) of all-cause mortality, 317 cases (7.9%) of CVD mortality, 469 cases (11.7%) of cancer mortality. The mortality rates due to all-causes, CVD or cancer were 27.73 (95% CI = 26.34 to 29.12), 6.36 (95% CI = 5.60 to 7.12), and 9.49 (95% CI = 8.58 to 10.40) events per 1000 person-years. The baseline characteristics of the participants in this study are presented in Table 1. As shown by the Mann–Whitney U test, men tended to have, on average, higher dietary energy, lower BMI, and higher physical activity compared to women. As demonstrated by the chi-square test, men were more prevalent in the categories of suffering from a stroke, angina, being a smoker or alcohol drinker, and having post-secondary education compared to women. Except for cruciferous vegetables, legumes, and starchy vegetables, there were sex-specific differences between men and women in the dietary consumption of food groups (Table S3).

Table 1.
Baseline characteristics of participants in the Mr. OS and Ms. OS Study.
3.2. Food Group Selection Using Elastic Net Regression Model
Elastic net regression models were performed in 24 food groups to identify the associations with mortality risk. Three sets of food groups with non-zero coefficients of βEN were selected according to each mortality outcome (all-cause, CVD or cancer) (Figures S2–S4). We selected 10 food groups which were associated with an all-cause mortality risk (βEN varied from −0.0033 to 0.0014) (Table S4). For CVD mortality, 3 food groups were selected (βEN < −0.0001 for Legumes, starchy vegetables, and tomatoes) (Table S4). For cancer mortality, 12 food groups were selected (βEN varied from −0.0009 to 0.0038) (Table S4).
3.3. Food Groups and All-Cause Mortality
Table 2 has presented the associations between food groups and all-cause mortality in the single-food group model. When comparing the extreme Q (Q4 versus Q1), the reduced risk of all-cause mortality was observed for dark green and leafy vegetables (HR = 0.82, 95% CI = 0.70 to 0.96, Ptrend = 0.049), fruit (HR = 0.79, 95% CI = 0.68 to 0.93, Ptrend = 0.006), legumes (HR = 0.75, 95% CI = 0.63 to 0.87, Ptrend = 0.052), mushroom and fungi (HR = 0.76, 95% CI = 0.65 to 0.88, Ptrend = 0.023), soy and soy products (HR = 0.77, 95% CI = 0.66 to 0.90, Ptrend = 0.143), and whole grains (HR = 0.76, 95% CI = 0.65 to 0.89, Ptrend = 0.008).
Table 2.
Prospective association of quartile (Q) of food groups with an all-cause mortality risk selected by elastic net regression among participants in the Mr. OS and Ms. OS Study.
In the Quantile G-Computation of ten food groups (Figure 1), high-fat milk and milk products had the highest relative weighting (weighted at 0.410) among three food groups with positive weights. Whole grains had the highest negative weighting (weighted at 0.246) among seven food groups with negative weights. The qgcomp index has also inversely associated with the risk of all-cause mortality (HR = 0.39, 95% CI = 0.27 to 0.55).
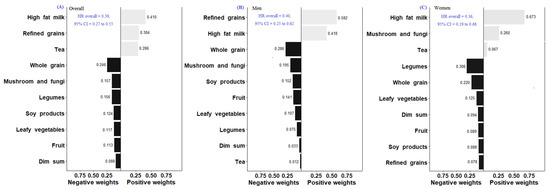
Figure 1.
Weights representing the proportion of the positive or negative partial effects of each food group on all-mortality risk in the Quantile G-Computation Overall (A), Men (B), and Women (C). Model adjusted for sex, age, dietary energy, body mass index, physical activity, systolic blood pressure, medical history (diabetes, hypertension, stroke, heart attack, angina, congestive heart failure or cancer), smoking habits, alcohol drinking, and education level.
3.4. Food Groups and Cause-Specific Mortality
Table 3 presents the association between food groups and CVD mortality in the single-food group model. When comparing the food intake at Q4 versus Q1, legume intake was associated with a lower risk of CVD mortality overall (HR = 0.64, 95% CI = 0.45 to 0.91, Ptrend = 0.065). However, neither the highest quartile of intake for starchy vegetables (HR = 0.81, 95% CI = 0.59 to 1.12, Ptrend = 0.085) nor tomatoes (HR = 0.74, 95% CI = 0.52 to 1.04, Ptrend = 0.039) were associated with the risk of CVD mortality. In Quantile G-Computation of three food groups (Figure 2), all three selected food groups had negative weights on the outcome, implying an inverse association with CVD mortality. Legumes had the highest negative weight on the association with CVD mortality (weighted at 0.470). The qgcomp index was also inversely associated with the risk of CVD mortality (HR = 0.78, 95% CI = 0.67 to 0.91).
Table 3.
Prospective association of the quartile (Q) of food groups with cardiovascular mortality selected by elastic net regression among participants in the Mr. OS and Ms. OS Study.
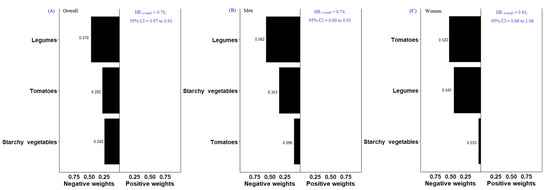
Figure 2.
Weights representing the proportion of the positive or negative partial effect for each food group on CVD-mortality risk in the Quantile G-Computation Overall (A), Men (B), and Women (C). Model adjusted for sex, age, dietary energy, body mass index, physical activity, systolic blood pressure, medical history (diabetes, hypertension, stroke, heart attack, angina, congestive heart failure or cancer), smoking habits, alcohol drinking, and education level.
When comparing the food intake at Q4 versus Q1, fruit (HR = 0.68, 95% CI = 0.51 to 0.89, Ptrend = 0.002), nuts (HR = 0.72, 95% CI = 0.55 to 0.94, Ptrend = 0.550), soy and soy products (HR = 0.72, 95% CI = 0.54 to 0.95, Ptrend = 0.051) were associated with a lower risk of cancer mortality (Table 4). In the Quantile G-Computation of twelve food groups (Figure 3), tea had the highest relative weighting (weighted at 0.700) among five food groups with positive weights. Fruit had the highest negative weighting (weighted at 0.287) among seven food groups. The qgcomp index was also inversely associated with the risk of cancer mortality (HR = 0.31, 95% CI = 0.15 to 0.65).
Table 4.
Prospective association of the quartile (Q) of food groups with cancer mortality selected by Elastic net regression among participants in the Mr. OS and Ms. OS Study.
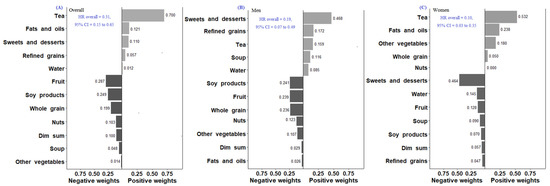
Figure 3.
Weights representing the proportion of the positive or negative partial effects of each food group on cancer-mortality risk in the Quantile G-Computation Overall (A), Men (B), and Women (C). Model adjusted for sex, age, dietary energy, body mass index, physical activity, systolic blood pressure, medical history (diabetes, hypertension, stroke, heart attack, angina, congestive heart failure or cancer), smoking habits, alcohol drinking, and education level.
3.5. Sex-Stratified Subgroup Analysis
In the single-food group model, the associations between food groups and all-cause mortality remained significant when stratified by sex, except for fruit (HR = 0.84, 95% CI = 0.63 to 1.10, Ptrend = 0.008) and mushroom and fungi (HR = 0.87, 95% CI = 0.67 to 1.13, Ptrend = 0.023) among women (Table 2 and Table S5). When comparing the extreme Q, legume intake was associated with a lower risk of CVD mortality among men (HR = 0.62, 95% CI = 0.41 to 0.94, Ptrend = 0.094) (Table 3 and Table S6). Similar to all participants, the association between the intake of fruit (HR = 0.62, 95% CI = 0.44 to 0.88, Ptrend = 0.001), nuts (HR = 0.67, 95% CI = 0.48 to 0.94, Ptrend = 0.776), soy and soy products (HR = 0.69, 95% CI = 0.49 to 0.98, Ptrend = 0.196) was inversely associated with cancer mortality among men, and tea (HR = 2.16, 95% CI = 1.38 to 3.37, Ptrend = 0.013) was positively associated with cancer mortality among women (Table 4 and Table S7).
In the Quantile G-Computation for all-cause mortality (Figure 1), refined grains had the highest relative weighting (weighted at 0.582) among two food groups with positive weights. Whole grains had the highest negative weighting (weighted at 0.286) among eight food groups with negative weights among men. For women, high-fat milk and milk products had the highest relative weighting (weighted at 0.673) among three food groups with positive effects on all-cause mortality. Legumes had the highest negative weighting (weighted at 0.306) among seven food groups with negative effects. We found that the qgcomp index was inversely associated with the risk of all-cause mortality among men (HR = 0.40, 95% CI = 0.25 to 0.62) and women (HR = 0.36, 95% CI = 0.19 to 0.68). For CVD mortality (Figure 2), the foods with the highest negative weight on the association were legumes among men (weighted at 0.562) and tomatoes among women (weighted at 0.522) The qgcomp index was inversely associated with the risk of CVD mortality among men (HR = 0.74, 95% CI = 0.61 to 0.91) but not women (HR = 0.84, 95% CI = 0.66 to 1.06). For cancer mortality (Figure 3), sweets and desserts had the highest relative weighting (weighted at 0.468) among five food groups with positive weights. Soy and soy products had the highest negative weighting (weighted at 0.241) among seven food groups among men. For women, tea had the highest relative weighting (weighted at 0.532) among four food groups with positive weights. Sweets and desserts had the highest negative weighting (weighted at 0.464) among eight food groups. The qgcomp index was also inversely associated with the risk of cancer mortality among men (HR = 0.19, 95% CI = 0.07 to 0.49) and women (HR = 0.10, 95% CI = 0.03 to 0.35).
4. Discussion
In this prospective cohort analysis of ~4000 Hong Kong older adults, we have examined the individual and joint effects of food groups on cause-specific mortality risks with a combination of conventional and advanced statistical methodologies. Whole grains, legumes, mushroom and fungi, and soy and soy products were the main identified food groups associated with a lower risk of all-cause and CVD-cause mortality, moreover, fruits, and soy and soy products were the more important food groups associated with a lower risk of death due to cancer. Furthermore, the overall effects of all food groups included in this study were more strongly associated with a lower mortality risk than individual food groups regardless of outcomes. Our analysis has demonstrated how the importance of each food group can be evaluated in the totality of a healthy dietary pattern.
4.1. Comparison with Previous Literature
The food groups that are the main contributors to the risk of mortality, as identified by Quantile G-Computation, were generally consistent with the evidence from previous literature. High-fat milk and milk products and refined grains provided the highest contribution to the all-cause mortality risk, which can be explained by their high contents of saturated fat and their high glycemic index. While the association between saturated fat and cause-specific mortality was supported by a meta-analysis of prospective cohorts [23], the certainty of evidence on the association between glycemic index and mortality requires improvement [24].
For foods that have a negative weight on mortality risk (whole grains, fruits, legumes, mushroom and fungi, and soy and soy products), these are rich sources of dietary fiber, which may improve health through multiple biological mechanisms, such as triggering satiety cues, delaying gastric emptying and prolonging nutrient absorption, improving the blood lipid profile, and protecting against oxidative stress [25]. Furthermore, dietary fiber may serve as the prebiotic substrates for gut microbiota to ferment and produce bioactive metabolites that can benefit cardiometabolic health [25]. For example, dietary fiber can be fermented by gut microbiota into various types of short-chain fatty acids (SCFAs) [26], mainly acetate, propionate, and butyrate, which are involved in many physiological functions [27], and enhance gut microbiota diversity [28]. The literature has also identified specific SCFA-producing bacteria, such as Faecalibacterium that ferment pectin from apples, oranges, and carrots, and fructans from onions, bananas, and garlics [29].
4.2. Sex- and Population-Specific Associations of Food Groups with Mortality Risk
In the present study, we not only identified general classes of foods that are beneficial for long-term health, but also observed several sex- and population-specific associations of food groups with mortality risk. First, sweets and desserts had a positive weight on the risk of cancer mortality in men but had a negative weight among women. Although sex-specific associations were not examined, the analysis of two prospective cohorts in Sweden has found an inverse significant association between intakes of treats (mainly cookies, cakes, pies, and buns) and all-cause mortality [30]. The authors postulated that low treat consumption might reflect fewer social connections [31], hence a higher risk of mortality [32]. Furthermore, in another analysis of Mr. OS and Ms. OS Study data, participants with a relatively high sugar intake were more likely to have higher educational levels, a lower prevalence of diabetes and hypertension, a higher intake of vitamin D, calcium and milk, and less fat consumption than their counterparts [33]. The way in which sugar may influence mortality risk according to sex and dietary source (liquid or solid) requires further investigation, especially among older adults.
Second, we have demonstrated that the joint HRs of legumes, tomatoes, and starchy vegetables (computed as the qgcomp index) was inversely associated with the risk of CVD mortality significantly overall (HR = 0.78) and among men (HR = 0.74). Legumes are a rich source of flavonoids, vitamin E and α-linolenic acid, which have a significant impact in preventing CVD [34]. Meanwhile, tomatoes are a source of lycopene, and meta-analyses suggest that it may have positive effects on blood lipids, blood pressure, and endothelial function [35], but the relationship with CVD prevention is still inconclusive [36]. For starchy vegetables, their role as part of a healthy dietary pattern is still under debate, because of its diversity in nutritional composition across populations [37]. It is notable that the individual effects of each food group was not significant in the Cox regression model. As demonstrated by another analysis of the Mr. OS and Ms. OS Study, the adherence to a cholesterol-lowering plant-based dietary pattern (the Portfolio Diet) was associated with a 28% lower risk of all-cause and cancer mortality [12], which echoes the perspective that nutrients may provide summative health benefits in the context of general dietary patterns.
Third, tea consumption was positively associated with cancer mortality, particularly for women. Tea has been viewed as an anti-cancer agent by multiple pathways, such as promoting antioxidant activity, inhibiting NF-κB and AP-1, regulating cell cycle, inhibiting receptor tyrosine kinase pathways, controlling epigenetic modifications, and modulating the immune system [38]. However, a recent meta-analysis has examined the association between tea consumption and 26 cancer sites from 113 individual studies, and has found no consistent associations for most comparisons except for the association between lymphoid neoplasms and green tea [39]. The authors suggested that a well-defined exposure of tea drinking by considering the degree of fermentation, the sources, and the water temperature of tea, will help to clarify the inconsistency in research findings [39]. In the present study, tea consumption was calculated from the total intake of green and black tea, and the outcome was defined as death from any cancer. Although our data has not provided a detailed breakdown of tea, the Quantile G-Computation provided important information on the relative weighting of tea in cancer mortality among older adults, generating a hypothesis for further studies.
4.3. Advantages of the Present Statistical Approach
In the present study, food groups that were associated with each mortality outcome were selected by elastic net penalty regression, followed by Quantile G-Computation to assess how the joint increment of included food groups might influence mortality risk. Both methods are increasingly being applied in environmental epidemiology to investigate the health effects of a mixture of chemical exposures [17,22]. Elastic net penalty regression is a method that calculates the penalty terms of the regression coefficients for each dietary variable, deleting irrelevant variables by shrinking their effect estimates exactly to zero [17]. In other words, a long list of inter-related food groups can be trimmed down, leaving us with a mixture of food groups related to the health outcomes. In addition, Quantile G-Computation analyzes mixtures data and generates the overall exposure effects of interest. Quantile G-Computation does not require pre-assigned positive or negative weights on a selected dietary variable [40], and has an advantage of time-to-event analysis with computational efficiency [10,22]. However, one limitation of Quantile G-Computation is that some exposures with small effects can be misclassified with regard to their effect direction [22]. For example, the Quantile G-Computation identified that mushroom and fungi have a positive weight on all-cause mortality among women, which does not agree with the existing evidence on the health benefits of mushroom and fungi [41]. However, the results from survival analysis did not find a significant positive association between mushroom and fungi intake and all-cause mortality among women (HR: 0.87, 95% CI = 0.67, 1.13). The Quantile G-Computation can be a supplementary approach to strengthen research findings from a conventional analytical approach (e.g., Cox proportional hazards models), which might have less predictive power when handling multicomponent exposures.
4.4. Strengths and Limitations
The strengths of our study include the long-term (>10 years) prospective cohort design with mortality outcomes being followed-up. With the use of sophisticated statistical methods, we have assessed the contribution of each food group on mortality risk, and the joint effect of food consumption. However, we should interpret the observations by taking note of several limitations. First, participants in the OS Study were well-educated compared with the general Hong Kong population, which might limit the generalizability of the results. Second, dietary data was self-reported, which might introduce recall bias especially for older adults. In addition, the changes in diet and lifestyle factors during follow-up, and the incidence of comorbidities were not determined. Lastly, the influence of residual confounding cannot be ruled out.
5. Conclusions
This study has quantified the relative importance of individual food groups in a mixture of exposures with the risk of all-cause and cause-specific mortalities. Whole grains, legumes, fruits, mushroom and fungi, and soy and soy products were the main contributors to the reduction of mortality risk among Chinese community-dwelling older adults. Moreover, the sex-specific association of sweets and desserts with cancer mortality may be worth further investigation. More prospective cohorts should adopt sophisticated statistical methods that can investigate the single and joint effects of dietary components on long-term health.
Supplementary Materials
The following supporting information can be downloaded at: https://www.mdpi.com/article/10.3390/nu14193915/s1, Table S1: Study checklist using STROBE-nut; Table S2: Dietary consumption of Participants in the Mr. OS and Ms. OS Study by the quartiles (Q) of intake; Table S3: Median dietary consumption of each food group for overall/men/women; Table S4: Coefficients of Elastic Net Regression models on the associations between food groups and cause-specific mortality among Participants in Mr. OS and Ms. OS Study; Table S5: The number of all-cause mortality by quartile (Q) of food groups selected by Elastic net regression among participants in the Mr. OS and Ms. OS Study; Table S6: The number of cardiovascular mortality by the quartile (Q) of food groups selected by Elastic net regression among participants in the Mr. OS and Ms. OS Study; Table S7: The number of cancer mortality by the quartile (Q) of food groups selected by Elastic net regression among participants in the Mr. OS and Ms. OS Study; Figure S1: The chart of analytic study design; Figure S2: Elastic net analysis on the association of food groups and all-cause mortality; Figure S3: Elastic net analysis on the association of food groups and CVD mortality; Figure S4: Elastic net analysis on the association of food groups and cancer mortality.
Author Contributions
Conception and design: J.W. and K.L.; Acquisition of data: J.Y., A.Y., S.Y., J.W. and K.L.; Analysis and interpretation of data: J.Y. and K.L.; Writing of the first draft: J.Y. and K.L.; Critical revision of the draft: J.Y., A.Y., S.Y., J.W. and K.L.; Supervision and coordination of the project: J.W. and K.L. The corresponding authors attest that all listed authors meet the authorship criteria and that no others meeting the criteria have been omitted. All authors have read and agreed to the published version of the manuscript.
Funding
This research was funded by projects of RISA (Grant number: CD69). We confirm the independence of researchers from funders. The contents of this manuscript are the responsibility of the authors and do not reflect the views of the funding bodies.
Institutional Review Board Statement
The Mr. OS and Ms. OS study was conducted according to the guidelines laid down in the Declaration of Helsinki, and all procedures involving human subjects were approved by the Clinical Research Ethics Committee of the Chinese University of Hong Kong (CRE: 2003.102).
Informed Consent Statement
Informed consent was obtained from all subjects involved in the study.
Data Availability Statement
All relevant data are within the manuscript.
Acknowledgments
We thank all Mr. OS and Ms. OS Study participants for their contribution in the study. Jingli Yang would like to thank the China Scholarship Council (CSC) for their support.
Conflicts of Interest
The authors declare no conflict of interest.
References
- Neuhouser, M.L. The importance of healthy dietary patterns in chronic disease prevention. Nutr. Res. 2019, 70, 3–6. [Google Scholar] [CrossRef] [PubMed]
- Landberg, R.; Hanhineva, K. Biomarkers of a healthy nordic diet-from dietary exposure biomarkers to microbiota signatures in the metabolome. Nutrients 2019, 12, 27. [Google Scholar] [CrossRef] [PubMed]
- Waxman, A.; World Health, A. WHO global strategy on diet, physical activity and health. Food Nutr. Bull. 2004, 25, 292–302. [Google Scholar] [CrossRef] [PubMed]
- Jenkins, D.J.A.; Boucher, B.A.; Ashbury, F.D.; Sloan, M.; Brown, P.; El-Sohemy, A.; Hanley, A.J.; Willett, W.; Paquette, M.; de Souza, R.J.; et al. Effect of current dietary recommendations on weight loss and cardiovascular risk factors. J. Am. Coll. Cardiol. 2017, 69, 1103–1112. [Google Scholar] [CrossRef] [PubMed]
- Satija, A.; Malik, V.; Rimm, E.B.; Sacks, F.; Willett, W.; Hu, F.B. Changes in intake of plant-based diets and weight change: Results from 3 prospective cohort studies. Am. J. Clin. Nutr. 2019, 110, 574–582. [Google Scholar] [CrossRef]
- Chen, Z.; Schoufour, J.D.; Rivadeneira, F.; Lamballais, S.; Ikram, M.A.; Franco, O.H.; Voortman, T. Plant-based diet and adiposity over time in a middle-aged and elderly population: The Rotterdam Study. Epidemiology 2019, 30, 303–310. [Google Scholar] [CrossRef]
- Hu, F.B. Dietary pattern analysis: A new direction in nutritional epidemiology. Curr. Opin. Lipidol. 2002, 13, 3–9. [Google Scholar] [CrossRef]
- Wong, M.M.H.; Louie, J.C.Y. A priori dietary patterns and cardiovascular disease incidence in adult population-based studies: A review of recent evidence. Crit. Rev. Food Sci. Nutr. 2021, 62, 6153–6168. [Google Scholar] [CrossRef]
- Krishnan, S.; Ramyaa, R. When two heads are better than one: Nutritional epidemiology meets machine learning. Am. J. Clin. Nutr. 2020, 111, 1124–1126. [Google Scholar] [CrossRef]
- Zhao, Y.; Naumova, E.N.; Bobb, J.F.; Claus Henn, B.; Singh, G.M. Joint Associations of Multiple Dietary Components With Cardiovascular Disease Risk: A Machine-Learning Approach. Am. J. Epidemiol. 2021, 190, 1353–1365. [Google Scholar] [CrossRef]
- Bodnar, L.M.; Cartus, A.R.; Kirkpatrick, S.I.; Himes, K.P.; Kennedy, E.H.; Simhan, H.N.; Grobman, W.A.; Duffy, J.Y.; Silver, R.M.; Parry, S.; et al. Machine learning as a strategy to account for dietary synergy: An illustration based on dietary intake and adverse pregnancy outcomes. Am. J. Clin. Nutr. 2020, 111, 1235–1243. [Google Scholar] [CrossRef] [PubMed]
- Lo, K.; Glenn, A.J.; Yeung, S.; Kendall, C.W.C.; Sievenpiper, J.L.; Jenkins, D.J.A.; Woo, J. Prospective association of the portfolio diet with all-cause and cause-specific mortality risk in the Mr. OS and Ms. OS Study. Nutrients 2021, 13, 4360. [Google Scholar] [CrossRef] [PubMed]
- Chan, R.; Leung, J.; Tang, N.; Woo, J. Dietary patterns and telomere length in community-dwelling Chinese older men and women: A cross-sectional analysis. Eur. J. Nutr. 2020, 59, 3303–3311. [Google Scholar] [CrossRef]
- Liu, Z.M.; Tse, L.A.; Chan, D.; Wong, C.; Wong, S.Y.S. Dietary sugar intake was associated with increased body fatness but decreased cardiovascular mortality in Chinese elderly: An 11-year prospective study of Mr. and Ms. OS of Hong Kong. Int. J. Obes. 2018, 42, 808–816. [Google Scholar] [CrossRef] [PubMed]
- Woo, J.; Leung, S.; Ho, S.; Lam, T.; Janus, E. A food frequency questionnaire for use in the Chinese population in Hong Kong: Description and examination of validity. Nutr. Res. 1997, 17, 1633–1641. [Google Scholar] [CrossRef]
- Washburn, R.A.; Smith, K.W.; Jette, A.M.; Janney, C.A. The Physical Activity Scale for the Elderly (PASE): Development and evaluation. J. Clin. Epidemiol. 1993, 46, 153–162. [Google Scholar] [CrossRef]
- Stafoggia, M.; Breitner, S.; Hampel, R.; Basagana, X. Statistical approaches to address multi-pollutant mixtures and multiple exposures: The state of the science. Curr. Environ. Health Rep. 2017, 4, 481–490. [Google Scholar] [CrossRef] [PubMed]
- Yang, J.; Chan, K.; Choi, C.; Yang, A.; Lo, K. Identifying effects of urinary metals on type 2 diabetes in U.S. adults: Cross-sectional analysis of National Health and Nutrition Examination Survey 2011–2016. Nutrients 2022, 14, 1552. [Google Scholar] [CrossRef]
- Zhao, H.; Tang, J.; Zhu, Q.; He, H.; Li, S.; Jin, L.; Zhang, X.; Zhu, L.; Guo, J.; Zhang, D.; et al. Associations of prenatal heavy metals exposure with placental characteristics and birth weight in Hangzhou Birth Cohort: Multi-pollutant models based on elastic net regression. Sci. Total Environ. 2020, 742, 140613. [Google Scholar] [CrossRef]
- Yang, J.; Yang, A.; Cheng, N.; Huang, W.; Huang, P.; Liu, N.; Bai, Y. Sex-specific associations of blood and urinary manganese levels with glucose levels, insulin resistance and kidney function in US adults: National health and nutrition examination survey 2011–2016. Chemosphere 2020, 258, 126940. [Google Scholar] [CrossRef]
- Duc, H.N.; Oh, H.; Kim, M.S. The effect of mixture of heavy metals on obesity in individuals ≥50 years of age. Biol. Trace Elem. Res. 2021, 200, 3554–3571. [Google Scholar] [CrossRef] [PubMed]
- Keil, A.P.; Buckley, J.P.; O’Brien, K.M.; Ferguson, K.K.; Zhao, S.; White, A.J. A quantile-based g-computation approach to addressing the effects of exposure mixtures. Environ. Health Perspect 2020, 128, 47004. [Google Scholar] [CrossRef] [PubMed]
- Kim, Y.; Je, Y.; Giovannucci, E.L. Association between dietary fat intake and mortality from all-causes, cardiovascular disease, and cancer: A systematic review and meta-analysis of prospective cohort studies. Clin. Nutr. 2021, 40, 1060–1070. [Google Scholar] [CrossRef] [PubMed]
- Jayedi, A.; Soltani, S.; Jenkins, D.; Sievenpiper, J.; Shab-Bidar, S. Dietary glycemic index, glycemic load, and chronic disease: An umbrella review of meta-analyses of prospective cohort studies. Crit. Rev. Food Sci. Nutr. 2022, 62, 2460–2469. [Google Scholar] [CrossRef] [PubMed]
- Satija, A.; Hu, F.B. Plant-based diets and cardiovascular health. Trends Cardiovasc. Med. 2018, 28, 437–441. [Google Scholar] [CrossRef] [PubMed]
- Vanegas, S.M.; Meydani, M.; Barnett, J.B.; Goldin, B.; Kane, A.; Rasmussen, H.; Brown, C.; Vangay, P.; Knights, D.; Jonnalagadda, S.; et al. Substituting whole grains for refined grains in a 6-wk randomized trial has a modest effect on gut microbiota and immune and inflammatory markers of healthy adults. Am. J. Clin. Nutr. 2017, 105, 635–650. [Google Scholar] [CrossRef]
- Wong, J.M.; de Souza, R.; Kendall, C.W.; Emam, A.; Jenkins, D.J. Colonic health: Fermentation and short chain fatty acids. J. Clin. Gastroenterol. 2006, 40, 235–243. [Google Scholar] [CrossRef]
- Yamamura, R.; Nakamura, K.; Kitada, N.; Aizawa, T.; Shimizu, Y.; Nakamura, K.; Ayabe, T.; Kimura, T.; Tamakoshi, A. Associations of gut microbiota, dietary intake, and serum short-chain fatty acids with fecal short-chain fatty acids. Biosci. Microbiota. Food Health 2020, 39, 11–17. [Google Scholar] [CrossRef]
- Dalile, B.; Van Oudenhove, L.; Vervliet, B.; Verbeke, K. The role of short-chain fatty acids in microbiota-gut-brain communication. Nat. Rev. Gastroenterol. Hepatol. 2019, 16, 461–478. [Google Scholar] [CrossRef]
- Ramne, S.; Alves Dias, J.; Gonzalez-Padilla, E.; Olsson, K.; Lindahl, B.; Engstrom, G.; Ericson, U.; Johansson, I.; Sonestedt, E. Association between added sugar intake and mortality is nonlinear and dependent on sugar source in 2 Swedish population-based prospective cohorts. Am. J. Clin. Nutr. 2019, 109, 411–423. [Google Scholar] [CrossRef]
- Ax, E.; Warensjo Lemming, E.; Becker, W.; Andersson, A.; Lindroos, A.K.; Cederholm, T.; Sjogren, P.; Fung, T.T. Dietary patterns in Swedish adults; results from a national dietary survey. Br. J. Nutr. 2016, 115, 95–104. [Google Scholar] [CrossRef]
- Holt-Lunstad, J.; Smith, T.B.; Layton, J.B. Social relationships and mortality risk: A meta-analytic review. PLoS Med. 2010, 7, e1000316. [Google Scholar] [CrossRef] [PubMed]
- Liu, Z.M.; Tse, S.L.A.; Chen, B.; Chan, D.; Wong, C.; Woo, J.; Wong, S.Y. Dietary sugar intake does not pose any risk of bone loss and non-traumatic fracture and is associated with a decrease in all-cause mortality among Chinese elderly: Finding from an 11-year longitudinal study of Mr. and Ms. OS Hong Kong. Bone 2018, 116, 154–161. [Google Scholar] [CrossRef] [PubMed]
- Marventano, S.; Izquierdo Pulido, M.; Sanchez-Gonzalez, C.; Godos, J.; Speciani, A.; Galvano, F.; Grosso, G. Legume consumption and CVD risk: A systematic review and meta-analysis. Public Health Nutr. 2017, 20, 245–254. [Google Scholar] [CrossRef] [PubMed]
- Cheng, H.M.; Koutsidis, G.; Lodge, J.K.; Ashor, A.; Siervo, M.; Lara, J. Tomato and lycopene supplementation and cardiovascular risk factors: A systematic review and meta-analysis. Atherosclerosis 2017, 257, 100–108. [Google Scholar] [CrossRef]
- Cheng, H.M.; Koutsidis, G.; Lodge, J.K.; Ashor, A.W.; Siervo, M.; Lara, J. Lycopene and tomato and risk of cardiovascular diseases: A systematic review and meta-analysis of epidemiological evidence. Crit. Rev. Food Sci. Nutr. 2019, 59, 141–158. [Google Scholar] [CrossRef]
- Li, Z.; Wang, D.; Ruiz-Narvaez, E.A.; Peterson, K.E.; Campos, H.; Baylin, A. Starchy vegetables and metabolic syndrome in Costa Rica. Nutrients 2021, 13, 1639. [Google Scholar] [CrossRef]
- Shirakami, Y.; Shimizu, M.; Moriwaki, H. Cancer chemoprevention with green tea catechins: From bench to bed. Curr. Drug Targets 2012, 13, 1842–1857. [Google Scholar] [CrossRef]
- Zhao, L.G.; Li, Z.Y.; Feng, G.S.; Ji, X.W.; Tan, Y.T.; Li, H.L.; Gunter, M.J.; Xiang, Y.B. Tea drinking and risk of cancer incidence: A meta-analysis of prospective cohort studies and evidence evaluation. Adv. Nutr. 2021, 12, 402–412. [Google Scholar] [CrossRef]
- Carrico, C.; Gennings, C.; Wheeler, D.C.; Factor-Litvak, P. Characterization of weighted quantile wum regression for highly correlated data in a risk analysis setting. J. Agric. Biol. Environ. Stat. 2015, 20, 100–120. [Google Scholar] [CrossRef]
- Ba, D.M.; Gao, X.; Al-Shaar, L.; Muscat, J.; Chinchilli, V.M.; Ssentongo, P.; Zhang, X.; Liu, G.; Beelman, R.B.; Richie, J.P., Jr. Prospective study of dietary mushroom intake and risk of mortality: Results from continuous National Health and Nutrition Examination Survey (NHANES) 2003–2014 and a meta-analysis. Nutr. J. 2021, 20, 80. [Google Scholar] [CrossRef] [PubMed]
Publisher’s Note: MDPI stays neutral with regard to jurisdictional claims in published maps and institutional affiliations. |
© 2022 by the authors. Licensee MDPI, Basel, Switzerland. This article is an open access article distributed under the terms and conditions of the Creative Commons Attribution (CC BY) license (https://creativecommons.org/licenses/by/4.0/).