
The Contribution of Nutrients of Concern to the Diets of 18-to-30-Year-Old Australians from Food Prepared Outside Home Differs by Food Outlet Types: The MYMeals Cross-Sectional Study


 , , , , ,
  and
and 
Abstract
:
1. Introduction
2. Materials and Methods
2.1. Study Design
2.2. Assessment of Dietary Intake
2.3. Data and Statistical Analysis
3. Results
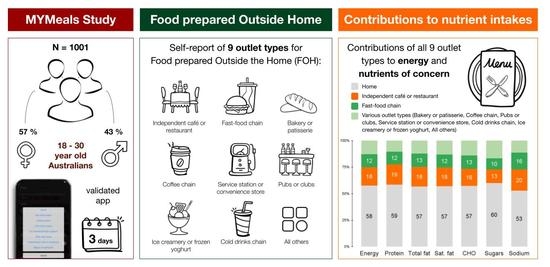
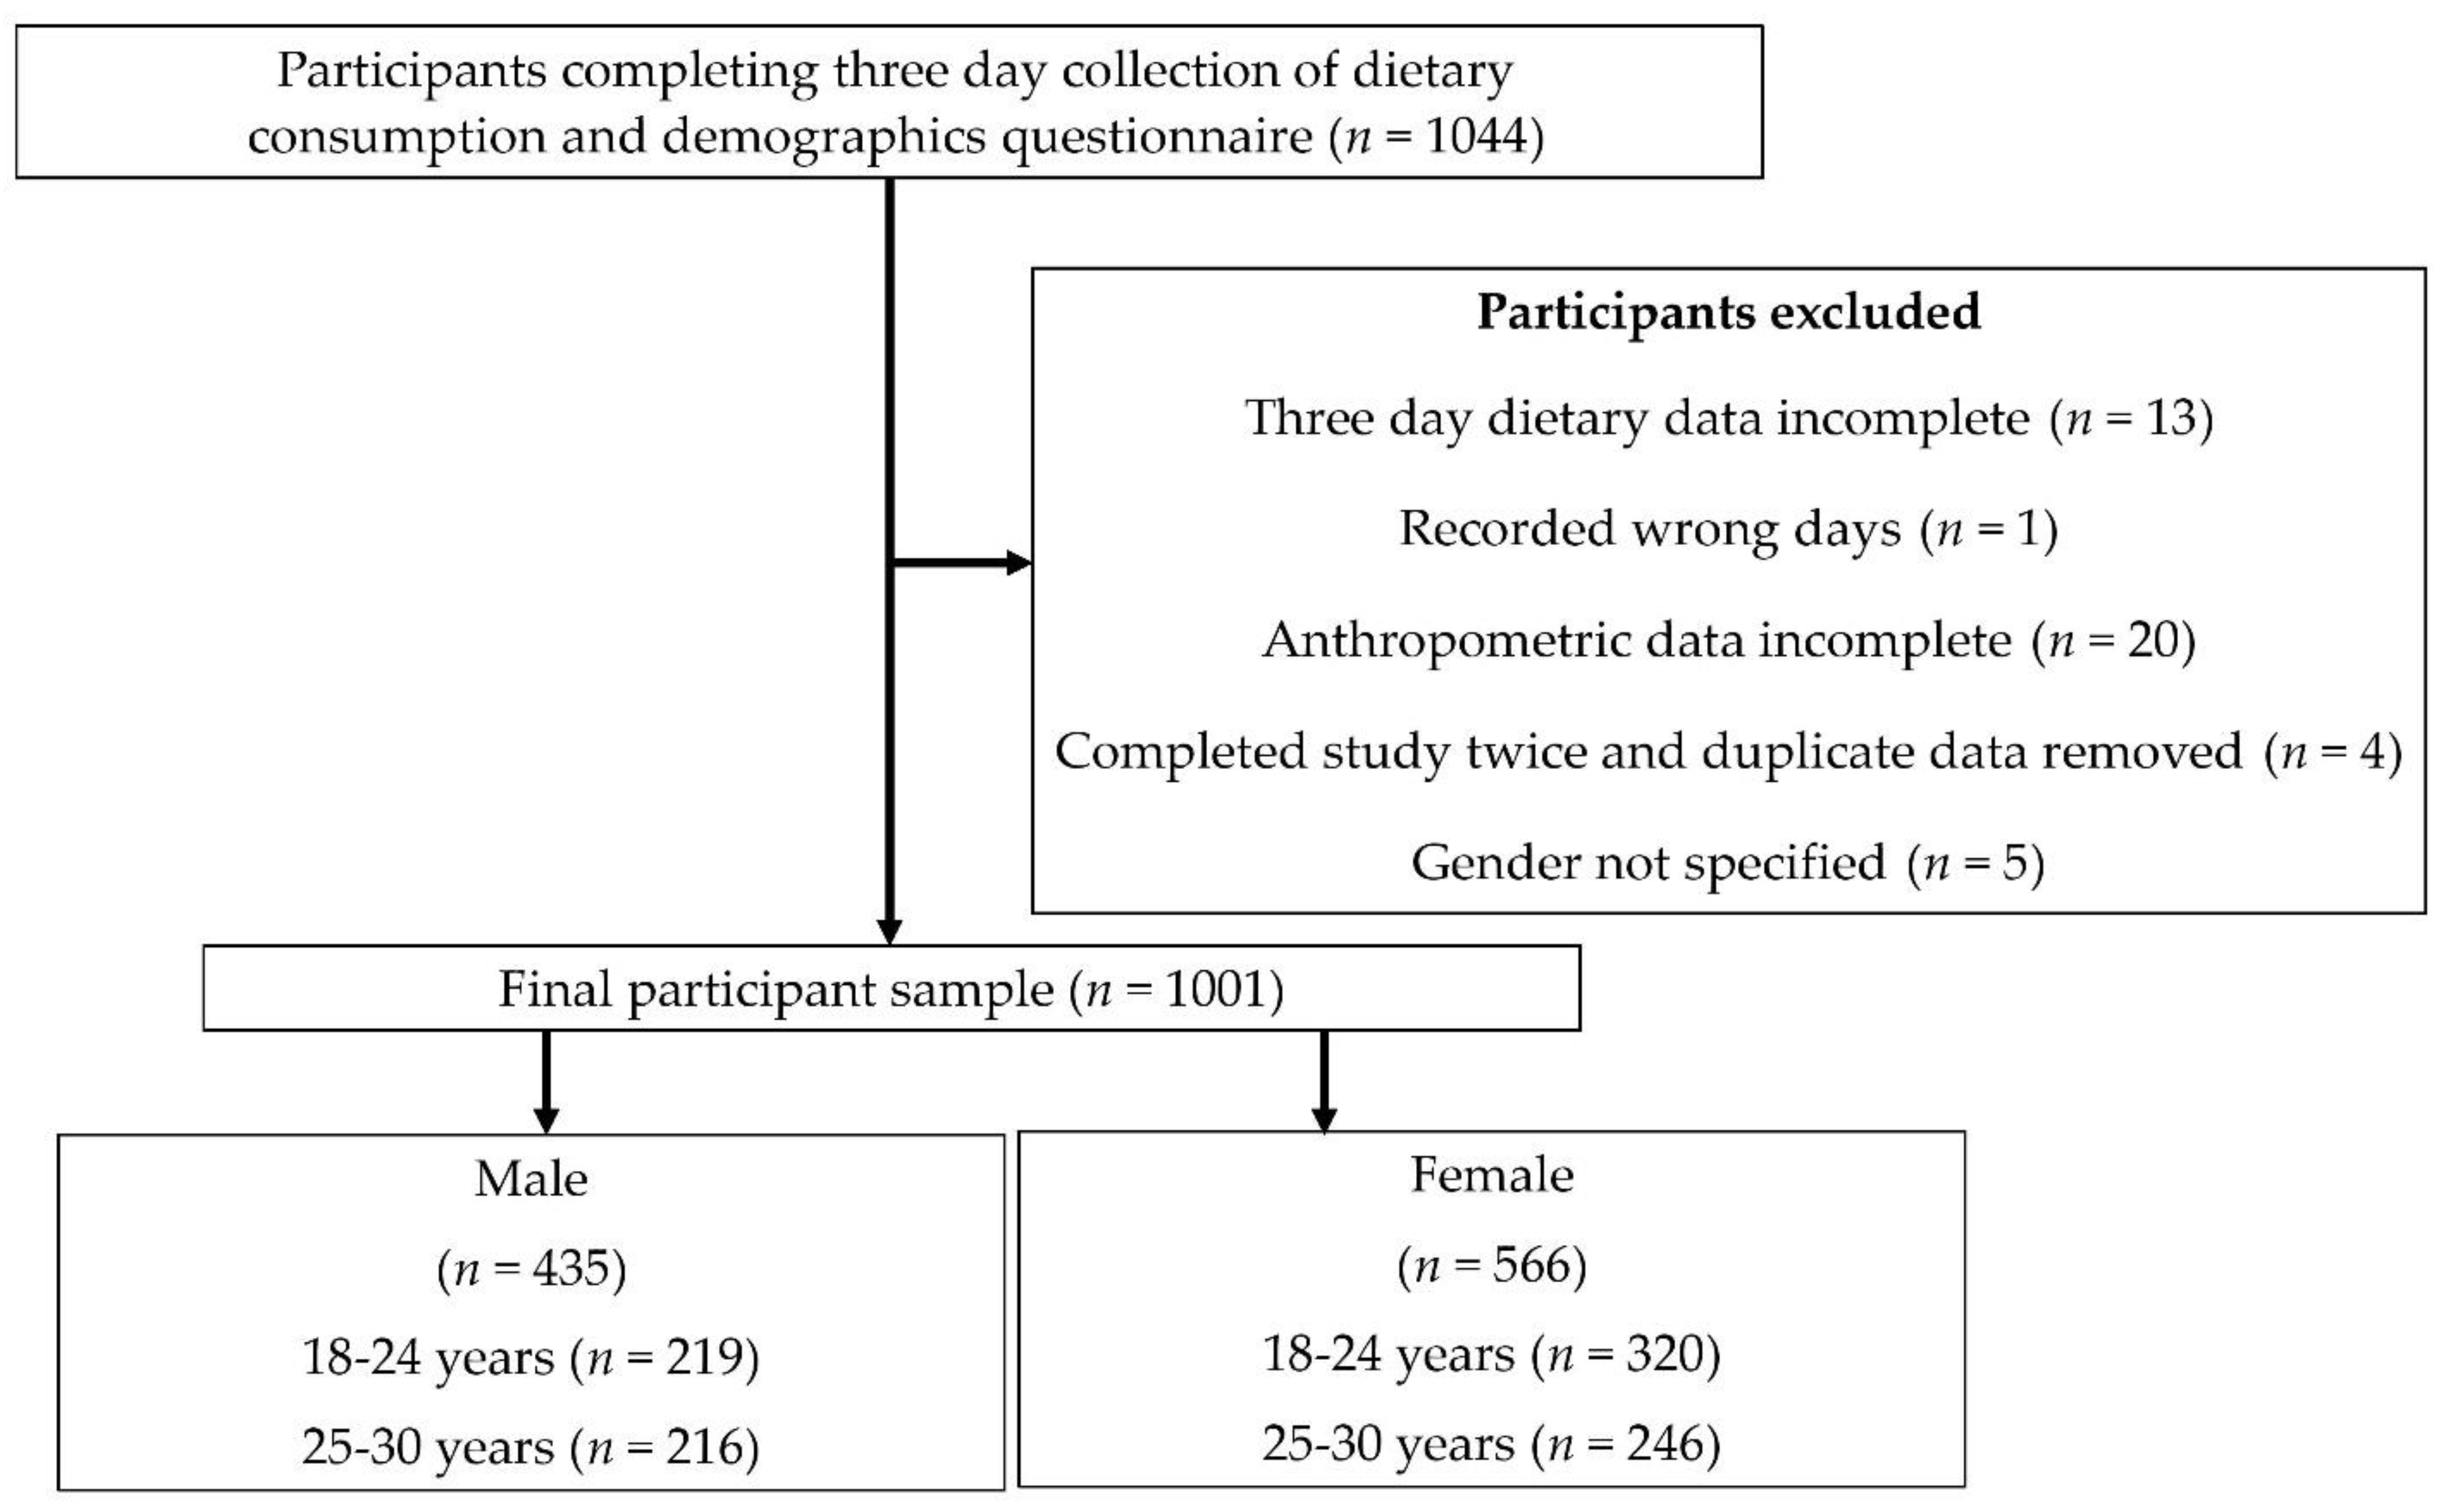
3.1. Participants
3.2. Proportion of Nutrients Consumed from Food Prepared Outside the Home Contributed by the Different Outlets
4. Discussion
5. Conclusions
Author Contributions
Funding
Institutional Review Board Statement
Informed Consent Statement
Data Availability Statement
Acknowledgments
Conflicts of Interest
References
- Australian Bureau of Statistics. National Health Survey: First Results. Available online: https://www.abs.gov.au/statistics/health/health-conditions-and-risks/national-health-survey-first-results/latest-release (accessed on 12 August 2022).
- World Health Organization. Obesity and Overweight. Available online: https://www.who.int/news-room/fact-sheets/detail/obesity-and-overweight (accessed on 12 July 2022).
- Williams, E.P.; Mesidor, M.; Winters, K.; Dubbert, P.M.; Wyatt, S.B. Overweight and Obesity: Prevalence, Consequences, and Causes of a Growing Public Health Problem. Curr. Obes. Rep. 2015, 4, 363–370. [Google Scholar] [CrossRef] [PubMed]
- Wellard-Cole, L.; Davies, A.; Allman-Farinelli, M. Contribution of foods prepared away from home to intakes of energy and nutrients of public health concern in adults: A systematic review. Crit. Rev. Food Sci. Nutr. 2022, 62, 5511–5522. [Google Scholar] [CrossRef] [PubMed]
- Wellard-Cole, L.; Davies, A.; Chen, J.; Jung, J.; Bente, K.B.; Kay, J.; Watson, W.L.; Hughes, C.; Rangan, A.; Yacef, K.; et al. The Contribution of Foods Prepared Outside the Home to the Diets of 18- to 30-Year-Old Australians: The MYMeals Study. Nutrients 2021, 13, 1761. [Google Scholar] [CrossRef] [PubMed]
- NSW Government Food Authority. kJ Labelling Nutrition Information. Available online: https://www.foodauthority.nsw.gov.au/about-us/legislation/proposals-and-policy/kJ-labelling-nutrition-information (accessed on 12 August 2022).
- Wellard-Cole, L.; Jung, J.; Kay, J.; Rangan, A.; Chapman, K.; Watson, W.L.; Hughes, C.; Ni Mhurchu, C.; Bauman, A.; Gemming, L.; et al. Examining the Frequency and Contribution of Foods Eaten Away From Home in the Diets of 18- to 30-Year-Old Australians Using Smartphone Dietary Assessment (MYMeals): Protocol for a Cross-Sectional Study. JMIR Res. Protoc. 2018, 7, e24. [Google Scholar] [CrossRef] [PubMed]
- Wellard-Cole, L.; Potter, M.; Jung, J.J.; Chen, J.; Kay, J.; Allman-Farinelli, M. A Tool to Measure Young Adults’ Food Intake: Design and Development of an Australian Database of Foods for the Eat and Track Smartphone App. JMIR Mhealth Uhealth 2018, 6, e12136. [Google Scholar] [CrossRef]
- Jung, J.; Wellard-Cole, L.; Cai, C.; Koprinska, I.; Yacef, K.; Allman-Farinelli, M.; Kay, J. Foundations for Systematic Evaluation and Benchmarking of a Mobile Food Logger in a Large-scale Nutrition Study. Proc. ACM Interact. Mob. Wearable Ubiquitous Technol. 2020, 4, 1–25. [Google Scholar] [CrossRef]
- Wellard-Cole, L.; Chen, J.; Davies, A.; Wong, A.; Huynh, S.; Rangan, A.; Allman-Farinelli, M. Relative Validity of the Eat and Track (EaT) Smartphone App for Collection of Dietary Intake Data in 18-to-30-Year Olds. Nutrients 2019, 11, 621. [Google Scholar] [CrossRef]
- Food Standards Australia New Zealand. AUSNUT 2011-13. Available online: https://www.foodstandards.gov.au/science/monitoringnutrients/ausnut/foodnutrient/Pages/default.aspx (accessed on 18 July 2022).
- Food Standards Australia New Zealand. Food Nutrient Database. Available online: https://www.foodstandards.gov.au/science/monitoringnutrients/ausnut/ausnutdatafiles/Pages/foodnutrient.aspx (accessed on 18 July 2022).
- Food Standards Australia New Zealand. Development of Additional Nutrient Profiles for Foods and Beverages Consumed in the NATSINPAS. Available online: https://www.foodstandards.gov.au/science/monitoringnutrients/ausnut/foodnutrient/Pages/devnutrientsNATSINPAS.aspx (accessed on 18 July 2022).
- Dunford, E.; Webster, J.; Barzi, F.; Neal, B. Nutrient content of products served by leading Australian fast food chains. Appetite 2010, 55, 484–489. [Google Scholar] [CrossRef]
- Australian Bureau of Statistics. 033.0.55.001—Census of Population and Housing: Socio-Economic Indexes for Areas (SEIFA), Australia. Available online: https://www.abs.gov.au/ausstats/abs@.nsf/mf/2033.0.55.001 (accessed on 18 July 2022).
- NSW Government Food Authority. Evaluation of Kilojoule Menu Labelling. Available online: https://www.foodauthority.nsw.gov.au/sites/default/files/_Documents/scienceandtechnical/fastchoices_evaluation_report.pdf (accessed on 12 July 2022).
- Jaques, D.A.; Wuerzner, G.; Ponte, B. Sodium Intake as a Cardiovascular Risk Factor: A Narrative Review. Nutrients 2021, 13, 3177. [Google Scholar] [CrossRef]
- Santos, J.A.; Webster, J.; Land, M.A.; Flood, V.; Chalmers, J.; Woodward, M.; Neal, B.; Petersen, K.S. Dietary salt intake in the Australian population. Public Health Nutr. 2017, 20, 1887–1894. [Google Scholar] [CrossRef] [Green Version]
- World Health Organization. Salt Intake. Available online: https://www.who.int/data/gho/indicator-metadata-registry/imr-details/3082 (accessed on 18 July 2022).
- Liu, J.; Rehm, C.D.; Micha, R.; Mozaffarian, D. Quality of Meals Consumed by US Adults at Full-Service and Fast-Food Restaurants, 2003–2016: Persistent Low Quality and Widening Disparities. J. Nutr. 2020, 150, 873–883. [Google Scholar] [CrossRef] [PubMed]
- Kris-Etherton, P.M.; Petersen, K.; Van Horn, L. Convincing evidence supports reducing saturated fat to decrease cardiovascular disease risk. BMJ Nutr. Prev. Health 2018, 1, 23–26. [Google Scholar] [CrossRef] [PubMed]
- National Health and Medical Research Council. Recommendations to Reduce Chronic Disease Risk. Available online: https://www.nrv.gov.au/chronic-disease (accessed on 19 July 2022).
- McNaughton, S.A.; Leech, R.M.; Pendergast, F.J.; Worsley, A. Sugar-Sweetened Beverage Consumption in Young Adults: Understanding Eating Occasion Contextual Factors. FASEB J. 2018, 31, 136.5. [Google Scholar] [CrossRef]
- Allen, W.M.K.; Allen, K.J. Should Australia tax sugar-sweetened beverages? J. Paediatr. Child Health 2020, 56, 8–15. [Google Scholar] [CrossRef] [PubMed]
- Australian Bureau of Statistics. National Health Survey: First Results, 2017–2018, ‘Table 12: Consumption of Fruit, Vegetables, 422 and Sugar Sweetened and Diet Drinks- Australia’, Data Cube: Excel Spreadsheet, Cat. No. 4364.0.55.001. Available online: https://iepcp.org.au/wp-content/uploads/2019/01/4364.0.55.001-national-health-survey-first-results-2017-18.pdf (accessed on 1 August 2022).
- Duncan, A.; Rangan, A.; Ho, P.Y.; Chan, V.; Davies, A.; Wellard-Cole, L.; Allman-Farinelli, M. High Consumption of Discretionary Beverages in Young Australian Adults Aged 18–30 Years: A Cross-Sectional Study. Dietetics 2022, 1, 105–113. [Google Scholar] [CrossRef]
- Hoare, E.; Varsamis, P.; Owen, N.; Dunstan, D.W.; Jennings, G.L.; Kingwell, B.A. Sugar- and Intense-Sweetened Drinks in Australia: A Systematic Review on Cardiometabolic Risk. Nutrients 2017, 9, 1075. [Google Scholar] [CrossRef]
- Malik, V.S.; Popkin, B.M.; Bray, G.A.; Despres, J.P.; Hu, F.B. Sugar-sweetened beverages, obesity, type 2 diabetes mellitus, and cardiovascular disease risk. Circulation 2010, 121, 1356–1364. [Google Scholar] [CrossRef]
- Allman-Farinelli, M.; Partridge, S.R.; Roy, R. Weight-Related Dietary Behaviors in Young Adults. Curr. Obes. Rep. 2016, 5, 23–29. [Google Scholar] [CrossRef]
- Watson, W.L.; Piazza, S.; Wellard, L.; Hughes, C.; Chapman, K. Energy and nutrient composition of menu items at Australian coffee chains. Nutr. Diet. 2016, 73, 81–87. [Google Scholar] [CrossRef]
- Liang, S.; Gemming, L.; Wellard-Cole, L.; Rangan, A. Comparison between serving sizes of cakes and muffins sold in Australian supermarkets and coffee shop chains. Nutr. Diet. 2019, 76, 284–289. [Google Scholar] [CrossRef]
- Davies, A.; Chan, V.; Bauman, A.; Signal, L.; Hosking, C.; Gemming, L.; Allman-Farinelli, M. Using wearable cameras to monitor eating and drinking behaviours during transport journeys. Eur. J. Nutr. 2021, 60, 1875–1885. [Google Scholar] [CrossRef] [PubMed]
- Dunn, K.I.; Mohr, P.B.; Wilson, C.J.; Wittert, G.A. Beliefs about fast food in Australia: A qualitative analysis. Appetite 2008, 51, 331–334. [Google Scholar] [CrossRef] [PubMed]
- Vreman, R.A.; Goodell, A.J.; Rodriguez, L.A.; Porco, T.C.; Lustig, R.H.; Kahn, J.G. Health and economic benefits of reducing sugar intake in the USA, including effects via non-alcoholic fatty liver disease: A microsimulation model. BMJ Open 2017, 7, e013543. [Google Scholar] [CrossRef] [PubMed]
- Kim, E.J.; Ellison, B.; McFadden, B.; Prescott, M.P. Consumers’ decisions to access or avoid added sugars information on the updated Nutrition Facts label. PLoS ONE 2021, 16, e0249355. [Google Scholar] [CrossRef]
- Nour, M.; Sui, Z.; Grech, A.; Rangan, A.; McGeechan, K.; Allman-Farinelli, M. The fruit and vegetable intake of young Australian adults: A population perspective. Public Health Nutr. 2017, 20, 2499–2512. [Google Scholar] [CrossRef]
- Galea, L.M.; Beck, E.J.; Probst, Y.C.; Cashman, C.J. Whole grain intake of Australians estimated from a cross-sectional analysis of dietary intake data from the 2011–2013 Australian Health Survey. Public Health Nutr. 2017, 20, 2166–2172. [Google Scholar] [CrossRef]
- Vinyard, M.; Zimmer, M.; Herrick, K.A.; Story, M.; Juan, W.; Reedy, J. Healthy Eating Index-2015 Scores Vary by Types of Food Outlets in the United States. Nutrients 2021, 13, 2717. [Google Scholar] [CrossRef]
- Chan, V.; Wellard-Cole, L.; Davies, A.; Watson, W.; Hughes, C.; Chapman, K.; Signal, L.; Ni Mhurchu, C.; Wang, L.; D’Souza, D.; et al. The association of social and food preparation location context with the quality of meals and snacks consumed by young adults: Findings from the MYMeals wearable camera study. Eur. J. Nutr. 2022, 1–16. [Google Scholar] [CrossRef]
- National Health and Medical Research Council. Australian Dietary Guidelines. Available online: https://www.eatforhealth.gov.au/guidelines (accessed on 2 August 2022).
- Mills, S.; Brown, H.; Wrieden, W.; White, M.; Adams, J. Frequency of eating home cooked meals and potential benefits for diet and health: Cross-sectional analysis of a population-based cohort study. Int. J. Behav. Nutr. Phys. Act. 2017, 14, 109. [Google Scholar] [CrossRef]
- Nour, M.M.; Rouf, A.S.; Allman-Farinelli, M. Exploring young adult perspectives on the use of gamification and social media in a smartphone platform for improving vegetable intake. Appetite 2018, 120, 547–556. [Google Scholar] [CrossRef]
- Chung, L.M.Y.; Fong, S.S.M.; Law, Q.P.S. Younger Adults Are More Likely to Increase Fruit and Vegetable Consumption and Decrease Sugar Intake with the Application of Dietary Monitoring. Nutrients 2021, 13, 333. [Google Scholar] [CrossRef] [PubMed]
- Chapman, K.; Goldsbury, D.; Watson, W.; Havill, M.; Wellard, L.; Hughes, C.; Bauman, A.; Allman-Farinelli, M. Exploring perceptions and beliefs about the cost of fruit and vegetables and whether they are barriers to higher consumption. Appetite 2017, 113, 310–319. [Google Scholar] [CrossRef] [PubMed]
- Australian Bureau of Statistics. CPI Rose 1.8% in the June 2022 Quarter. Available online: https://www.abs.gov.au/media-centre/media-releases/cpi-rose-18-june-2022-quarter (accessed on 5 August 2022).
- Rangan, A.M.; O’Connor, S.; Giannelli, V.; Yap, M.L.; Tang, L.M.; Roy, R.; Louie, J.C.; Hebden, L.; Kay, J.; Allman-Farinelli, M. Electronic Dietary Intake Assessment (e-DIA): Comparison of a Mobile Phone Digital Entry App for Dietary Data Collection With 24-Hour Dietary Recalls. JMIR Mhealth Uhealth 2015, 3, e98. [Google Scholar] [CrossRef] [PubMed]
- Partridge, S.R.; Gibson, A.A.; Roy, R.; Malloy, J.A.; Raeside, R.; Jia, S.S.; Singleton, A.C.; Mandoh, M.; Todd, A.R.; Wang, T.; et al. Junk Food on Demand: A Cross-Sectional Analysis of the Nutritional Quality of Popular Online Food Delivery Outlets in Australia and New Zealand. Nutrients 2020, 12, 3107. [Google Scholar] [CrossRef]
- Statista. Online Food Delivery: Worldwide. Available online: https://www.statista.com/outlook/374/100/online-food-delivery/worldwide#market-age (accessed on 12 August 2022).
- Roy Morgan Research. Meal Delivery Services Double Usage in Only 18 Months. Available online: https://www.roymorgan.com/findings/8270-food-delivery-services-september-2019-202002030451 (accessed on 12 August 2022).
- Wang, C.; Korai, A.; Jia, S.S.; Allman-Farinelli, M.; Chan, V.; Roy, R.; Raeside, R.; Phongsavan, P.; Redfern, J.; Gibson, A.A.; et al. Hunger for Home Delivery: Cross-Sectional Analysis of the Nutritional Quality of Complete Menus on an Online Food Delivery Platform in Australia. Nutrients 2021, 13, 905. [Google Scholar] [CrossRef]


| Percentage % | |||||||
|---|---|---|---|---|---|---|---|
| Location | Energy | Protein | Total Fat | Saturated Fat | Carbohydrate | Total Sugars | Sodium |
| Inside home | 57.6 | 58.5 | 56.8 | 57.0 | 57.3 | 60.2 | 52.7 |
| Outside home | 42.5 | 41.5 | 43.2 | 43.1 | 42.6 | 40.0 | 47.3 |
| Independent café or restaurant | 17.5 | 19.2 | 18.4 | 17.8 | 16.0 | 12.8 | 20.0 |
| Fast-food chain | 12.0 | 11.9 | 12.5 | 12.0 | 12.7 | 10.4 | 15.8 |
| Bakery or patisserie | 3.4 | 2.5 | 2.9 | 3.3 | 3.8 | 2.8 | 3.4 |
| Coffee chain | 3.4 | 3.1 | 3.8 | 4.1 | 3.5 | 4.9 | 3.4 |
| Other | 2.9 | 2.4 | 2.8 | 2.8 | 3.1 | 3.6 | 2.5 |
| Pubs or clubs | 1.4 | 1.1 | 1.1 | 1.1 | 1.1 | 1.0 | 1.1 |
| Service station or convenience store | 1.0 | 0.7 | 1.0 | 1.2 | 1.1 | 1.8 | 0.8 |
| Cold-drinks chain | 0.7 | 0.5 | 0.4 | 0.5 | 1.0 | 2.0 | 0.2 |
| Ice creamery or frozen yoghurt outlets | 0.2 | 0.1 | 0.3 | 0.4, | 0.3 | 0.7 | 0.1 |
| p-value a | <0.001 | <0.001 | <0.001 | <0.001 | <0.001 | <0.001 | <0.001 |
| Difference in Percentage % a | |||||||
|---|---|---|---|---|---|---|---|
| Location | Energy | Protein | Total Fat | Saturated Fat | Carbohydrate | Total Sugars | Sodium |
| Inside home | −2.7 | −2.1 | −3.1 | −2.6 | −2.5 | −0.9 | −3.8 |
| Outside home | 2.7 | 1.9 | 3.1 | 2.7 | 2.5 | 1.1 | 3.9 |
| Independent café or restaurant | −0.9 | −1.7 | −1.1 | −1.2 | −0.7 | −1.2 | −1.5 |
| Fast-food chain | 5.0 | 5.2 | 5.4 | 5.0 | 5.0 | 4.0 | 6.3 |
| Bakery or patisserie | 0.2 | −0.1 | 0.3 | 0.2 | 0.1 | 0.5 | 0.3 |
| Coffee chain | −0.9 | −1.0 | −0.8 | −0.7 | −0.9 | −1.2 | −0.8 |
| Other | −0.4 | −0.4 | −0.5 | −0.4 | −0.5 | −0.3 | −0.3 |
| Pubs or clubs | 0.3 | 0.3 | 0.2 | 0.2 | 0.2 | 0.1 | 0.2 |
| Service station or convenience store | −0.3 | −0.1 | −0.3 | −0.1 | −0.3 | 0.1 | −0.2 |
| Cold-drinks chain | −0.3 | −0.3 | −0.2 | −0.4 | −0.4 | −0.8 | −0.1 |
| Ice creamery or frozen yoghurt outlets | 0.0 | 0.0 | 0.1 | 0.1 | 0.0 | −0.1 | 0.0 |
Publisher’s Note: MDPI stays neutral with regard to jurisdictional claims in published maps and institutional affiliations. |
© 2022 by the authors. Licensee MDPI, Basel, Switzerland. This article is an open access article distributed under the terms and conditions of the Creative Commons Attribution (CC BY) license (https://creativecommons.org/licenses/by/4.0/).
Share and Cite
Nassif, E.; Davies, A.; Bente, K.B.; Wellard-Cole, L.; Jung, J.; Kay, J.; Hughes, C.; Koprinska, I.; Watson, W.L.; Yacef, K.; et al. The Contribution of Nutrients of Concern to the Diets of 18-to-30-Year-Old Australians from Food Prepared Outside Home Differs by Food Outlet Types: The MYMeals Cross-Sectional Study. Nutrients 2022, 14, 3751. https://doi.org/10.3390/nu14183751
Nassif E, Davies A, Bente KB, Wellard-Cole L, Jung J, Kay J, Hughes C, Koprinska I, Watson WL, Yacef K, et al. The Contribution of Nutrients of Concern to the Diets of 18-to-30-Year-Old Australians from Food Prepared Outside Home Differs by Food Outlet Types: The MYMeals Cross-Sectional Study. Nutrients. 2022; 14(18):3751. https://doi.org/10.3390/nu14183751
Chicago/Turabian StyleNassif, Emma, Alyse Davies, Kim B. Bente, Lyndal Wellard-Cole, Jisu Jung, Judy Kay, Clare Hughes, Irena Koprinska, Wendy L. Watson, Kalina Yacef, and et al. 2022. "The Contribution of Nutrients of Concern to the Diets of 18-to-30-Year-Old Australians from Food Prepared Outside Home Differs by Food Outlet Types: The MYMeals Cross-Sectional Study" Nutrients 14, no. 18: 3751. https://doi.org/10.3390/nu14183751
APA StyleNassif, E., Davies, A., Bente, K. B., Wellard-Cole, L., Jung, J., Kay, J., Hughes, C., Koprinska, I., Watson, W. L., Yacef, K., Chapman, K., Rangan, A., Bauman, A., Ni Mhurchu, C., & Allman-Farinelli, M. (2022). The Contribution of Nutrients of Concern to the Diets of 18-to-30-Year-Old Australians from Food Prepared Outside Home Differs by Food Outlet Types: The MYMeals Cross-Sectional Study. Nutrients, 14(18), 3751. https://doi.org/10.3390/nu14183751