
Estimation of the Effect of Salt-Intake Reduction on Cardiovascular Mortality Decline between 1950 and 2017 in Japan: A Retrospective Simulation Study


Abstract
:1. Introduction
2. Materials and Methods
2.1. Study Overview
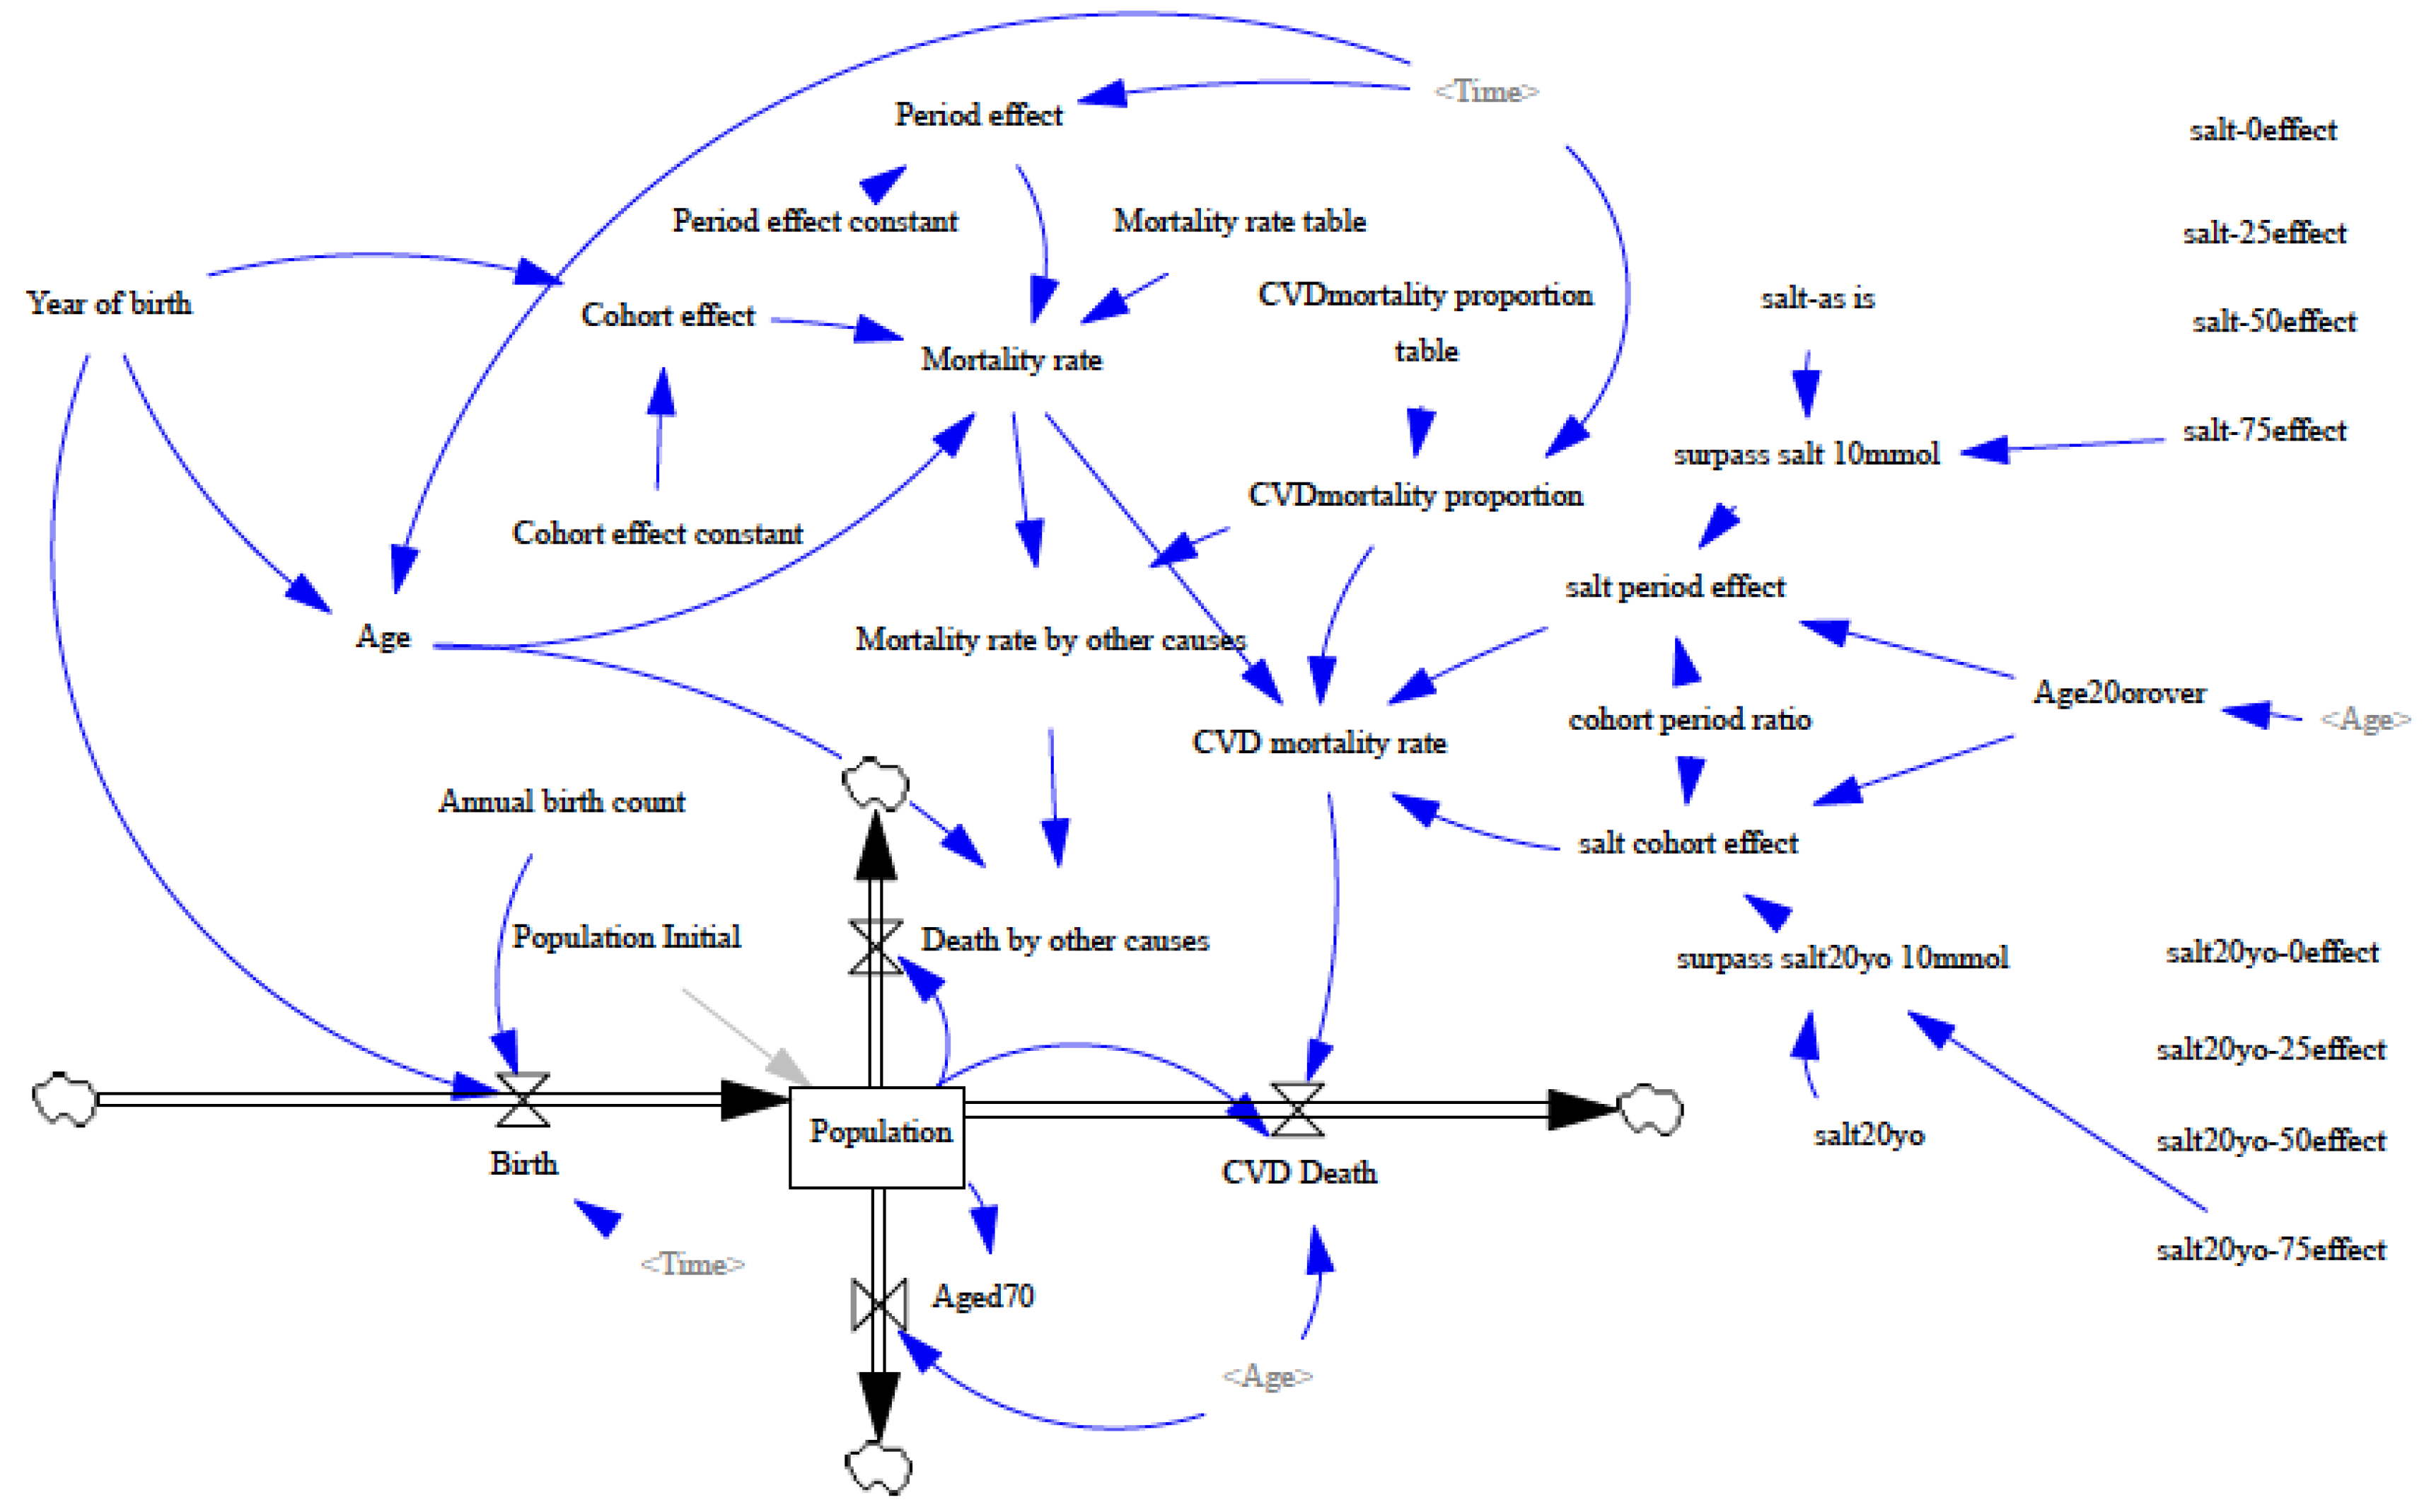
2.2. Model Structure
2.3. Input Parameters and Data
2.4. Model Optimization (Calibration) and Simulation Scenarios
3. Results
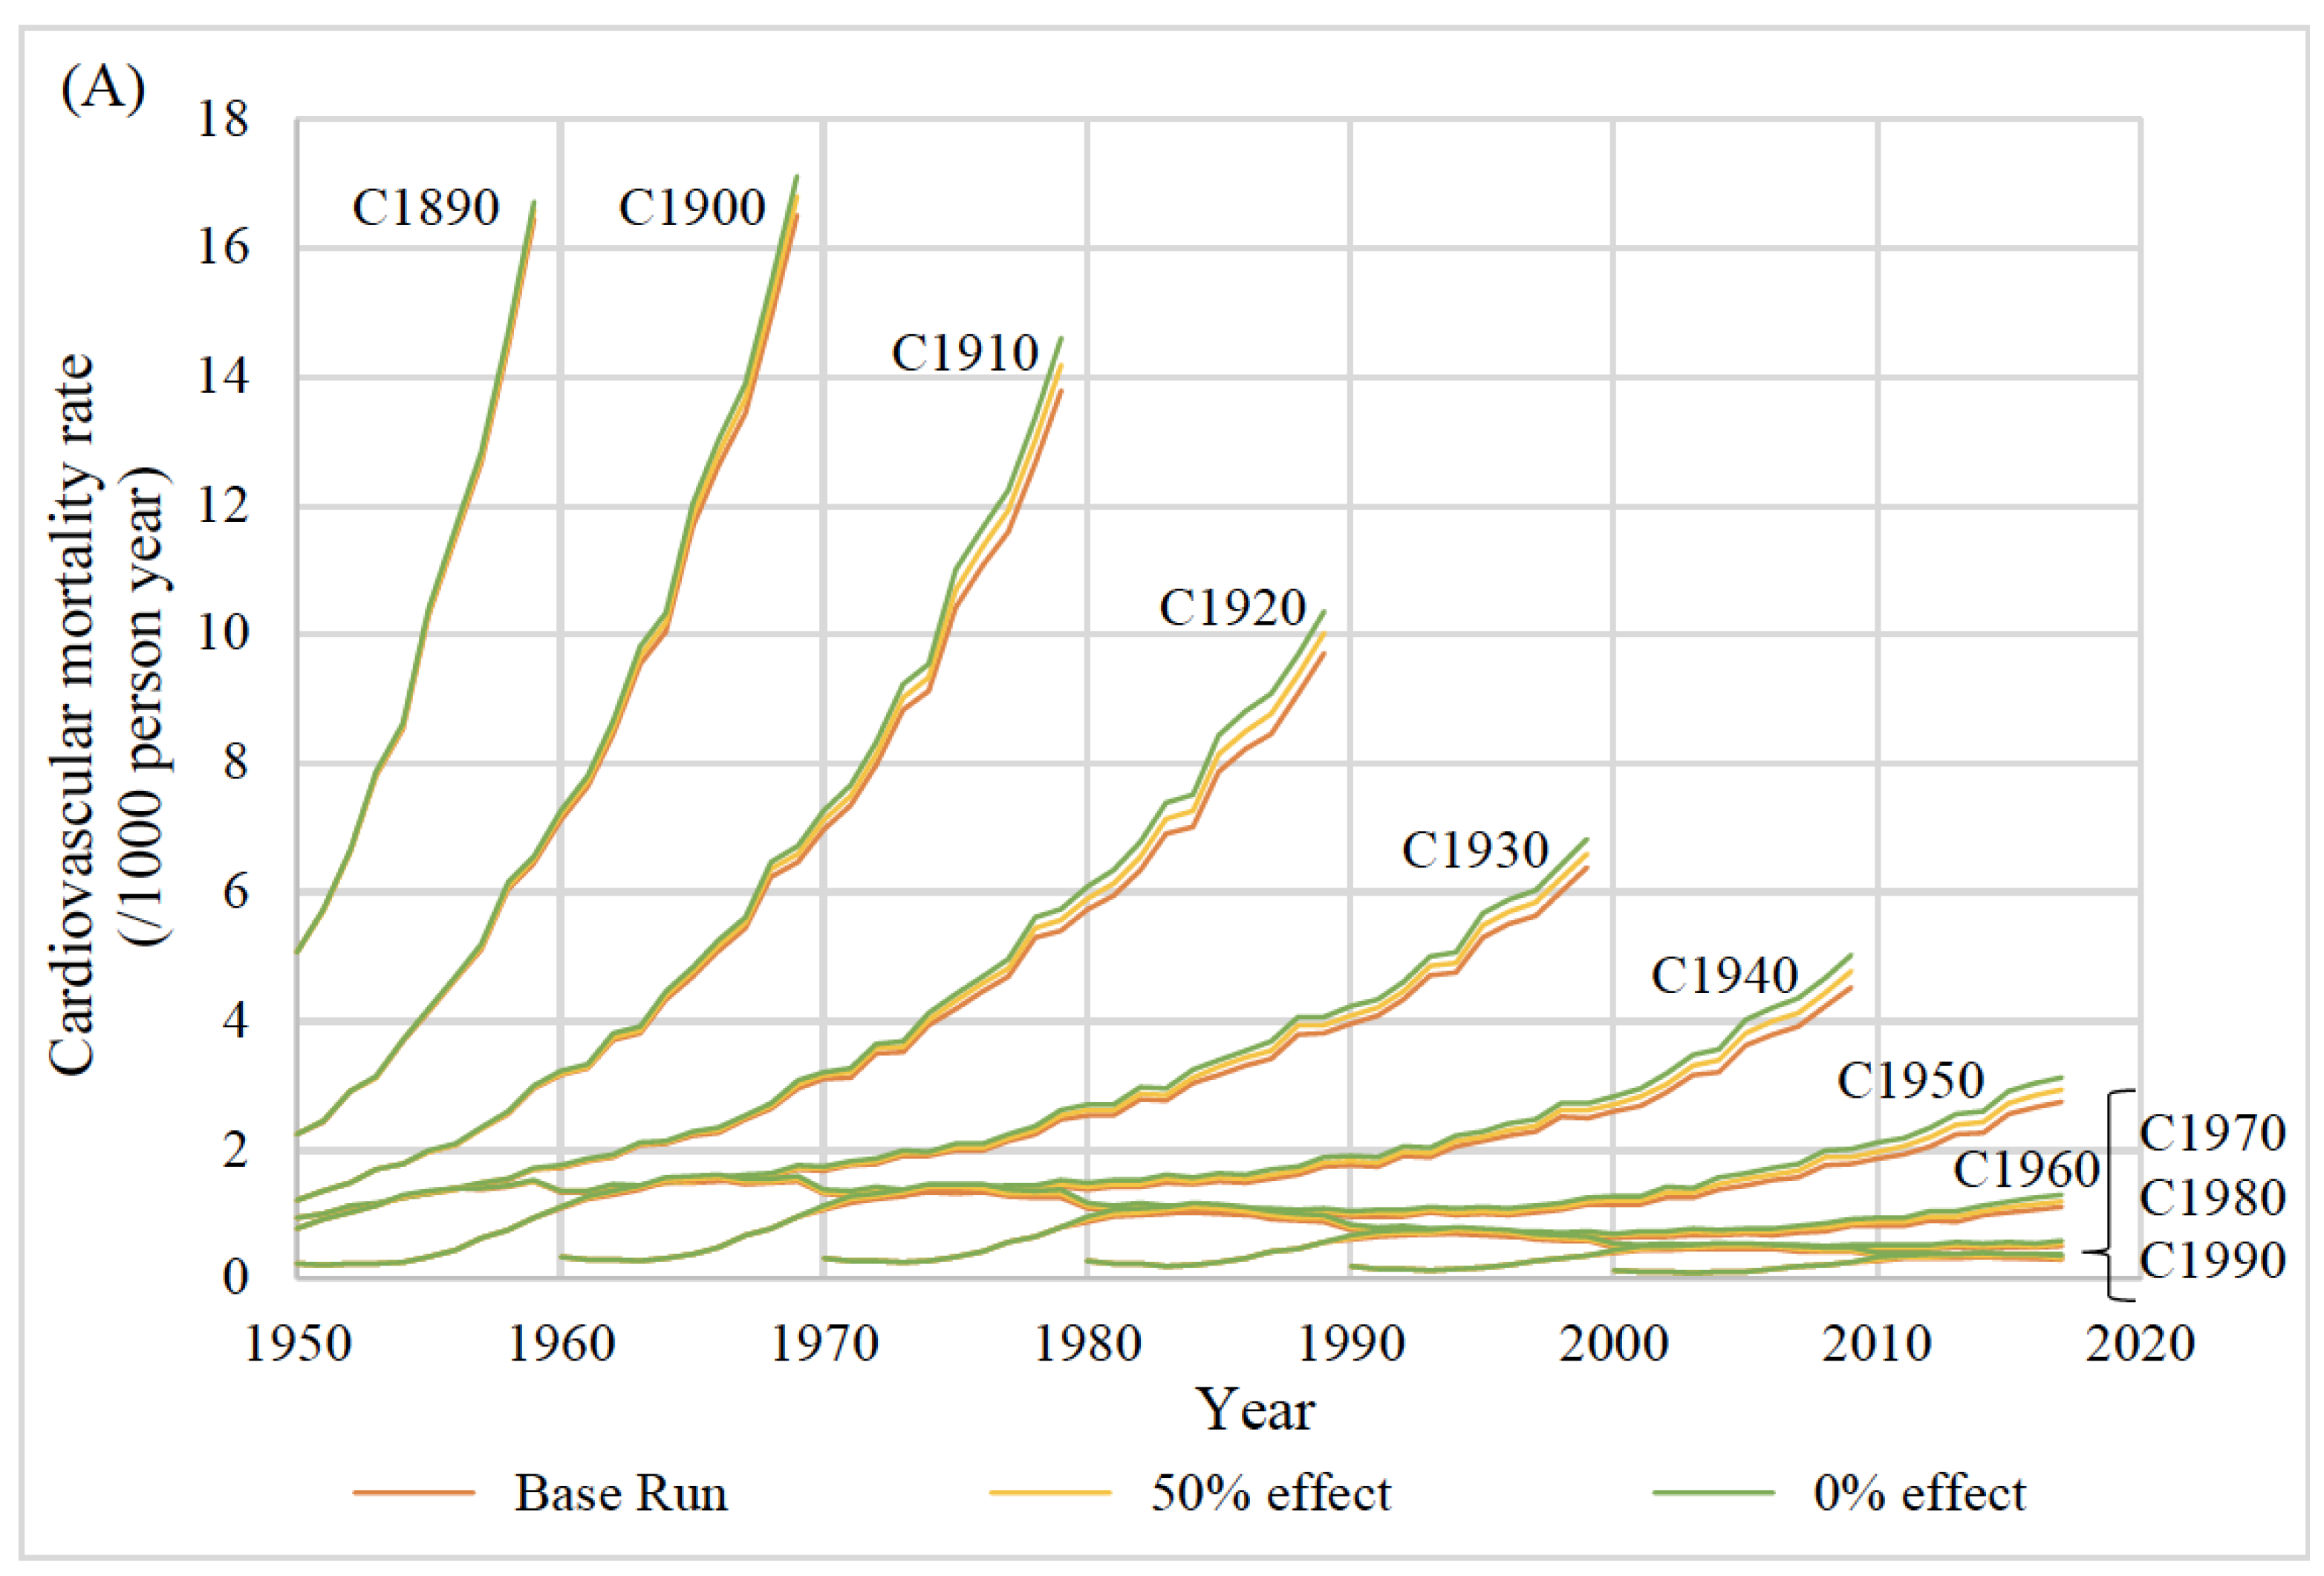
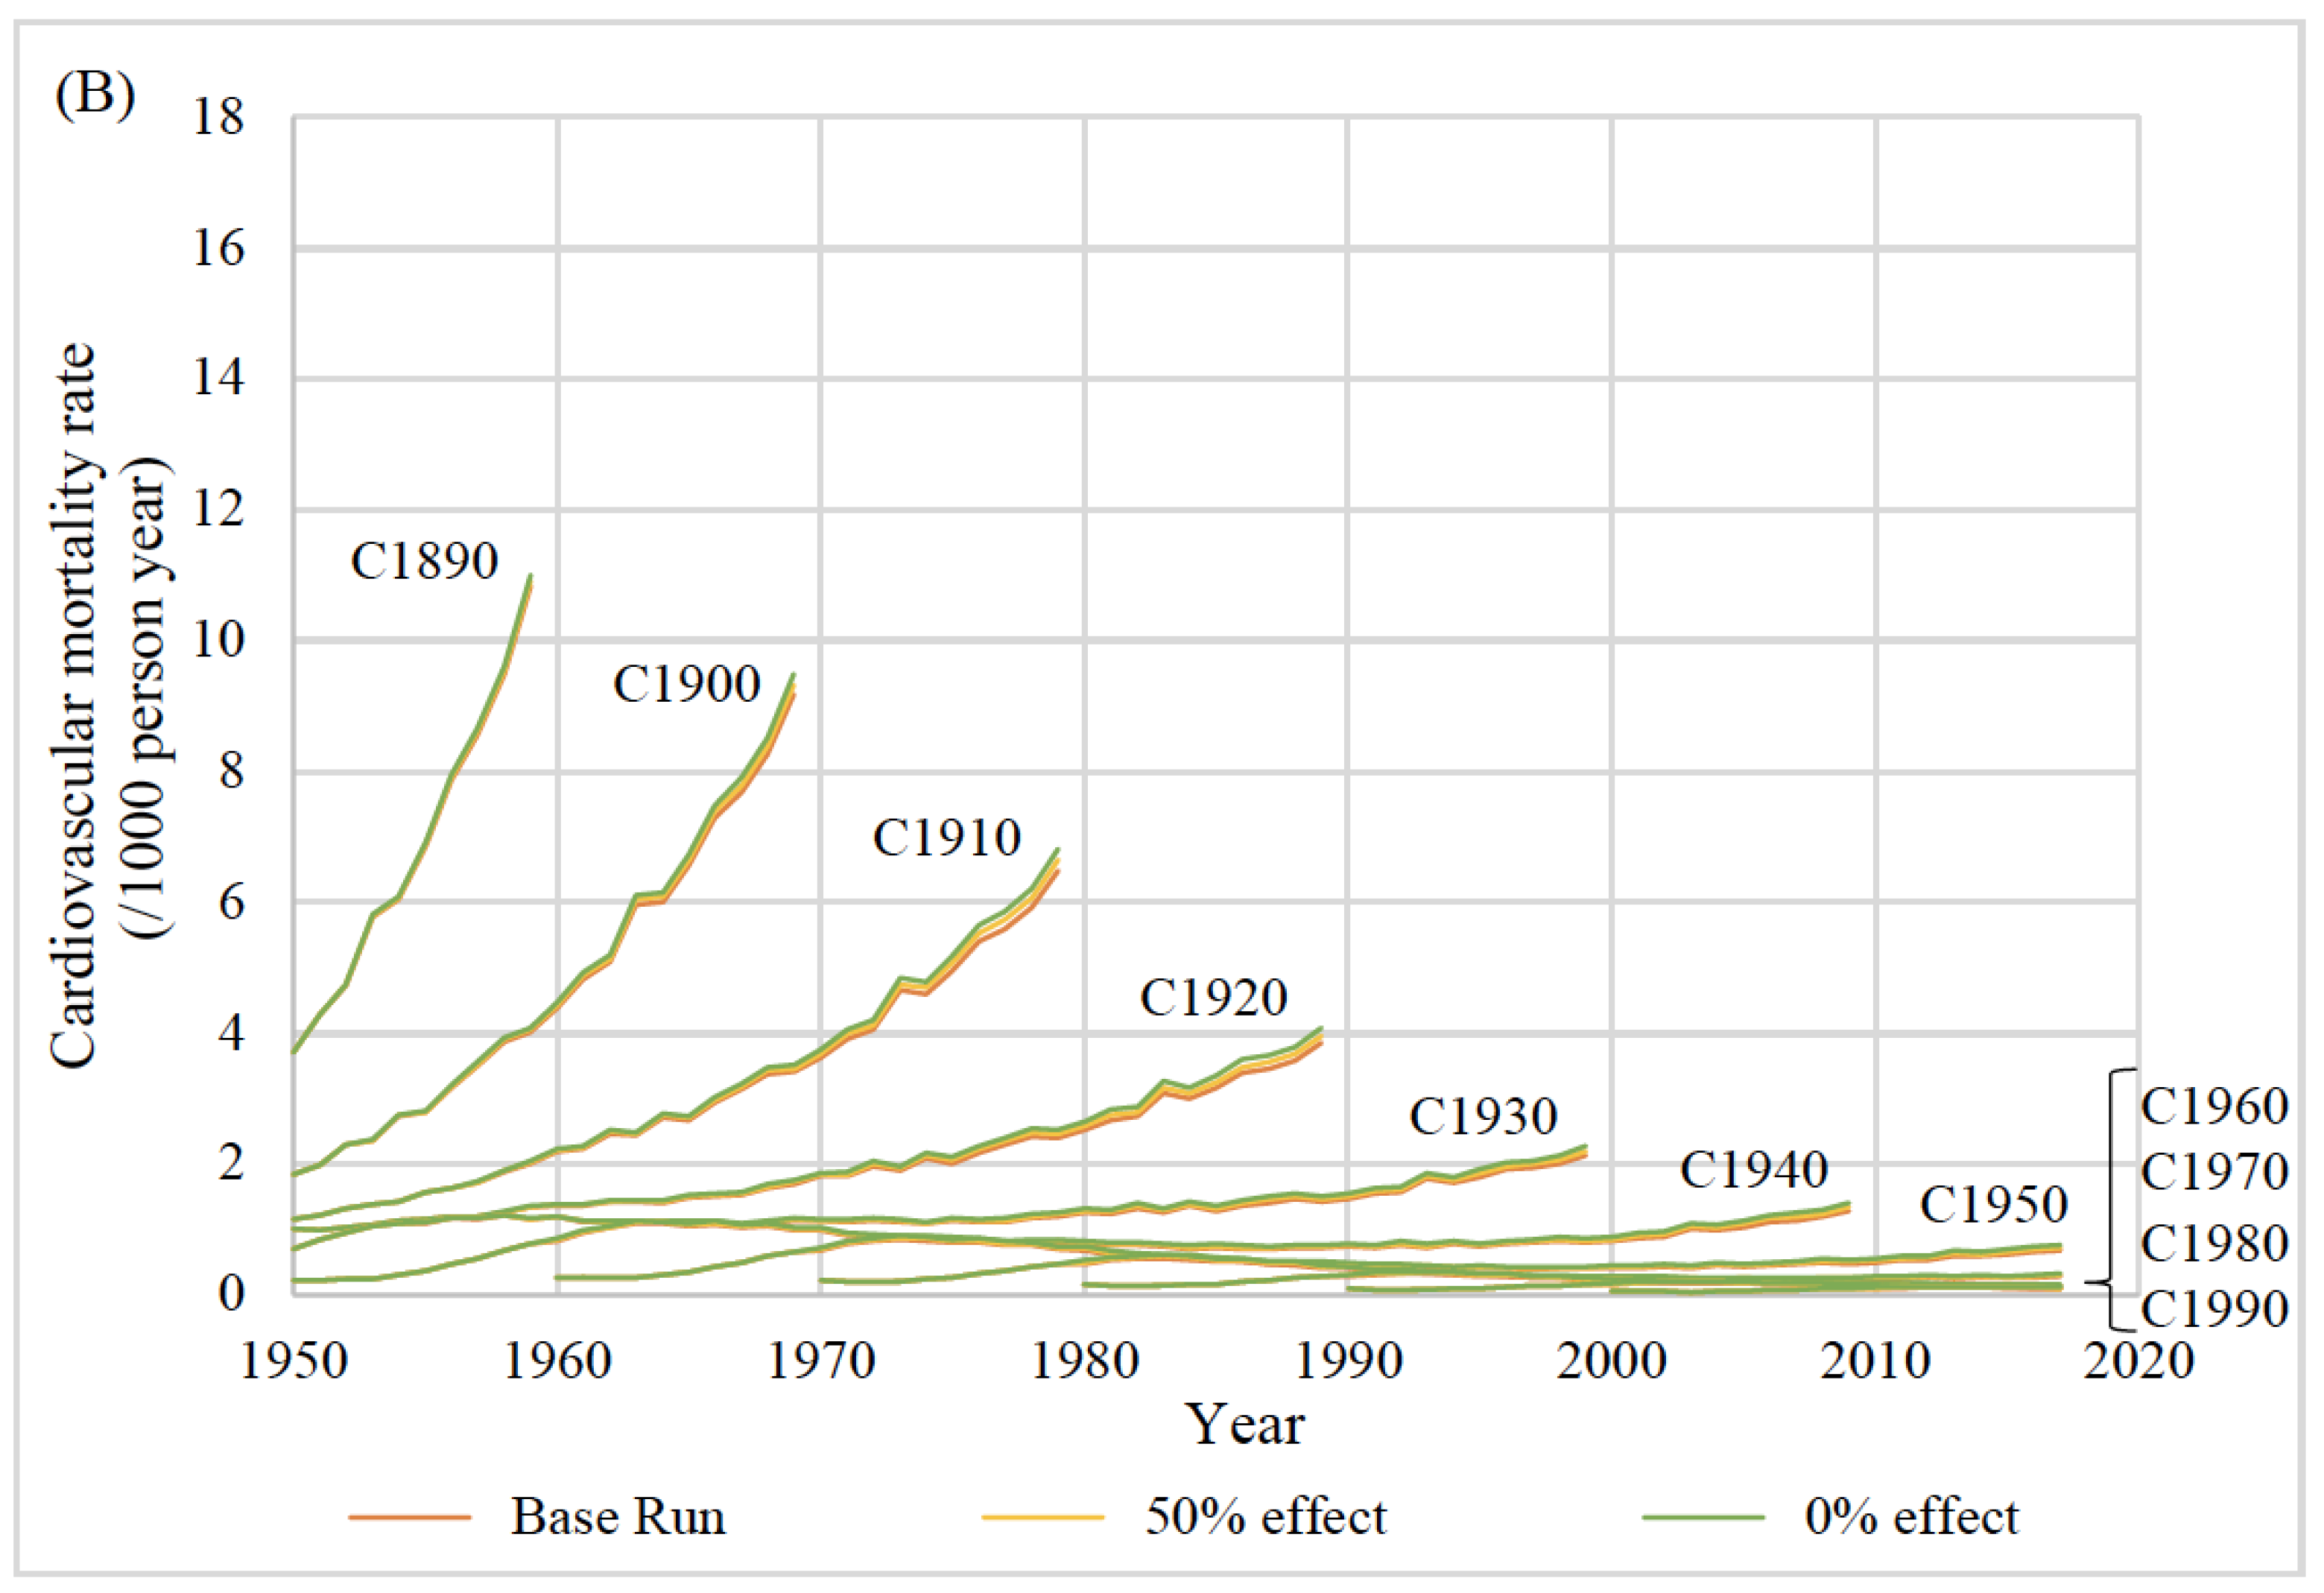
3.1. Simulation of Cardiovascular Mortality Rate
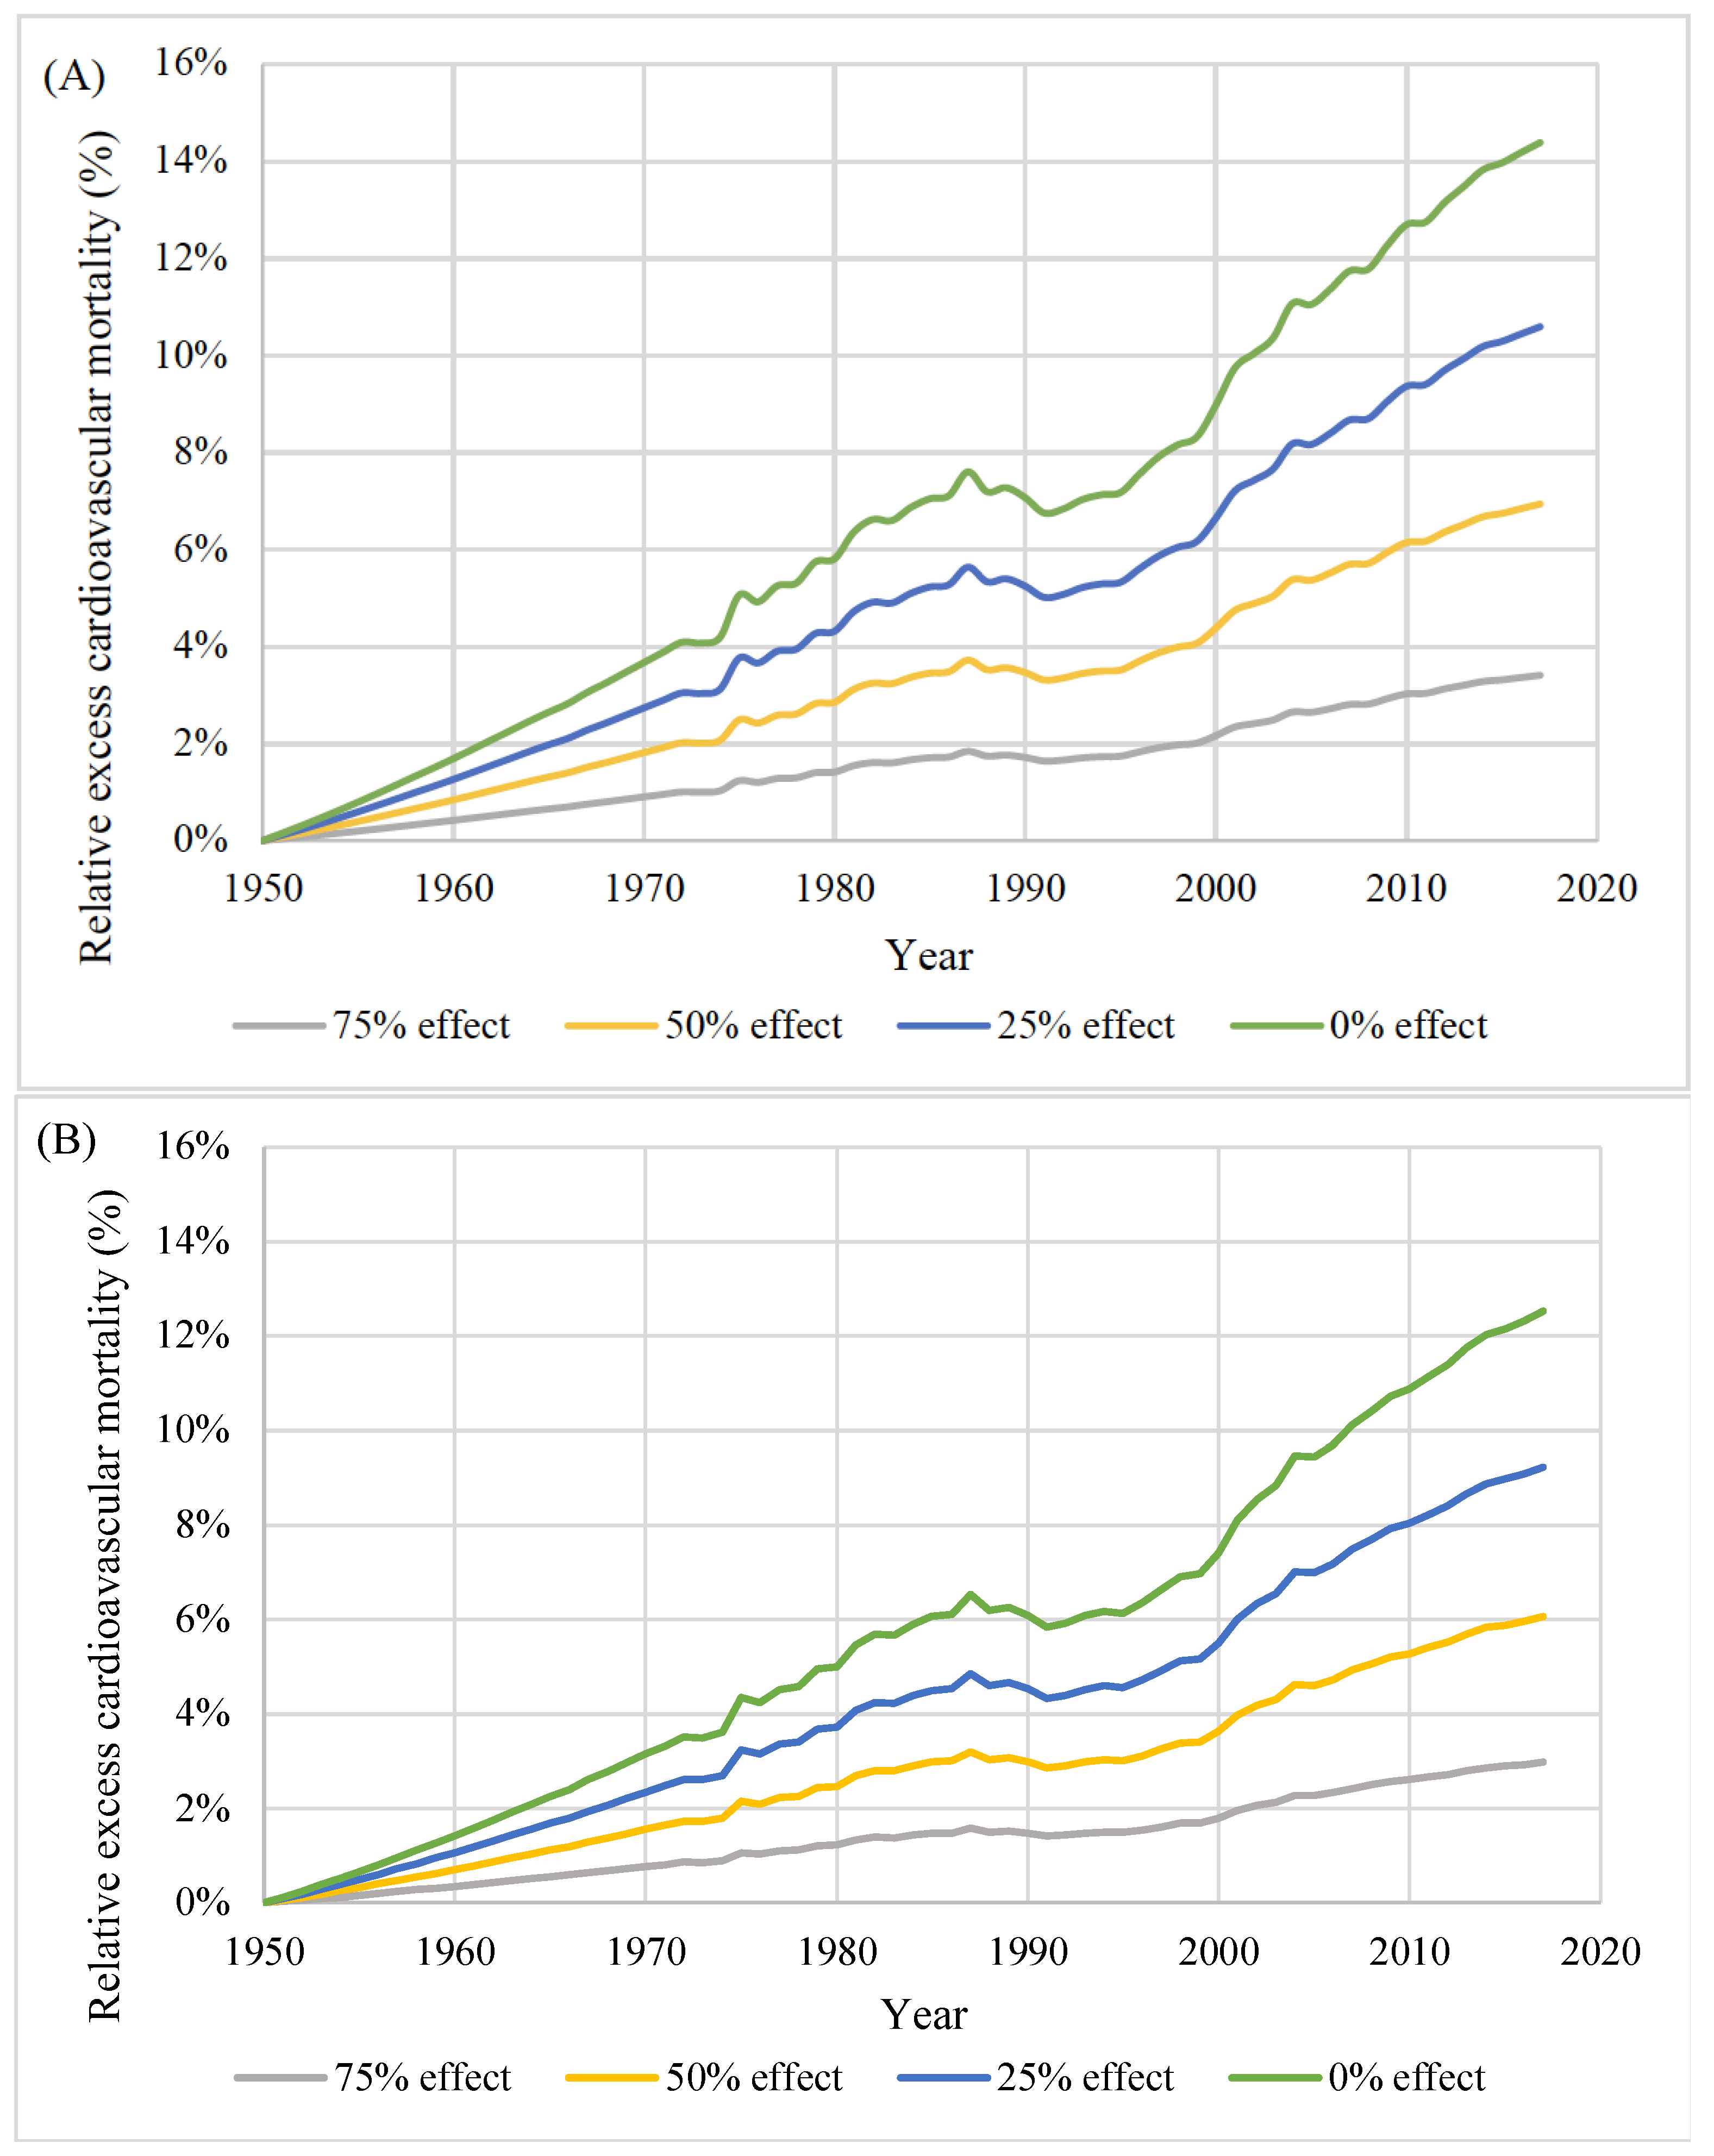
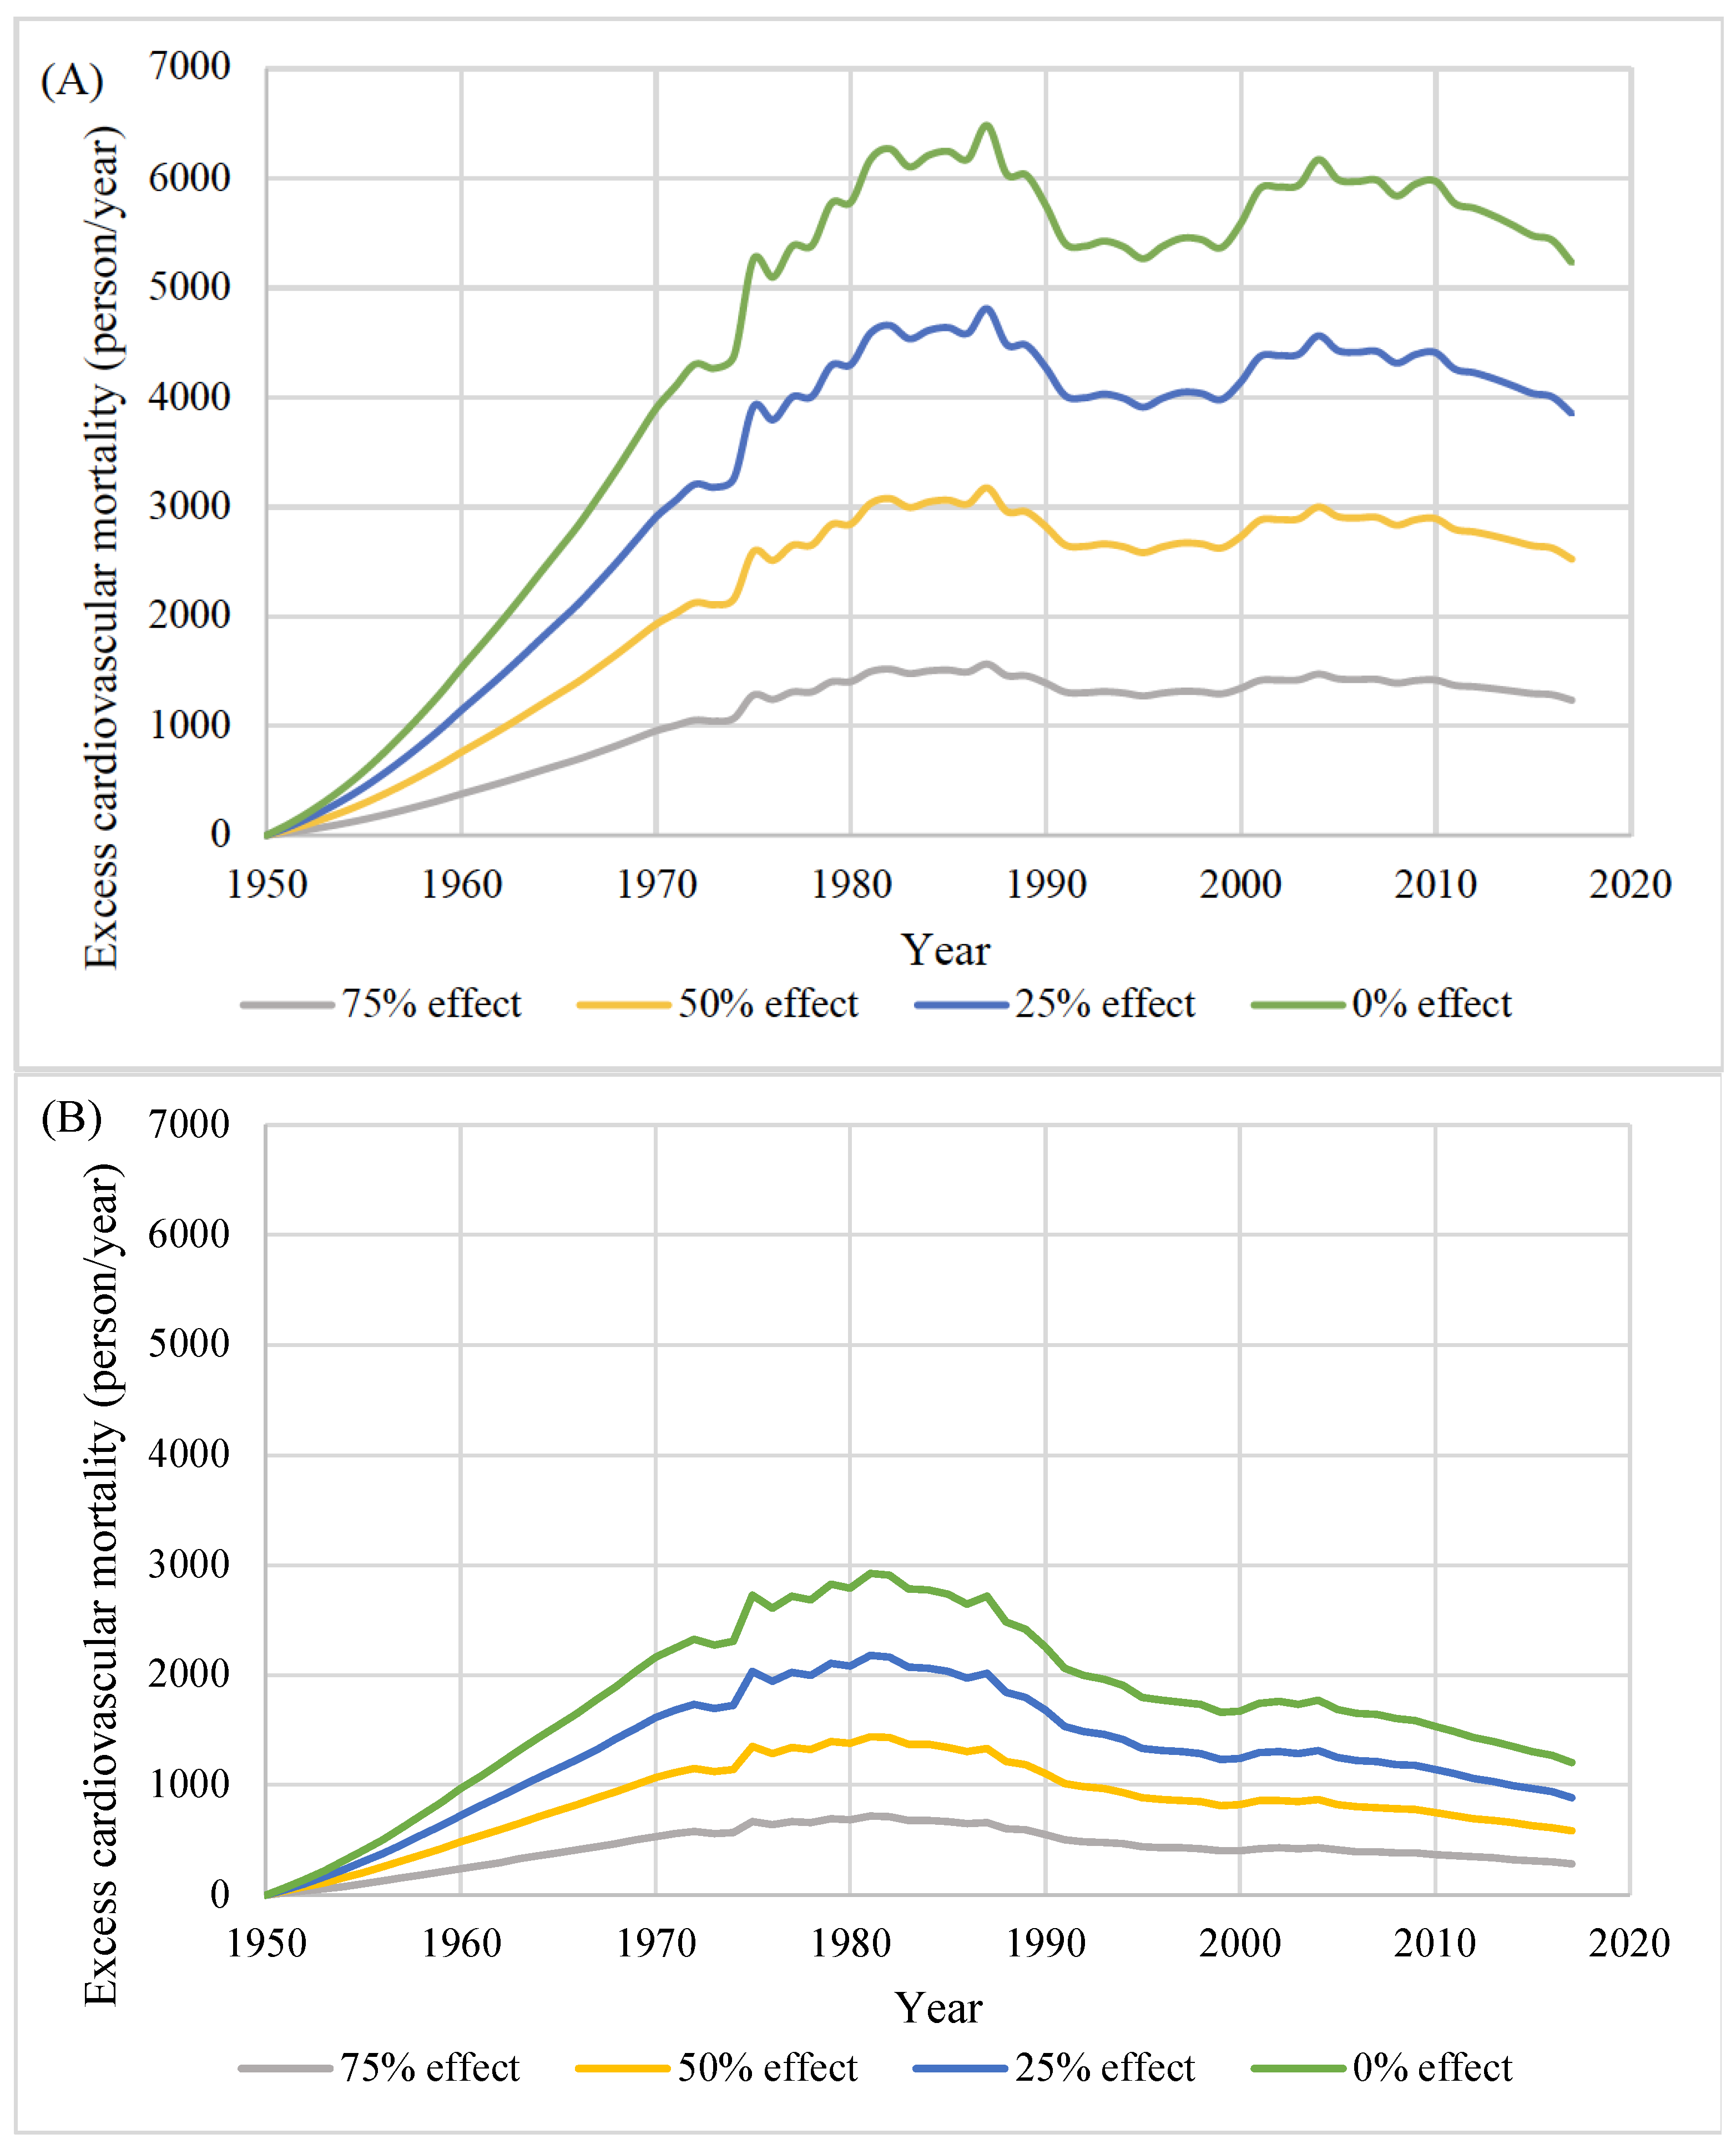
3.2. Excess Cardiovascular Mortality by Year
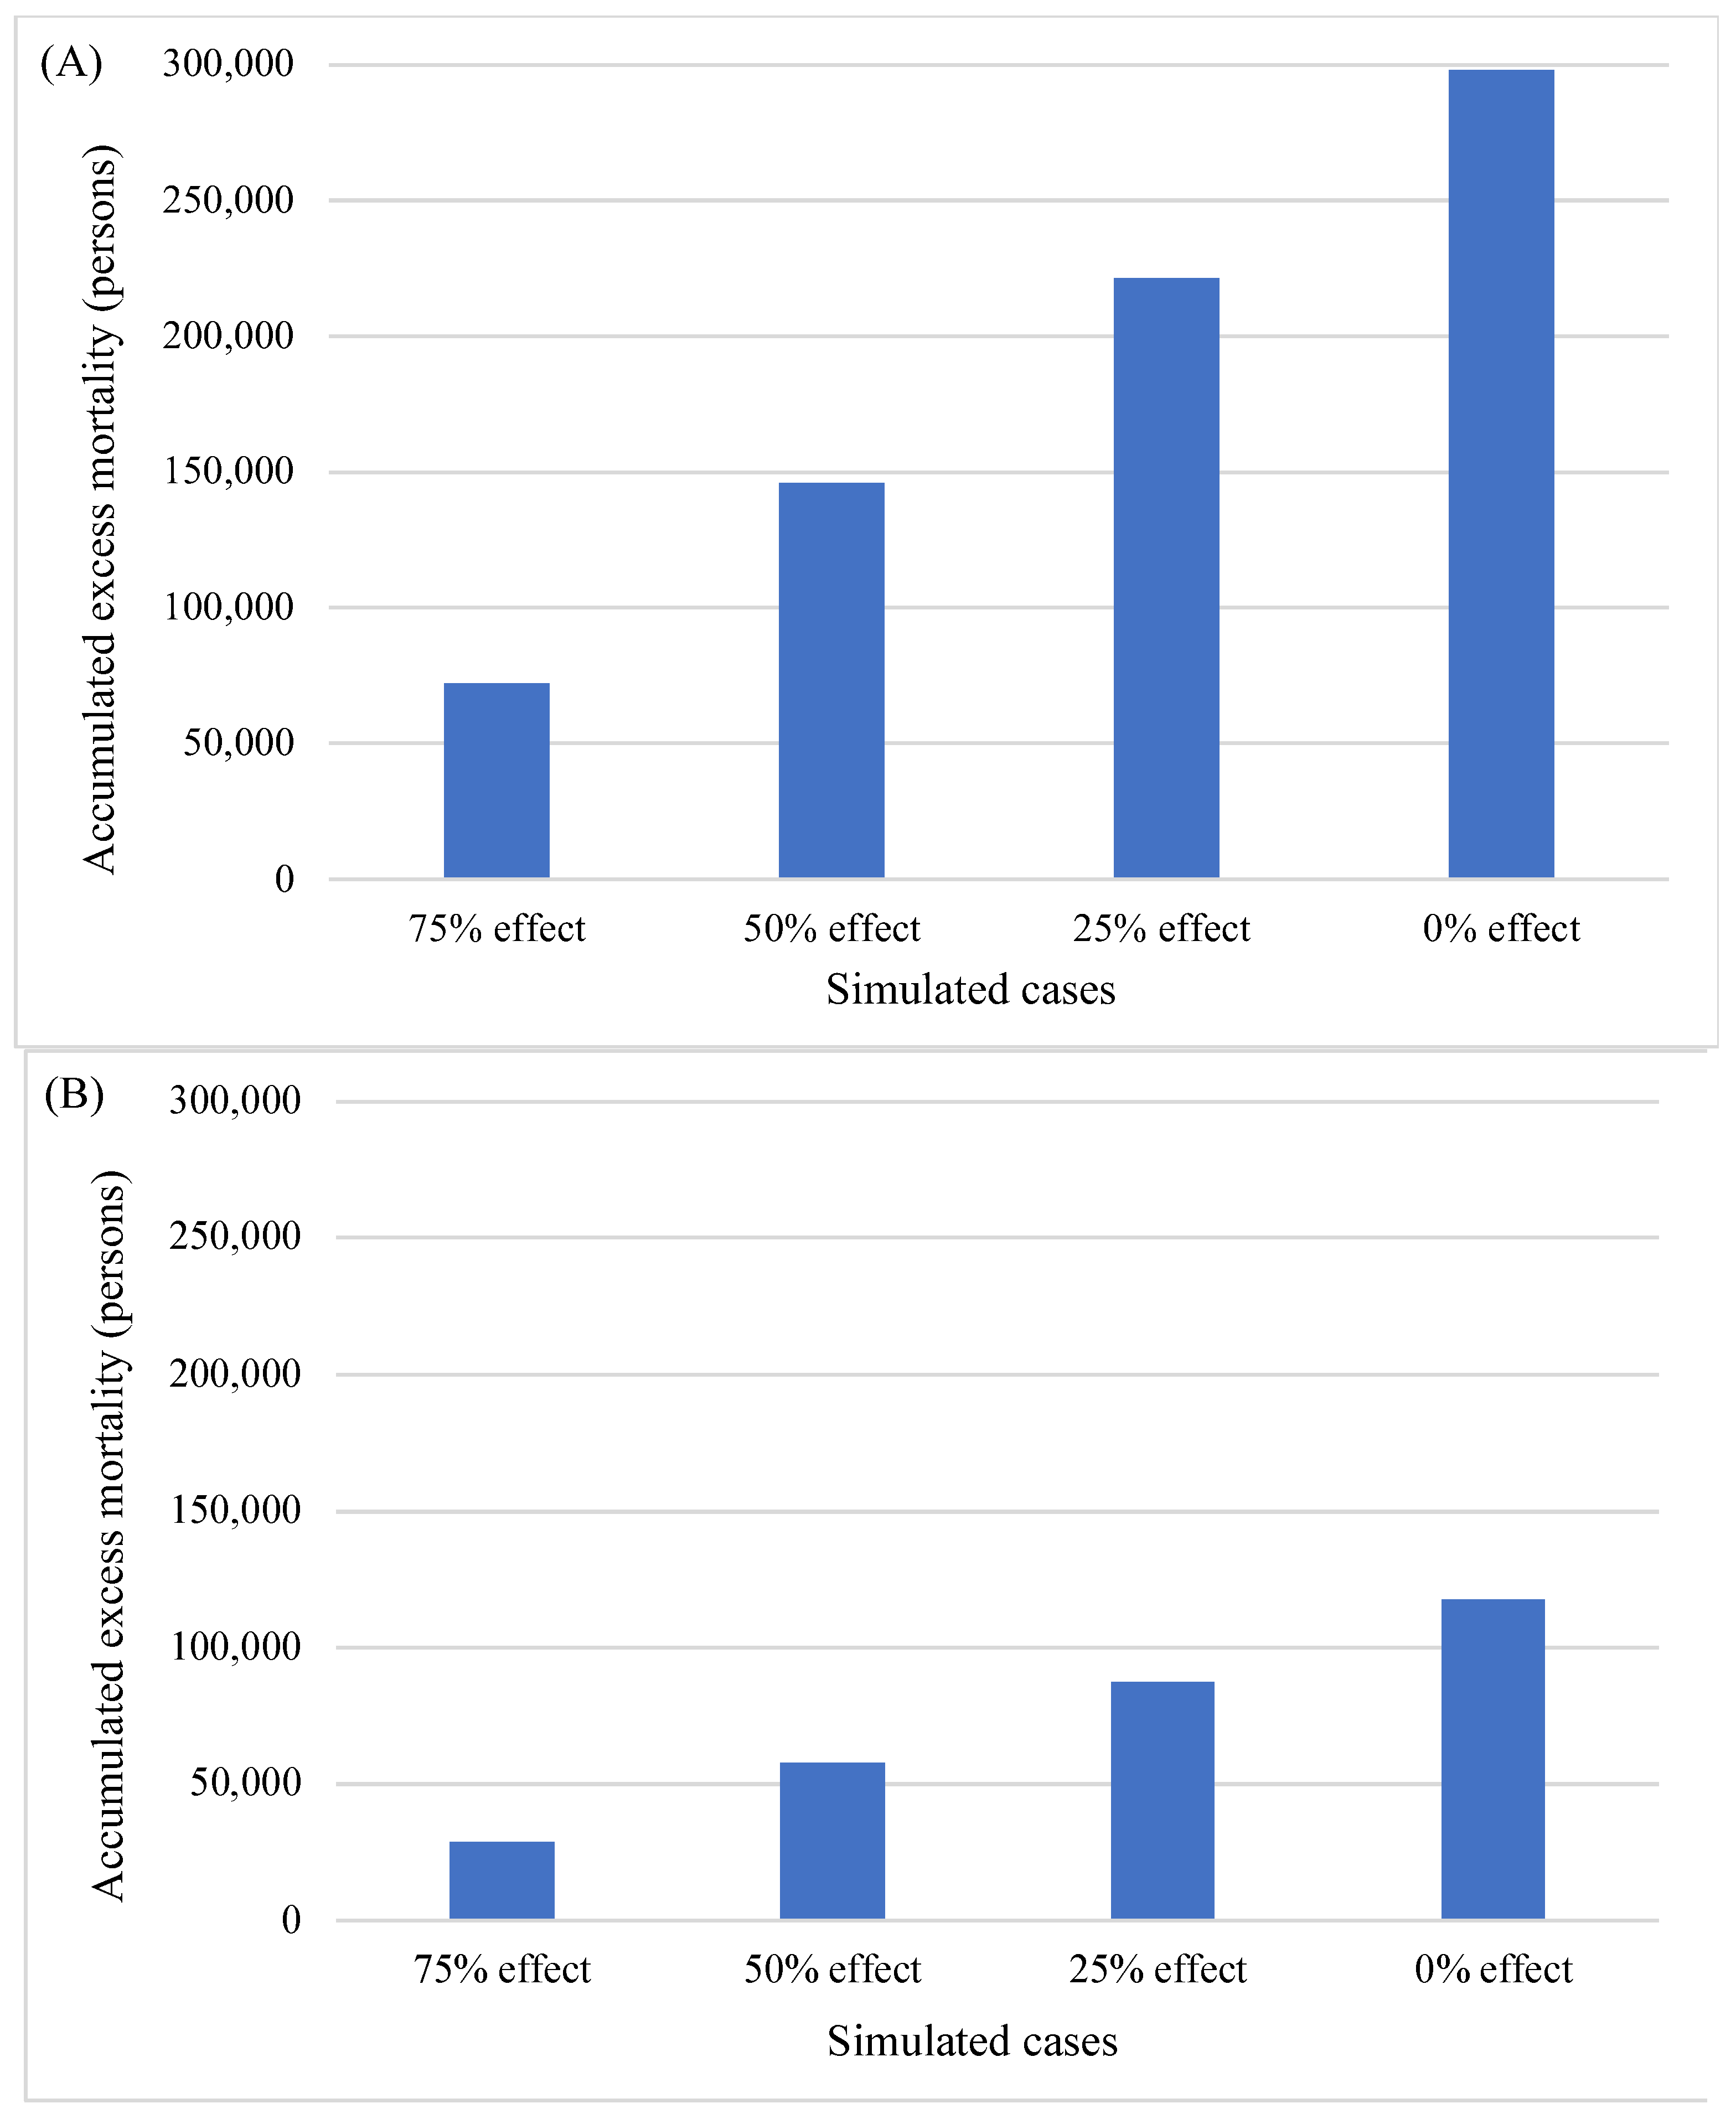
3.3. Accumulated Excess Cardiovascular Mortality during the Observation Period
4. Discussion
5. Conclusions
Supplementary Materials
Author Contributions
Funding
Institutional Review Board Statement
Informed Consent Statement
Data Availability Statement
Conflicts of Interest
References
- Vos, T.; Lim, S.S.; Abbafati, C.; Abbas, K.M.; Abbasi, M.; Abbasifard, M.; Abbasi-Kangevari, M.; Abbastabar, H.; Abd-Allah, F.; Abdelalim, A.; et al. Global burden of 369 diseases and injuries in 204 countries and territories, 1990–2019: A systematic analysis for the Global Burden of Disease Study 2019. Lancet 2020, 396, 1204–1222. [Google Scholar] [CrossRef]
- Director-General for Statistics and Information Policy, Ministry of Health, Labour and Welfare. Vital Statistics in Japan. Available online: https://www.mhlw.go.jp/toukei/list/dl/81-1a2.pdf (accessed on 5 September 2022).
- Ueshima, H.; Tatara, K.; Asakura, S.; Okamoto, M. Declining trends in blood pressure level and the prevalence of hypertension, and changes in related factors in Japan, 1956–1980. J. Chronic Dis. 1987, 40, 137–147. [Google Scholar] [CrossRef]
- Ueshima, H. Changes in dietary habits, cardiovascular risk factors and mortality in Japan. Acta Cardiol. 1990, 45, 311–327. [Google Scholar] [PubMed]
- Iso, H. A Japanese health success story: Trends in cardiovascular diseases, their risk factors, and the contribution of public health and personalized approaches. EPMA J. 2011, 2, 49–57. [Google Scholar] [CrossRef]
- Shimamoto, T.; Iso, H.; Iida, M.; Komachi, Y. Epidemiology of cerebrovascular disease: Stroke epidemic in Japan. J. Epidemiol./Jpn. Epidemiol. Assoc. 1996, 6, S43–S47. [Google Scholar] [CrossRef]
- Miura, K. Epidemiology and prevention of hypertension in Japanese: How could Japan get longevity? EPMA J. 2011, 2, 59–64. [Google Scholar] [CrossRef]
- Intersalt: An International Study of Electrolyte Excretion and Blood Pressure. Results for 24 hour urinary sodium and potassium excretion. Intersalt Cooperative Research Group. BMJ 1988, 297, 319–328. [Google Scholar] [CrossRef]
- Strazzullo, P.; D’Elia, L.; Kandala, N.-B.; Cappuccio, F.P. Salt intake, stroke, and cardiovascular disease: Meta-analysis of prospective studies. BMJ 2009, 339, b4567. [Google Scholar] [CrossRef]
- He, F.J.; MacGregor, G.A. Salt reduction lowers cardiovascular risk: Meta-analysis of outcome trials. Lancet 2011, 378, 380–382. [Google Scholar] [CrossRef]
- Taylor, R.S.; Ashton, K.E.; Moxham, T.; Hooper, L.; Ebrahim, S. Reduced dietary salt for the prevention of cardiovascular disease: A meta-analysis of randomized controlled trials (Cochrane review). Am. J. Hypertens. 2011, 24, 843–853. [Google Scholar] [CrossRef] [Green Version]
- Mozaffarian, D.; Fahimi, S.; Singh, G.M.; Micha, R.; Khatibzadeh, S.; Engell, R.E.; Lim, S.; Danaei, G.; Ezzati, M.; Powles, J. Global sodium consumption and death from cardiovascular causes. N. Engl. J. Med. 2014, 371, 624–634. [Google Scholar] [CrossRef] [PubMed]
- Anderson, C.A.; Appel, L.J.; Okuda, N.; Brown, I.J.; Chan, Q.; Zhao, L.; Ueshima, H.; Kesteloot, H.; Miura, K.; Curb, J.D.; et al. Dietary sources of sodium in China, Japan, the United Kingdom, and the United States, women and men aged 40 to 59 years: The INTERMAP study. J. Am. Diet Assoc. 2010, 110, 736–745. [Google Scholar] [CrossRef] [PubMed]
- Sacks, F.M.; Svetkey, L.P.; Vollmer, W.M.; Appel, L.J.; Bray, G.A.; Harsha, D.; Obarzanek, E.; Conlin, P.R.; Miller, E.R., 3rd; Simons-Morton, D.G.; et al. Effects on blood pressure of reduced dietary sodium and the Dietary Approaches to Stop Hypertension (DASH) diet. DASH-Sodium Collaborative Research Group. N. Engl. J. Med. 2001, 344, 3–10. [Google Scholar] [CrossRef] [PubMed]
- Fung, T.T.; Chiuve, S.E.; McCullough, M.L.; Rexrode, K.M.; Logroscino, G.; Hu, F.B. Adherence to a DASH-style diet and risk of coronary heart disease and stroke in women. Arch. Intern. Med. 2008, 168, 713–720. [Google Scholar] [CrossRef] [PubMed]
- Umemura, S.; Arima, H.; Arima, S.; Asayama, K.; Dohi, Y.; Hirooka, Y.; Horio, T.; Hoshide, S.; Ikeda, S.; Ishimitsu, T.; et al. The Japanese Society of Hypertension Guidelines for the Management of Hypertension (JSH 2019). Hypertens. Res. Off. J. Jpn. Soc. Hypertens. 2019, 42, 1235–1481. [Google Scholar] [CrossRef]
- The Ministry of Health, Labour and Welfare. Dietary Reference Intakes for Japanese. Available online: https://www.mhlw.go.jp/content/10900000/000862500.pdf (accessed on 5 September 2022).
- World Health Organization. Guideline: Sodium Intake for Adults and Children; World Health Organization: Geneva, Switzerland, 2012. [Google Scholar]
- Ogata, S.; Nishimura, K.; Guzman-Castillo, M.; Sumita, Y.; Nakai, M.; Nakao, Y.M.; Nishi, N.; Noguchi, T.; Sekikawa, A.; Saito, Y.; et al. Explaining the decline in coronary heart disease mortality rates in Japan: Contributions of changes in risk factors and evidence-based treatments between 1980 and 2012. Int. J. Cardiol. 2019, 291, 183–188. [Google Scholar] [CrossRef]
- Miwa, N.; Nakamura, T.; Naruse, Y.; Ooe, Y.; Ohno, Y. The effects of various factors on cerebrovascular disease mortality rates in the 20th century and future trends in Japan. Jpn. J. Public Health 2006, 53, 493–503. [Google Scholar]
- Homer, J.B.; Hirsch, G.B. System dynamics modeling for public health: Background and opportunities. Am. J. Public Health 2006, 96, 452–458. [Google Scholar] [CrossRef]
- Okui, T. Age-period-cohort Analysis of Healthy Lifestyle Behaviors Using the National Health and Nutrition Survey in Japan. J. Prev. Med. Public Health 2020, 53, 409–418. [Google Scholar] [CrossRef]
- Statistics Bureau of Japan. Population Estimates. Available online: https://www.stat.go.jp/english/data/jinsui/index.htm (accessed on 5 September 2022).
- Ministry of Health, Labour and Welfare. Vital Statistics. Available online: https://www.mhlw.go.jp/english/database/db-hw/vs01.html (accessed on 5 September 2022).
- National Institute of Population and Social Security Research. Japan Mortality Database. Available online: http://www.ipss.go.jp/p-toukei/JMD/index-en.asp (accessed on 5 September 2022).
- Ministry of Health, Labour and Welfare. The National Health and Nutrition Survey. Available online: https://www.mhlw.go.jp/bunya/kenkou/kenkou_eiyou_chousa.html (accessed on 5 September 2022).
- Katanoda, K.; Matsumura, Y. National Nutrition Survey in Japan--its methodological transition and current findings. J. Nutr. Sci. Vitaminol. 2002, 48, 423–432. [Google Scholar] [CrossRef]
- Ikeda, N.; Takimoto, H.; Imai, S.; Miyachi, M.; Nishi, N. Data Resource Profile: The Japan National Health and Nutrition Survey (NHNS). Int. J. Epidemiol. 2015, 44, 1842–1849. [Google Scholar] [CrossRef] [PubMed] [Green Version]
- Omori, K. Diet therapy. Jpn. Med. J. 1936, 713, 1591–1664. [Google Scholar]
- Poggio, R.; Gutierrez, L.; Matta, M.G.; Elorriaga, N.; Irazola, V.; Rubinstein, A. Daily sodium consumption and CVD mortality in the general population: Systematic review and meta-analysis of prospective studies. Public Health Nutr. 2015, 18, 695–704. [Google Scholar] [CrossRef] [PubMed]
- Cao, J.; Eshak, E.S.; Liu, K.; Gero, K.; Liu, Z.; Yu, C. Age-Period-Cohort Analysis of Stroke Mortality Attributable to High Sodium Intake in China and Japan. Stroke 2019, 50, 1648–1654. [Google Scholar] [CrossRef] [PubMed]
- National Police Agency. Trafic Accident Information. Available online: https://www.npa.go.jp/publications/statistics/koutsuu/index_jiko_e.html (accessed on 5 September 2022).
- Takachi, R.; Inoue, M.; Shimazu, T.; Sasazuki, S.; Ishihara, J.; Sawada, N.; Yamaji, T.; Iwasaki, M.; Iso, H.; Tsubono, Y.; et al. Consumption of sodium and salted foods in relation to cancer and cardiovascular disease: The Japan Public Health Center-based Prospective Study. Am. J. Clin. Nutr. 2010, 91, 456–464. [Google Scholar] [CrossRef]
- Ikehara, S.; Iso, H.; Date, C.; Kikuchi, S.; Watanabe, Y.; Inaba, Y.; Tamakoshi, A. Salt preference and mortality from stroke and coronary heart disease for Japanese men and women: The JACC study. Prev. Med. 2012, 54, 32–37. [Google Scholar] [CrossRef]
- Tunstall-Pedoe, H.; Woodward, M.; Tavendale, R.; Brook, R.A.; McCluskey, M.K. Comparison of the prediction by 27 different factors of coronary heart disease and death in men and women of the Scottish heart health study: Cohort study. BMJ Br. Med. J. 1997, 315, 722. [Google Scholar] [CrossRef] [Green Version]


| How We Used the Data | Variable Name in the Model | Explanation of Variable | Data Source |
|---|---|---|---|
| Exogenous actual values | Population initials | Population by sex and year as of 1950 for the cohort | Population Estimates [23] |
| Annual birth count | Annual births in 1950–2017 | Vital Statistics [24] | |
| Mortality rate table | Mortality rate for each age group in 1950 | Life table in Japanese Mortality Database [25] | |
| CVD mortality proportion table | Proportion of cardiovascular mortality within the overall mortality in 1950–2017 | Vital Statistics [24] | |
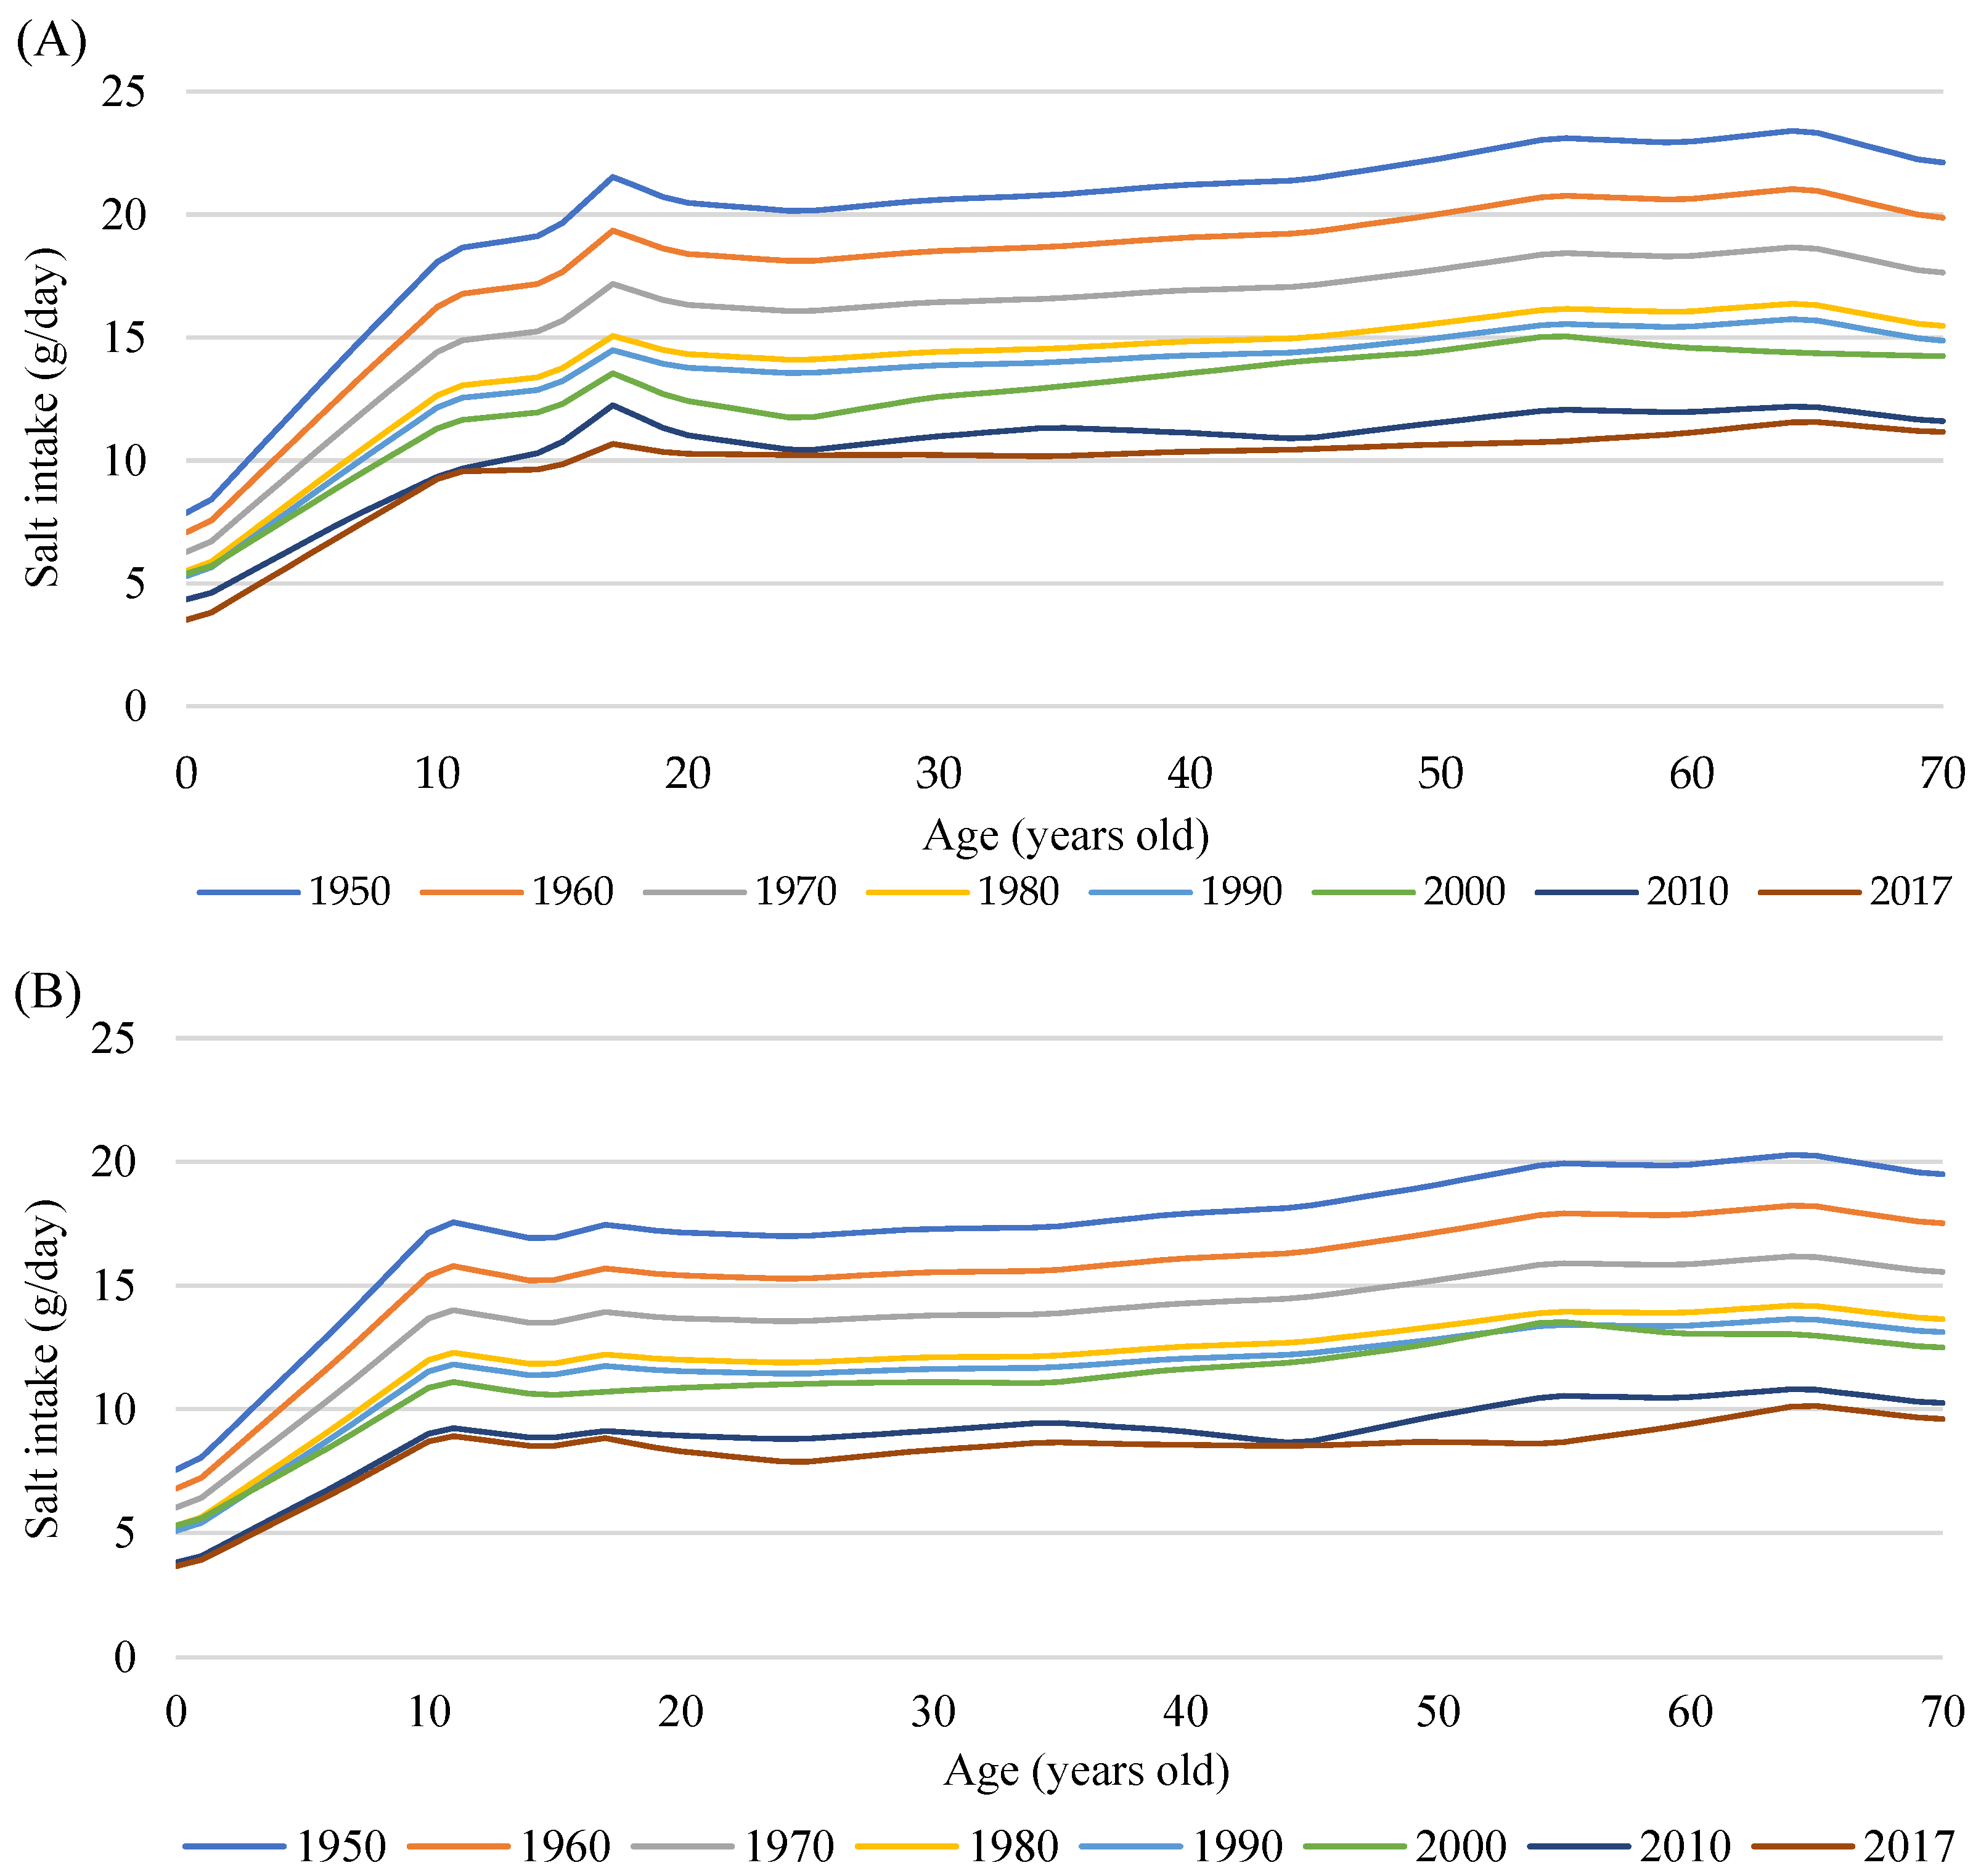
| Salt-as is | Salt intake for each age group in 1950–2017 | National Nutrition Surveys in 1973–2002 and National Health and Nutrition Surveys in 2003–2017 [26] | |
| Salt20yo | Salt intake at the age of 20 years old for each cohort | National Nutrition Surveys in 1973–2002 and National Health and Nutrition Surveys in 2003–2017 [26] | |
| Calibration | Mortality rate | Mortality rate for each age group in 1950–2017 | Life table in Japanese Mortality Database [25] |
Publisher’s Note: MDPI stays neutral with regard to jurisdictional claims in published maps and institutional affiliations. |
© 2022 by the authors. Licensee MDPI, Basel, Switzerland. This article is an open access article distributed under the terms and conditions of the Creative Commons Attribution (CC BY) license (https://creativecommons.org/licenses/by/4.0/).
Share and Cite
Sugiyama, T.; Ikeda, N.; Minowa, K.; Nishi, N. Estimation of the Effect of Salt-Intake Reduction on Cardiovascular Mortality Decline between 1950 and 2017 in Japan: A Retrospective Simulation Study. Nutrients 2022, 14, 3747. https://doi.org/10.3390/nu14183747
Sugiyama T, Ikeda N, Minowa K, Nishi N. Estimation of the Effect of Salt-Intake Reduction on Cardiovascular Mortality Decline between 1950 and 2017 in Japan: A Retrospective Simulation Study. Nutrients. 2022; 14(18):3747. https://doi.org/10.3390/nu14183747
Chicago/Turabian StyleSugiyama, Takehiro, Nayu Ikeda, Kazuko Minowa, and Nobuo Nishi. 2022. "Estimation of the Effect of Salt-Intake Reduction on Cardiovascular Mortality Decline between 1950 and 2017 in Japan: A Retrospective Simulation Study" Nutrients 14, no. 18: 3747. https://doi.org/10.3390/nu14183747
APA StyleSugiyama, T., Ikeda, N., Minowa, K., & Nishi, N. (2022). Estimation of the Effect of Salt-Intake Reduction on Cardiovascular Mortality Decline between 1950 and 2017 in Japan: A Retrospective Simulation Study. Nutrients, 14(18), 3747. https://doi.org/10.3390/nu14183747