
The Impact of Modifying Food Service Practices in Secondary Schools Providing a Routine Meal Service on Student’s Food Behaviours, Health and Dining Experience: A Systematic Review and Meta-Analysis

 ,
,  ,
, 
Abstract
:1. Introduction
2. Materials and Methods
2.1. Search Strategies
2.2. Study Selection
2.3. Eligibility Criteria
2.4. Data Extraction and Management
2.5. Risk of Bias and Quality Criteria
2.6. Data Analysis
2.6.1. Classification of Intervention Strategies
2.6.2. Grouping of Outcomes Measured
2.6.3. Impact of Interventions
Meta-Analysis
Vote-Counting Based on the Direction of Effect
Narrative Summary
3. Results
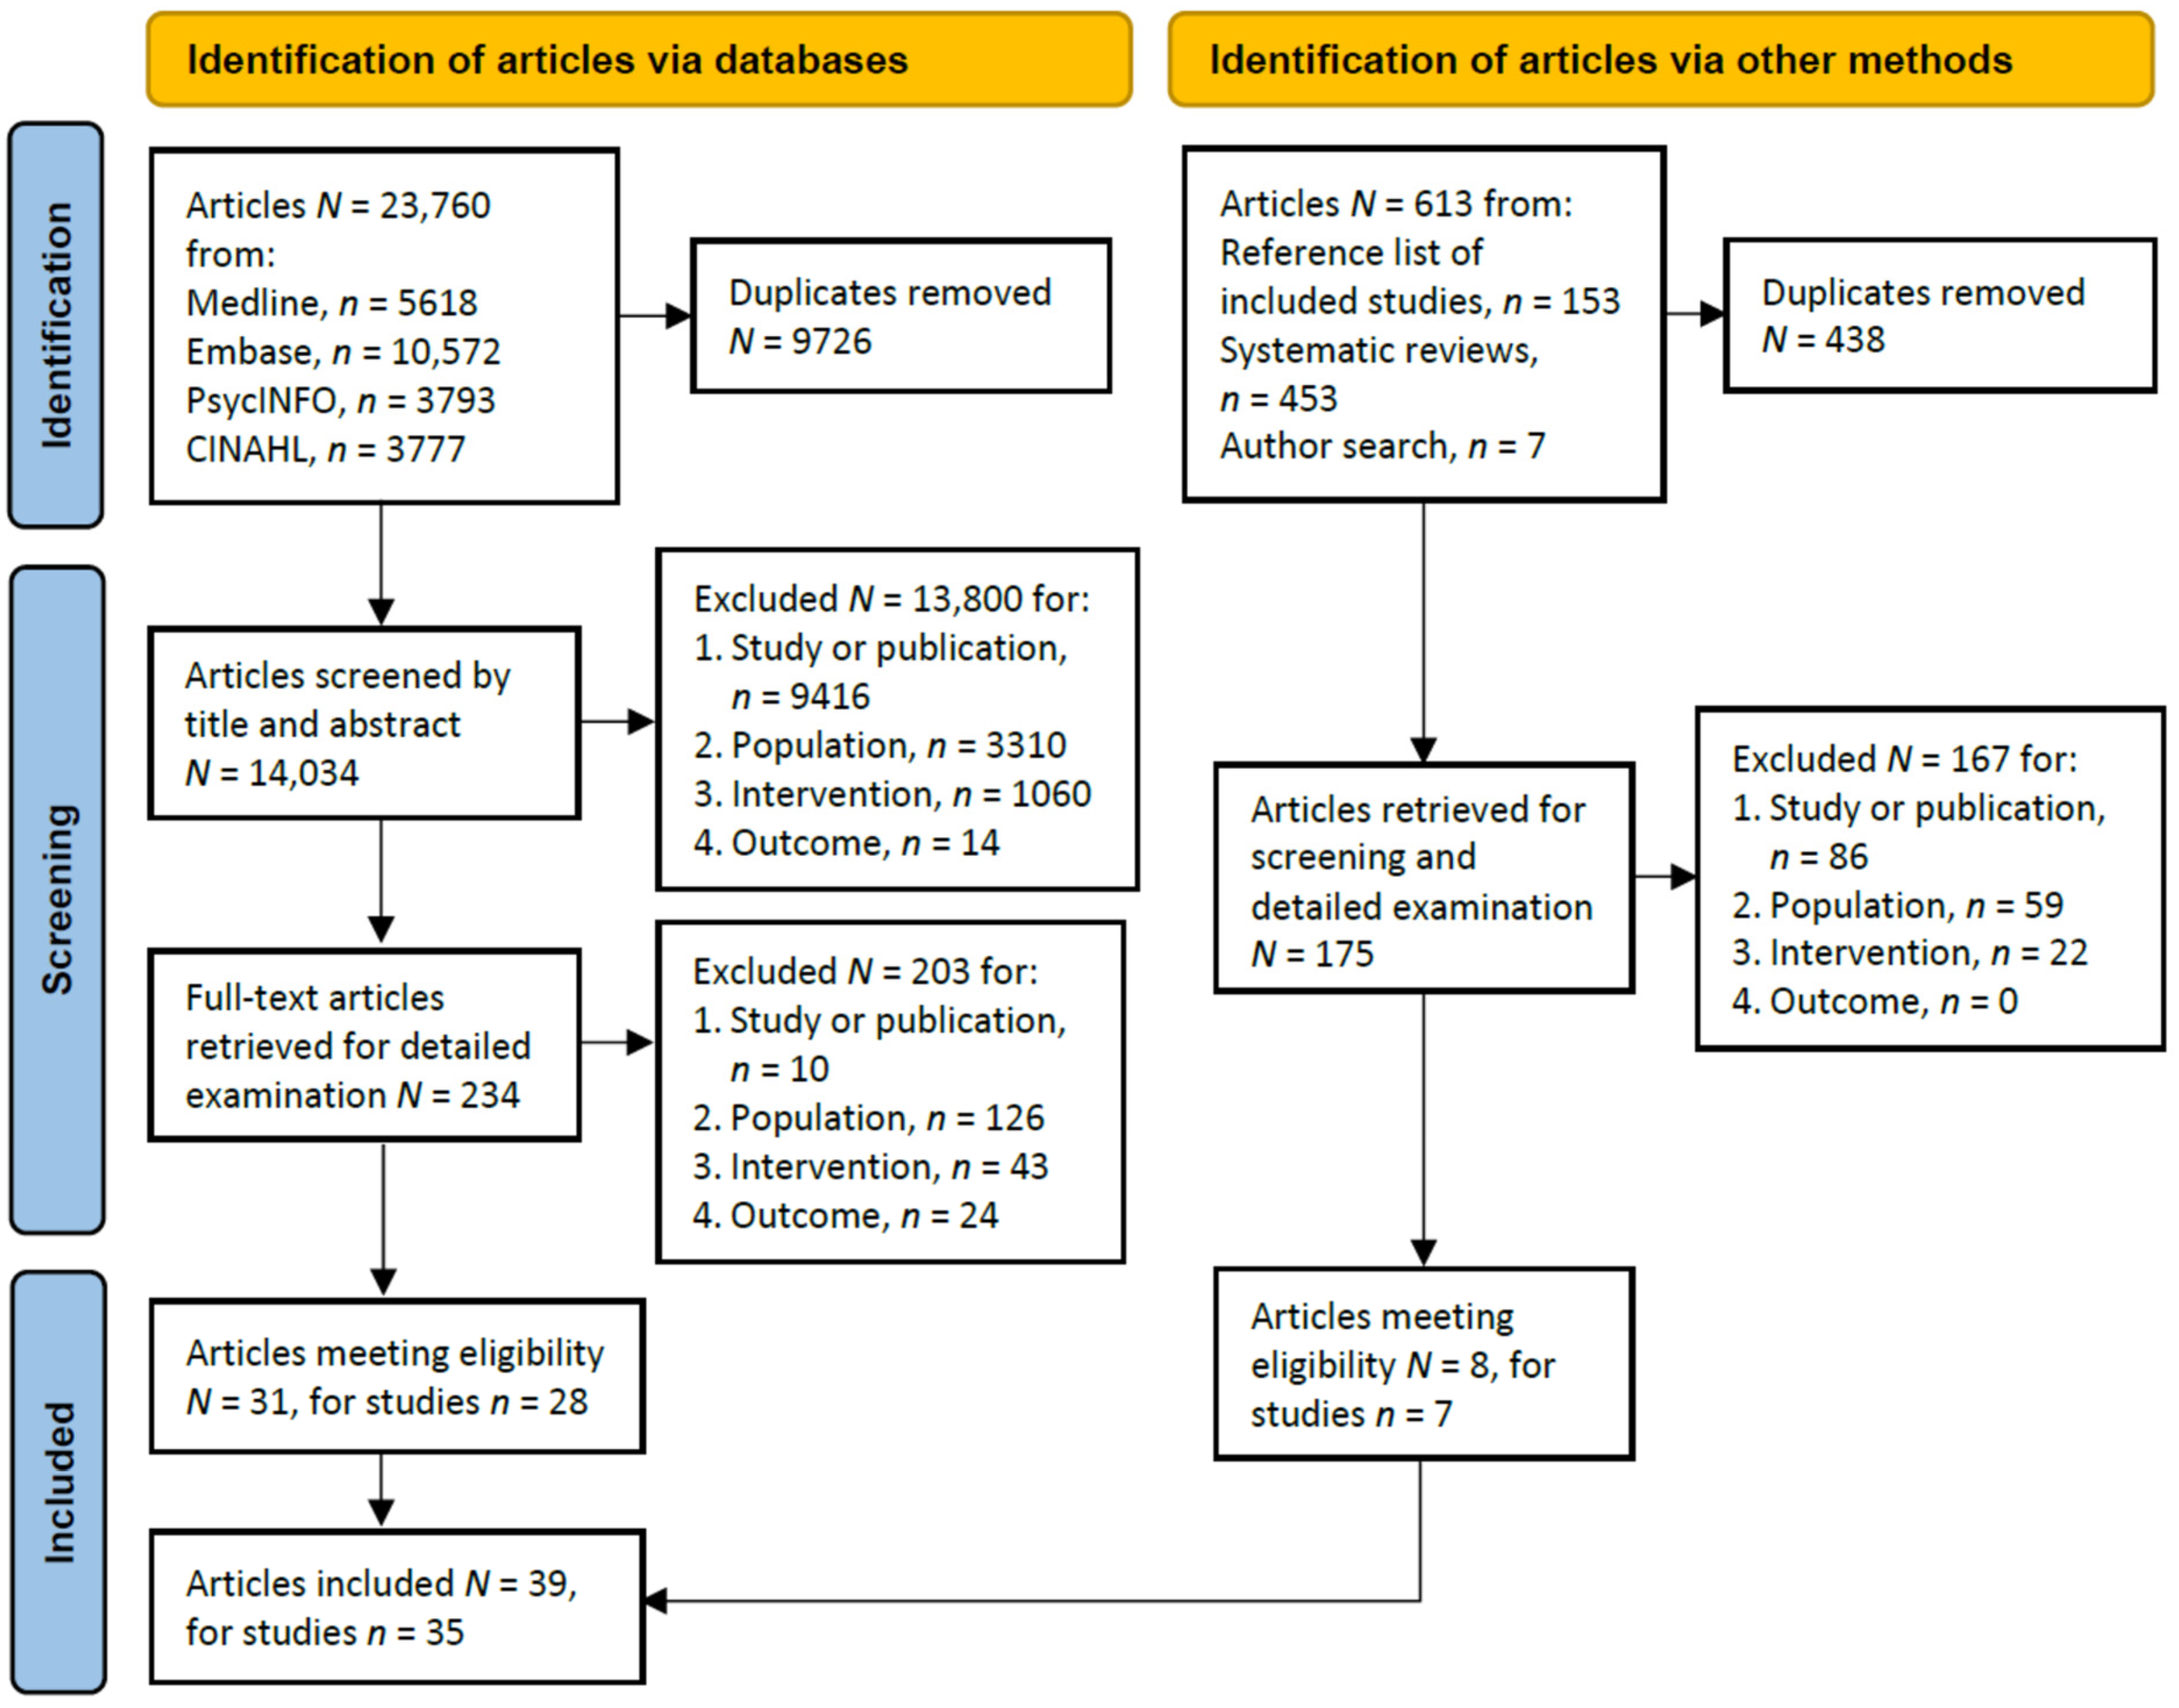
3.1. Search Results
3.2. General Characteristics of Included Studies
3.3. Risk of Bias and Quality Assessment
3.4. Data Analysis
3.4.1. Intervention Strategies
3.4.2. Outcomes Measured
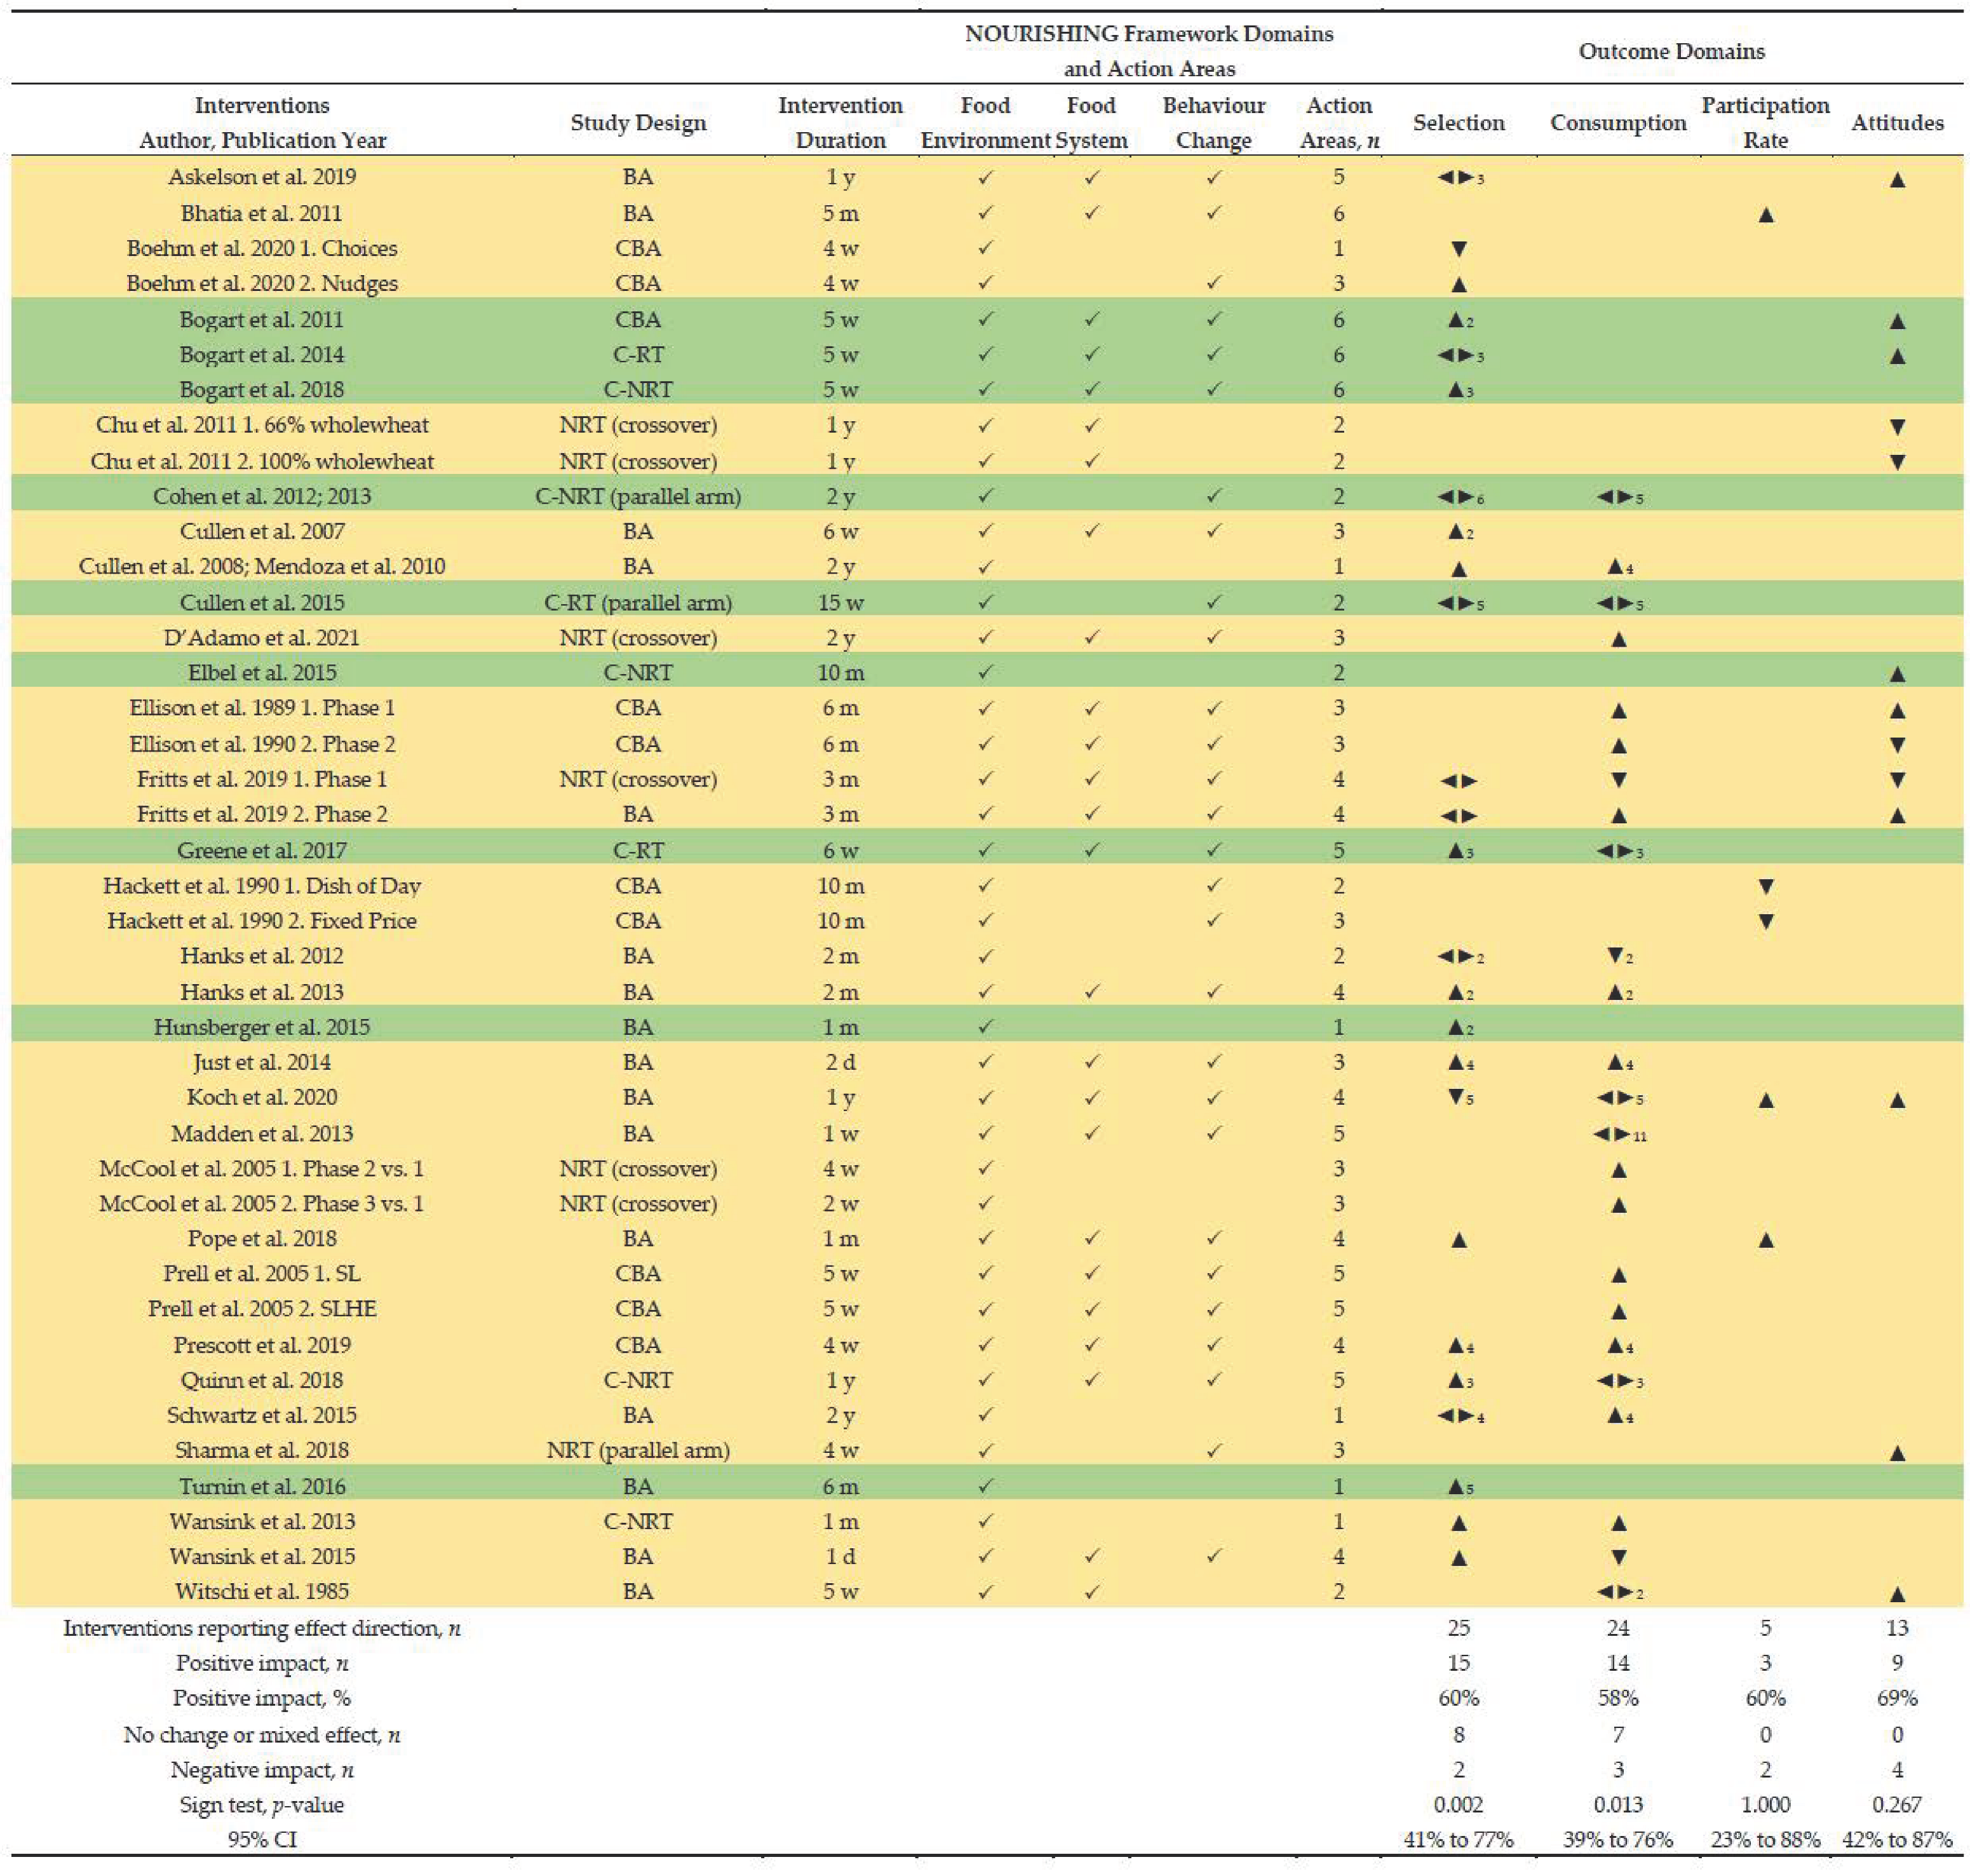
- Student selection of a meal component: measured as either (i) percent of students selecting, (ii) numbers of serves selected, or (iii) amount selected using weight or fluid measurements; assessed in n = 26 interventions (62%) and included fruit (n = 17), vegetables (n = 18), entrée (n = 11), milk (n = 11), grains (n = 4), protein foods (n = 3), energy (n = 2), and desserts, overall meal, healthier foods, sides and saturated fat (each, n = 1).
- Student consumption of a meal component: measured as either (i) percent of serve consumed, (ii) number of serves consumed, or (iii) amount consumed using weight of fluid measurements; assessed in n = 24 interventions (57%) and included measures of fruit (n = 14), vegetables (n = 15), milk (n = 10), entrée and energy (each, n = 5), protein foods and saturated fat (each, n = 4), grains, calcium, iron, sodium, total fat, vitamin A and vitamin C (each, n = 3), fibre and sodium (each, n = 2), overall meal, healthier foods, sides, carbohydrates, folate and zinc (each, n = 1).
- Health status: Blood pressure (BP) was measured in n = 1 intervention to assess the impact of reduced sodium in school meals. Body mass index (BMI) was measured in n = 1 intervention to assess the impact of interactive kiosks to guide student lunch choices.
- Knowledge: One study (n = 2 intervention arms) measured knowledge about fish before and after an intervention that aimed to increase students’ intake of fish at school and included classroom education about fish preparation in the school kitchen.
- Meal program participation rate: assessed in n = 5 studies and represents the proportion of enrolled students that participated in the school meal program pre-and post-intervention, reflecting population level selection/acceptance of the school meal program without separating components of the meal program or reflect consumption.
- Attitudes and perceptions related to changes to the meal service: assessed in n = 15 interventions (n = 13 with before and after measurements) to assess students’ attitude toward school lunch and the cafeteria, acceptability of modified or new menu items, or feedback on intervention components.
3.4.3. Impact of Interventions
Meta-Analysis
- Number of students selecting a meal component (Supplementary Materials Figure S1): Four separate meta-analyses were prepared for fruit (n = 7 studies), vegetables (n = 8 studies), entrée (n = 6 studies; 7 interventions) and milk (n = 6 studies). The pooled effect showed interventions increased the proportion of students selecting vegetables (OR: 1.39; 95% CI: 1.12, 1.73; p = 0.002), with no change in the proportion of students selecting fruit (OR: 1.03; 95% CI: 0.84, 1.27; p = 0.774), entrée (OR: 1.03; 95% CI: 1.00, 1.06; p = 0.076) or milk (OR: 0.96; 95% CI: 0.91, 1.01; p = 0.088).
- Percent of serve consumed of a meal component by students (Supplementary Materials Figure S2a): Four separate meta-analyses were prepared for fruit (n = 5 studies), vegetables (n = 6 studies), entrée (n = 4 studies) and milk (n = 5 studies). The pooled effect found no change in the percent of serve consumed by students who selected fruit (mean difference MD: 2.99; 95% CI: −2.24, 8.21; p = 0.262), vegetables (MD: 8.64; 95% CI: −4.67, 21.94; p = 0.203), entrée (MD: 4.46; 95% CI: −0.93, 9.84; p = 0.105) or milk (MD: 0.88; 95% CI: −5.61, 7.36; p = 0.791). Supplementary Materials Figure S2b presents a sensitivity analysis excluding Wansink et al. [95] (1 day intervention measuring vegetable consumption) and an improved pooled effect for vegetables (MD: 13.69; 95% CI: 6.09, 21.28; p < 0.001).
- Mean number of serves of a meal component selected per student per day (Supplementary Materials Figure S3a): Two separate meta-analyses were prepared for fruit (n = 4 studies) and vegetables (n = 4 studies). The pooled effect showed interventions increased the number of fruit serves selected per student per day (MD: 0.09; 95% CI: 0.09, 0.09; p < 0.001), with no change in vegetable serves selected (p = 0.977). The pooled estimate for both fruit and vegetable serves selected per student per day is not a good representation due to the large sample size for one study (Bogart et al., 2014 [88]; n = 102,262) that highly influenced the pooled estimate (weighting > 99%). A sensitivity analysis excluded this study (Supplementary Materials Figure S3b). The pooled effect of remaining three studies showed an increase in serves selected per student per day of fruit (MD: 0.14; 95% CI: 0.08, 0.20; p < 0.001) and vegetables (MD: 0.11; 95% CI: 0.05, 0.18; p = 0.001).
- Mean number of serves of a meal component consumed per student per day (Supplementary Materials Figure S4): Two separate meta-analyses were prepared for fruit (n = 4 studies) and vegetables (n = 4 studies). The pooled effect showed interventions increased the number of serves consumed per student per day of fruit (MD: 0.10; 95% CI: 0.04, 0.15; p < 0.001) and vegetables (MD: 0.06; 95% CI: 0.01, 0.10; p = 0.024).
Vote Counting Based on the Direction of Effect
- Intervention duration: there was evidence that shorter interventions (≤2 months) had greater impact on selection and consumption of a meal component compared to longer interventions (≥3 months): selection, 12 of 15 short interventions favoured the intervention (80%; 95% CI: 55% to 93%, p = 0.003) compared to 3 of 10 longer interventions (30%; 95% CI: 11% to 60%, p = 0.625); consumption, 8 of 13 short interventions favoured the intervention (62%; 95% CI: 36% to 82%, p = 0.109) compared to 6 of 11 longer interventions (55%; 95% CI: 28% to 79%, p = 0.125).
- NOURISHING framework domains: there was evidence that interventions targeting three domains had a greater impact on selection and consumption of a meal component compared to interventions targeting less (≤2): selection, 10 of 15 targeting three domains favoured the intervention (67%; 95% CI: 42% to 85%, p = 0.012), compared to 5 of 10 targeting ≤2 domains (50%; 95% CI: 24% to 76%, p = 0.219); consumption, 9 of 15 targeting three domains favoured the intervention (60%; 95% CI: 36% to 80%, p = 0.065), compared to 5 of 9 targeting ≤2 domains (56%; 95% CI: 27% to 81%, p = 0.219).
- NOURISHING framework action areas: there was evidence that interventions targeting more action areas (≥3) had a greater impact on selection and consumption of a meal component compared to interventions that targeted less (≤2): selection, 11 of 16 with more action areas favoured the intervention (69%; 95% CI: 44% to 86%, p = 0.006), compared to 4 of 9 with less (44%; 95% CI: 19% to 73%, p = 0.375); consumption, 11 of 17 with more action areas favoured the intervention (65%; 95% CI: 41% to 83%, p = 0.022), compared to 3 of 7 with fewer (43%; 95% CI: 16% to 75%, p = 0.625).
- Student engagement: there was evidence that interventions that engaged students in development and/or implementation had a greater impact on selection and consumption of a meal component compared to interventions without student engagement: selection, 7 of 9 with student engagement favoured the intervention (78%; 95% CI: 45% to 94%, p = 0.016), compared to 8 of 16 without student engagement (50%; 95% CI: 28% to 72%, p = 0.109); consumption, 5 of 6 with student engagement favoured the intervention (83%; 95% CI: 44% to 97%, p = 0.063), compared to 9 of 18 without student engagement (50%; 95% CI: 29% to 71%, p = 0.146).
Narrative Summary

| # | Author, Year of Publication | Study Design, Study Duration + (Dates) | Setting | Sample Characteristics | Study Aims | Intervention Duration + (Dates), Components * | Intervention Detail |
|---|---|---|---|---|---|---|---|
| 1 | Askelson et al., 2019 [117] | Before-after Pilot 1 y (2016) | USA, Iowa, rural and urban areas | 6 middle schools (5 rural and 1 urban); 1 intervention Grades served by schools K-12; 5–8; 6–8 and 7–8 Enrolment across all schools, n = 3326, range n = 341–1140 per school; all students exposed to intervention; age NR; eligible for FRP lunch, range 18% to 42% | To improve the lunchroom environment to promote healthy food choices and empower food service staff with the knowledge, skills, and ability to communicate with students about making healthy choices in the lunchroom | 1 y (2016)
|
|
| 2 | Bean et al., 2019 [102] | Before-after 2 y (2014–2016) | USA, Virginia | 16 schools: 8 middle, 8 high; 1 intervention Demographic data: student sample size or age NR School district demographics: 75% African American, 13% Hispanic, 9% white, 1% Asian, 2% other ethnicity; 83% of schools with >90% NSLP participation rate | To examine the impact of food service staff training on Smarter Lunchroom adherence in school cafés | 2 y (2014–2016)
|
|
| 3 | Bhatia et al., 2011 [44] | Before-after Pilot 2 y (2008–2010) | USA, San Francisco, California | 3 schools: 1 middle school, 2 high schools; 1 intervention Demographic data: enrolment across all schools, n = 4304; student age NR | To examine the impact of removing competitive a la carte lunch offerings and providing greater diversity of meal offerings for all students, on NSLP participation rates | 5 m (January–May 2010)
|
|
| 4 | Boehm et al., 2020 [96] | Controlled before-after (random allocation of schools) Pilot 9 m (September 2013–May 2014) | USA, Northeast USA, urban area | 3 high schools; 2 interventions 2 I-schools: (1) Choices school, n = 1177 enrolled students, (2) Nudging school, n = 2140 enrolled students 1 C-school: n = 1297 enrolled students Demographics: student age NR; ethnic diversity (NS differences across schools); >95% students eligible for FRP meals, therefore free meals provided to all students | To compare federally reimbursable meals served when competitive foods are removed and when marketing and nudging strategies are used in school cafeteria operating the NSLP | 4 w (April–May 2014)
|
|
| 5 | Bogart et al., 2011 [109] | Controlled before-after (non-random allocation of schools) Pilot 15 w (dates NR) | USA Los Angeles, California | 2 middle schools, 1 intervention 1 I-school, 1 C-school Similar demographic data for ethnicity and 77% students eligible for FRP lunch I-school: n = 399 7th grade students completed pre and post surveys (50% female, mean age 13, SD 0.5); n = 140 7th grade student advocates; enrolled students or student sample size NR | To pilot a community-based intervention for adolescents, Students for Nutrition and eXercise (SNaX) to translate school obesity-prevention policies into practice through peer leader advocacy of healthy eating and school cafeteria changes | 5 w (dates NR)
|
|
| 6 | Bogart et al., 2014 [88] | Cluster randomised trial (controlled) 3.5 y (January 2009–June 2012) | USA Los Angeles, California | 10 middle schools, 1 intervention Similar demographic data for ethnicity; >83% students eligible for FRP lunch; student age and gender NR 5 I-schools, n = 1515 mean number of students enrolled per school (SD = 323) 5 C-schools, n = 1524 mean number of students enrolled per school (SD = 266) n = 2997 7th grade students from I-school completed B and FU surveys | To conduct an RCT of SNaX, and examine effect on cafeteria participation, student eating behaviours and cafeteria attitudes | 5 w per school (during spring semester each y; January to June)
|
|
| 7 | Bogart et al., 2018 [110] | Cluster non-randomised trial (controlled) 2 y (2013–2015) | USA Los Angeles, California | 65 middle schools, 1 intervention n = 17 I-schools, n = 22311 enrolled students, 70% students in NSLP; n = 47 C-schools, n = 56,120 enrolled students, 86% students in NSLP n = 242 student advocates at end of I-year (student grade NR) n = 187 students completed student advocate surveys n = 154 student advocates participated in post-I focus groups | To disseminate an evidence-based middle-school obesity-prevention program, SNaX | 5 w per school (1 y across all schools; 2014–2015)
|
|
| 8 | Chu et al., 2011 [118] | Non-randomised trial (controlled, crossover) 1 y (spring and fall semesters 2009) | USA, Minnesota, Texas, urban and suburban areas | 5 schools, 2 interventions 3 middle schools (1 Minnesota, 2 Texas), 2 high schools (1 Minnesota, 1 Texas) Demographics: Hispanic students, Texas range 25.7% to 54.5%, Minnesota range 1.4% to 35.6%; non-Hispanic, Texas range 1.7% to 47.3%, Minnesota range 26% to 94.7%; students eligible for FRP meals, range 30.5% to 100% across all schools; student age not reported | To compare student acceptance of whole-wheat vs. refined tortillas in school meals according to sensory attribute ratings | 30 w (2 school semesters, 2009)
|
|
| 9 | Cohen et al. 2012 [89] 2013 [119] | Cluster non-randomised trial (controlled, parallel arm) Pilot 2 y (2007–2009) | USA, MA, Boston | 4 middle schools, 1 intervention 2 I-schools: 88% eligible for FRP meals, 78% participation in NSLP, n = 1609 student participants 2 C-schools, 86% eligible for FRP meals, 70% participation in NSLP, n = 1440 student participants Students in grades 6–8, most aged 12–14 years | 2012: To evaluate the impact of chef-based model on student’s selection and consumption of school lunches 2013: To assess the impact of food waste on nutrient consumption, if school foods served could be valid proxies for food consumed, and costs associated with food waste | 2 y (2007–2009)
|
|
| 10 | Cullen et al., 2007 [114] | Before-after Pilot 1 y (spring 2003–spring 2004) | USA, California, North Carolina, Texas | 6 middle schools, 1 intervention 2 California, n = 2873 students 2 North Carolina, n = 1565 students 2 Texas, n = 1810 students Student age NR; baseline differences in ethnicity and eligibility for FRP meals (range, 55–97%) between schools | To examine the feasibility of instituting school food environment changes during a 6-week pilot in school foodservice programs | 6 w (winter/spring 2004)
|
|
| 11 | Cullen et al., 2008 [103] Mendoza et al., 2010 [104] | Before-after 5 y (2001–2006) | USA, Texas | 3 middle schools, 1 intervention Students in grades 6–8; n = 2690 enrolled students across all schools (2001–2002 school year), and n = 3306 (2005–2006 school year) FRP eligibility, range 26–68% in 2001–2002, and 38–75% in 2005–2006 | To assess the effect of the Texas Public School Nutrition Policy on middle school student lunchtime food consumption | 2 y (2004–2006)
|
|
| 12 | Cullen et al., 2015 [90] | Cluster randomised trial (controlled, parallel arm) Pilot 15 w (fall 2011) | USA, TX, Houston | 4 intermediate schools, 1 intervention 2 I-schools, 2 C-schools Student age or enrolment numbers NR; Sample size for observations, n = 427 students (I-schools, n = 212; C-schools, n = 215) | To investigate changes in student food selection and consumption in response to the new NSLP meal patterns during fall 2011 | 15 w (fall 2011)
|
|
| 13 | D’Adamo et al., 2021 [113] | Non-randomised trial (controlled, crossover) 2 y (dates NR) | USA, Maryland, Baltimore, urban area | 1 high school, 1 intervention I-group (herbs and spices), C-group (typical recipe) n = 273 enrolled students Demographics: 57% female, African American 76% Hispanic 10%, ≥2 races 10%, White 4%, Asian < 1%, 100% eligible for FRP meals All students provided lunch trays for veg plate waste assessment | To determine whether stakeholder-informed addition of spices and herbs to NSLP veg would increase intake | 4 school semesters (dates NR)
|
|
| 14 | Elbel et al., 2015 [107] | Cluster non-randomised trial (controlled) 11 m (November 2010–September 2011) | USA, New York, NYC | 17 schools (includes elementary, middle and high schools; split between school type unknown), 1 intervention 8 I-schools, 9 C-schools I-schools: n = 1091 mean number of students/school, 55% female, 54% eligible for FRP meals, 21% African American, 41% Hispanic, 25% White, 11% Asian C-schools: n = 1175 mean number of students/school, 52% female, 47.1% eligible for FRP meals, 13% African American, 33% Hispanic, 33% White, 20% Asian Sub-set of larger study separated survey data for middle and high school (8th and 11th grade; n = 1759 students). | To determine the influence of water-jets on observed water and milk taking and self-reported fluid consumption in NYC public schools | 10 m (December 2010–September 2011)
|
|
| 15 | Ellison et al. 1989 a [115] 1989 b [100] 1990 [116] | Controlled before-after (non-randomised) 4 y (1984–1988) | USA, NH and MA | 2 boarding high schools, 2 interventions (phase 1 and 2) Student mean age 15 years, almost none obese, 77% white 1989a: Sodium intake from food diary assessment, at B n = 674 (I-group n = 340, C-group n = 334), at FU n = 431 (I-group n = 221, C-group n = 210); 1700 ballots for food acceptability rating 1989b: BP assessment, n = 650 students (I-group n = 309, C-group n = 341) 1990: Fat intake from food diary assessment, at B n = 774 (I-group n = 389, C-group n = 385), at FU n = 467 (I-group n = 228, C-group n = 239) | To measure the effects of changes in food purchasing and preparation practices on student acceptability of modified foods, sodium and fat intake, and BP | 6 m/phase (phase 1: reduced sodium; phase 2: modified fat; years unclear)
|
|
| 16 | Fritts et al., 2019 [120] | Phase 1: Non-randomised trial (controlled, crossover) Phase 2: Before-after 10 m (March–December 2017) | USA, Pennsylvania, rural area | 1 middle/high school, 2 interventions (phase 1 and 2) I-group (herb and spice veg), C-group (lightly salted veg); approx. 75% students participate in the NSLP, and 44% received FRP lunch; 600–700 students aged 11–18 years were served lunch daily across 3 lunch periods School district demographics: 97% Caucasian | To test whether adding herbs and spices to school lunch veg increases selection and consumption compared with lightly salted veg among rural adolescents | 10 m (March–December 2017)
|
|
| 17 | Greene et al., 2017 [91] | Cluster randomised trial (controlled) 9 w (February–April 2014) | USA, New York, urban and rural districts | 7 middle schools, 1 intervention 4 I-schools (2 urban, 2 rural) and 3 C-schools (2 urban, 1 rural) I-schools: n = 1258 enrolled students, 1–97% white, 55–92% economic disadvantage C-schools: n = 850 enrolled students, 5–90% white, 49–92% economic disadvantage All students in grades 5–8, age NR | To evaluate the impact of fruit-promoting Smarter Lunchroom interventions on middle school students’ selection and consumption of fruit | 6 w (March–April 2014)
|
|
| 18 | Hackett et al., 1990 [121] | Controlled before-after (non-randomised) 1 y (July 1987–July 1988) | UK, Northum-berland county | 4 middle schools, 2 interventions 2 ‘dish of day free-choice’ I-schools; 2 ‘2 course fixed price’ I-schools 2 ‘affluent’ and 2 ‘less well-off’ schools (each allocated 1 free-choice I-school and 1 fixed-price I-school); Approx. n = 830 students aged 11–12 years across all schools Completion of surveys with school meal participation data: survey 1, n = 674 (n = 301 from free-choice I-schools, n = 373 from fixed-price I-schools); survey 2, n = 692 students (n = 333 from free-choice I-schools, n = 359 from fixed-price I-schools) | To improve the quality of school meals and their up-take via a healthy eating campaign | 10 m (October–December 1987)
|
|
| 19 | Hanks et al., 2012 [122] | Before-after 4 m (February–May 2011) | USA, New York, Corning | 1 high school, 1 intervention | To examine the application of the principle that healthier foods are more likely to be consumed if they were more convenient than less convenient less healthy foods | 2 m (April–May 2011)
|
|
| 20 | Hanks et al., 2013 [97] | Before-after Pilot 4 m (March–June 2011) | USA, New York | 2 high schools, 1 intervention Grades 7–12, student numbers, age and other demographics NR | To investigate how small changes to school cafeterias can influence the choice and consumption of healthy foods | 2 m (May–June 2011)
|
|
| 21 | Hunsberger et al., 2015 [123] | Before-after 4 m (January–April 2010) | USA, Oregon, rural area | 1 middle school, 1 intervention Students in grades 6–8, aged 11–15 years, 64.6% of ethnic minority, 32.5% have BMI >95th percentile (obese), 79% eligible for FRP meals, n = 531 average number of students/day that participated in the NSLP (78%) during study period | To investigate the impact of POS calorie information | 17 d (February 2010)
|
|
| 22 | Just et al., 2014 [93] | Before-after Pilot 3 m (February–April 2012) | USA, New York | 1 high school, 1 intervention n = 370 enrolled students, aged 13–18 years; School district demographics: ethnicity primarily white (93.9%), eligibility for FRP meals 19.8% | To conduct a pilot test to gauge the feasibility of the Chef Moves To School program, and measure student response through lunch selection and consumption | 2 d (April 2012)
|
|
| 23 | Koch et al., 2020 [124] | Before-after 2 y (2017–2018) | USA, New York City, NY | 7 high schools, 1 intervention All students eligible to participate; n = 5719 enrolled students across all schools, 74% eligible for FRP lunch, age NR | To measure the effects of major changes to school cafeterias (STARCafe) on school lunch consumption and factors that may influence consumption (i.e., seated time, attitudes towards school lunch, perception of cafeteria noise, school lunch participation) | 1 y per school (2017–2018)
|
|
| 24 | Madden et al., 2013 [105] | Before-after 3 w (2005) | UK, London | 1 secondary school, 1 intervention Student participants aged 12–16 years, n = 378 lunch observations, pre-I n = 180 (38.9% female), post-I n = 198 (26.3% female) 63% students eligible for free school lunch | To examine the effect of a short, low-budget kitchen-based intervention on energy, nutrient, and fruit and veg intakes | 1 w (2005)
|
|
| 25 | McCool et al., 2005 [108] | Non-randomised trial (controlled, crossover) Pilot 12 w (dates NR) | USA, metropolitan area | 1 middle school, 3 interventions (phase 1–3) Enrolled students, n = 1234, age NR, 87.4% eligible for FRP meals | To compare the amount of apple consumed by students when they were offered whole versus sliced ready-to-eat packaged apples | 12 w (dates NR; phase 1 = 6 weeks, phase 2 = 4 weeks, phase 3 = 2 weeks)
|
|
| 26 | Pope et al., 2018 [94] | Before-after Pilot 3 m (September–November 2015) | USA, Vermont, rural area | 1 middle school, 1 intervention n = 587 eligible students in grades 4–8 eligible to participate; average NSLP participation rate = 66% Student age NR; numbers who participated in taste-testing NR | To investigate whether providing samples of a veg-focused lunch entrée the day before it appeared on the lunch menu ↑ NSLP participation | 1 m (October 2015)
|
|
| 27 | Prell et al., 2005 [101] | Controlled before-after (randomised) 5 w (1998–1999 school year) | Sweden, Göteborg | 3 secondary schools: 2 interventions (1) C-group, no intervention, n = 83 students (63% participation) (2) SL-group (school lunch intervention), n = 58 students (51% participation) Grade 8, aged approx. 14 years (3) SLHE-group (SL + home economics intervention), n = 87 students (60% participation) | To examine the effectiveness of 2 school-based interventions aimed at increasing adolescents’ intake of fish at school | 5 w
|
|
| 28 | Prescott et al., 2019 [99] | Controlled before-after (non-random allocation of schools) 6 m (November 2017–April 2018) | USA, Colorado | 2 middle schools, 1 intervention (1) I-group (poster + education), n = 268 grade 6 students across 2 schools (2) C-group (poster only), n = 426 students in grades 7–8 across 2 schools | To examine the impact of a student-driven sustainable food systems education and promotion intervention on adolescent school lunch selection, consumption and waste behaviours, particularly for fruit and veg, during school lunch | 12–16 classes (from December 2017) + 2 weeks (April 2018)
|
|
| 29 | Quinn et al., 2018 [98] | Controlled before-after (non-random allocation of schools) 1 y (2013–2014 school year) | USA, Washington, King County | 11 schools, 1 intervention 6 I-schools (3 middle and 3 high schools; n = 1026 mean number students enrolled per school), 5 C-schools (3 middle and 2 high schools; n = 1219 mean number students per school) n = 2309 tray observations across all schools and time points Student age not reported | To evaluate whether a year-long choice architecture intervention implemented by school cafeteria managers changed student selection and consumption of healthy foods | 1 y (2013–2014)
|
|
| 30 | Schwartz et al., 2015 [92] | Before-after 3 y (2012–2014) | USA, Connecticut, New Haven, low-income urban area | 12 middle schools, 1 intervention Approx. n = 680 enrolled students in grade 5 (all schools); Sample population followed over 3 years, n = 502 in grade 5 (2012), n = 465 in grade 6 (2013) and n = 373 in grade 7 (2014) School district demographics: >70% eligible for free-lunch, 13% for reduced-price; 47% African American, 38% Hispanic, 15% white | To examine food component selection and consumption data pre- and post- revisions to the NSLP nutrition standards and policies | 2 y (2012–2014)
|
|
| 31 | Sharma et al., 2018 [106] | Non-randomised trial (controlled, parallel arm) 4 w (November–December, y NR) | USA | 1 middle-high school, 1 intervention I-group, 1 fast service lane (FSL) C-group, 2 regular service lanes (RSL) Approx. n = 650 enrolled students in grades 6–12 | To investigate whether middle and high school students are averse to loss of time and to assess feasibility of a fast food service lane intervention that would serve limited choices of pre-plated lunch meals | 4 w (November–December, year NR)
|
|
| 32 | Turnin et al., 2016 [112] | Before-after 1 y (dates NR) | France, Toulouse, suburban and urban areas | 3 middle schools (1 suburban, 2 urban), 1 intervention n = 350 students for analysis, mean age 13.3 years (range, 11.5 to 16.4 years) School A, B and C; n = 84, 88 and 178 students respectively | To evaluate the impact of interactive Nutri-Advice kiosks on children’s nutritional skills and their ability to apply it to food choices in a middle school cafeteria menu (food choice competencies) | 6 m (November–May, year NR)
|
|
| 33 | Wansink et al., 2015 [95] | Before-after Pilot 2 m (March–April 2012) | USA, New York, Lansing | 1 high school, 1 intervention n = 370 enrolled students in grades 9–12; age not reported School district demographics: 93.9% white, 2% African American; 19% students eligible for FRP lunch | To examine the potential impact that a school garden intervention, independent of corresponding educational materials, has on students veg selection and intake | 1 d (24 April 2012)
|
|
| 34 | Wansink et al., 2013 [111] | Cluster randomised trial (controlled) Duration unclear (2011) | USA, New York, Wayne County | 6 middle schools, 1 intervention 3 I-schools, 3 C-schools n = 2150 enrolled students across all schools | To determine the effect of offering pre-sliced fruit in schools on selection and intake | 1 m (November 2011)
|
|
| 35 | Witschi et al. 1985 [125] | Before-after Pilot 9 w (Oct-Nov 1982) | USA, New Hampshire | 1 boarding high school, 1 intervention Approx. n = 1000 enrolled students; To monitor sodium intake: n = 228 students aged 15–18 years Palatability survey responses: n = 1036 (pre-I) and 748 (during-I) | To test the effects of dietary modification on total sodium intake of students and assess palatability for adolescents | 5 w (October–November 1982)
|
|
| Domain * | Action Areas * | Sub-Action Areas Relevant to the Current Review * | Classification of Intervention Strategies from Included Studies | |
|---|---|---|---|---|
| Food environment | N | Nutrition label standards and regulations on use of claims and implied claims on food |
|
|
| O | Offer healthy food and set standards in public institutions and other specific settings |
|
| |
| U | Use economic tools to address food affordability and purchase incentives |
|
| |
| R | Restrict food advertising and other forms of commercial promotion |
|
| |
| I | Improve nutritional quality of the whole food supply |
|
| |
| S | Set incentives and rules to create a healthy retail and food service environment |
|
| |
| Food system | H | Harness food supply chain and actions across sectors to ensure coherence with health |
|
|
| Behaviour change communication | I | Inform people about food and nutrition through public awareness |
|
|
| N | Nutrition advice and counselling in health care settings |
|
| |
| G | Give nutrition education and skills |
|
| |
| Food Environment | Food System | Behavior Change Communication | |||||||
|---|---|---|---|---|---|---|---|---|---|
| N | O | U | I | S | H | I | G | ||
| Author | Number of Action Areas Targeted | Nutrition Label Standards and Regulations on Use of Claims and Implied Claims on Food | Offer Healthy Food and Set Standards in Public Institutions or Other Settings | Use Economic Tools to Address Food Affordability and Purchase Incentives | Improve Nutritional Quality of the Whole Food Supply | Set Incentives and Rules to Create a Healthy Retail and Food Service Environment | Harness Food Supply Chain and Actions Across Sectors to Ensure Coherence with Health | Inform People about Food and Nutrition through Public Awareness | Give Nutrition Education and Skills |
| Interventions that include strategies across three domains: | |||||||||
| Bhatia et al., 2011 [44] | 6 | • | • | • | • | • | • | ||
| Bogart et al., 2011 [109] | 6 | • | • | • | • | • | • | ||
| Bogart et al., 2014 [88] | 6 | • | • | • | • | • | • | ||
| Bogart et al., 2018 [110] | 6 | • | • | • | • | • | • | ||
| Askelson et al., 2019 [117] | 5 | • | • | • | • | • | |||
| Greene et al., 2017 [91] | 5 | • | • | • | • | • | |||
| Madden et al., 2013 [105] | 5 | • | • | • | • | • | |||
| Prell et al., 2005 1. SL [101] | 5 | • | • | • | • | • | |||
| Prell et al., 2005 2. SLHE [101] | 5 | • | • | • | • | • | |||
| Quinn et al., 2018 [98] | 5 | • | • | • | • | • | |||
| Fritts et al., 2019 1. Phase 1 [120] | 4 | • | • | • | • | ||||
| Fritts et al., 2019 2. Phase 2 [120] | 4 | • | • | • | • | ||||
| Hanks et al., 2013 [97] | 4 | • | • | • | • | ||||
| Koch et al., 2020 [124] | 4 | • | • | • | • | ||||
| Pope et al., 2018 [94] | 4 | • | • | • | • | ||||
| Prescott et al., 2019 [99] | 4 | • | • | • | • | ||||
| Wansink et al., 2015 [95] | 4 | • | • | • | • | ||||
| Cullen et al., 2007 [114] | 3 | • | • | • | |||||
| D’Adamo et al., 2021 [113] | 3 | • | • | • | |||||
| Ellison et al., 1989a [115], 1989b [100] | 3 | • | • | • | |||||
| Ellison et al., 1990 [116] | 3 | • | • | • | |||||
| Just et al., 2014 [93] | 3 | • | • | • | |||||
| Interventions that include strategies across two domains: | |||||||||
| Bean et al., 2019 [102] | 4 | • | • | • | • | ||||
| Boehm et al., 2020 2. Nudges [96] | 3 | • | • | • | |||||
| Hackett et al., 1990 2. Fixed price [121] | 3 | • | • | • | |||||
| Sharma et al., 2018 [106] | 3 | • | • | • | |||||
| Chu et al., 2011 1. 66% wholewheat [118] | 2 | • | • | ||||||
| Chu et al., 2011 2. 100% wholewheat [118] | 2 | • | • | ||||||
| Cohen et al., 2012 [89], 2013 [119] | 2 | • | • | ||||||
| Cullen et al., 2015 [90] | 2 | • | • | ||||||
| Hackett et al., 1990 1. Dish of day [121] | 2 | • | • | ||||||
| Witschi et al., 1982 [125] | 2 | • | • | ||||||
| Interventions that include a strategy or strategies in one domain only: | |||||||||
| McCool et al., 2005 1. Phase 2 vs. 1 [108] | 3 | • | • | • | |||||
| McCool et al., 2005 2. Phase 3 [108] | 3 | • | • | • | |||||
| Elbel et al., 2015 [107] | 2 | • | • | ||||||
| Hanks et al., 2012 [122] | 2 | • | • | ||||||
| Boehm et al., 2020 1. Choices [96] | 1 | • | |||||||
| Cullen et al., 2008 [103]; Mendoza et al., 2010 [104] | 1 | • | |||||||
| Hunsberger et al., 2015 [123] | 1 | • | |||||||
| Schwartz et al., 2015 [92] | 1 | • | |||||||
| Turnin et al., 2016 [112] | 1 | • | |||||||
| Wansink et al., 2013 [111] | 1 | • | |||||||
| 3 | 26 | 4 | 19 | 21 | 25 | 22 | 18 | ||
| Outcome Domain | Interventions, n | Positive Impact, n (%) | Negative Impact, n | No Change or Mixed Effects | Sign Test, p-Value * | 95% CI ** | |
|---|---|---|---|---|---|---|---|
| Selection of a meal component | |||||||
| Study quality | Positive rating | 8 | 5 (63%) | 0 | 3 | 0.063 | 31% to 86% |
| Neutral rating | 17 | 10 (59%) | 2 | 5 | 0.039 | 36% to 78% | |
| Study design | Pre-post assessment | 22 | 15 (68%) | 2 | 5 | 0.002 | 47% to 84% |
| Parallel arm or crossover | 3 | 0 (0%) | 0 | 3 | NA | NA | |
| Intervention duration | ≤2 months | 15 | 12 (80%) | 1 | 2 | 0.003 | 55% to 93% |
| 3+ months | 10 | 3 (30%) | 1 | 6 | 0.625 | 11% to 60% | |
| NOURISHING domains | Three domains | 15 | 10 (67%) | 1 | 4 | 0.012 | 42% to 85% |
| One or two domains | 10 | 5 (50%) | 1 | 4 | 0.219 | 24% to 76% | |
| NOURISHING action areas | Three to six action areas | 16 | 11 (69%) | 1 | 4 | 0.006 | 44% to 86% |
| One to two action areas | 9 | 4 (44%) | 1 | 4 | 0.375 | 19% to 73% | |
| Stakeholder engagement | Student engagement | 9 | 7 (78%) | 0 | 2 | 0.016 | 45% to 94% |
| Without | 16 | 8 (50%) | 2 | 6 | 0.109 | 28% to 72% | |
| Behaviour change communication | Promotion and/or training | 18 | 11 (61%) | 1 | 6 | 0.006 | 39% to 80% |
| Without | 7 | 4 (57%) | 1 | 2 | 0.375 | 25% to 84% | |
| Consumption of a meal component | |||||||
| Study quality | Positive rating | 3 | 0 (0%) | 0 | 3 | NA | NA |
| Neutral rating | 21 | 14 (67%) | 3 | 4 | 0.013 | 45% to 83% | |
| Study design | Pre-post assessment | 18 | 11 (61%) | 2 | 5 | 0.022 | 39% to 80% |
| Parallel arm or crossover | 6 | 3 (50%) | 1 | 2 | 0.625 | 19% to 81% | |
| Intervention duration | ≤2 months | 13 | 8 (62%) | 2 | 3 | 0.109 | 36% to 82% |
| 3+ months | 11 | 6 (55%) | 1 | 4 | 0.125 | 28% to 79% | |
| NOURISHING domains | Three domains | 15 | 9 (60%) | 2 | 4 | 0.065 | 36% to 80% |
| One or two domains | 9 | 5 (56%) | 1 | 3 | 0.219 | 27% to 81% | |
| NOURISHING action areas | Three to six action areas | 17 | 11 (65%) | 2 | 4 | 0.022 | 41% to 83% |
| One to two action areas | 7 | 3 (43%) | 1 | 3 | 0.625 | 16% to 75% | |
| Stakeholder engagement | Student engagement | 6 | 5 (83%) | 0 | 1 | 0.063 | 44% to 97% |
| Without | 18 | 9 (50%) | 3 | 6 | 0.146 | 29% to 71% | |
| Behaviour change communication | Promotion and/or training | 17 | 9 (53%) | 2 | 6 | 0.065 | 31% to 74% |
| Without | 7 | 5 (71%) | 1 | 1 | 0.219 | 36% to 92% | |
| Meal program participation rate | |||||||
| Study quality | Positive rating | 0 | 0 (0%) | 0 | 0 | NA | NA |
| Neutral rating | 5 | 3 (60%) | 2 | 0 | NA | 23% to 88% | |
| Study design | Pre-post assessment | 5 | 3 (60%) | 2 | 0 | NA | 23% to 88% |
| Parallel arm or crossover | 0 | 0 (0%) | 0 | 0 | NA | NA | |
| Intervention duration | ≤2 months | 1 | 1 (100%) | 0 | 0 | NA | NA |
| 3+ months | 4 | 2 (50%) | 2 | 0 | NA | 15% to 85% | |
| NOURISHING domains | Three domains | 3 | 3 (100%) | 0 | 0 | 0.250 | 44% to 100% |
| One or two domains | 2 | 0 (0%) | 2 | 0 | NA | 0% to 66% | |
| NOURISHING action areas | Three to six action areas | 4 | 3 (75%) | 1 | 0 | 0.625 | 30% to 95% |
| One to two action areas | 1 | 0 (0%) | 1 | 0 | NA | NA | |
| Stakeholder engagement | Student engagement | 2 | 2 (100%) | 0 | 0 | 0.500 | 34% to 100% |
| Without | 3 | 1 (33%) | 2 | 0 | NA | 6% to 79% | |
| Behaviour change communication | Promotion and/or training | 5 | 3 (60%) | 2 | 0 | NA | 23% to 88% |
| Without | 0 | 0 (0%) | 0 | 0 | NA | NA | |
| Attitudes and perceptions related to changes to the meal service | |||||||
| Study quality | Positive rating | 3 | 3 (100%) | 0 | 0 | 0.250 | 44% to 100% |
| Neutral rating | 10 | 6 (60%) | 4 | 0 | 0.754 | 31% to 83% | |
| Study design | Pre-post assessment | 9 | 8 (89%) | 1 | 0 | 0.039 | 57% to 98% |
| Parallel arm or crossover | 4 | 1 (25%) | 3 | 0 | 0.625 | 5% to 70% | |
| Intervention duration | ≤2 months | 4 | 4 (100%) | 0 | 0 | 0.125 | 51% to 100% |
| 3+ months | 9 | 5 (56%) | 4 | 0 | NA | 27% to 81% | |
| NOURISHING domains | Three domains | 8 | 6 (75%) | 2 | 0 | 0.289 | 41% to 93% |
| One or two domains | 5 | 3 (60%) | 2 | 0 | NA | 23% to 88% | |
| NOURISHING action areas | Three to six action areas | 9 | 7 (78%) | 2 | 0 | 0.180 | 45% to 94% |
| One to two action areas | 4 | 2 (50%) | 2 | 0 | NA | 15% to 85% | |
| Stakeholder engagement | Student engagement | 3 | 3 (100%) | 0 | 0 | 0.250 | 44% to 100% |
| Without | 10 | 6 (60%) | 4 | 0 | 0.754 | 31% to 83% | |
| Behaviour change communication | Promotion and/or training | 9 | 7 (78%) | 2 | 0 | 0.180 | 45% to 94% |
| Without | 4 | 2 (50%) | 2 | 0 | NA | 15% to 85% | |
4. Discussion
4.1. Interpretation of Results
4.2. Limitations
4.3. Implications
- Engage the stakeholders who prepare the food (food service staff) and consume the food (adolescent students) through formative research, program development and/or implementation; recruit peer advocates to act as change agents;
- Explore novel approaches in the school dining room such as integrating technology which now forms part of adolescents daily lives;
- Ensure nutritional quality of school menus alongside assessment of palatability; they must go hand in hand to increase consumption, reduce waste, and improve students’ diet quality. Allow students to sample modified foods, and if feasible, engage experts in the field of food and nutrition (dietitians, school nutrition specialists or professional chefs) to inform recipe or menu reformulation;
- Healthy options must be accessible (front and centre), visually appealing (showcase them), and fast to access because time allowed for lunch at school is limited;
- Restrict the availability and portion size of less healthy options. Students can only make decisions based on the options placed in front of them;
- Include marketing strategies and positive health messaging to engage adolescents and promote positive changes to the meal service;
- Use short-and longer-term evaluations to monitor progress and build sustained change;
- Measure selection and consumption of meal components to assess intake and waste.
5. Conclusions
Supplementary Materials
Author Contributions
Funding
Institutional Review Board Statement
Informed Consent Statement
Data Availability Statement
Acknowledgments
Conflicts of Interest
References
- GBD 2017 Diet Collaborators. Health effects of dietary risks in 195 countries, 1990–2017: A systematic analysis for the Global Burden of Disease Study 2017. Lancet 2019, 393, 1958–1972. [Google Scholar] [CrossRef]
- Christoph, M.J.; Larson, N.I.; Winkler, M.R.; Wall, M.M.; Neumark-Sztainer, D. Longitudinal trajectories and prevalence of meeting dietary guidelines during the transition from adolescence to young adulthood. Am. J. Clin. Nutr. 2019, 109, 656–664. [Google Scholar] [CrossRef] [PubMed]
- Craigie, A.M.; Lake, A.A.; Kelly, S.A.; Adamson, A.J.; Mathers, J.C. Tracking of obesity-related behaviours from childhood to adulthood: A systematic review. Maturitas 2011, 70, 266–284. [Google Scholar] [CrossRef]
- Cruz, F.; Ramos, E.; Lopes, C.; Araujo, J. Tracking of food and nutrient intake from adolescence into early adulthood. Nutrition 2018, 55, 84–90. [Google Scholar] [CrossRef]
- Movassagh, E.Z.; Baxter-Jones, A.D.G.; Kontulainen, S.; Whiting, S.J.; Vatanparast, H. Tracking dietary patterns over 20 years from childhood through adolescence into young adulthood: The Saskatchewan Pediatric Bone Mineral Accrual Study. Nutrients 2017, 9, 990. [Google Scholar] [CrossRef]
- Winpenny, E.M.; van Sluijs, E.M.F.; White, M.; Klepp, K.I.; Wold, B.; Lien, N. Changes in diet through adolescence and early adulthood: Longitudinal trajectories and association with key life transitions. Int. J. Behav. Nutr. Phys. Act. 2018, 15, 86. [Google Scholar] [CrossRef] [PubMed]
- Robinson, S.M.; Crozier, S.R.; Harvey, N.C.; Barton, B.D.; Law, C.M.; Godfrey, K.M.; Cooper, C.; Inskip, H.M. Modifiable early-life risk factors for childhood adiposity and overweight: An analysis of their combined impact and potential for prevention. Am. J. Clin. Nutr. 2015, 101, 368–375. [Google Scholar] [CrossRef]
- Loth, K.A.; MacLehose, R.; Bucchianeri, M.; Crow, S.; Neumark-Sztainer, D. Predictors of dieting and disordered eating behaviors from adolescence to young adulthood. J. Adolesc. Health 2014, 55, 705–712. [Google Scholar] [CrossRef] [PubMed]
- Neumark-Sztainer, D.; Wall, M.; Larson, N.I.; Eisenberg, M.E.; Loth, K. Dieting and disordered eating behaviors from adolescence to young adulthood: Findings from a 10-year longitudinal study. J. Am. Diet Assoc. 2011, 111, 1004–1011. [Google Scholar] [CrossRef]
- Yip, C.S.C.; Chan, W.; Fielding, R. The Associations of Fruit and Vegetable Intakes with Burden of Diseases: A Systematic Review of Meta-Analyses. J. Acad. Nutr. Diet 2019, 119, 464–481. [Google Scholar] [CrossRef]
- Albani, V.; Butler, L.T.; Traill, W.B.; Kennedy, O.B. Fruit and vegetable intake: Change with age across childhood and adolescence. Br. J. Nutr. 2017, 117, 759–765. [Google Scholar] [CrossRef]
- Australian Institute of Health and Welfare. Australia’s Children; Cat. no. CWS 69; Australian Institute of Health and Welfare: Canberra, Australia, 2020. [Google Scholar]
- Wambogo, E.A.; Ansai, N.; Ahluwalia, N.; Ogden, C.L. Fruit and Vegetable Consumption of Children and Adolescents in the United States, 2015–2018; NCHS Data Brief, no 391; National Center for Health Statistics: Hyattsville, MD, USA, 2020.
- Lange, S.J.; Moore, L.V.; Harris, D.M.; Merlo, C.L.; Hee Lee, S.; Demissie, Z.; Galuska, D.A. Percentage of Adolescents Meeting Federal Fruit and Vegetable Intake Recommendations: Youth Risk Behavior Surveillance System, United States, 2017; Center for Disease Control and Prevention Morbidity and Mortality Weekly Report (MMWR): Atlanta, GA, USA, 2021; Volume 70, pp. 69–74.
- Neufeld, L.M.; Andrade, E.B.; Ballonoff Suleiman, A.; Barker, M.; Beal, T.; Blum, L.S.; Demmler, K.M.; Dogra, S.; Hardy-Johnson, P.; Lahiri, A.; et al. Food choice in transition: Adolescent autonomy, agency, and the food environment. Lancet 2022, 399, 185–197. [Google Scholar] [CrossRef]
- Kupka, R.; Siekmans, K.; Beal, T. The diets of children: Overview of available data for children and adolescents. Glob Food Sec. 2020, 27, 100442. [Google Scholar] [CrossRef]
- Azzopardi, P.S.; Hearps, S.J.C.; Francis, K.L.; Kennedy, E.C.; Mokdad, A.H.; Kassebaum, N.J.; Lim, S.; Irvine, C.M.S.; Vos, T.; Brown, A.D.; et al. Progress in adolescent health and wellbeing: Tracking 12 headline indicators for 195 countries and territories, 1990–2016. Lancet 2019, 393, 1101–1118. [Google Scholar] [CrossRef]
- World Health Organization. Adolescent Health. Available online: https://www.who.int/health-topics/adolescent-health#tab=tab_1 (accessed on 27 September 2021).
- World Health Organization. Making Every School a Health Promoting School. Available online: https://www.who.int/initiatives/making-every-school-a-health-promoting-school (accessed on 27 September 2021).
- Patton, G.C.; Sawyer, S.M.; Santelli, J.S.; Ross, D.A.; Afifi, R.; Allen, N.B.; Arora, M.; Azzopardi, P.; Baldwin, W.; Bonell, C.; et al. Our future: A Lancet commission on adolescent health and wellbeing. Lancet 2016, 387, 2423–2478. [Google Scholar] [CrossRef]
- UNICEF. Adolescent Health and Wellbeing. Available online: https://www.unicef.org/health/adolescent-health-and-well-being (accessed on 20 September 2021).
- World Health Organization. Accelerated Action for the Health of Adolescents (AA-HA!): A Manual to Facilitate the Process of Developing National Adolescent Health Strategies and Plans; Licence: CC BY-NC-SA 3.0 IGO; World Health Organization: Geneva, Switzerland, 2019. [Google Scholar]
- Bundy, D.A.P.; de Silva, N.; Horton, S.; Patton, G.C.; Schultz, L.; Jamison, D.T.; Disease Control Priorities, C.; Adolescent, H.; Development Authors, G. Investment in child and adolescent health and development: Key messages from Disease Control Priorities, 3rd Edition. Lancet 2018, 391, 687–699. [Google Scholar] [CrossRef]
- Partnership for Maternal Newborn and Child Health (PMNCH). Adolescent Health: The Missing Population in Universal Health Coverage; World Health Organization: Geneva, Switzerland, 2019. [Google Scholar]
- World Health Organization. UNESCO and WHO Urge Countries to Make Every School a Health-Promoting School. Available online: https://www.who.int/news/item/22-06-2021-unesco-and-who-urge-countries-to-make-every-school-a-health-promoting-school (accessed on 27 September 2021).
- Food and Agriculture Organization of the United Nations. School Food and Nutrition. Available online: http://www.fao.org/school-food/areas-work/food-environment/en/ (accessed on 8 June 2021).
- Independent Schools Council. ISC Census and Annual Report 2021; Independent Schools Council: London, UK, 2021; pp. 1–52. [Google Scholar]
- Gov.UK. Academic Year 2021/22: Schools, Pupils and Their Characteristics. Available online: https://explore-education-statistics.service.gov.uk/find-statistics/school-pupils-and-their-characteristics (accessed on 25 August 2022).
- Independent Schools Australia. Independent Boarding Schools: Data Review 2011 to 2020; Independent Schools Australia: Deakin, ACT, Australia, 2021; pp. 1–24. [Google Scholar]
- The Association of Boarding Schools. Available online: https://www.boardingschools.com/ (accessed on 28 August 2022).
- U.S. Department of Agriculture Food and Nutrition Service. Program Information Report (Keydata) U.S. Summary, FY 2018 to FY 2019; October 2018; U.S. Department of Agriculture: Wahington, DC, USA, 2018.
- Briefel, R.R.; Crepinsek, M.K.; Cabili, C.; Wilson, A.; Gleason, P.M. School food environments and practices affect dietary behaviors of US public school children. J. Am. Diet Assoc. 2009, 109 (Suppl. 2), S91–S107. [Google Scholar] [CrossRef]
- Cullen, K.W.; Chen, T.A. The contribution of the USDA school breakfast and lunch program meals to student daily dietary intake. Prev. Med. Rep. 2017, 5, 82–85. [Google Scholar] [CrossRef]
- Agency for Food Environmental and Occupational Health and Safety (ANSES). School Meals. Available online: https://www.anses.fr/en/content/school-meals (accessed on 1 December 2021).
- Yoon, J.; Kwon, S.; Shim, J.E. Present status and issues of school nutrition programs in Korea. Asia Pac. J. Clin. Nutr. 2012, 21, 128–133. [Google Scholar]
- European Commission. School Food Policy Country Factsheets, Sweden. Available online: https://ec.europa.eu/jrc/sites/default/files/jrc-school-food-policy-factsheet-sweden_en.pdf (accessed on 1 December 2021).
- Pellikka, K.; Manninen, M.; Taivalmaa, S. School Meals for All. School Feeding: Investment in Effective Learning—Case Finland; Ministry for Foreign Affairs of Finland and Finnish National Agency for Education: Helsinki, Finland, 2019. [Google Scholar]
- Moffat, T.; Thrasher, D. School meal programs and their potential to operate as school-based obesity prevention and nutrition interventions: Case studies from France and Japan. Crit. Public Health 2016, 26, 133–146. [Google Scholar] [CrossRef]
- Cohen, J.F.W.; Hecht, A.A.; Hager, E.R.; Turner, L.; Burkholder, K.; Schwartz, M.B. Strategies to Improve School Meal Consumption: A Systematic Review. Nutrients 2021, 13, 3520. [Google Scholar] [CrossRef] [PubMed]
- Hanks, A.S.; Just, D.R.; Wansink, B. Trigger foods: The influence of “irrelevant” alternatives in school lunchrooms. Agric. Resour. Econ. Rev. 2012, 41, 114–123. [Google Scholar] [CrossRef]
- O’Brien, K.M.; Barnes, C.; Yoong, S.; Campbell, E.; Wyse, R.; Delaney, T.; Brown, A.; Stacey, F.; Davies, L.; Lorien, S.; et al. School-Based Nutrition Interventions in Children Aged 6 to 18 Years: An Umbrella Review of Systematic Reviews. Nutrients 2021, 13, 4113. [Google Scholar] [CrossRef] [PubMed]
- Cohen, J.F.W.; Hecht, A.A.; McLoughlin, G.M.; Turner, L.; Schwartz, M.B. Universal School Meals and Associations with Student Participation, Attendance, Academic Performance, Diet Quality, Food Security, and Body Mass Index: A Systematic Review. Nutrients 2021, 13, 911. [Google Scholar] [CrossRef] [PubMed]
- World Food Programme. State of School Feeding Worldwide 2020; World Food Programme: Rome, Italy, 2020. [Google Scholar]
- Bhatia, R.; Jones, P.; Reicker, Z. Competitive foods, discrimination, and participation in the National School Lunch Program. Am. J. Public Health 2011, 101, 1380–1386. [Google Scholar] [CrossRef] [PubMed]
- Gordon, K.; Dynan, L.; Siegel, R. Healthier Choices in School Cafeterias: A Systematic Review of Cafeteria Interventions. J. Pediatr. 2018, 203, 273–279. [Google Scholar] [CrossRef] [PubMed]
- Marcano-Olivier, M.I.; Horne, P.J.; Viktor, S.; Erjavec, M. Using Nudges to Promote Healthy Food Choices in the School Dining Room: A Systematic Review of Previous Investigations. J. Sch. Health 2020, 90, 143–157. [Google Scholar] [CrossRef] [PubMed]
- Metcalfe, J.J.; Ellison, B.; Hamdi, N.; Richardson, R.; Prescott, M.P. A systematic review of school meal nudge interventions to improve youth food behaviors. Int. J. Behav. Nutr. Phys. Act. 2020, 17, 77. [Google Scholar] [CrossRef]
- Micha, R.; Karageorgou, D.; Bakogianni, I.; Trichia, E.; Whitsel, L.P.; Story, M.; Penalvo, J.L.; Mozaffarian, D. Effectiveness of school food environment policies on children’s dietary behaviors: A systematic review and meta-analysis. PLoS ONE 2018, 13, e0194555. [Google Scholar] [CrossRef]
- Pineda, E.; Bascunan, J.; Sassi, F. Improving the school food environment for the prevention of childhood obesity: What works and what doesn’t. Obes. Rev. 2021, 22, e13176. [Google Scholar] [CrossRef]
- Broers, V.J.V.; De Breucker, C.; Van den Broucke, S.; Luminet, O. A systematic review and meta-analysis of the effectiveness of nudging to increase fruit and vegetable choice. Eur. J. Public Health 2017, 27, 912–920. [Google Scholar] [CrossRef] [Green Version]
- Hollands, G.J.; Carter, P.; Anwer, S.; King, S.E.; Jebb, S.A.; Ogilvie, D.; Shemilt, I.; Higgins, J.P.T.; Marteau, T.M. Altering the availability or proximity of food, alcohol, and tobacco products to change their selection and consumption. Cochrane Database Syst. Rev. 2019, 8, CD012573. [Google Scholar] [CrossRef]
- Shaw, A.M.; Wootton, S.A.; Fallowfield, J.L.; Allsopp, A.J.; Parsons, E.L. Environmental interventions to promote healthier eating and physical activity behaviours in institutions: A systematic review. Public Health Nutr. 2019, 22, 1518–1531. [Google Scholar] [CrossRef]
- Mandracchia, F.; Tarro, L.; Llaurado, E.; Valls, R.M.; Sola, R. Interventions to Promote Healthy Meals in Full-Service Restaurants and Canteens: A Systematic Review and Meta-Analysis. Nutrients 2021, 13, 1350. [Google Scholar] [CrossRef]
- Ortega, A.; Bejarano, C.M.; Cushing, C.C.; Staggs, V.S.; Papa, A.E.; Steel, C.; Shook, R.P.; Sullivan, D.K.; Couch, S.C.; Conway, T.L.; et al. Differences in adolescent activity and dietary behaviors across home, school, and other locations warrant location-specific intervention approaches. Int. J. Behav. Nutr. Phys. Act. 2020, 17, 123. [Google Scholar] [CrossRef]
- Higgins, J.P.T.; Thomas, J.; Chandler, J.; Cumpston, M.; Li, T.; Page, M.J.; Welch, V.A. Cochrane Handbook for Systematic Review of Interventions, 2nd ed.; John Wiley & Sons: Chichester, UK, 2019. [Google Scholar]
- Page, M.J.; McKenzie, J.E.; Bossuyt, P.M.; Boutron, I.; Hoffmann, T.C.; Mulrow, C.D.; Shamseer, L.; Tetzlaff, J.M.; Akl, E.A.; Brennan, S.E.; et al. The PRISMA 2020 statement: An updated guideline for reporting systematic reviews. BMJ 2021, 372, n71. [Google Scholar] [CrossRef]
- Byker Shanks, C.; Banna, J.; Serrano, E.L. Food Waste in the National School Lunch Program 1978–2015: A Systematic Review. J. Acad. Nutr. Diet 2017, 117, 1792–1807. [Google Scholar] [CrossRef]
- Calvert, S.; Dempsey, R.C.; Povey, R. Delivering in-school interventions to improve dietary behaviours amongst 11- to 16-year-olds: A systematic review. Obes. Rev. 2019, 20, 543–553. [Google Scholar] [CrossRef]
- DeCosta, P.; Moller, P.; Frost, M.B.; Olsen, A. Changing children’s eating behaviour—A review of experimental research. Appetite 2017, 113, 327–357. [Google Scholar] [CrossRef]
- Driessen, C.E.; Cameron, A.J.; Thornton, L.E.; Lai, S.K.; Barnett, L.M. Effect of changes to the school food environment on eating behaviours and/or body weight in children: A systematic review. Obes. Rev. 2014, 15, 968–982. [Google Scholar] [CrossRef]
- Mansfield, J.L.; Savaiano, D.A. Effect of school wellness policies and the Healthy, Hunger-Free Kids Act on food-consumption behaviors of students, 2006–2016: A systematic review. Nutr. Rev. 2017, 75, 533–552. [Google Scholar] [CrossRef] [PubMed]
- Nornberg, T.R.; Houlby, L.; Skov, L.R.; Perez-Cueto, F.J. Choice architecture interventions for increased vegetable intake and behaviour change in a school setting: A systematic review. Perspect. Public Health 2016, 136, 132–142. [Google Scholar] [CrossRef] [PubMed]
- Racey, M.; O’Brien, C.; Douglas, S.; Marquez, O.; Hendrie, G.; Newton, G. Systematic Review of School-Based Interventions to Modify Dietary Behavior: Does Intervention Intensity Impact Effectiveness? J. Sch. Health 2016, 86, 452–463. [Google Scholar] [CrossRef]
- EndNote, X9.3.3; Clarivate: Philadelphia, PA, USA, 2021.
- Covidence, v2675 fe1150be; Veritas Health Innovation Ltd.: Melbourne, Australia, 2021.
- Schmidt, W.P. Randomised and non-randomised studies to estimate the effect of community-level public health interventions: Definitions and methodological considerations. Emerg Themes Epidemiol. 2017, 14, 9. [Google Scholar] [CrossRef] [PubMed]
- Reeves, B.C.; Deeks, J.J.; Higgins, J.P.T.; Shea, B.; Tugwell, P.; Wells, G.A. Chapter 24: Including non-randomized studies on intervention effects. In Cochrane Handbook for Systematic Reviews of Interventions, 2nd ed.; Higgins, J.P.T., Thomas, J., Chandler, J., Cumpston, M., Li, T., Page, M.J., Welch, V.A., Eds.; John Wiley & Sons: Chichester, UK, 2019; pp. 595–620. [Google Scholar]
- Swedish Food Agency. School Lunches. Available online: https://www.livsmedelsverket.se/en/food-habits-health-and-environment/maltider-i-vard-skola-och-omsorg/skola?AspxAutoDetectCookieSupport=1 (accessed on 1 December 2021).
- Food Research and Action Center. National School Lunch Program. Available online: https://frac.org/programs/national-school-lunch-program (accessed on 29 September 2021).
- The World Bank Group. World Bank Country and Lending Groups. Available online: https://datahelpdesk.worldbank.org/knowledgebase/articles/906519-world-bank-country-and-lending-groups (accessed on 20 May 2020).
- Li, T.; Higgins, J.P.T.; Deeks, J.J. Chapter 5: Collecting data. In Cochrane Handbook for Systematic Reviews of Interventions, 2nd ed.; Higgins, J.P.T., Thomas, J., Chandler, J., Cumpston, M., Li, T., Page, M.J., Welch, V.A., Eds.; John Wiley & Sons: Chichester, UK, 2019; pp. 109–142. [Google Scholar]
- Harris, P.A.; Taylor, R.; Minor, B.L.; Elliott, V.; Fernandez, M.; O’Neal, L.; McLeod, L.; Delacqua, G.; Delacqua, F.; Kirby, J.; et al. The REDCap consortium: Building an international community of software platform partners. J. Biomed. Inform. 2019, 95, 103208. [Google Scholar] [CrossRef]
- Harris, P.A.; Taylor, R.; Thielke, R.; Payne, J.; Gonzalez, N.; Conde, J.G. Research electronic data capture (REDCap)—A metadata-driven methodology and workflow process for providing translational research informatics support. J. Biomed. Inform. 2009, 42, 377–381. [Google Scholar] [CrossRef]
- Academy of Nutrition and Dietetics. Evidence Analysis Manual: Steps in the Academy Evidence Analysis Process; Academy of Nutrition and Dietetics: Chicago, IL, USA, 2016. [Google Scholar]
- World Cancer Research Fund International. NOURISHING Framework. Available online: https://www.wcrf.org/policy/policy-databases/nourishing-framework/ (accessed on 26 July 2019).
- Hawkes, C.; Jewell, J.; Allen, K. A food policy package for healthy diets and the prevention of obesity and diet-related non-communicable diseases: The NOURISHING framework. Obes. Rev. 2013, 14 (Suppl. 2), 159–168. [Google Scholar] [CrossRef]
- Lee, K.M.; Dias, G.M.; Boluk, K.; Scott, S.; Chang, Y.S.; Williams, T.E.; Kirkpatrick, S.I. Toward a Healthy and Environmentally Sustainable Campus Food Environment: A Scoping Review of Postsecondary Food Interventions. Adv. Nutr. 2021, 12, 1996–2022. [Google Scholar] [CrossRef]
- Von Philipsborn, P.; Stratil, J.M.; Burns, J.; Busert, L.K.; Pfadenhauer, L.M.; Polus, S.; Holzapfel, C.; Hauner, H.; Rehfuess, E. Environmental interventions to reduce the consumption of sugar-sweetened beverages and their effects on health. Cochrane Database Syst. Rev. 2019, 6, CD012292. [Google Scholar] [CrossRef]
- Thaler, R.H.; Sunstein, C.R. Nudge: Improving Decisions about Health, Wealth and Happiness; Penguin Books: New York, NY, USA, 2008. [Google Scholar]
- Deeks, J.J.; Higgins, J.P.T.; Altman, D.G. Chapter 10: Analysing data and undertaking meta-analyses. In Cochrane Handbook for Systematic Reviews of Interventions, 2nd ed.; Higgins, J.P.T., Thomas, J., Chandler, J., Cumpston, M., Li, T., Page, M.J., Welch, V.A., Eds.; John Wiley & Sons: Chichester, UK, 2019; pp. 241–284. [Google Scholar]
- Higgins, J.P.T.; Eldridge, S.; Li, T. Chapter 23: Including variants on randomized trials. In Cochrane Handbook for Systematic Reviews of Interventions; Higgins, J.P.T., Thomas, J., Chandler, J., Cumpston, M., Li, T., Page, M.J., Welch, V.A., Eds.; John Wiley & Sons: Chichester, UK, 2019; pp. 569–594. [Google Scholar]
- Higgins, J.P.T.; Li, T.; Deeks, J.J. Chapter 6: Choosing effect measures and computing estimates of effect. In Cochrane Handbook for Systematic Reviews of Interventions, 2nd ed.; Higgins, J.P.T., Thomas, J., Chandler, J., Cumpston, M., Li, T., Page, M.J., Welch, V.A., Eds.; John Wiley & Sons: Chichester, UK, 2019; pp. 143–176. [Google Scholar]
- StataCorp. Stata Statistical Software: Release 15; StataCorp LLC: College Station, TX, USA, 2017. [Google Scholar]
- Izumi, B.T.; Bersamin, A.; Byker Shanks, C.; Grether-Sweeney, G.; Murimi, M. The US national school lunch program: A brief overview. Jpn. J. Nutr. Diet 2018, 76, S126–S132. [Google Scholar] [CrossRef]
- McKenzie, J.E.; Brennan, S.E. Chapter 12: Synthesizing and presenting findings using other methods. In Cochrane Handbook for Systematic Reviews of Interventions; Higgins, J.P.T., Thomas, J., Chandler, J., Cumpston, M., Li, T., Page, M.J., Welch, V.A., Eds.; John Wiley & Sons: Chichester, UK, 2019; pp. 321–348. [Google Scholar]
- Boon, M.H.; Thomson, H. The effect direction plot revisited: Application of the 2019 Cochrane Handbook guidance on alternative synthesis methods. Res. Synth. Methods 2021, 12, 29–33. [Google Scholar] [CrossRef]
- Brown, L.D.; Cai, T.T.; DasGupta, A. Interval estimation for a binomial proportion. Stat. Sci. 2001, 16, 101–117. [Google Scholar] [CrossRef]
- Bogart, L.M.; Cowgill, B.O.; Elliott, M.N.; Klein, D.J.; Hawes-Dawson, J.; Uyeda, K.; Elijah, J.; Binkle, D.G.; Schuster, M.A. A randomized controlled trial of students for nutrition and eXercise: A community-based participatory research study. J. Adolesc. Health 2014, 55, 415–422. [Google Scholar] [CrossRef] [PubMed]
- Cohen, J.F.; Smit, L.A.; Parker, E.; Austin, S.B.; Frazier, A.L.; Economos, C.D.; Rimm, E.B. Long-term impact of a chef on school lunch consumption: Findings from a 2-year pilot study in Boston middle schools. J. Acad. Nutr. Diet 2012, 112, 927–933. [Google Scholar] [CrossRef] [PubMed]
- Cullen, K.W.; Chen, T.A.; Dave, J.M.; Jensen, H. Differential Improvements in Student Fruit and Vegetable Selection and Consumption in Response to the New National School Lunch Program Regulations: A Pilot Study. J. Acad. Nutr. Diet 2015, 115, 743–750. [Google Scholar] [CrossRef] [PubMed]
- Greene, K.N.; Gabrielyan, G.; Just, D.R.; Wansink, B. Fruit-Promoting Smarter Lunchrooms Interventions: Results From a Cluster RCT. Am. J. Prev. Med. 2017, 52, 451–458. [Google Scholar] [CrossRef] [PubMed]
- Schwartz, M.B.; Henderson, K.E.; Read, M.; Danna, N.; Ickovics, J.R. New school meal regulations increase fruit consumption and do not increase total plate waste. Child Obes. 2015, 11, 242–247. [Google Scholar] [CrossRef]
- Just, D.R.; Wansink, B.; Hanks, A.S. Chefs move to schools. A pilot examination of how chef-created dishes can increase school lunch participation and fruit and vegetable intake. Appetite 2014, 83, 242–247. [Google Scholar] [CrossRef]
- Pope, L.; Roche, E.; Morgan, C.B.; Kolodinsky, J. Sampling tomorrow’s lunch today: Examining the effect of sampling a vegetable-focused entree on school lunch participation, a pilot study. Prev. Med. Rep. 2018, 12, 152–157. [Google Scholar] [CrossRef]
- Wansink, B.; Hanks, A.S.; Just, D.R. A plant to plate pilot: A cold-climate high school garden increased vegetable selection but also waste. Acta Paediatr. 2015, 104, 823–826. [Google Scholar] [CrossRef]
- Boehm, R.; Read, M.; Henderson, K.E.; Schwartz, M.B. Removing competitive foods v. nudging and marketing school meals: A pilot study in high-school cafeterias. Public Health Nutr. 2020, 23, 366–373. [Google Scholar] [PubMed]
- Hanks, A.S.; Just, D.R.; Wansink, B. Smarter lunchrooms can address new school lunchroom guidelines and childhood obesity. J. Pediatr. 2013, 162, 867–869. [Google Scholar]
- Quinn, E.L.; Johnson, D.B.; Podrabsky, M.; Saelens, B.E.; Bignell, W.; Krieger, J. Effects of a Behavioral Economics Intervention on Food Choice and Food Consumption in Middle-School and High-School Cafeterias. Prev. Chronic Dis. 2018, 15, E91. [Google Scholar] [CrossRef]
- Prescott, M.P.; Burg, X.; Metcalfe, J.J.; Lipka, A.E.; Herritt, C.; Cunningham-Sabo, L. Healthy Planet, Healthy Youth: A Food Systems Education and Promotion Intervention to Improve Adolescent Diet Quality and Reduce Food Waste. Nutrients 2019, 11, 1869. [Google Scholar] [CrossRef]
- Ellison, R.C.; Capper, A.L.; Stephenson, W.P.; Goldberg, R.J.; Hosmer, D.W., Jr.; Humphrey, K.F.; Ockene, J.K.; Gamble, W.J.; Witschi, J.C.; Stare, F.J. Effects on blood pressure of a decrease in sodium use in institutional food preparation: The Exeter-Andover Project. J. Clin. Epidemiol. 1989, 42, 201–208. [Google Scholar]
- Prell, H.C.; Berg, M.C.; Jonsson, L.M.; Lissner, L. A school-based intervention to promote dietary change. J. Adolesc. Health 2005, 36, 529. [Google Scholar] [CrossRef]
- Bean, M.K.; Theriault, E.; Grigsby, T.; Stewart, M.D.; LaRose, J.G. A Cafeteria Personnel Intervention to Improve the School Food Environment. Am. J. Health Behav. 2019, 43, 158–167. [Google Scholar]
- Cullen, K.W.; Watson, K.; Zakeri, I. Improvements in middle school student dietary intake after implementation of the Texas Public School Nutrition Policy. Am. J. Public Health 2008, 98, 111–117. [Google Scholar] [PubMed]
- Mendoza, J.A.; Watson, K.; Cullen, K.W. Change in dietary energy density after implementation of the Texas Public School Nutrition Policy. J. Am. Diet Assoc. 2010, 110, 434–440. [Google Scholar] [PubMed]
- Madden, A.M.; Harrex, R.; Radalowicz, J.; Boaden, D.C.; Lim, J.; Ash, R. A kitchen-based intervention to improve nutritional intake from school lunches in children aged 12–16 years. J. Hum. Nutr. Diet. 2013, 26, 243–251. [Google Scholar] [PubMed]
- Sharma, A.; Moon, J.; Bailey-Davis, L. Loss Aversion of Time: Serving School Lunches Faster without Impacting Meal Experience. Ecol. Food Nutr. 2018, 57, 456–472. [Google Scholar]
- Elbel, B.; Mijanovich, T.; Abrams, C.; Cantor, J.; Dunn, L.; Nonas, C.; Cappola, K.; Onufrak, S.; Park, S. A water availability intervention in New York City public schools: Influence on youths’ water and milk behaviors. Am. J. Public Health 2015, 105, 365–372. [Google Scholar]
- McCool, A.C.; Myung, E.; Chien, T. Modification of the form in which fresh fruit is served as a possible means of increasing the consumption of fruit offered to elementary and middle school students. J. Foodserv. Bus. Res. 2005, 8, 73–85. [Google Scholar]
- Bogart, L.M.; Elliott, M.N.; Uyeda, K.; Hawes-Dawson, J.; Klein, D.J.; Schuster, M.A. Preliminary healthy eating outcomes of SNaX, a pilot community-based intervention for adolescents. J. Adolesc. Health 2011, 48, 196–202. [Google Scholar]
- Bogart, L.M.; Fu, C.M.; Eyraud, J.; Cowgill, B.O.; Hawes-Dawson, J.; Uyeda, K.; Klein, D.J.; Elliott, M.N.; Schuster, M.A. Evaluation of the dissemination of SNaX, a middle school-based obesity prevention intervention, within a large US school district. Transl. Behav. Med. 2018, 8, 724–732. [Google Scholar] [PubMed]
- Wansink, B.; Just, D.R.; Hanks, A.S.; Smith, L.E. Pre-sliced fruit in school cafeterias: Children’s selection and intake. Am. J. Prev. Med. 2013, 44, 477–480. [Google Scholar] [PubMed]
- Turnin, M.C.; Buisson, J.C.; Ahluwalia, N.; Cazals, L.; Bolzonella-Pene, C.; Fouquet-Martineau, C.; Martini, P.; Tauber, M.; Hanaire, H. Effect of Nutritional Intervention on Food Choices of French Students in Middle School Cafeterias, Using an Interactive Educational Software Program (Nutri-Advice). J. Nutr. Educ. Behav. 2016, 48, 131–137. [Google Scholar]
- D’Adamo, C.R.; Parker, E.A.; McArdle, P.F.; Trilling, A.; Bowden, B.; Bahr-Robertson, M.K.; Keller, K.L.; Berman, B.M. The addition of spices and herbs to vegetables in the National School Lunch Program increased vegetable intake at an urban, economically-underserved, and predominantly African-American high school. Food Qual. Prefer. 2021, 88, 104076. [Google Scholar] [CrossRef]
- Cullen, K.W.; Hartstein, J.; Reynolds, K.D.; Vu, M.; Resnicow, K.; Greene, N.; White, M.A. Studies to Treat or Prevent Pediatric Type 2 Diabetes Prevention Study Group. Improving the school food environment: Results from a pilot study in middle schools. J. Am. Diet Assoc. 2007, 107, 484–489. [Google Scholar]
- Ellison, R.C.; Capper, A.L.; Goldberg, R.J.; Witschi, J.C.; Stare, F.J. The environmental component: Changing school food service to promote cardiovascular health. Health Educ. Q. 1989, 16, 285–297. [Google Scholar]
- Ellison, R.C.; Goldberg, R.J.; Witschi, J.C.; Capper, A.L.; Puleo, E.M.; Stare, F.J. Use of fat-modified food products to change dietary fat intake of young people. Am. J. Public Health 1990, 80, 1374–1376. [Google Scholar] [CrossRef] [PubMed] [Green Version]
- Askelson, N.M.; Brady, P.; Ryan, G.; Meier, C.; Ortiz, C.; Scheidel, C.; Delger, P. Actively Involving Middle School Students in the Implementation of a Pilot of a Behavioral Economics-Based Lunchroom Intervention in Rural Schools. Health Promot. Pract. 2019, 20, 675–683. [Google Scholar] [CrossRef] [PubMed]
- Chu, Y.L.; Warren, C.A.; Sceets, C.E.; Murano, P.; Marquart, L.; Reicks, M. Acceptance of two US Department of Agriculture commodity whole-grain products: A school-based study in Texas and Minnesota. J. Am. Diet Assoc. 2011, 111, 1380–1384. [Google Scholar] [CrossRef] [PubMed]
- Cohen, J.F.; Richardson, S.; Austin, S.B.; Economos, C.D.; Rimm, E.B. School lunch waste among middle school students: Nutrients consumed and costs. Am. J. Prev. Med. 2013, 44, 114–121. [Google Scholar] [CrossRef]
- Fritts, J.R.; Bermudez, M.A.; Hargrove, R.L.; Alla, L.; Fort, C.; Liang, Q.; Cravener, T.L.; Rolls, B.J.; D’Adamo, C.R.; Hayes, J.E.; et al. Using Herbs and Spices to Increase Vegetable Intake Among Rural Adolescents. J. Nutr. Educ. Behav. 2019, 51, 806–816. [Google Scholar] [CrossRef]
- Hackett, A.F.; Jarvis, S.N.; Mathews, J.N.S. A study of the eating habits of 11- and 12-year-old children before and one year after the start of a healthy eating campaign in Northumberland. J. Hum. Nutr. Diet. 1990, 3, 323–332. [Google Scholar] [CrossRef]
- Hanks, A.S.; Just, D.R.; Smith, L.E.; Wansink, B. Healthy convenience: Nudging students toward healthier choices in the lunchroom. J. Public Health 2012, 34, 370–376. [Google Scholar] [CrossRef]
- Hunsberger, M.; McGinnis, P.; Smith, J.; Beamer, B.A.; O’Malley, J. Calorie labeling in a rural middle school influences food selection: Findings from community-based participatory research. J Obes. 2015, 2015, 531690. [Google Scholar] [CrossRef]
- Koch, P.A.; Wolf, R.L.; Trent, R.; Guerra, L.A. School transformation after redesign of 3 cafeterias (STARCafé). Health Behav. Policy Rev. 2020, 7, 329–341. [Google Scholar]
- Witschi, J.C.; Ellison, R.C.; Doane, D.D.; Vorkink, G.L.; Slack, W.V.; Stare, F.J. Dietary sodium reduction among students: Feasibility and acceptance. J. Am. Diet Assoc. 1985, 85, 816–821. [Google Scholar] [CrossRef]
- Birnbaum, A.S.; Lytle, L.A.; Story, M.; Perry, C.L.; Murray, D.M. Are differences in exposure to a multicomponent school-based intervention associated with varying dietary outcomes in adolescents? Health Educ. Behav. 2002, 29, 427–443. [Google Scholar] [CrossRef]
- McClain, A.D.; Hekler, E.B.; Gardner, C.D. Incorporating prototyping and iteration into intervention development: A case study of a dining hall-based intervention. J. Am. Coll. Health 2013, 61, 122–131. [Google Scholar] [CrossRef] [Green Version]
- Cohen, J.F.; Richardson, S.A.; Cluggish, S.A.; Parker, E.; Catalano, P.J.; Rimm, E.B. Effects of choice architecture and chef-enhanced meals on the selection and consumption of healthier school foods: A randomized clinical trial. JAMA Pediatr. 2015, 169, 431–437. [Google Scholar] [CrossRef]
- Cohen, J.F.W.; Richardson, S.; Rimm, E.B. Impact of the Updated USDA School Meal Standards, Chef-Enhanced Meals, and the Removal of Flavored Milk on School Meal Selection and Consumption. J. Acad. Nutr. Diet 2019, 119, 1511–1515. [Google Scholar] [CrossRef]
- Langford, R.; Bonell, C.; Jones, H.; Campbell, R. Obesity prevention and the Health promoting Schools framework: Essential components and barriers to success. Int. J. Behav. Nutr. Phys. Act. 2015, 12, 15. [Google Scholar] [CrossRef]
- Sharma, S.V.; Chow, J.; Pomeroy, M.; Raber, M.; Salako, D.; Markham, C. Lessons Learned From the Implementation of Brighter Bites: A Food Co-op to Increase Access to Fruits and Vegetables and Nutrition Education Among Low-Income Children and Their Families. J. Sch. Health 2017, 87, 286–295. [Google Scholar] [CrossRef]
- Bazyk, S.; Demirjian, L.; Horvath, F.; Doxsey, L. The Comfortable Cafeteria Program for Promoting Student Participation and Enjoyment: An Outcome Study. Am. J. Occup. Ther. 2018, 72, 7203205050p1–7203205050p9. [Google Scholar] [CrossRef]
- Hamdan, S.; Story, M.; French, S.A.; Fulkerson, J.A.; Nelson, H. Perceptions of adolescents involved in promoting lower-fat foods in schools: Associations with level of involvement. J. Am. Diet Assoc. 2005, 105, 247–251. [Google Scholar] [CrossRef] [PubMed]
- Lytle, L.A.; Murray, D.M.; Perry, C.L.; Story, M.; Birnbaum, A.S.; Kubik, M.Y.; Varnell, S. School-based approaches to affect adolescents’ diets: Results from the TEENS study. Health Educ. Behav. 2004, 31, 270–287. [Google Scholar] [CrossRef]
- Rajbhandari-Thapa, J.; Bennett, A.; Keong, F.; Palmer, W.; Hardy, T.; Welsh, J. Effect of the Strong4Life School Nutrition Program on Cafeterias and on Manager and Staff Member Knowledge and Practice, Georgia, 2015. Public Health Rep. 2017, 132 (Suppl. 2), 48S–56S. [Google Scholar] [CrossRef]
- Hung, T.T.; Chiang, V.C.; Dawson, A.; Lee, R.L. Understanding of factors that enable health promoters in implementing health-promoting schools: A systematic review and narrative synthesis of qualitative evidence. PLoS ONE 2014, 9, e108284. [Google Scholar] [CrossRef]
- Ronto, R.; Rathi, N.; Worsley, A.; Sanders, T.; Lonsdale, C.; Wolfenden, L. Enablers and barriers to implementation of and compliance with school-based healthy food and beverage policies: A systematic literature review and meta-synthesis. Public Health Nutr. 2020, 23, 2840–2855. [Google Scholar] [CrossRef] [PubMed]
- Cohen, J.F.W.; Jahn, J.L.; Richardson, S.; Cluggish, S.A.; Parker, E.; Rimm, E.B. Amount of Time to Eat Lunch Is Associated with Children’s Selection and Consumption of School Meal Entree, Fruits, Vegetables, and Milk. J. Acad. Nutr. Diet 2016, 116, 123–128. [Google Scholar] [CrossRef]
- Gosliner, W. School-level factors associated with increased fruit and vegetable consumption among students in California middle and high schools. J. Sch. Health 2014, 84, 559–568. [Google Scholar] [CrossRef]
- Bauer, K.W.; Yang, Y.W.; Austin, S.B. “How can we stay healthy when you’re throwing all of this in front of us?” Findings from focus groups and interviews in middle schools on environmental influences on nutrition and physical activity. Health Educ. Behav. 2004, 31, 34–46. [Google Scholar] [CrossRef]
- McSweeney, L.; Bradley, J.; Adamson, A.J.; Spence, S. The ‘Voice’ of Key Stakeholders in a School Food and Drink Intervention in Two Secondary Schools in NE England: Findings from a Feasibility Study. Nutrients 2019, 11, 2746. [Google Scholar] [CrossRef]
- Payan, D.D.; Sloane, D.C.; Illum, J.; Farris, T.; Lewis, L.B. Perceived Barriers and Facilitators to Healthy Eating and School Lunch Meals among Adolescents: A Qualitative Study. Am. J. Health Behav. 2017, 41, 661–669. [Google Scholar] [CrossRef]
- National Center for Chronic Disease Prevention and Health Promotion, Division of Adolescent and School Health. Implementing Strong Nutrition Standards for Schools: Financial Implications; Centers for Disease Control and Prevention: Atlanta, GA, USA, 2011. [Google Scholar]
- Peart, T.; Kao, J.; Crawford, P.B.; Samuels, S.E.; Craypo, L.; Woodward-Lopez, G. Does competitive food and beverage legislation hurt meal participation or revenues in high schools? Child Obes. 2012, 8, 339–346. [Google Scholar] [CrossRef]
- Ishdorj, A.; Crepinsek, M.K.; Jensen, H.H. Children’s consumption of fruits and vegetables: Do school environment and policies affect choices at school and away from school? Appl. Econ. Perspect. Policy 2013, 35, 341–359. [Google Scholar] [CrossRef]
- Browne, S.; Barron, C.; Staines, A.; Sweeney, M.R. ‘We know what we should eat but we don’t…’: A qualitative study in Irish secondary schools. Health Promot Int. 2020, 35, 984–993. [Google Scholar] [CrossRef]
- Scully, M.; Wakefield, M.; Niven, P.; Chapman, K.; Crawford, D.; Pratt, I.S.; Baur, L.; Flood, V.; Morley, B. Association between food marketing exposure and adolescents’ food choices and eating behaviors. Appetite 2012, 58, 1–5. [Google Scholar] [CrossRef]
- Bryan, C.J.; Yeager, D.S.; Hinojosa, C.P. A values-alignment intervention protects adolescents from the effects of food marketing. Nat. Hum. Behav. 2019, 3, 596–603. [Google Scholar] [CrossRef]
- Sawyer, S.M.; Afifi, R.A.; Bearinger, L.H.; Blakemore, S.J.; Dick, B.; Ezeh, A.C.; Patton, G.C. Adolescence: A foundation for future health. Lancet 2012, 379, 1630–1640. [Google Scholar] [CrossRef]
- Mingay, E.; Hart, M.; Yoong, S.; Hure, A. Why We Eat the Way We Do: A Call to Consider Food Culture in Public Health Initiatives. Int. J. Environ. Res. Public Health 2021, 18, 11967. [Google Scholar] [CrossRef]
| Inclusion Criteria | Exclusion Criteria | |
|---|---|---|
| Population | Secondary (i.e., middle or high) schools that provide a routine main meal service (≥1 main meal/day) to most students (≥50%) on most days; students aged 10–19 years; generally well and independent of activities of daily living; upper-middle and high-income countries | Primary (i.e., elementary) schools; before or after school care; schools that only provide optional purchases that may supplement a meal provided from home or elsewhere; people aged <10 or >19 years; high-needs populations who are acutely or chronically unwell; selection of participants based on special nutritional needs (athletes, dance groups, high or at-risk of nutrient deficiency), specific disease state or weight status |
| Intervention | Single or multi-strategy nutrition-related interventions that target and modify the practices of the routine meal service; includes nudging strategies, policy implementation, menu changes, staff training; may vary in method, duration, or mode of delivery | Interventions that focus on components outside the routine meal service, e.g., introduce a new routine meal service, or target the total school food environment without specific routine meal service strategies |
| Comparison | Experimental studies with control or comparison groups (both classified as ‘controlled studies’ throughout review), not limited to parallel controls; single group experiments with comparison of before and after measurements | Experimental studies without control or comparison data; studies with comparative data but without an intervention (e.g., menu comparison across schools) |
| Outcomes | Objective or subjective measures of students’ food behaviours and dining experience that reflect a change in practice within the routine meal service; includes selection or consumption of a meal component (a food item, food group or nutrient), qualitative feedback, attitudes or satisfaction scores, knowledge, school meal program participation rates | Measurements that do not reflect student outcomes (e.g., menu assessment) or the impact of strategies targeting the routine meal service (e.g., dietary intake from total diet, anthropometric measures for interventions that include physical activity or classroom education unrelated to the routine meal service) |
| Study design | Randomised and non-randomised experimental trials, single group before-after studies; peer-reviewed publications; may be a pilot study | Non-peer-reviewed publications, reviews, observational studies, commentaries, editorials, conference proceedings, reports, PhD dissertations |
Publisher’s Note: MDPI stays neutral with regard to jurisdictional claims in published maps and institutional affiliations. |
© 2022 by the authors. Licensee MDPI, Basel, Switzerland. This article is an open access article distributed under the terms and conditions of the Creative Commons Attribution (CC BY) license (https://creativecommons.org/licenses/by/4.0/).
Share and Cite
Mingay, E.; Hart, M.; Yoong, S.; Palazzi, K.; D’Arcy, E.; Pursey, K.M.; Hure, A. The Impact of Modifying Food Service Practices in Secondary Schools Providing a Routine Meal Service on Student’s Food Behaviours, Health and Dining Experience: A Systematic Review and Meta-Analysis. Nutrients 2022, 14, 3640. https://doi.org/10.3390/nu14173640
Mingay E, Hart M, Yoong S, Palazzi K, D’Arcy E, Pursey KM, Hure A. The Impact of Modifying Food Service Practices in Secondary Schools Providing a Routine Meal Service on Student’s Food Behaviours, Health and Dining Experience: A Systematic Review and Meta-Analysis. Nutrients. 2022; 14(17):3640. https://doi.org/10.3390/nu14173640
Chicago/Turabian StyleMingay, Edwina, Melissa Hart, Serene Yoong, Kerrin Palazzi, Ellie D’Arcy, Kirrilly M. Pursey, and Alexis Hure. 2022. "The Impact of Modifying Food Service Practices in Secondary Schools Providing a Routine Meal Service on Student’s Food Behaviours, Health and Dining Experience: A Systematic Review and Meta-Analysis" Nutrients 14, no. 17: 3640. https://doi.org/10.3390/nu14173640
APA StyleMingay, E., Hart, M., Yoong, S., Palazzi, K., D’Arcy, E., Pursey, K. M., & Hure, A. (2022). The Impact of Modifying Food Service Practices in Secondary Schools Providing a Routine Meal Service on Student’s Food Behaviours, Health and Dining Experience: A Systematic Review and Meta-Analysis. Nutrients, 14(17), 3640. https://doi.org/10.3390/nu14173640