Article

Association between Dietary Patterns and the Risk of Depressive Symptoms in the Older Adults in Rural China

1
Department of Nutrition and Food Science, School of Public Health, Tianjin Medical University, 22 Qixiangtai Road, Heping District, Tianjin 300070, China
2
Department of Social Medicine and Health Administration, School of Public Health, Tianjin Medical University, 22 Qixiangtai Road, Heping District, Tianjin 300070, China
3
Tianjin Key Laboratory of Environment, Nutrition and Public Health, 22 Qixiangtai Road, Heping District, Tianjin 300070, China
4
Neurosurgical Department, Baodi Clinical College, Tianjin Medical University, 8 Guangchuan Road, Baodi District, Tianjin 301899, China
5
Department of Epidemiology and Biostatistics, School of Public Health, Tianjin Medical University, 22 Qixiangtai Road, Heping District, Tianjin 300070, China
6
Department of Tumour, Baodi Clinical College, Tianjin Medical University, 8 Guangchuan Road, Baodi District, Tianjin 301899, China
*
Author to whom correspondence should be addressed.
Nutrients 2022, 14(17), 3538; https://doi.org/10.3390/nu14173538
Submission received: 24 July 2022 / Revised: 21 August 2022 / Accepted: 25 August 2022 / Published: 27 August 2022
(This article belongs to the Section Geriatric Nutrition)

Abstract

:
Geriatric depression, a chronic condition, has become a substantial burden in rural China. This study aimed to assess the association between dietary patterns and the risk of geriatric depression in rural China. Between March 2018 and June 2019, 3304 participants were recruited for this cross-sectional study in rural Tianjin, China. Principal component analysis was used to determine the major dietary patterns. The associations between dietary patterns and the risk of geriatric depression were assessed using a logistic regression model. Four dietary patterns were identified: vegetables-fruit, animal food, processed food, and milk-egg. The study found that vegetable-fruit (Q2 vs. Q1: OR = 0.62, 95% CI: 0.46–0.83; Q3 vs. Q1: OR = 0.54, 95% CI: 0.38–0.75; Q4 vs. Q1: OR = 0.39, 95% CI: 0.26–0.57) and animal food patterns (Q3 vs. Q1: OR = 0.69, 95% CI: 0.50–0.95; Q4 vs. Q1: OR = 0.58, 95% CI: 0.41–0.82) were associated with a decreased risk of depression, and inflammatory dietary pattern (Q2 vs. Q1: OR = 1.71, 95% CI: 1.23–2.38; Q3 vs. Q1: OR = 1.70, 95% CI: 1.22–2.36; Q4 vs. Q1: OR = 1.44, 95% CI: 1.03–2.03) was associated with an increased risk of depression. The present findings reinforce the importance of adopting an adequate diet consisting of vegetables, fruit and animal foods, while limiting the intake of pro-inflammatory foods, to decrease the risk of depression.

1. Introduction

An estimated 322 million people globally suffer from depression, and the prevalence of geriatric depression is 7%, with trends seemingly increasing yearly [1]. Depression not only causes its more known effects, including persistent sadness, a lack of interest or pleasure in previously rewarding or enjoyable activities, sleep disorders, disturbed appetite, tiredness, and poor concentration, but also causes more severe health effects, such as cardiovascular diseases, stroke, coronary heart disease, gastrointestinal disorders, hypertension, asthma, disability, self-harm, and suicide [2,3]. Thus, it contributes significantly to the global burden of disease. Compared to younger individuals, older adults have a higher prevalence of depression, which has a greater impact on their physical health and cognition [1,4]. In China, the prevalence of depression in older adults ranges from 4% to 26.5%, which may lead to a substantial burden to families and society [5,6]. A previous review reported that the prevalence of depressive symptoms in the older adult population was 22.7%, with 29.2% and 20.5% of these individuals residing in rural and urban China, respectively [5]. This study focuses on older adults in rural China, where the aging population is growing, and residents are of low socioeconomic status.
The current treatments for depressive symptoms include pharmacotherapy, psychotherapy, and lifestyle management [1]. However, in low- and middle-income countries, an estimated 76–85% of people suffering from mental disorders lack access to the corresponding treatment because the treatment and support services for depression are often absent or underdeveloped in these counties [1]. Moreover, despite being the more accessible treatment option, long-term antidepressant treatment may cause significant side effects [7,8]. Growing evidence suggests that certain dietary nutrients (e.g., omega-3 fatty acids, folate, vitamins B and E) or food (e.g., fruit, vegetables, legumes, nuts, fish, and red meat) are associated with depression [7,8,9,10,11,12]; however, complex nutritional interactions and cumulative effects may not be adequately considered when nutrients or foods are studied in isolation [2,4]. Dietary patterns are multifaceted, which makes it difficult to attribute depression to a single nutrient or food group. Therefore, it is important to assess the relationship between dietary patterns as a whole diet and depressive symptoms. Moreover, dietary modifications should be considered a preventative and helpful adjunct to the current line of treatment in place for depression in rural areas.
Previous studies have shown that proinflammatory mechanisms may underpin depressive disorders [2,7,9]. Systemic inflammation and oxidative stress can impair neurotransmitter metabolism and increase neurodegeneration, which may trigger clinical symptoms of depression [7,8,9,10]. This common pathophysiological mechanism underscores the importance of diet in facilitating or impeding chronic inflammatory diseases, such as depression. Some foods, such as red and processed meats, fried foods, snacks, and beverages, are the leading cause of inflammation; however, higher intake of fruit, vegetables, legumes, fish, and whole grain are associated with greater protective effects [13,14,15,16,17]. In fact, recent studies have reported that inflammatory dietary patterns may be associates with an increased incidence of depression [2,4,9]. Therefore, it is imperative to identify modifiable dietary factors early on and to encourage greater adherence to healthy diets to reduce the likelihood of developing depressive disorders.
This study aimed to investigate the potential associations between dietary patterns and the risk of geriatric depression in rural China to provide new information that can be used in prevention and management of this issue.

2. Methods

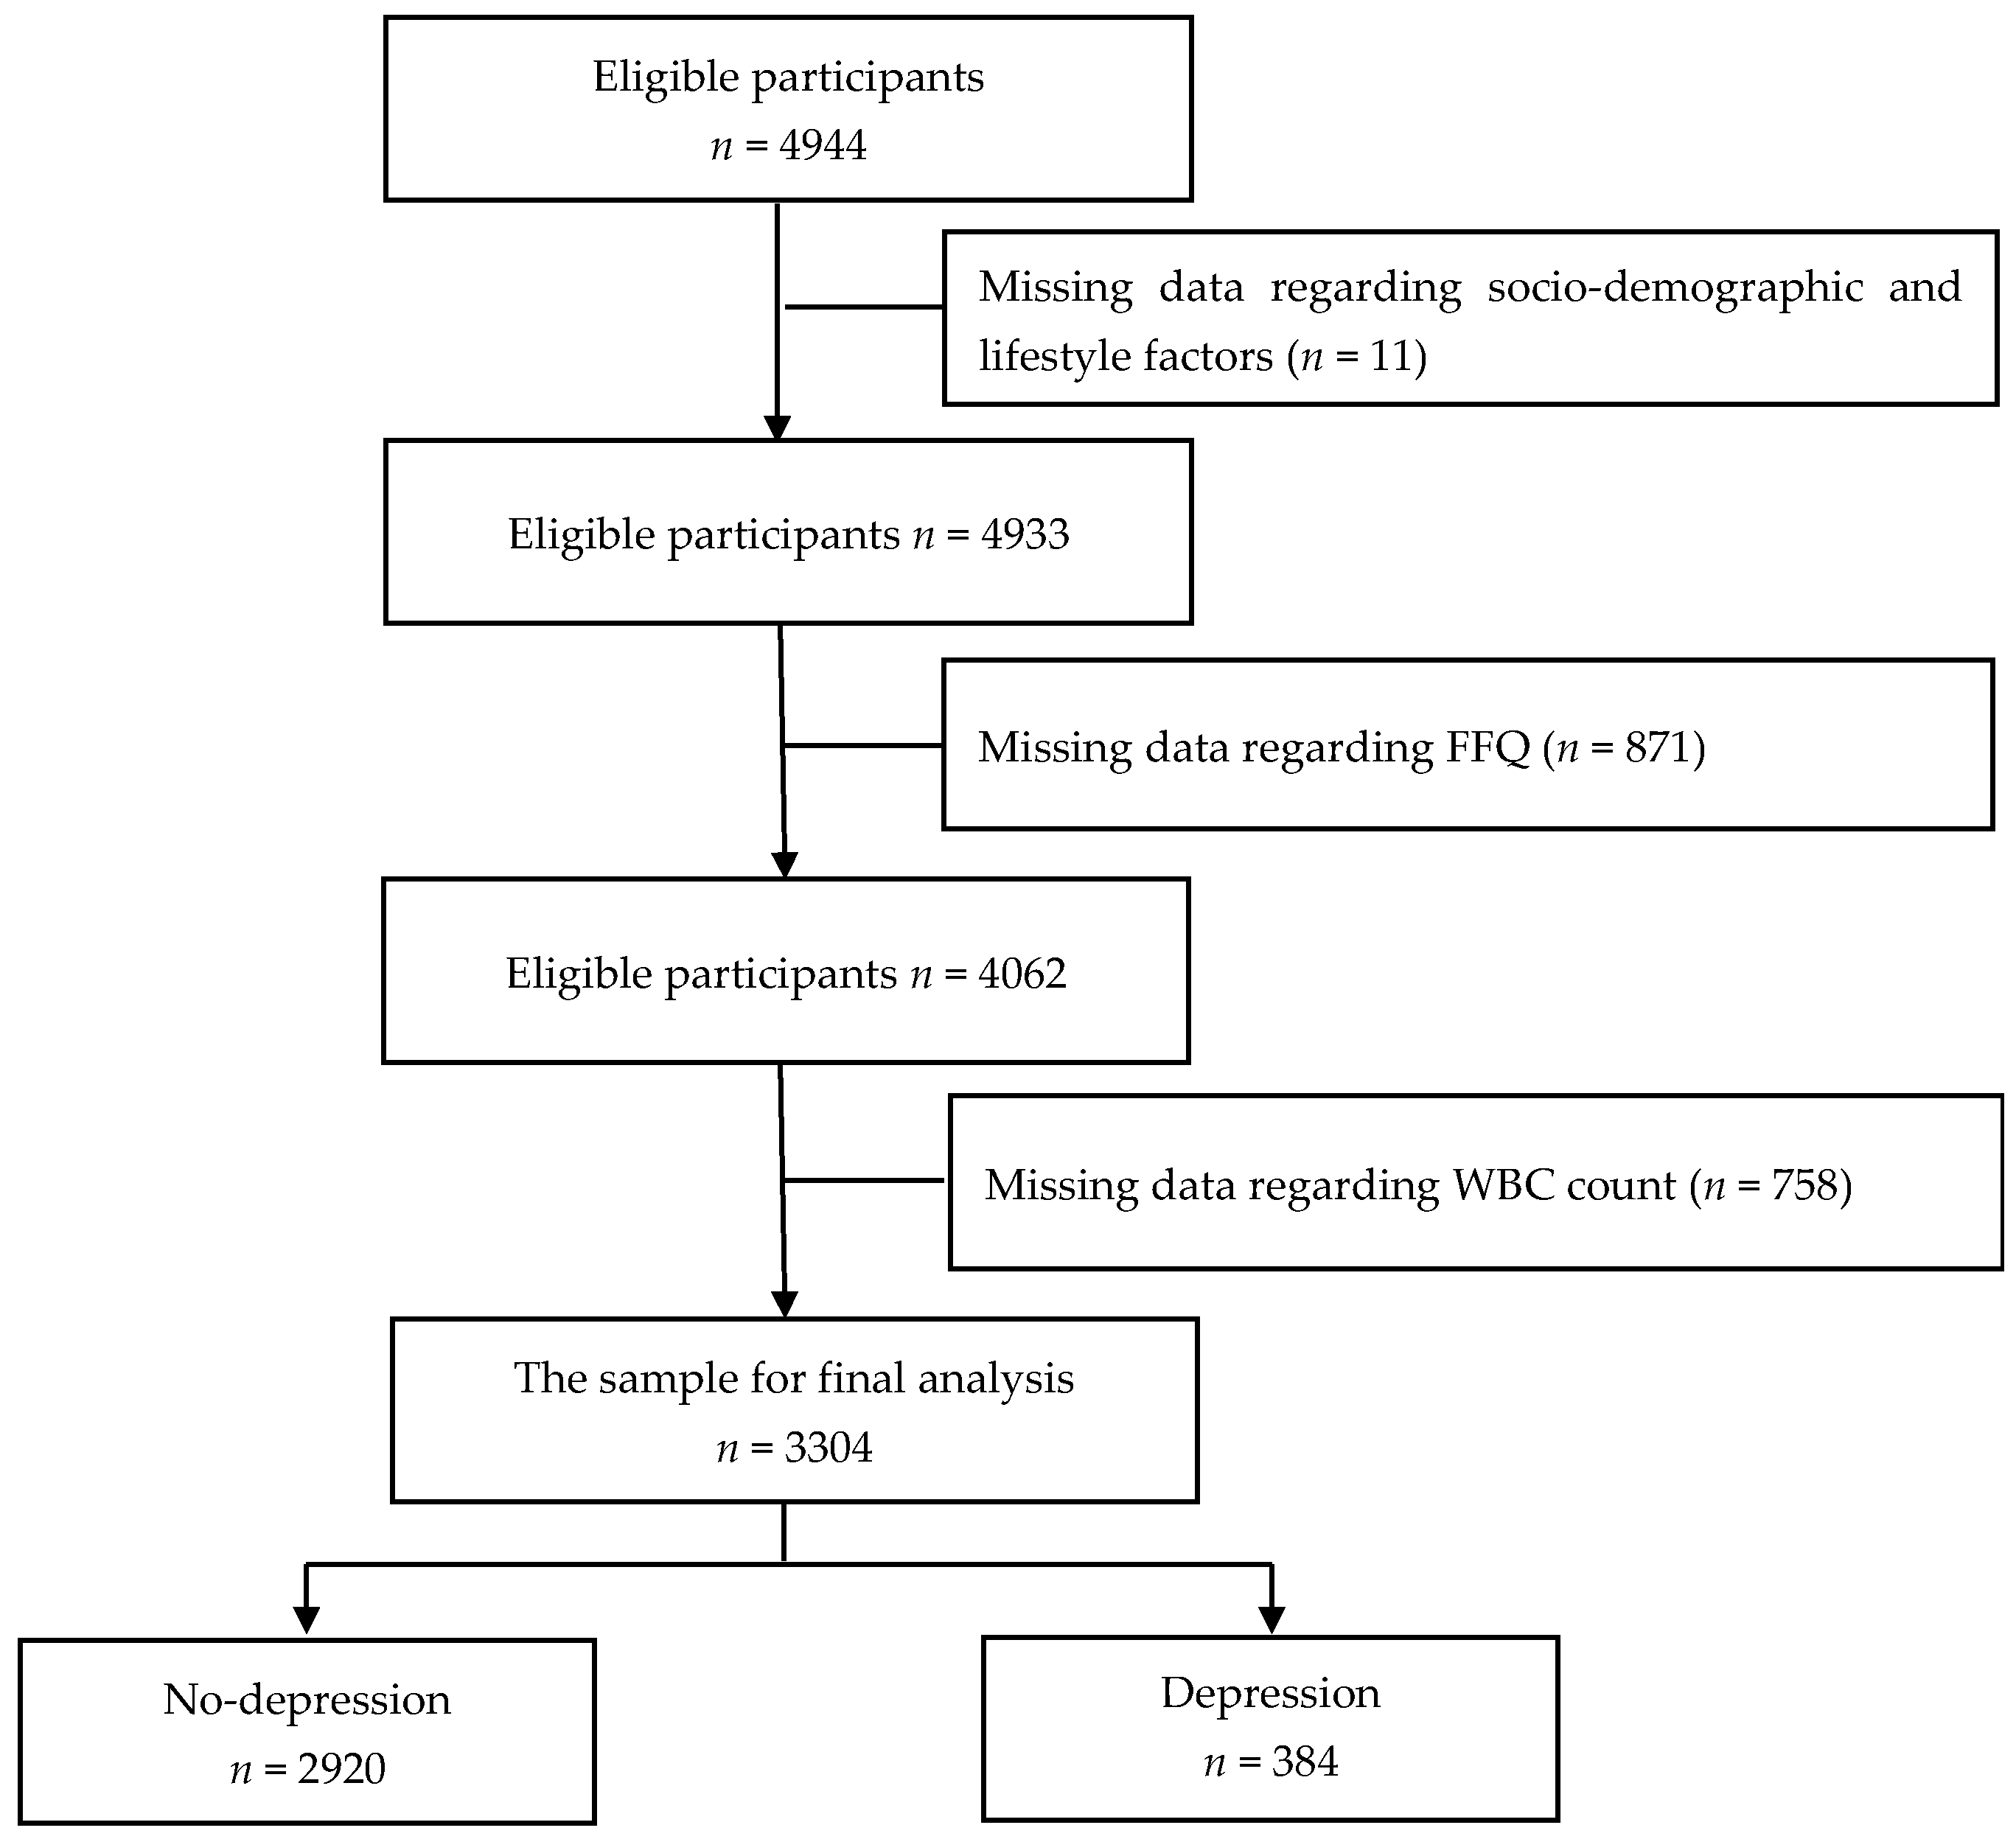
2.1. Design and Study Population

This study used data from the Tianjin Elderly Nutrition and Cognition cohort study (Clinical Trial Registration Identifier: ChiCTR 2000034348), which assessed the association between nutrition and cognition in China. A total of 4944 eligible older individuals were recruited between March 2018 and June 2019 from three rural communities in the Baodi District of Tianjin, China. The participants were selected by cluster sampling, that is, all eligible older adults from these three communities were included in this cross-sectional study. The exclusion criteria were as follows: missing data regarding sociodemographic and lifestyle factors (n = 11), missing data regarding the food frequency questionnaire (FFQ) (n = 871), and missing data regarding white blood cell (WBC) count (n = 758). Finally, 3304 participants were included in the final analysis (Figure 1). All participants provided written informed consent, and the study protocol was approved by the ethics committee of Tianjin Medical University, China (no. TMUhMEC2018013).

2.2. Assessment of Dietary Patters

The validated quantitative FFQ was used to assess dietary intake. The FFQ uses a seven-point scale, including never or hardly ever eats, <1, 1 time/week, 2–3 times/week, 4–6 times/week, 1 time/day, and ≥2 times/day. The frequency category and quantity (grams/standard portion sizes) of each food were converted to daily intake using the latest available Chinese food composition table [18]. Based on the similarity of nutrients and cooking practices, single food items from the FFQ were classified into 17 predefined food groups (Table 1). Principal component analysis (PCA) was used to determine the major dietary patterns. Reduced-rank regression (RRR) was used to identify the inflammatory dietary pattern. RRR is an extended multivariate linear regression model with the function of dimension reduction, which can explain the maximum variation in a number of response variables. RRR has been widely used in the nutritional epidemiology research to identify dietary patterns based on nutrients or biomarkers (i.e., intermediates between foods and health outcomes) with linear combinations in recent years [13,19]. In this study, both WBC count and neutrophil-to-lymphocyte ratio (NLR) were used as response variables, as these biomarkers are related to inflammation. Food groups with a factor loading greater than 0.3 were major contributors to inflammatory dietary patterns and represented the characteristics of inflammatory diets.

2.3. Laboratory Procedures of Inflammatory Markers

Blood samples were drawn in the morning after an overnight fast of approximately 12 h, and the blood samples were drawn and stored at −80 °C to perform several hematology tests. The WBC and percentage of neutrophils and lymphocytes were measured using an automatic blood cell counter (XN-1000).

2.4. Assessment of Depressive Symptoms

Face-to-face interviews were conducted in community health service centers. The Chinese version of the Self-rating Depression Scale (SDS), which has been widely used in the Chinese population, was used to measure depressive symptoms [20,21,22]. It is a 20-item self-report scale with a four-point scale (1: “none or a little of the time”; 2: “a small part of the time”; 3: “a lot of time”; and 4: “most of the time”) to evaluate the frequency of symptoms [20,21]. The scale was divided into four categories: (1) pervasive affective disturbances, (2) physiological disturbances, (3) psychomotor disturbances, and (4) psychological disturbances [23]. The standard score is then calculated using the raw score, which is the sum of the scores of the 20 items, multiplied by 1.25 [23,24]. Depressive symptoms were defined by a continuous standard SDS score, with depression being defined as a standard score ≥50 with higher scores reflecting greater symptom severity [24,25,26].

2.5. Covariates

The potential confounding factors were age (in years), sex, and education (classified as “<6 years,” “6-years,” and “≥9 years”), household income per month (classified as “<5000 Chinese Yuan (CNY)” and “≥5000 CNY”), employment (classified as “employed or retired” and “unemployed”), living alone, social activities, physical exercise (classified as “Yes” and “No”), sleep duration (classified as “<6 h,” “6–8 h,” “8–10 h” and “≥10 h”), and number of chronic diseases (classified as “0,” “1,” or “≥2”). A general health questionnaire was used to collect this information.

2.6. Statistical Analyses

The characteristics of participants with and without depression were compared using the t-test for continuous variables and chi-squared test for categorical variables. The Kaiser-Meyer-Olkin (KMO) measure of sampling adequacy and Bartlett’s test of sphericity were used to evaluate the adequacy of correlation matrices with the data. PCA was used to determine the major dietary patterns. The number of factors (dietary patterns) were retained based on an evaluation of the eigenvalues (>1.0), a scree plot, and factor interpretability. The factors were extracted using varimax rotation to maintain an uncorrelated state and improve interpretability. Food groups with a factor loading ≥0.40 were considered as the main contributors to the dietary pattern and represented the character of each pattern. The inflammatory dietary pattern was identified using RRR according to WBC count and NLR. Food groups with a factor loading greater than 0.3 were major contributors to inflammatory dietary patterns and represented the characteristics of inflammatory diets.
Quartiles based on the factor scores were determined for each dietary pattern for further analysis. The baseline characteristics of participants according to quartiles of each dietary pattern were explored using analysis of variance (ANOVA) for continuous variables and the chi-squared test for categorical variables. The SDS scores of participants were calculated across quartiles of each dietary pattern score, and all data were presented as mean ± SD and analyzed using ANOVA. The associations between dietary patterns and the risk of geriatric depression were assessed using a logistic regression model.
Statistical analyses were performed using SPSS version 22.0 (SPSS Inc., Chicago, IL, USA) and SAS version 9.3 (SAS Institute Inc., Cary, NC, USA). Significance was set at a two-sided p value < 0.05.

3. Results

3.1. Characteristics According to the Risk of Depression

The final dataset included 3304 older individuals comprised of 1486 (45.0%) males and 1818 (55.0%) females. The mean age of the participants was 67.73 years (standard deviation [SD] = 4.88, range: 60–90 years). The overall prevalence of depression in this population was 11.6% (9.0% of male and 13.8% of females). Characteristics associated with a higher risk of depression include being female, lower education level, low household income per month, being unemployed, living alone, lacking social activities, physical inactivity, and longer sleep duration (p < 0.05) (Table 2).

3.2. Factor Loading for Dietary Patterns

The factor-loading matrices for each dietary pattern are presented in Table 3. Both the KMO (0.802) and the Bartlett’s test (p < 0.001) showed the adequacy of the correlation matrices among the variables for PCA. Four dietary patterns were identified: (1) labeled vegetable-fruit pattern, which was loaded by high positive factor loading on tubers, fruits, bacteria and algae, legumes, vegetables, and nuts; (2) labeled animal food pattern, which was loaded by high positive factor loading on poultry meat, offal, seafood, and red meat; (3) labeled processed food pattern, which was loaded by high positive factor loading on fried foods, snacks, and pickles; and (4) labeled milk-egg pattern, which was loaded by high positive factor loading on dairy products, eggs, and beverages. These four dietary patterns explained 39.87% of the variance of the food groups, of which vegetables-fruits pattern, animal foods pattern, processed foods pattern and milk-eggs pattern accounted of the total variance in food intakes for 14.71%, 11.19%, 7.43%, and 6.54%, respectively. The eigenvalues of these four major dietary patterns were 3.142, 1.393, 1.179 and 1.064, respectively. The inflammatory dietary pattern, with both WBC count and NLR as response variables, was identified using RRR. For this dietary pattern, higher scores indicated a higher intake of fried foods, snacks, beverages, and pickles. This dietary pattern was labeled the inflammatory dietary pattern and explained 6.23% of the food groups and 0.70% of the response variables.

3.3. Associations between Dietary Patterns and Depression

With an increase in the quartiles of the vegetable-fruit pattern, depressive symptoms were found to decrease (p < 0.05). The pervasive affective, physiological, psychomotor, and psychological scores showed similar trends (p < 0.05). Participants in the highest quartile of animal food patterns had the lowest SDS, physiological, psychomotor, and psychological scores (p < 0.05). Moreover, participants in the highest quartile of the milk-egg pattern had the lowest SDS, pervasive affective, psychomotor, and psychological scores (p < 0.05). However, participants in the lowest quartile of processed food pattern and inflammatory dietary pattern had the lowest SDS, pervasive affective, physiological, psychomotor, and psychological scores (p < 0.05) (Table 4).
The baseline characteristics of the participants according to the quartiles of each dietary pattern are shown in Table S1. The multivariate odds ratios (ORs) (95% CIs) for depressive symptoms across the quartiles of each dietary pattern are shown in Table 5. After the final adjustment for possible confounding factors, compared with the first quartile of vegetable-fruit pattern, the other three quartiles were significantly associated with a decreased risk of geriatric depression: the second quartile (OR: 0.62, 95% CI: 0.46–0.83, p < 0.05), third quartile (OR: 0.54, 95% CI: 0.38–0.75, p < 0.05), and fourth quartile (OR: 0.39, 95% CI: 0.26–0.57, p < 0.05). Compared with the first quartile of animal food patterns, ORs in the third and fourth quartiles were 0.69 (95% CI: 0.50–0.95, p < 0.05), 0.58 (95% CI: 0.41–0.82, p < 0.05), respectively. Compared with the first quartile of inflammatory dietary pattern, the risk estimates of geriatric depression for the second, third, and fourth quartiles were 1.71 (95% CI: 1.23–2.38, p < 0.05), 1.70 (95% CI: 1.22–2.36, p < 0.05), and 1.44 (95% CI: 1.03–2.03, p < 0.05), respectively. However, no significant associations were found between processed food patterns, milk–egg patterns, and depression.

4. Discussion

Previous studies have reported that the prevalence of late-life depression was 7% in the world, 17.1% in the population over 75 years old, and 19.47% in Western countries [1,27,28]. In the present study, the prevalence of depressive symptoms was 11.6% among the older adults in rural Tianjin, China. This study identified four dietary patterns (vegetables-fruit, animal food, processed food, and milk-egg) and one inflammatory pattern. This study found that vegetable-fruit and animal food patterns were associated with a decreased risk of depressive symptoms, whereas an inflammatory dietary pattern was associated with an increased risk of depression. Several previous studies reported that a healthy dietary pattern characterized by a high intake of vegetables, fruits, whole grains, olive oil, fish, soy, poultry, and low-fat dairy was associated with a lower risk of depression [2,12,29]. Moreover, an inverse dose-response relationship was found between depression and fruit, nuts, monounsaturated-to-saturated-fatty-acids ratio, and legumes in the Structured Clinical Interview for the Diagnostic and Statistical Manual of Mental Disorders-Fourth Edition [30]. Similar associations for plant foods and depressive symptoms were found in Australia [31]; a diet with a high intake of vegetables, fruit, soy products, mushrooms, and tea was related to lower depressive symptoms in Japan [32], and dietary patterns with a high intake of vegetables, fish, and fruit were related to lower depressive symptoms in Britain [33]. The Mediterranean dietary pattern, which mainly consists of green leafy vegetables, fruit and nuts, legumes, olive oil, cereals, red wine, fish and low dietary intakes of meat products and dairy, has been though to reduce depressive symptoms [7,10]. Several possible reasons have been reported for the effect of healthy dietary patterns on the lower risk of depression. Antioxidant compounds (e.g., vitamins C and E), anti-inflammatory compounds (e.g., choline, folate and curcumin), and nutrients that influence the gut microbiota (e.g., fiber and polyphenols) found in vegetables and fruits can reduce the risk of depression [34,35,36]. In addition, nuts containing sufficient amounts of tryptophan, vitamin B, flavonoids and polyunsaturated fatty acids have antidepression effects [9,20,37]. Zinc, iron, and selenium rich in meat and offal are cofactors for antioxidant systems, which decrease the risk of depression [9,34,38]. Tryptophan, which is found mostly in chicken, tuna, nuts, bananas, milk, and cheese, is an important component of neuroactive molecules and is converted to serotonin, which has antidepressant effects [9,10,11,12]. Omega-3 fatty acids and polyunsaturated fatty acids (e.g., docosahexaenoic acid, eicosapentaenoic acid and alpha-linoleic acid), which have anti-inflammatory properties and are abundant in fish, have also been found to reduce the risk of depression [7,12,36].
A pro-inflammatory diet was associated with an increased risk of depression symptoms, and the risk of depression was reduced by an anti-inflammatory diet such as a Mediterranean diet in longitudinal observational cohorts and meta-analyses [10,14,35,39]. However, these findings are inconsistent. A previous study did not find a longitudinal association between inflammatory dietary patterns and a high risk of depressive symptoms in older Italian individuals [13]. Moreover, several studies showed the higher dietary inflammatory index (DII) related with higher risk of depressive symptoms [15,40]. The potential mechanisms include pro-inflammatory nutrients in the pro-inflammatory foods that activate the innate immune system and then cause low-grade inflammation and mental health disorders, which could affect depressive symptoms by affecting neuronal function and synaptic plasticity [2,3,14]. Previous studies have reported that a high intake of pro-inflammatory foods was associated with increased concentrations of inflammatory cytokines (e.g., C-reactive protein, interleukin-6 and interleukin-17) and oxidative stress markers (e.g., malondialdehyde and 8-F2-isoprostanes), impaired neurogenesis and lower level of brain-derived neurotrophic factor (BDNF), which are all correlated with mental health disorders. In contrast, a high consumption of anti-inflammatory foods was associated with reduced concentrations of inflammatory and oxidative stress markers, and a beneficial effect on BDNF expression against depressive symptoms [9,13,14].
In contrast, there was no relationship between processed food patterns, milk–egg patterns, and depression, which is consistent with two previous studies [41,42]. In fact, unhealthy dietary patterns characterized by a high intake of fast food, sweet snacks, beverages, dairy products, whole grains, coffee, nuts, and eggs were not related to depression [41]. Similarly, there was no association between depression and a dietary pattern characterized by a high intake of fruit juice, vegetables, nuts, grains, pizza, pasta dishes, chocolates and sweets, snacks, processed meat, or high-fat dairy [42]. In line with this, three meta-analyses showed that unhealthy dietary patterns were associated with an increased risk of depressive symptoms of depression [7,12,43], and a longitudinal study showed that high consumption of processed foods was frequently associated with increases in depressive symptoms [33].
To our knowledge, this is the first study to have investigated the association between dietary patterns and depression symptoms in rural older Chinese individuals and the association between inflammatory dietary patterns and depression in older Chinese. Another strength of this study was that adjusting for several sociodemographic variables reduced the likelihood of confounding. However, some potential limitations of this study warrant consideration. First, recall bias was possible because data on dietary intake were collected using the FFQ. Second, although several covariates were involved in this study, more confounding factors (e.g., family support, smoking, marriage, cardiovascular, dental, clinical, pharmacological status and other biochemical parameters) need to be evaluated in future studies. Finally, the present study used WBC count and NLR as response variables to identify the inflammatory dietary pattern, which may not be good markers. In subsequent follow-ups, other inflammatory cytokines should be considered and included in the analysis of inflammatory dietary pattern.

5. Conclusions

Geriatric depression is a serious mental health disorder in rural China. This study on the association between dietary patterns and depressive symptoms showed that the vegetables-fruit and animal food patterns were associated with a decreased risk of depression, and inflammatory dietary pattern was associated with an increased risk of depression. However, further investigation is required to verify the underlying mechanisms.

Supplementary Materials

The following supporting information can be downloaded at: https://www.mdpi.com/article/10.3390/nu14173538/s1, Table S1: Characteristics of the study participants by quartile categories of dietary pattern scores

Author Contributions

Conceptualization, J.Y. and G.H.; Data curation, Q.L., J.F., Z.L. and G.Z.; Formal analysis, J.Y., Q.R., H.L. (Hongyan Lin), C.S., Y.Z. and Y.C.; Funding acquisition, G.H.; Investigation, Q.R., H.L. (Hongyan Lin), Q.L., J.F., C.S., Z.L., G.Z. and G.W.; Methodology, J.Y., Q.R., H.L. (Hongyan Lin), W.L., F.M., H.L. (Huan Liu) and X.Z.; Project administration, Y.D., G.W. and G.H.; Supervision, G.H.; Writing—original draft, J.Y.; Writing—review & editing, J.Y., W.L., F.M., Y.Z., Y.D., H.L. (Huan Liu), X.Z., Y.C. and G.H. All authors have read and agreed to the published version of the manuscript.

Funding

This research was funded by National Natural Science Foundation of China, grant number 81730091 and National Key R&D Program of China, grant number: 2022YFC2010103.

Institutional Review Board Statement

The study was conducted in accordance with the Declaration of Helsinki, and approved by the Ethics Committee of Tianjin Medical University, China (no. TMUhMEC2018013) for studies involving humans.

Informed Consent Statement

Informed consent was obtained from all subjects involved in the study.

Data Availability Statement

The data presented in this study are available upon reasonable request from the corresponding author. The data are not publicly available due to data safety reasons.

Acknowledgments

We appreciate all of participants who enrolled in this study.

Conflicts of Interest

The authors declare no conflict of interest.

Abbreviations

The following abbreviations are used in this manuscript:
ANOVAanalysis of variance
BDNFbrain-derived neurotrophic factor
CIconfidence interval
CNYChinese Yuan
FFQfood frequency questionnaire
KMOKaiser-Meyer-Olkin
NLRneutrophil to lymphocyte ratio
ORodds ratio
PCAprincipal component analysis
RRRreduced-rank regression
SDstandard deviation
SDSself-rating depression scale
WBCwhite blood cell

References

  1. World Health Organization. Depression and Other Common Mental Disorders: Global Health Estimates; World Health Organization: Geneva, Switzerland, 2017. [Google Scholar]
  2. Vicinanza, R.; Bersani, F.S.; D’Ottavio, E.; Murphy, M.; Bernardini, S.; Crisciotti, F.; Frizza, A.; Mazza, V.; Biondi, M.; Troisi, G.; et al. Adherence to Mediterranean diet moderates the association between multimorbidity and depressive symptoms in older adults. Arch. Gerontol. Geriatr. 2020, 88, 104022. [Google Scholar] [PubMed]
  3. Verhaak, P.F.; Dekker, J.H.; de Waal, M.W.; van Marwijk, H.W.; Comijs, H.C. Depression, disability and somatic diseases among elderly. J. Affect. Disord. 2014, 167, 187–191. [Google Scholar] [PubMed]
  4. Matison, A.P.; Mather, K.A.; Flood, V.M.; Reppermund, S. Associations between nutrition and the incidence of depression in middle-aged and older adults: A systematic review and meta-analysis of prospective observational population-based studies. Ageing Res. Rev. 2021, 70, 101403. [Google Scholar]
  5. Zhang, L.; Xu, Y.; Nie, H.; Zhang, Y.; Wu, Y. The prevalence of depressive symptoms among the older in China: A meta-analysis. Int. J. Geriatr. Psychiatry 2012, 27, 900–906. [Google Scholar] [PubMed]
  6. Gao, S.; Jin, Y.; Unverzagt, F.W.; Liang, C.; Hall, K.S.; Ma, F.; Murrell, J.R.; Cheng, Y.; Matesan, J.; Li, P.; et al. Correlates of depressive symptoms in rural elderly Chinese. Int. J. Geriatr. Psychiatry 2009, 24, 1358–1366. [Google Scholar]
  7. Altun, A.; Brown, H.; Szoeke, C.; Goodwill, A.M. The Mediterranean dietary pattern and depression risk: A systematic review. Neurol. Psychiatry Brain Res. 2019, 33, 1–10. [Google Scholar]
  8. Ullah, H.; Khan, A.; Rengasamy, K.R.R.; Di Minno, A.; Sacchi, R.; Daglia, M. The Efficacy of S-Adenosyl Methionine and Probiotic Supplementation on Depression: A Synergistic Approach. Nutrients 2022, 14, 2751. [Google Scholar]
  9. Marx, W.; Lane, M.; Hockey, M.; Aslam, H.; Berk, M.; Walder, K.; Borsini, A.; Firth, J.; Pariante, C.M.; Berding, K.; et al. Diet and depression: Exploring the biological mechanisms of action. Mol. Psychiatry 2021, 26, 134–150. [Google Scholar]
  10. Yin, W.; Löf, M.; Chen, R.; Hultman, C.M.; Fang, F.; Sandin, S. Mediterranean diet and depression: A population-based cohort study. Int. J. Behav. Nutr. Phys. Act. 2021, 18, 153. [Google Scholar]
  11. Wang, C.J.; Yang, T.F.; Wang, G.S.; Zhao, Y.Y.; Yang, L.J. Association between dietary patterns and depressive symptoms among middle-aged adults in China in 2016–2017. Psychiatry Res. 2018, 260, 123–129. [Google Scholar]
  12. Li, Y.; Lv, M.R.; Wei, Y.J.; Sun, L.; Zhang, J.X.; Zhang, H.G.; Li, B. Dietary patterns and depression risk: A meta-analysis. Psychiatry Res. 2017, 253, 373–382. [Google Scholar] [CrossRef]
  13. Vermeulen, E.; Brouwer, I.A.; Stronks, K.; Bandinelli, S.; Ferrucci, L.; Visser, M.; Nicolaou, M. Inflammatory dietary patterns and depressive symptoms in Italian older adults. Brain Behav. Immun. 2018, 67, 290–298. [Google Scholar] [CrossRef]
  14. Tolkien, K.; Bradburn, S.; Murgatroyd, C. An anti-inflammatory diet as a potential intervention for depressive disorders: A systematic review and meta-analysis. Clin. Nutr. 2019, 38, 2045–2052. [Google Scholar] [CrossRef]
  15. Jorgensen, D.; White, G.E.; Sekikawa, A.; Gianaros, P. Higher dietary inflammation is associated with increased odds of depression independent of Framingham Risk Score in the National Health and Nutrition Examination Survey. Nutr. Res. 2018, 54, 23–32. [Google Scholar] [CrossRef]
  16. Shin, D.; Kwon, S.C.; Kim, M.H.; Lee, K.W.; Choi, S.Y.; Shivappa, N.; Hébert, J.R.; Chung, H.K. Inflammatory potential of diet is associated with cognitive function in an older adult Korean population. Nutrition 2018, 55, 56–62. [Google Scholar] [CrossRef]
  17. Quirk, S.E.; Williams, L.J.; O’Neil, A.; Pasco, J.A.; Jacka, F.N.; Housden, S.; Berk, M.; Brennan, S.L. The association between diet quality, dietary patterns and depression in adults: A systematic review. BMC Psychiatry 2013, 13, 175. [Google Scholar] [CrossRef]
  18. Yang, Y.; Wang, G.; Pan, X. China Food Composition, 2nd ed.; Peking University Medical Press: Beijing, China, 2009. [Google Scholar]
  19. Weikert, C.; Schulze, M.B. Evaluating dietary patterns: The role of reduced rank regression. Curr. Opin. Clin. Nutr. Metab. Care 2016, 19, 341–346. [Google Scholar] [CrossRef]
  20. Cao, L.; Liu, Y.; Liang, X.; Zheng, Y.; Li, W.; Yan, J.; Huang, G. Association between dietary patterns during the third trimester and the risk of postpartum depression in China. J. Affect. Disord. 2020, 264, 370–372. [Google Scholar] [CrossRef]
  21. Zhang, C.; Xue, Y.; Zhao, H.; Zheng, X.; Zhu, R.; Du, Y.; Zheng, J.; Yang, T. Prevalence and related influencing factors of depressive symptoms among empty-nest elderly in Shanxi, China. J. Affect. Disord. 2019, 245, 750–756. [Google Scholar] [CrossRef]
  22. Gu, Y.; Li, X.; Zhang, Q.; Liu, L.; Meng, G.; Wu, H.; Zhang, S.; Wang, Y.; Zhang, T.; Wang, X.; et al. Grip strength and depressive symptoms in a large-scale adult population: The TCLSIH cohort study. J. Affect. Disord. 2021, 279, 222–228. [Google Scholar] [CrossRef]
  23. Zung, W.W. The measurement of affects: Depression and anxiety. Mod. Probl. Pharmacopsychiatr. 1974, 7, 170–188. [Google Scholar]
  24. Zung, W.W.; Richards, C.B.; Short, M.J. Self-rating depression scale in an outpatient clinic: Further validation of the SDS. Arch. Gen. Psychiatry 1965, 13, 508–515. [Google Scholar] [CrossRef]
  25. Jokelainen, J.; Timonen, M.; Keinänen-Kiukaanniemi, S.; Härkönen, P.; Jurvelin, H.; Suija, K. Validation of the Zung self-rating depression scale (SDS) in older adults. Scand. J. Prim. Health Care 2019, 37, 353–357. [Google Scholar] [CrossRef]
  26. Lin, H.; Jin, M.; Liu, Q.; Yue, D.; Fu, J.; Sun, C.; Ma, F.; Li, W.; Liu, H.; Zhang, X.; et al. Gender-specific prevalence and influencing factors of depression in elderly in rural China: A cross-sectional study. J. Affect. Disord 2021, 288, 99–106. [Google Scholar] [CrossRef]
  27. Luppa, M.; Sikorski, C.; Luck, T.; Ehreke, L.; Konnopka, A.; Wiese, B.; Weyerer, S.; Konig, H.H.; Riedel-Heller, S.G. Age- and gender-specific prevalence of depression in latest-life–systematic review and meta-analysis. J. Affect. Disord. 2012, 136, 212–221. [Google Scholar] [CrossRef]
  28. Volkert, J.; Schulz, H.; Harter, M.; Wlodarczyk, O.; Andreas, S. The prevalence of mental disorders in older people in Western countries-a meta-analysis. Ageing Res. Rev. 2013, 12, 339–353. [Google Scholar] [CrossRef]
  29. Adjibade, M.; Assmann, K.E.; Andreeva, V.A.; Lemogne, C.; Hercberg, S.; Galan, P.; Kesse-Guyot, E. Prospective association between adherence to the mediterranean diet and risk of depressive symptoms in the French SU. VI. MAX cohort. Eur. J. Nutr. 2018, 57, 1225–1235. [Google Scholar] [CrossRef]
  30. Hershey, M.S.; Sanchez-Villegas, A.; Sotos-Prieto, M.; Fernandez-Montero, A.; Pano, O.; Lahortiga-Ramos, F.; Martínez-González, M.Á.; Ruiz-Canela, M. The Mediterranean lifestyle and the risk of depression in middle-aged adults. J. Nutr. 2022, 152, 227–234. [Google Scholar] [CrossRef]
  31. Crichton, G.E.; Bryan, J.; Hodgson, J.M.; Murphy, K.J. Mediterranean diet adherence and self-reported psychological functioning in an Australian sample. Appetite 2013, 70, 53–59. [Google Scholar] [CrossRef]
  32. Miki, T.; Kochi, T.; Kuwahara, K.; Eguchi, M.; Kurotani, K.; Tsuruoka, H.; Ito, R.; Kabe, I.; Kawakami, N.; Mizoue, T.; et al. Dietary patterns derived by reduced rank regression (RRR) and depressive symptoms in Japanese employees: The Furukawa nutrition and health study. Psychiatry Res. 2015, 229, 214–219. [Google Scholar] [CrossRef]
  33. Akbaraly, T.N.; Brunner, E.J.; Ferrie, J.E.; Marmot, M.G.; Kivimaki, M.; Singh-Manoux, A. Dietary pattern and depressive symptoms in middle age. Br. J. Psychiatry 2009, 195, 408–413. [Google Scholar] [CrossRef] [PubMed]
  34. Das, A.; Cumming, R.G.; Naganathan, V.; Ribeiro, R.V.; Le Couteur, D.G.; Handelsman, D.J.; Waite, L.M.; Hirani, V. The association between antioxidant intake, dietary pattern and depressive symptoms in older Australian men: The Concord Health and Ageing in Men Project. Eur. J. Nutr. 2021, 60, 443–454. [Google Scholar] [CrossRef] [PubMed]
  35. Bayes, J.; Schloss, J.; Sibbritt, D. Effects of Polyphenols in a Mediterranean Diet on Symptoms of Depression: A Systematic Literature. Adv. Nutr. 2020, 11, 602–615. [Google Scholar] [CrossRef] [PubMed]
  36. Moore, K.; Hughes, C.F.; Ward, M.; Hoey, L.; McNulty, H. Diet, nutrition and the ageing brain: Current evidence and new directions. Proc. Nutr. Soc. 2018, 77, 152–163. [Google Scholar] [CrossRef]
  37. Su, Q.; Yu, B.; He, H.; Zhang, Q.; Meng, G.; Wu, H.; Du, H.; Liu, L.; Shi, H.; Xia, Y.; et al. Nut Consumption is associated with depressive symptoms among Chinese adults. Depress. Anxiety 2016, 33, 1065–1072. [Google Scholar] [CrossRef]
  38. Wang, J.; Um, P.; Dickerman, B.A.; Liu, J. Zinc, Magnesium, Selenium and Depression: A Review of the Evidence, Potential Mechanisms and Implications. Nutrients 2018, 10, 58410. [Google Scholar] [CrossRef]
  39. Masana, M.F.; Haro, J.M.; Mariolis, A.; Piscopo, S.; Valacchi, G.; Bountziouka, V.; Anastasiou, F.; Zeimbekis, A.; Tyrovola, D.; Gotsis, E.; et al. Mediterranean diet and depression among older individuals: The multinational MEDIS study. Exp. Gerontol. 2018, 110, 67–72. [Google Scholar] [CrossRef]
  40. Bergmans, R.S.; Malecki, K.M. The association of dietary inflammatory potential with depression and mental well-being among U.S. adults. Prev. Med. 2017, 99, 313–319. [Google Scholar] [CrossRef]
  41. Chan, R.; Chan, D.; Woo, J. A prospective cohort study to examine the association between dietary patterns and depressive symptoms in older Chinese people in Hong Kong. PLoS ONE 2014, 9, e105760. [Google Scholar] [CrossRef]
  42. Gougeon, L.; Payette, H.; Morais, J.; Gaudreau, P.; Shatenstein, B.; Gray-Donald, K. Dietary patterns and incidence of depression in a cohort of communitydwelling older Canadians. J. Nutr. Health Aging 2015, 19, 431–436. [Google Scholar] [CrossRef]
  43. Lane, M.M.; Gamage, E.; Travica, N.; Dissanayaka, T.; Ashtree, D.N.; Gauci, S.; Lotfaliany, M.; O’Neil, A.; Jacka, F.N.; Marx, W. Ultra-Processed Food Consumption and Mental Health: A Systematic Review and Meta-Analysis of Observational Studies. Nutrients 2022, 14, 2568. [Google Scholar] [CrossRef] [PubMed]
Figure 1. Flow diagram of the enrolment in the study.
Nutrients 14 03538 g001
Table 1. Food grouping using in the dietary pattern analysis.
Food GroupsFood Items
Tubers Sweet potato, yam, taro, potato and products
Fruits Stone fruits, pome fruits, melon fruits, berry fruits, citrus fruits and grape
Bacteria and algaeMushroom, fungi, white fungus, kelp, seaweed and other algae
Legumes Soybeans, other beans and soy products
VegetablesLeaf vegetables, root vegetables, stem vegetables, melon and eggplant vegetables and flower vegetables
NutsNuts, walnuts, peanuts, sesame, other nuts and products
Poultry meatChicken, duck, goose
Offal Heart, liver, kidney, lung
Seafood Fish and shellfish
Red meatPork, mutton, lamb, beef
Fried foodsFried dough twist, deep-fried cake, fried dough sticks and instant noodles
Snacks Ice cream, cake, pastry, snacks, butter products, candied fruits, confections and added sugar
Pickles Pickles
GrainsWhole grains and refined grains
Dairy productsMilk, yoghurt and other dairy products
Eggs Eggs, duck eggs and preserved eggs
Beverages Fruit- and vegetable juices, soft beverages, tea, red wine, white spirits, beer and other alcoholic beverages
Table 2. Characteristics of participants with and without depression [Mean ± SD/n (%)].
Characteristics Total
(n = 3304)
Depression
Yes (n = 384)No (n = 2920)pa
Age (years) 67.73 ± 4.88 67.77 ± 4.85 67.72 ± 4.890.864
Sex Male 1486 (44.98%)134 (9.02%)1352 (90.98%)<0.001
Female 1818 (55.02%)250 (13.75%)1568 (86.25%)
Education (years)<6792 (23.97%)125 (15.78%)667 (84.22%)<0.001
6-1108 (33.54%)134 (12.09%)974 (87.91%)
≥91404 (42.49%)125 (8.90%)1279 (91.10%)
Household income per month (CNY)<50002782 (84.20%)358 (12.87%)2424 (87.13%)<0.001
≥5000522 (15.80%)26 (4.98%)496 (95.02%)
EmploymentEmployed or retired1140 (34.50%)88 (7.72%)1052 (92.28%)<0.001
Unemployed 2164 (65.50%)296 (13.68%)1868 (86.32%)
Living aloneYes245 (7.42%)45 (18.37%)200 (81.63%)0.001
No 3059 (92.58%)339 (11.08%)2720 (88.92%)
Social activitiesYes1063 (32.17%)90 (8.47%)973 (91.53%)<0.001
No 2241 (67.83%)294 (13.12%)1947 (86.88%)
Physical exercisesYes2913 (88.17%)304 (10.44%)2609 (89.56%)<0.001
No 391 (11.83%)80 (20.46%)311 (79.54%)
Sleep duration (h)<658 (1.76%)6 (10.34%)52 (89.66%)0.016
6-944 (28.57%)101 (10.70%)843 (89.30%)
8-1986 (60.11%)223 (11.23%)1763 (88.77%)
≥10316 (9.56%)54 (17.09%)262 (82.91%)
No. chronic diseases01576 (47.70%)190 (12.06%)1386 (87.94%)0.059
11284 (38.86%)131 (10.20%)1153 (89.80%)
≥2444 (13.44%)63 (14.19%)381 (85.81%)
CNY: Chinese Yuan; a analysis using an independent-sample t-test and chi-squared test; participants were divided into two groups according to self-rating depression scale scores: <50 for no depression and ≥50 for depression.
Table 3. Factor loadings of food groups for dietary patterns.
Food GroupsPCARRR
Vegetables-Fruit PatternAnimal Food PatternProcessed Food PatternMilk-Egg PatternInflammatory Dietary Pattern
Tubers 0.6060.114−0.037−0.084−0.232
Fruits 0.5960.0390.0310.2390.297
Bacteria and algae0.5950.1030.196−0.120−0.181
Legumes 0.5730.2570.191−0.117−0.245
Vegetables0.5720.153−0.2030.051−0.209
Nuts0.560−0.0070.1240.153−0.033
Poultry meat0.1570.7710.0620.040−0.145
Offal −0.0740.7580.1280.0140.143
Seafood 0.3240.615−0.0320.013−0.099
Red meat0.3600.439−0.0840.045−0.202
Fried foods−0.0110.1300.6900.0600.516
Snacks 0.0020.1110.6020.3640.372
Pickles 0.2960.0460.406−0.3000.305
Grains0.038−0.0750.256−0.120−0.009
Dairy products0.319−0.0660.0020.601−0.086
Eggs −0.0300.0780.1200.4420.039
Beverages −0.0230.003−0.1350.4400.348
Explained variation in food groups (%)14.7111.197.436.546.23
Explained variation in WBC count and NLR (%)--------0.70
PCA, principal component analysis; RRR, reduced rank regression; WBC, white blood cell; NLR, neutrophil-to-lymphocyte ratio.
Table 4. Depression self-rating scale score according to categories of dietary patterns (n = 3304, Mean ± SD).
Dietary PatternsQuartiles of Dietary Patternsp
Q1Q2Q3Q4
Vegetables-fruits pattern
n826826826826
SDS score41.04 ± 9.27 38.56 ± 8.97 36.32 ± 9.06 34.96 ± 8.35 <0.001
Pervasive affective2.68 ± 1.07 2.53 ± 1.00 2.42 ± 0.90 2.40 ± 0.85 <0.001
Physiological 13.31 ± 3.01 12.69 ± 3.25 12.11 ± 3.28 11.89 ± 3.09 <0.001
Psychomotor 3.40 ± 1.29 3.10 ± 1.20 2.91 ± 1.20 2.87 ± 1.21 <0.001
Psychological 13.45 ± 4.06 12.52 ± 4.10 11.61 ± 3.92 10.81 ± 3.60 <0.001
Animal foods pattern
n826826826826
SDS score38.23 ± 9.38 39.49 ± 9.58 37.32 ± 9.12 35.85 ± 8.33 <0.001
Pervasive affective2.52 ± 1.00 2.63 ± 1.04 2.43 ± 0.86 2.46 ± 0.95 <0.001
Physiological 12.76 ± 3.26 12.94 ± 3.12 12.29 ± 3.21 12.01 ± 3.15 <0.001
Psychomotor 3.14 ± 1.34 3.20 ± 1.26 3.00 ± 1.17 2.94 ± 1.19 <0.001
Psychological 12.17 ± 4.11 12.82 ± 4.25 12.13 ± 4.06 11.28 ± 3.58 <0.001
Processed foods pattern
n826826826826
SDS score35.39 ± 9.25 39.06 ± 9.57 37.99 ± 8.63 38.44 ± 8.94 <0.001
Pervasive affective2.43 ± 0.91 2.56 ± 1.01 2.49 ± 0.93 2.54 ± 1.01 0.033
Physiological 11.97 ± 3.33 12.82 ± 3.21 12.50 ± 2.94 12.72 ± 3.28 <0.001
Psychomotor 2.86 ± 1.25 3.15 ± 1.24 3.08 ± 1.19 3.19 ± 1.27 <0.001
Psychological 11.05 ± 3.85 12.72 ± 4.18 12.33 ± 4.01 12.30 ± 3.94 <0.001
Milk-eggs pattern
n826826826826
SDS score37.57 ± 9.23 39.08 ± 9.67 37.40 ± 9.01 36.84 ± 8.77 <0.001
Pervasive affective2.50 ± 0.96 2.59 ± 1.04 2.52 ± 0.97 2.42 ± 0.88 0.005
Physiological 12.38 ± 3.14 12.83 ± 3.29 12.40 ± 3.14 12.39 ± 3.24 0.010
Psychomotor 3.07 ± 1.23 3.14 ± 1.23 3.05 ± 1.24 3.02 ± 1.28 0.217
Psychological 12.10 ± 4.10 12.71 ± 4.21 11.95 ± 3.94 11.64 ± 3.85 <0.001
Inflammatory dietary pattern
n831824824825
SDS score35.43 ± 8.91 38.17 ± 9.53 38.70 ± 9.18 38.60 ± 8.82 <0.001
Pervasive affective2.39 ± 0.85 2.50 ± 0.94 2.55 ± 1.02 2.59 ± 1.04 <0.001
Physiological 12.00 ± 3.30 12.58 ± 3.30 12.67 ± 3.05 12.76 ± 3.12 <0.001
Psychomotor 2.87 ± 1.23 3.11 ± 1.25 3.13 ± 1.21 3.17 ± 1.27 <0.001
Psychological 11.09 ± 3.82 12.35 ± 4.21 12.61 ± 4.07 12.35 ± 3.90 <0.001
Q, quartile; SDS: the Self-Rating Depression Scale.
Table 5. Associations between each dietary pattern quartiles and depression [OR (95% CI)].
Dietary PatternsQuartiles of Dietary Patterns
Q1Q2Q3Q4
Vegetables-fruits pattern
n826826826826
Model 1 a1.000.58 (0.44,0.76) *0.46 (0.34,0.61) *0.31 (0.23,0.43) *
Model 2 b1.000.60 (0.44,0.80) *0.47 (0.34,0.65) *0.31 (0.21,0.45) *
Model 3 c1.000.62 (0.46,0.83) *0.54 (0.38,0.75) *0.39 (0.26,0.57) *
Animal foods pattern
n826826826826
Model 1 a1.001.26 (0.96,1.67)0.73 (0.54,0.99) *0.54 (0.39,0.75) *
Model 2 b1.000.94 (0.70,1.26)0.65 (0.47,0.90) *0.51 (0.37,0.72) *
Model 3 c1.000.94 (0.69,1.26)0.69 (0.50,0.95) *0.58 (0.41,0.82) *
Processed foods pattern
n826826826826
Model 1 a1.001.51 (1.11,2.04) *1.08 (0.79,1.44) 1.33 (0.98,1.81)
Model 2 b1.000.86 (0.62,1.21)0.82 (0.59,1.15)1.12 (0.81,1.55)
Model 3 c1.000.92 (0.65,1.28)0.83 (0.59,1.17)1.11 (0.80,1.54)
Milk-eggs pattern
n826826826826
Model 1 a1.001.35 (1.01,1.81) *0.99 (0.73,1.34)0.82 (0.60,1.13)
Model 2 b1.000.87 (0.63,1.22)0.79 (0.58,1.09)0.77 (0.56,1.07)
Model 3 c1.000.93 (0.67,1.30)0.84 (0.61,1.17)0.84 (0.60,1.18)
Inflammatory dietary pattern
n831824824825
Model 1 a1.001.85 (1.34,2.55) *1.87 (1.35,2.58) *1.63 (1.17,2.27) *
Model 2 d1.001.71 (1.23,2.38) *1.70 (1.22,2.36) *1.44 (1.03,2.03) *
Q, quartile; OR, odds ratio; CI, confidence interval. Analysis using logistic regression model. * p < 0.05. a Crude model. b Adjusted for the scores of vegetarian pattern, animal food pattern, processed food pattern, and milk-egg pattern. c Further adjusted for age, sex, education, household income per month, employment, living alone, social activities, physical exercise, sleep duration, no. chronic diseases. d Adjusted for age, sex, education, household income per month, employment, living alone, social activities, physical exercise, sleep duration, No. chronic diseases.
Publisher’s Note: MDPI stays neutral with regard to jurisdictional claims in published maps and institutional affiliations.

