
Disparities in Obesity Rates among Adults: Analysis of 514 Districts in Indonesia

 , , ,
, , ,
Abstract
:1. Background
2. Methods
2.1. Study Design
2.2. Dependent Variables
2.3. Independent Variables
2.4. Data Analysis
3. Results
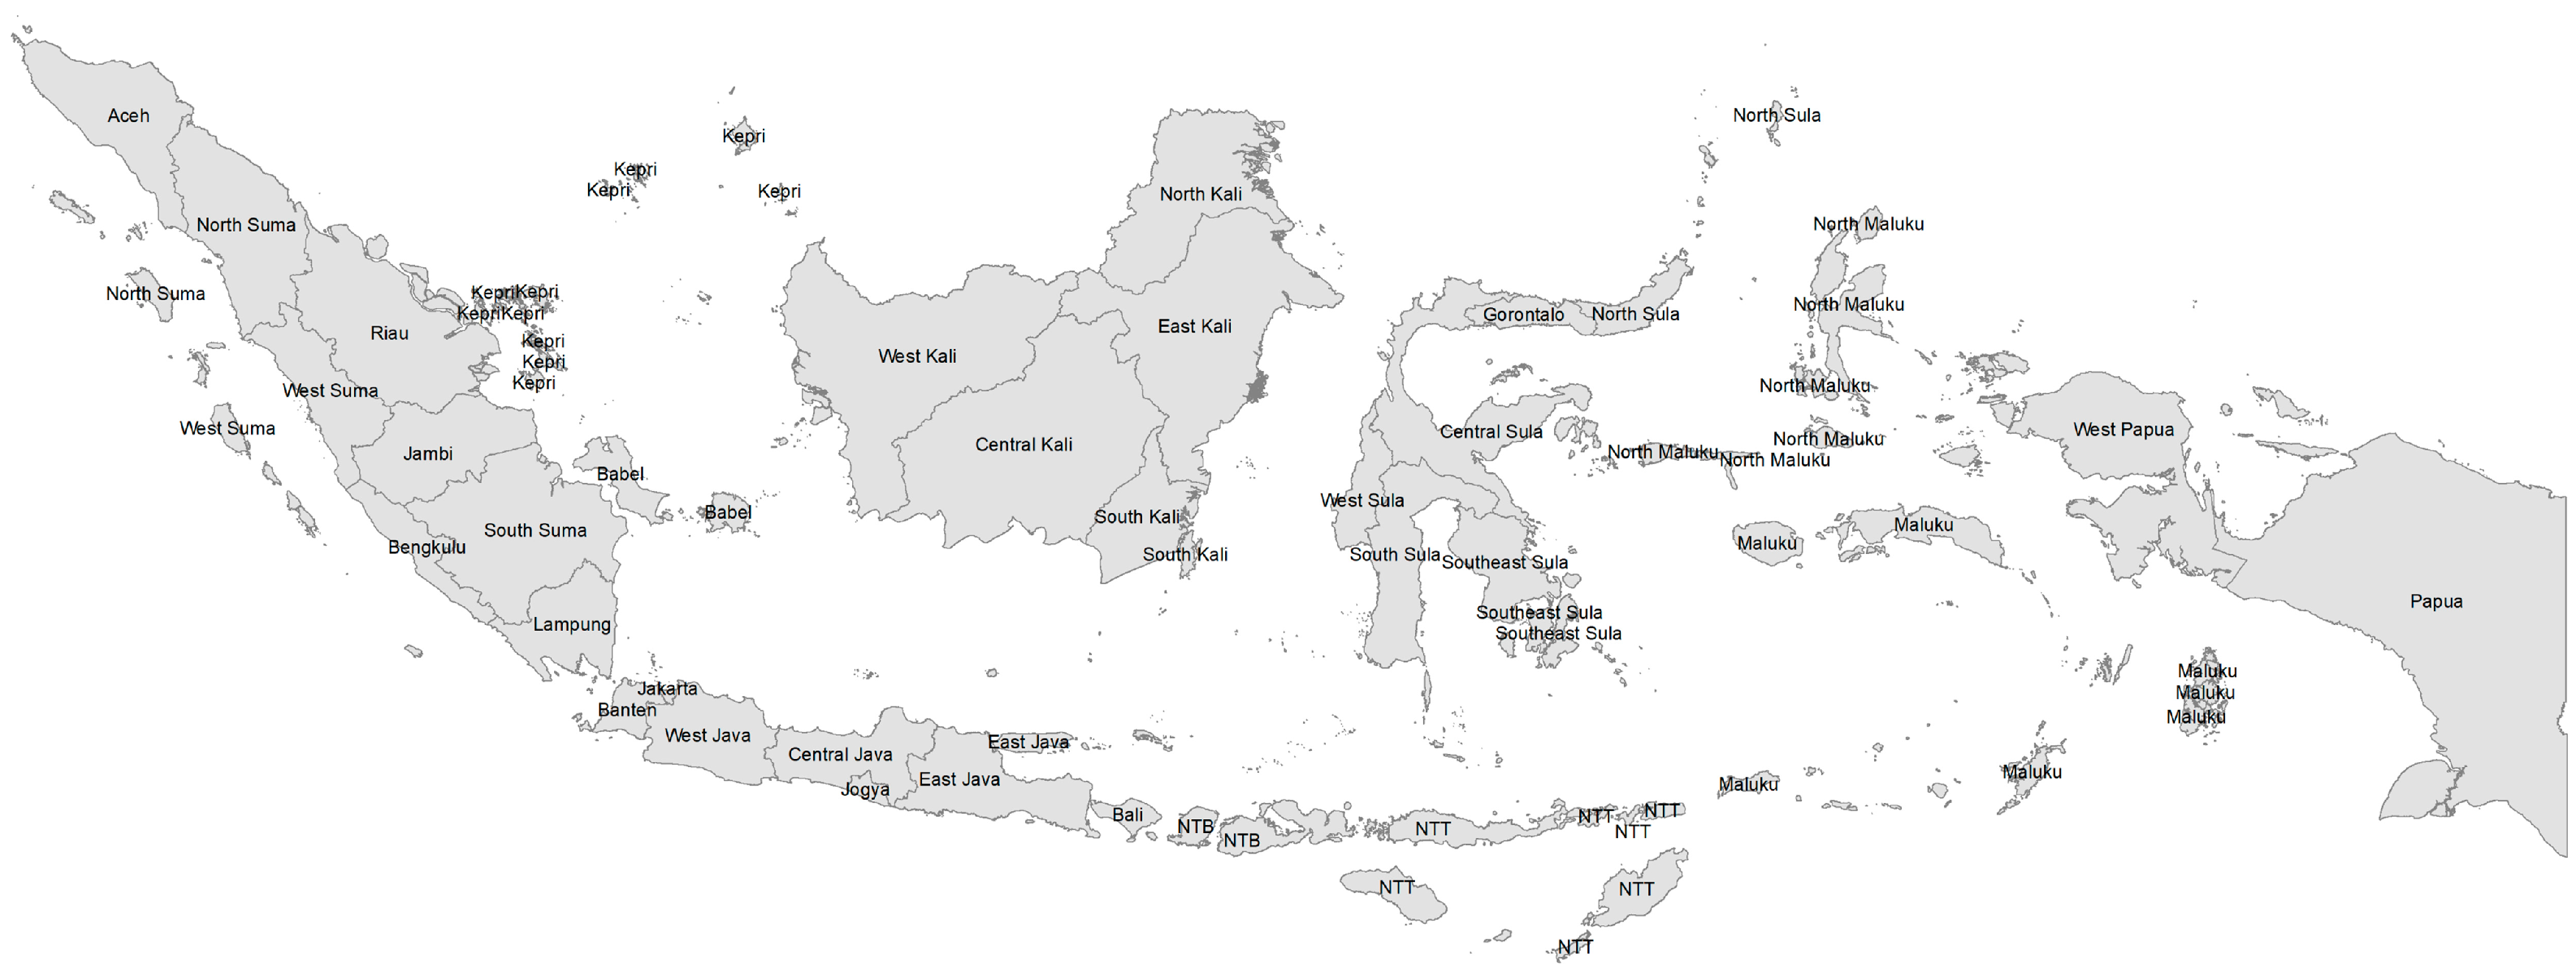
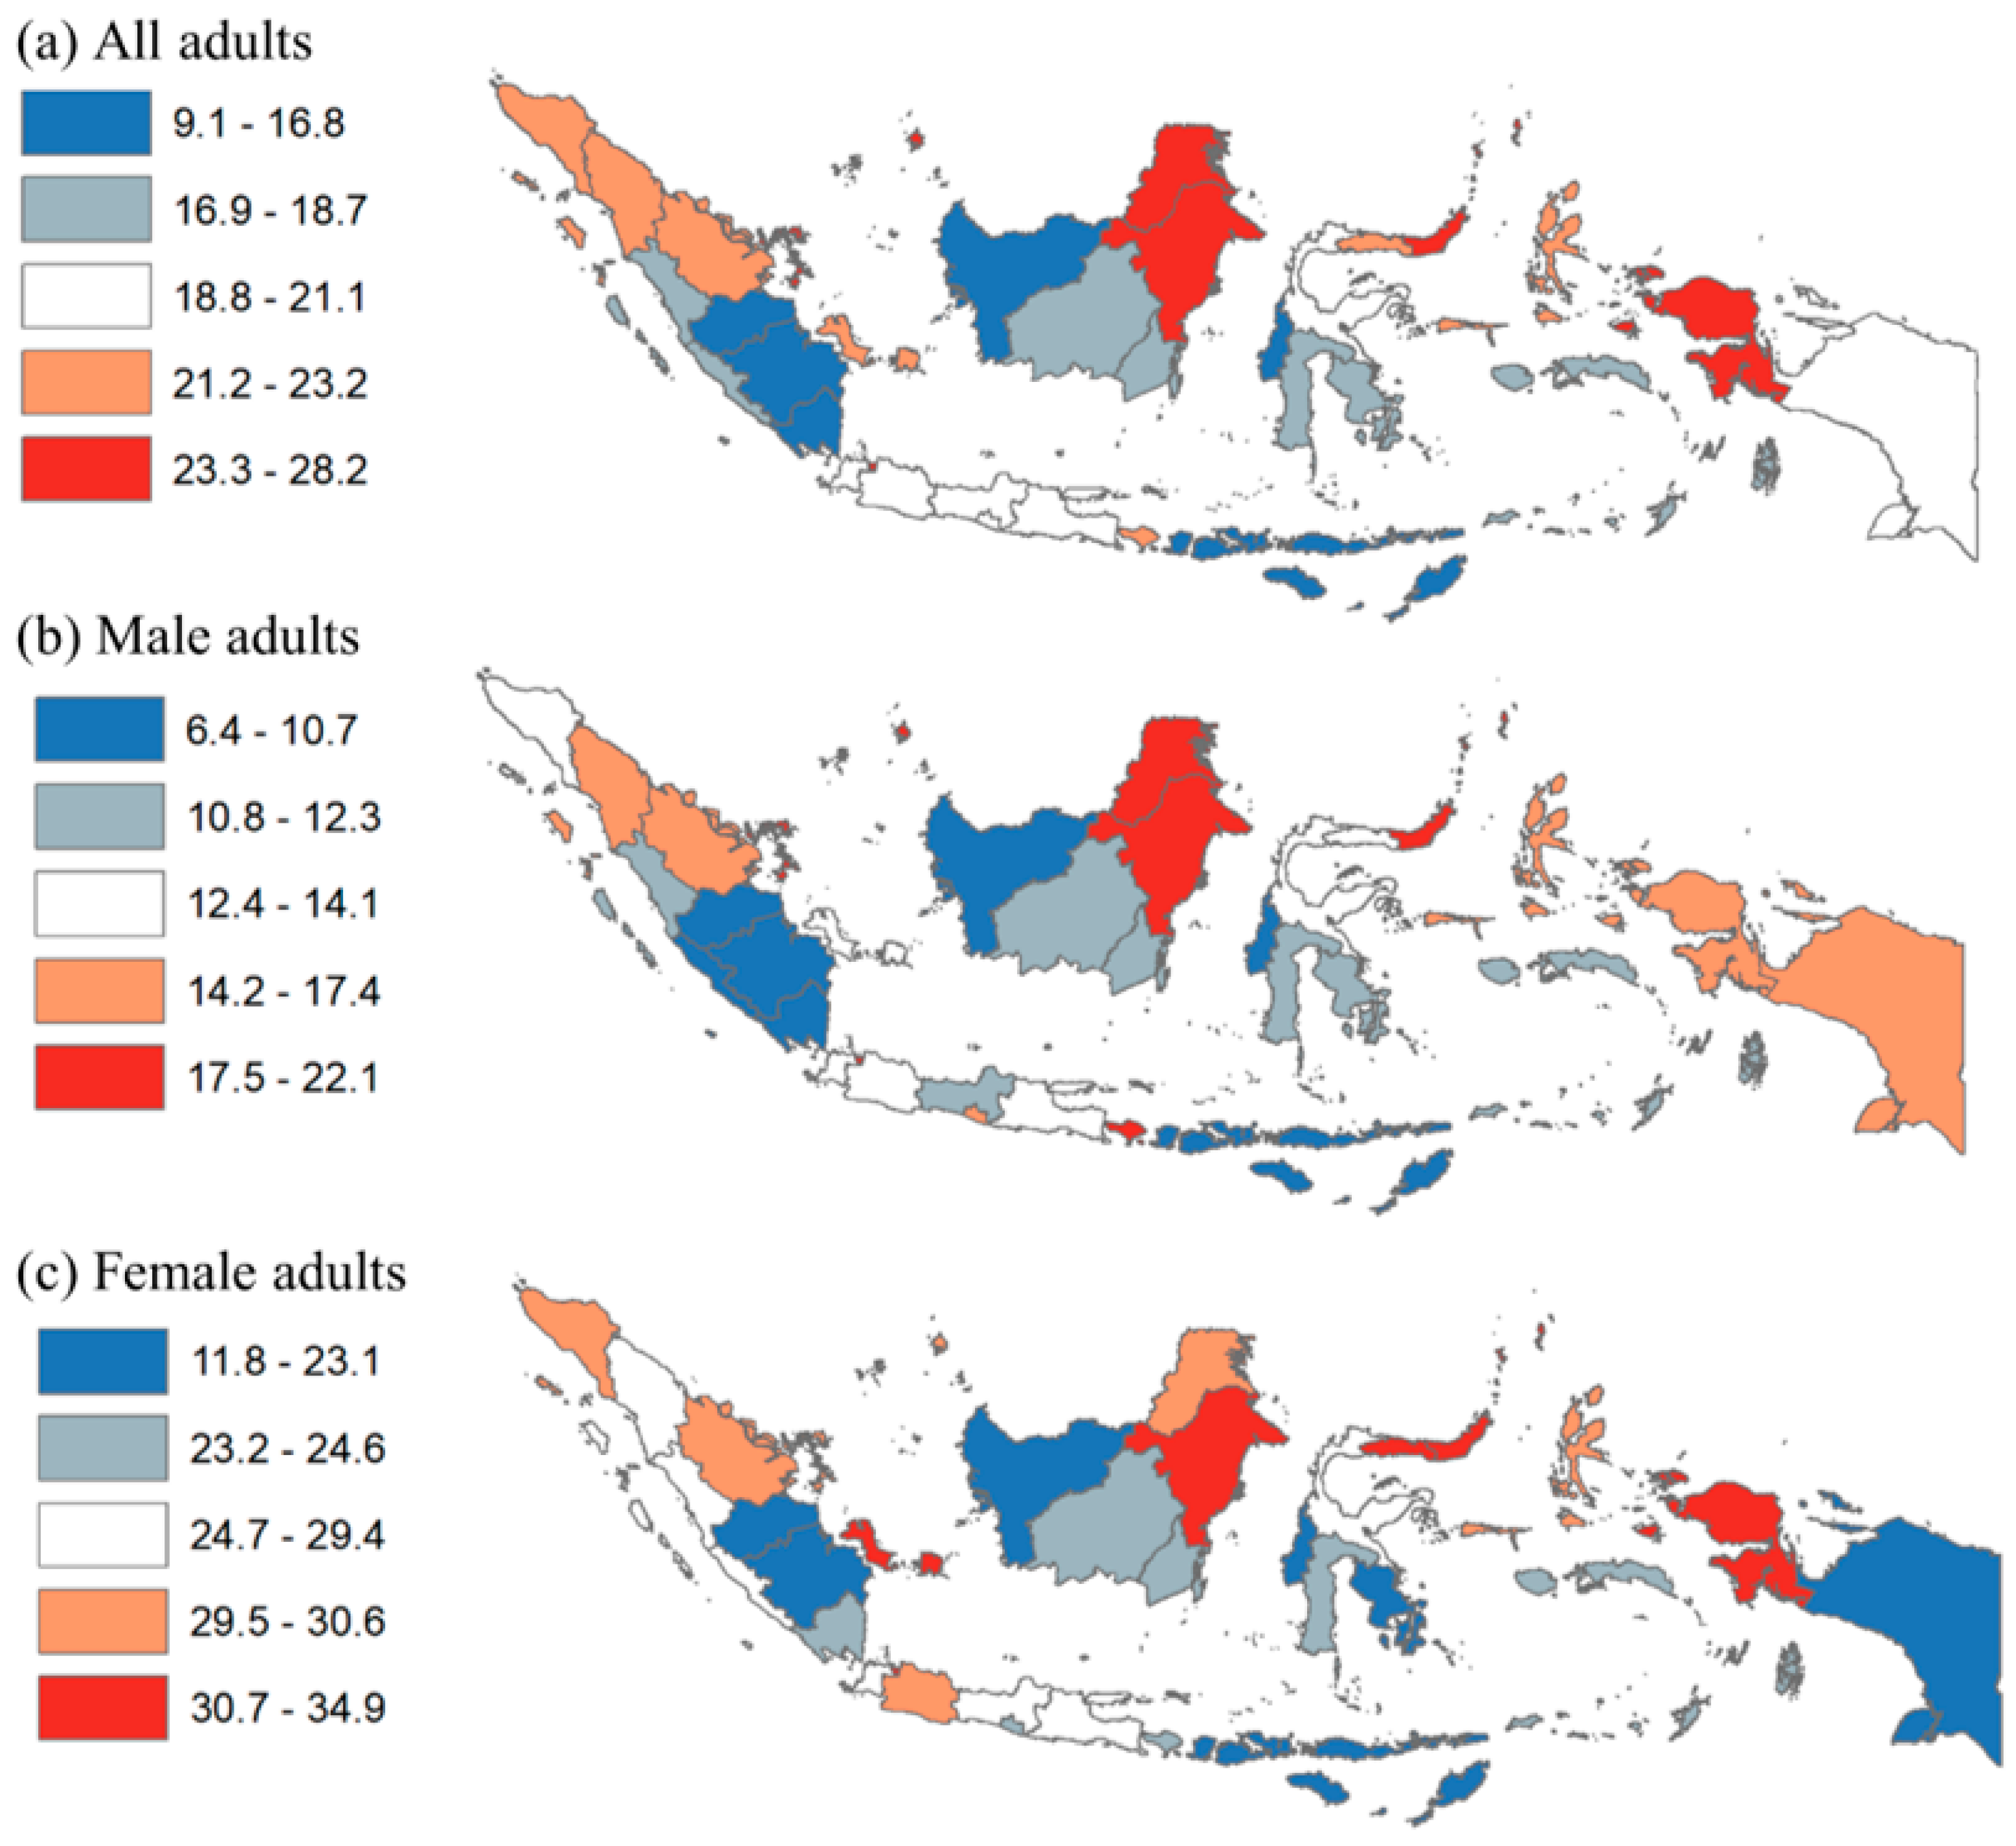
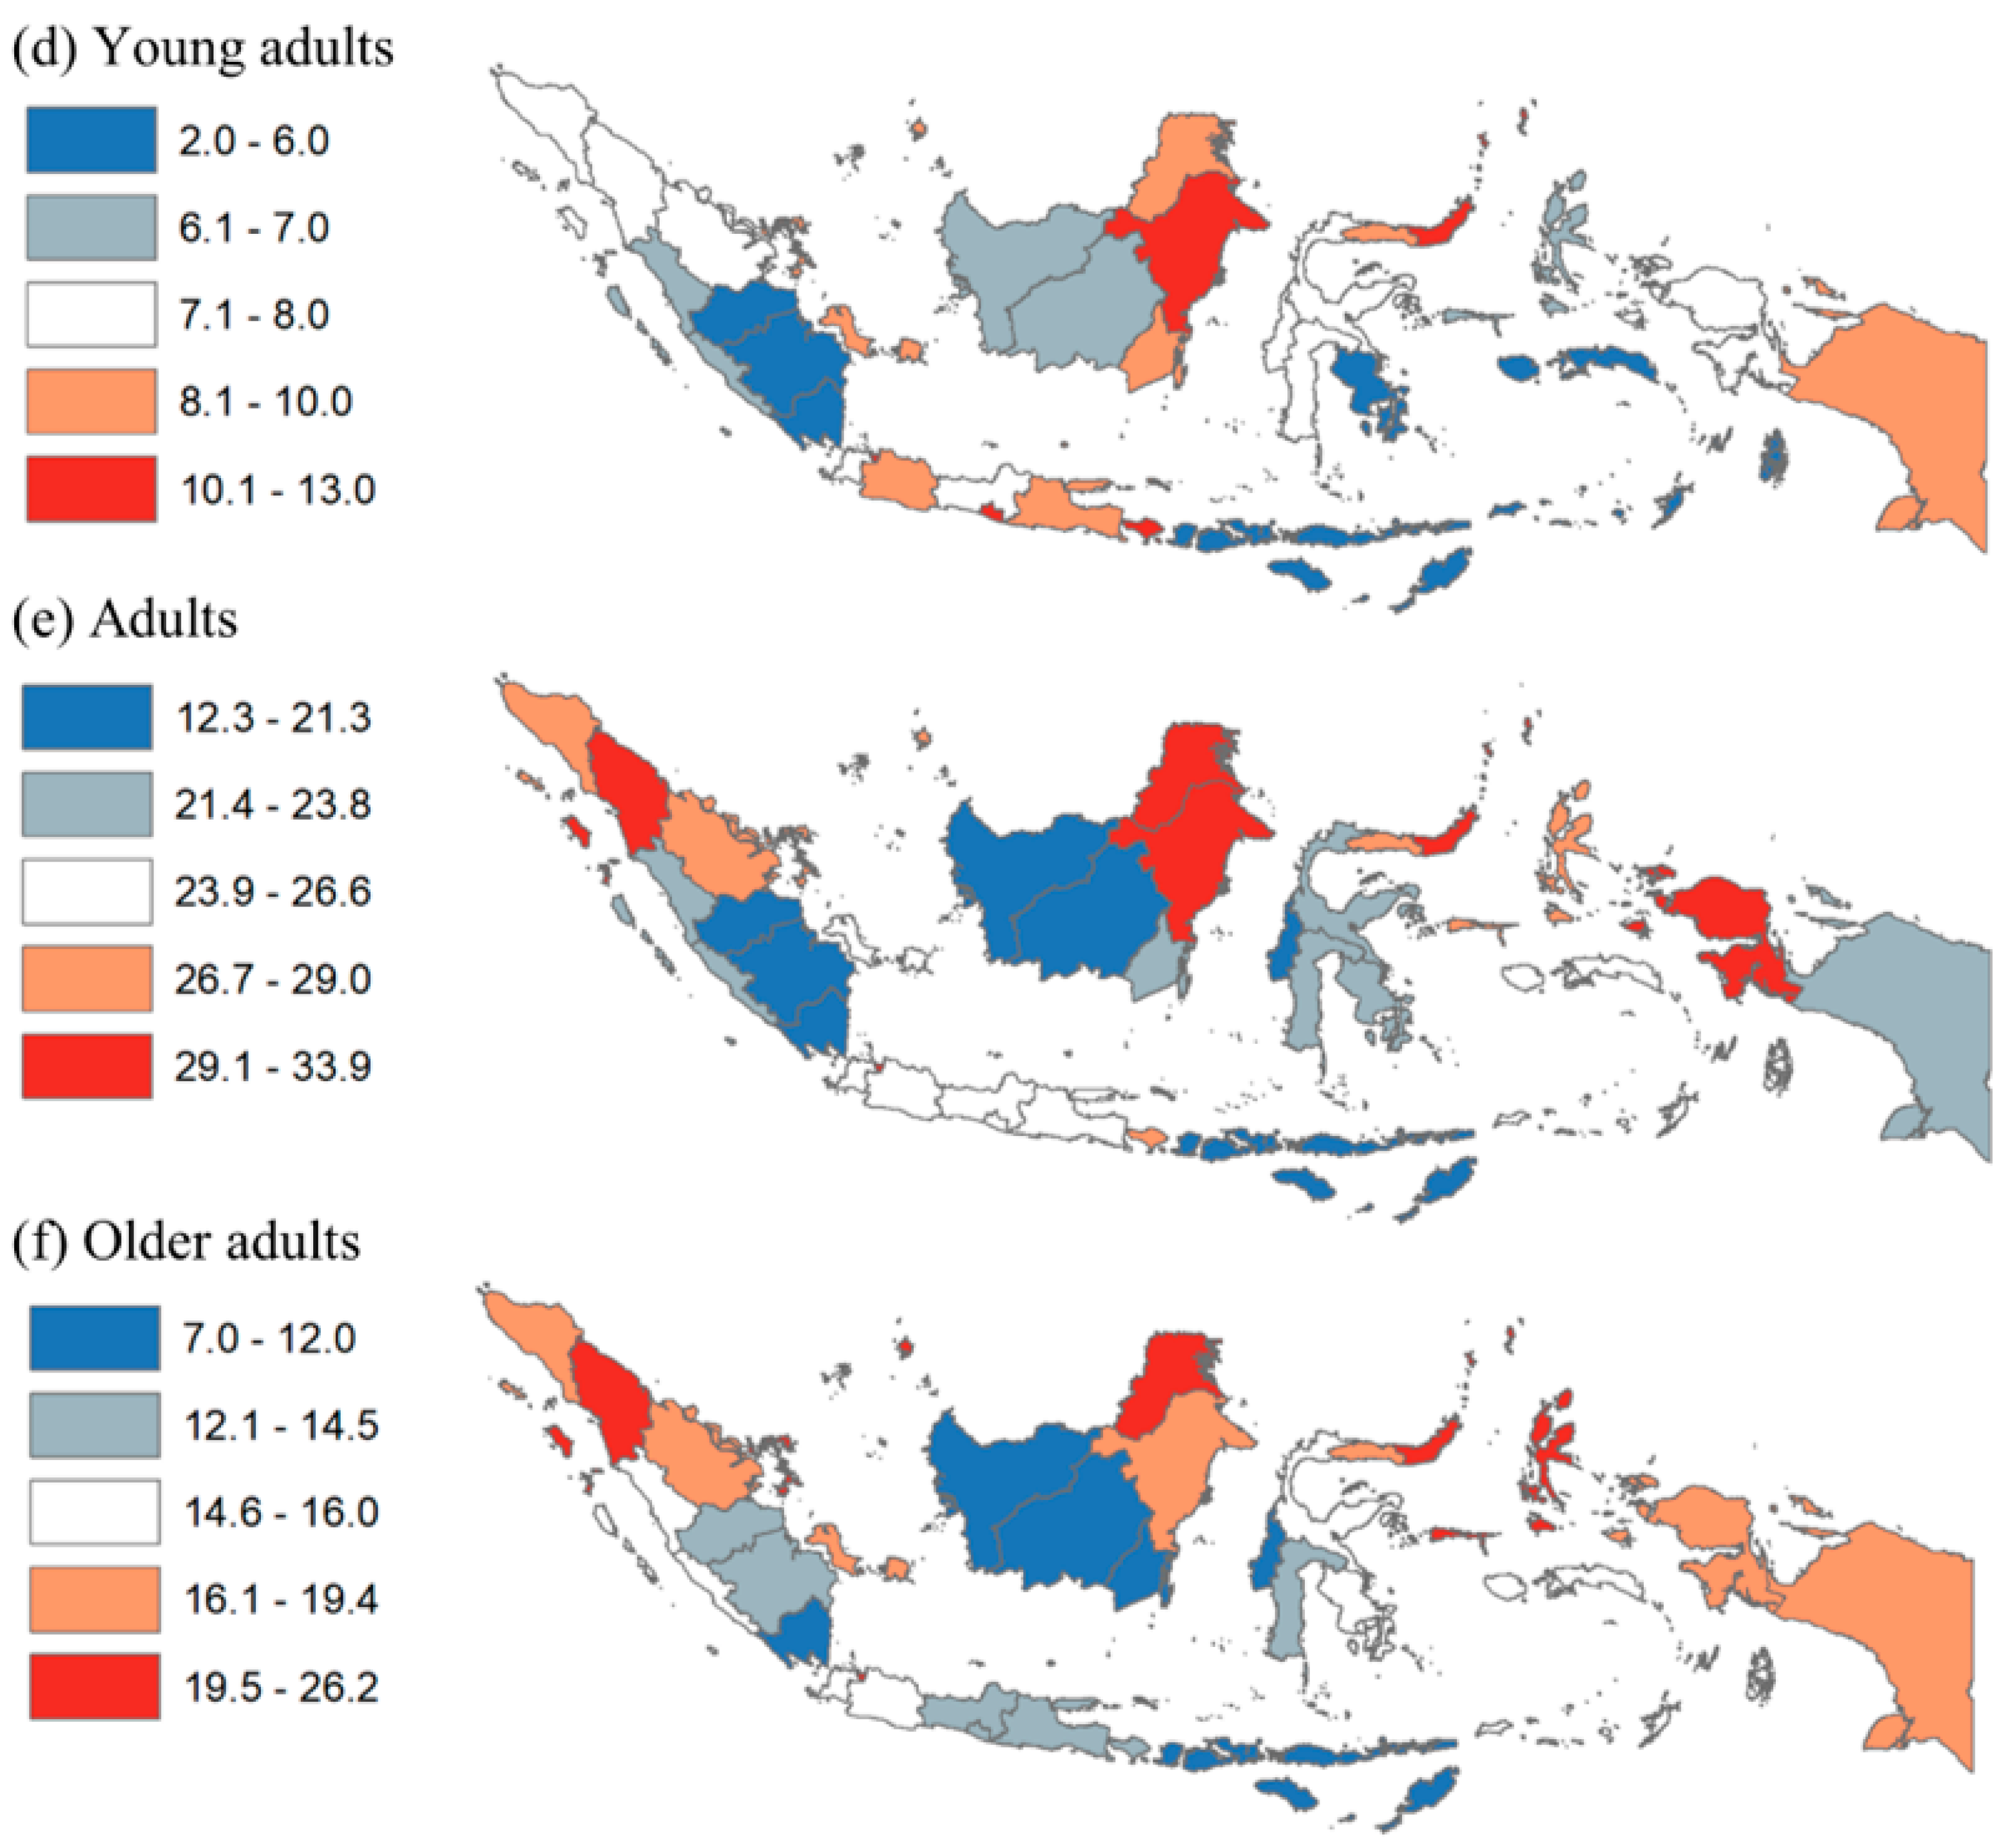
3.1. Provincial Level Analysis
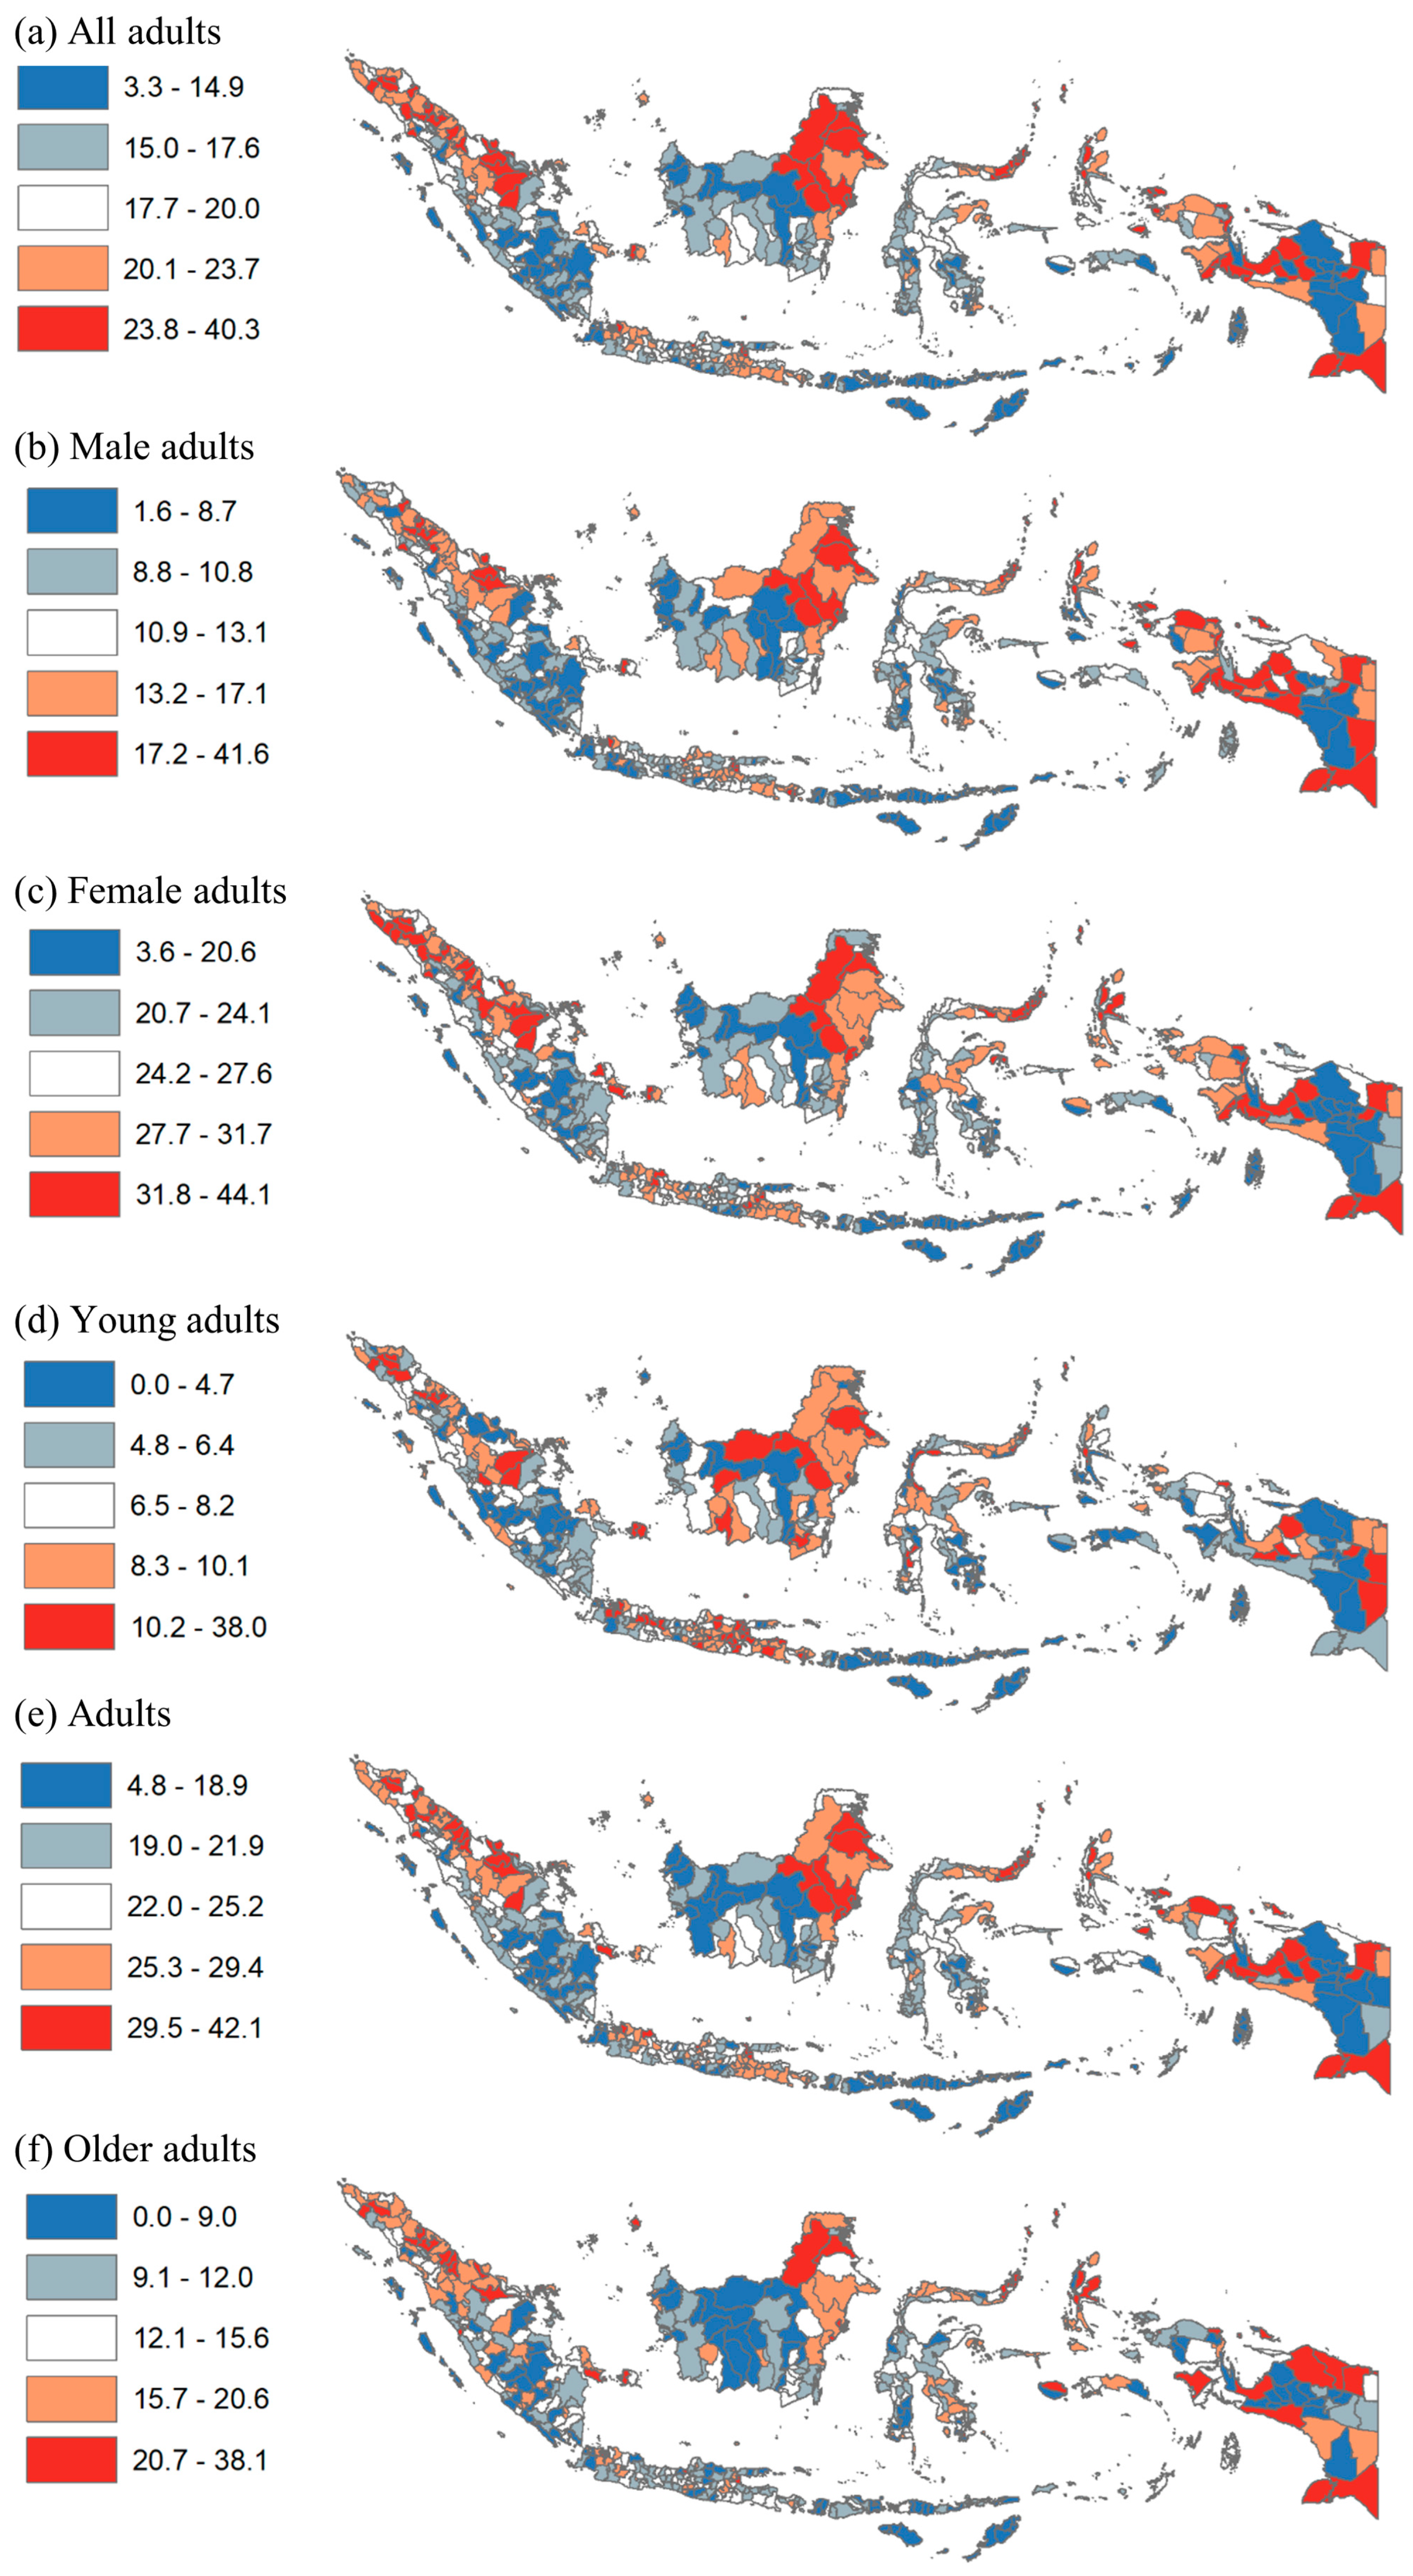
3.2. District Level Analysis
4. Discussion
5. Conclusions
Author Contributions
Funding
Institutional Review Board Statement
Informed Consent Statement
Data Availability Statement
Conflicts of Interest
Appendix A

| All | Males | Females | Young Adults | Adults | Older Adults | |
|---|---|---|---|---|---|---|
| Coef | Coef | Coef | Coef | Coef | Coef | |
| Rural | Reference | |||||
| Urban | 6.31 ** | 6.32 ** | 6.16 ** | 2.29 ** | 7.51 ** | 10.49 ** |
| Constant | 17.85 ** | 11.59 ** | 24.41 ** | 7.15 ** | 22.36 ** | 12.79 ** |
| Observations | 514 | 514 | 514 | 514 | 514 | 514 |
| R-squared | 0.20 | 0.23 | 0.12 | 0.06 | 0.20 | 0.32 |
| All | Males | Females | Young Adults | Adults | Older Adults | |
|---|---|---|---|---|---|---|
| Coef | Coef | Coef | Coef | Coef | Coef | |
| (a) All districts (N = 514) | ||||||
| Papua | Reference | |||||
| Java | 1.94 * | 0.12 | 3.53 ** | 2.85 ** | 2.14 * | −0.72 |
| Sumatera | 0.92 | −1.34 | 3.27 ** | 0.76 | 0.98 | 0.59 |
| Kalimantan | −0.73 | −1.90 * | 0.81 | 1.24 | −1.12 | −4.72 ** |
| Sulawesi | 2.01 * | 0.51 | 3.33 ** | 1.65 ** | 2.32 * | 1.61 |
| Income | ||||||
| Quintile 1 poor | Reference | |||||
| Quintile 2 | −0.54 | −1.12 | 0.06 | −0.93 | −0.35 | 0.82 |
| Quintile 3 | 2.09 ** | 1.17 | 3.03 ** | 0.36 | 2.68 ** | 4.03 ** |
| Quintile 4 | 2.66 ** | 2.07 ** | 3.30 ** | 0.16 | 3.44 ** | 5.48 ** |
| Quintile 5 rich | 4.62 ** | 4.10 ** | 5.23 ** | 1.39 * | 5.31 ** | 8.34 ** |
| Education | ||||||
| Quintile 1 least | Reference | |||||
| Quintile 2 | 0.82 | 0.49 | 1.11 | 0.31 | 1.35 | 1.09 |
| Quintile 3 | 2.51 ** | 2.03 ** | 2.94 ** | 0.52 | 3.50 ** | 3.29 ** |
| Quintile 4 | 3.16 ** | 2.55 ** | 3.70 ** | 0.83 | 4.09 ** | 4.89 ** |
| Quintile 5 most | 3.96 ** | 3.88 ** | 3.81 ** | 0.97 | 5.33 ** | 5.23 ** |
| (b) Urban (N = 97) | ||||||
| Papua | Reference | |||||
| Java | 2.39 | 3.12 | 1.42 | 2.17 | 1.23 | 0.05 |
| Sumatera | 0.94 | 1.10 | 0.63 | 0.53 | 0.10 | 1.21 |
| Kalimantan | 0.64 | 2.04 | −0.54 | 2.14 | −0.36 | −5.47 |
| Sulawesi | 1.02 | 2.75 | −0.93 | 1.22 | 0.80 | 0.66 |
| Income | ||||||
| Quintile 1 poor | Reference | |||||
| Quintile 2 | 5.09 | 2.13 | 8.56 * | 2.26 | 5.98 | −1.39 |
| Quintile 3 | 4.51 | 3.45 | 5.73 | 2.20 | 5.57 | −1.28 |
| Quintile 4 | 4.97 | 3.25 | 6.78 * | 2.05 | 6.32 * | 2.15 |
| Quintile 5 rich | 6.03 * | 3.66 | 8.54 ** | 3.55 | 6.77 * | 1.73 |
| Education | ||||||
| Quintile 1 least | n/a | n/a | n/a | n/a | n/a | n/a |
| Quintile 2 | Reference | |||||
| Quintile 3 | −0.70 | −1.39 | 0.07 | −0.97 | −0.72 | 1.47 |
| Quintile 4 | 0.50 | −0.34 | 1.45 | 0.36 | 0.42 | 1.55 |
| Quintile 5 most | 1.38 | 1.23 | 1.51 | −0.09 | 2.06 | 2.18 |
| (c) Rural (N = 417) | ||||||
| Papua | Reference | |||||
| Java | 2.00 * | −0.14 | 3.91 ** | 3.05 ** | 2.64 * | −0.73 |
| Sumatera | 1.35 | −1.28 | 4.12 ** | 0.91 | 1.69 | 1.21 |
| Kalimantan | 0.29 | −1.14 | 2.08 | 1.55 | 0.24 | −2.28 |
| Sulawesi | 2.44 ** | 0.51 | 4.22 ** | 1.74 ** | 2.91 ** | 2.22 * |
| Income | ||||||
| Quintile 1 poor | Reference | |||||
| Quintile 2 | −0.85 | −1.18 | −0.55 | −1.09 | −0.76 | 0.77 |
| Quintile 3 | 1.66 * | 0.81 | 2.53 * | 0.16 | 1.96 * | 3.53 ** |
| Quintile 4 | 1.81 * | 1.23 | 2.43 * | −0.09 | 2.27 * | 3.72 ** |
| Quintile 5 rich | 2.21 * | 1.85 | 2.75 * | 0.25 | 2.53 * | 4.29 ** |
| Education | ||||||
| Quintile 1 least | Reference | |||||
| Quintile 2 | 0.60 | 0.19 | 0.96 | 0.23 | 1.06 | 0.90 |
| Quintile 3 | 2.26 ** | 1.80 ** | 2.69 ** | 0.53 | 3.23 ** | 2.47 ** |
| Quintile 4 | 2.44 ** | 1.75 * | 3.08 ** | 0.46 | 3.27 ** | 3.50 ** |
| Quintile 5 most | 2.68 ** | 2.54 ** | 2.58 * | 0.69 | 3.60 ** | 2.81 ** |
References
- WHO. Obesity and Overweight. 2022. Available online: https://www.who.int/news-room/fact-sheets/detail/obesity-and-overweight (accessed on 29 June 2022).
- Okunogbe, A.; Nugent, R.; Spencer, G.; Ralston, J.; Wilding, J. Economic impacts of overweight and obesity: Current and future estimates for eight countries. BMJ Glob. Health 2021, 6, e006351. [Google Scholar] [CrossRef]
- Murray, C.J.; Aravkin, A.Y.; Zheng, P.; Abbafati, C.; Abbas, K.M.; Abbasi-Kangevari, M.; Abd-Allah, F.; Abdelalim, A.; Abdollahi, M.; Abdollahpour, I.; et al. GBD 2019 Diseases and Injuries Collaborators. Global burden of 369 diseases and injuries in 204 countries and territories, 1990–2019: A systematic analysis for the Global Burden of Disease Study 2019. Lancet 2020, 396, 1204–1222. [Google Scholar] [CrossRef]
- Kusuma, D.; Kusumawardani, N.; Ahsan, A.; Sebayang, S.K.; Amir, V.; Ng, N. On the verge of a chronic disease epidemic: Comprehensive policies and actions are needed in Indonesia. Int. Health 2019, 11, 422–424. [Google Scholar] [CrossRef]
- WHO Expert Consultation. Appropriate body-mass index for Asian populations and its implications for policy and intervention strategies. Lancet 2004, 363, 157–163. [Google Scholar] [CrossRef]
- Institute for Health Metrics and Evaluation (IHME). Indonesia. 2022. Available online: https://www.healthdata.org/indonesia (accessed on 29 June 2022).
- Jaacks, L.M.; Vandevijvere, S.; Pan, A.; McGowan, C.J.; Wallace, C.; Imamura, F.; Mozaffarian, D.; Swinburn, B.; Ezzati, M. The obesity transition: Stages of the global epidemic. Lancet Diabetes Endocrinol. 2019, 7, 231–240. [Google Scholar] [CrossRef]
- Shrestha, N.; Mishra, S.R.; Ghimire, S.; Gyawali, B.; Pradhan, P.M.S.; Schwarz, D. Application of single-level and multi-level modeling approach to examine geographic and socioeconomic variation in underweight, overweight and obesity in Nepal: Findings from NDHS 2016. Sci. Rep. 2020, 10, 2406. [Google Scholar] [CrossRef]
- Adisasmito, W.; Amir, V.; Atin, A.; Megraini, A.; Kusuma, D. Geographic and socioeconomic disparity in cardiovascular risk factors in Indonesia: Analysis of the Basic Health Research 2018. BMC Public Health 2020, 20, 1004. [Google Scholar] [CrossRef] [PubMed]
- Shibre, G.; Zegeye, B.; Woldeamanuiel, G.G.; Negash, W.; Lemma, G.; Taderegew, M.M. Observed magnitude and trends in socioeconomic and geographic area inequalities in obesity prevalence among non-pregnant women in Chad: Evidence from three waves of Chad demographic and health surveys. Arch. Public Health 2021, 79, 133. [Google Scholar] [CrossRef] [PubMed]
- Alaba, O.; Chola, L. Socioeconomic Inequalities in Adult Obesity Prevalence in South Africa: A Decomposition Analysis. Int. J. Environ. Res. Public Health 2014, 11, 3387–3406. [Google Scholar] [CrossRef] [PubMed]
- Boissonnet, C.; Schargrodsky, H.; Pellegrini, F.; Macchia, A.; Champagne, B.M.; Wilson, E.; Tognoni, G. Educational inequalities in obesity, abdominal obesity, and metabolic syndrome in seven Latin American cities: The CARMELA Study. Eur. J. Cardiovasc. Prev. Rehabil. 2011, 18, 550–556. [Google Scholar] [CrossRef] [PubMed]
- Choi, E.; Cho, H.N.; Seo, D.H.; Park, B.; Park, S.; Cho, J.; Kim, S.; Park, Y.-R.; Choi, K.S.; Rhee, Y. Socioeconomic inequalities in obesity among Korean women aged 19–79 years: The 2016 Korean Study of Women’s Health-Related Issues. Epidemiol. Health 2019, 41, e2019005. [Google Scholar] [CrossRef] [PubMed]
- Lebel, A.; Kestens, Y.; Clary, C.; Bisset, S.; Subramanian, S.V. Geographic Variability in the Association between Socioeconomic Status and BMI in the USA and Canada. PLoS ONE 2014, 9, e99158. [Google Scholar] [CrossRef] [PubMed]
- Mackenbach, J.P.; Stirbu, I.; Roskam, A.-J.R.; Schaap, M.M.; Menvielle, G.; Leinsalu, M.; Kunst, A.E. Socioeconomic Inequalities in Health in 22 European Countries. N. Engl. J. Med. 2008, 358, 2468–2481. [Google Scholar] [CrossRef] [PubMed]
- Slack, T.; Myers, C.A.; Martin, C.K.; Heymsfield, S.B. The geographic concentration of us adult obesity prevalence and associated social, economic, and environmental factors. Obesity 2014, 22, 868–874. [Google Scholar] [CrossRef] [PubMed]
- Drewnowski, A.; Rehm, C.D.; Solet, D. Disparities in obesity rates: Analysis by ZIP code area. Soc. Sci. Med. 2007, 65, 2458–2463. [Google Scholar] [CrossRef] [PubMed]
- Di Cesare, M.; Khang, Y.-H.; Asaria, P.; Blakely, T.; Cowan, M.J.; Farzadfar, F.; Guerrero, R.; Ikeda, N.; Kyobutungi, C.; Msyamboza, K.P.; et al. Inequalities in non-communicable diseases and effective responses. Lancet 2013, 381, 585–597. [Google Scholar] [CrossRef]
- NIHRD. Report of Riskesdas; National Institute of Health Research and Development: Jakarta, Indonesia, 2018. [Google Scholar]
- Ayuningtyas, D.; Hapsari, D.; Rachmalina, R.; Amir, V.; Rachmawati, R.; Kusuma, D. Geographic and Socioeconomic Disparity in Child Undernutrition across 514 Districts in Indonesia. Nutrients 2022, 14, 843. [Google Scholar] [CrossRef]
- World Bank. World Bank Indonesia. 2022. Available online: https://www.worldbank.org/en/country/indonesia (accessed on 9 August 2022).
- Hapsari, D.; Nainggolan, O.; Kusuma, D. Hotspots and Regional Variation in Smoking Prevalence Among 514 Districts in Indonesia: Analysis of Basic Health Research 2018. Glob. J. Health Sci. 2020, 12, 32–44. [Google Scholar] [CrossRef]
- Bella, A.; Akbar, M.; Kusnadi, G.; Herlinda, O.; Regita, P.; Kusuma, D. Socioeconomic and Behavioral Correlates of COVID-19 Infections among Hospital Workers in the Greater Jakarta Area, Indonesia: A Cross-Sectional Study. Int. J. Environ. Res. Public Health 2021, 18, 5048. [Google Scholar] [CrossRef] [PubMed]
- Ford, N.D.; Patel, S.A.; Narayan, K.M.V. Obesity in Low- and Middle-Income Countries: Burden, Drivers, and Emerging Challenges. Annu. Rev. Public Health 2017, 38, 145–164. [Google Scholar] [CrossRef]
- Atanasova, P.; Kusuma, D.; Pineda, E.; Anjana, R.M.; De Silva, L.; Hanif, A.A.; Hasan, M.; Hossain, M.M.; Indrawansa, S.; Jayamanne, D.; et al. Food environments and obesity: A geospatial analysis of the South Asia Biobank, income and sex inequalities. SSM-Popul. Health 2022, 17, 101055. [Google Scholar] [CrossRef] [PubMed]
- Kusuma, D.; Atanasova, P.; Pineda, E.; Anjana, R.M.; De Silva, L.; Hanif, A.A.; Hasan, M.; Hossain, M.M.; Indrawansa, S.; Jayamanne, D.; et al. Food environment and diabetes mellitus in South Asia: A geospatial analysis of health outcome data. PLoS Med. 2022, 19, e1003970. [Google Scholar] [CrossRef] [PubMed]
- AlQurashi, A.A.; Kusuma, D.; AlJishi, H.; AlFaiz, A.; AlSaad, A. Density of Fast Food Outlets around Educational Facilities in Riyadh, Saudi Arabia: Geospatial Analysis. Int. J. Environ. Res. Public. Health 2021, 18, 6502. [Google Scholar] [CrossRef] [PubMed]
- Sivasampu, S.; Teh, X.R.; Lim, Y.M.F.; Ong, S.M.; Ang, S.H.; Husin, M.; Khamis, N.; Jaafar, F.S.A.; Wong, W.J.; Shanmugam, S.; et al. Study protocol on Enhanced Primary Healthcare (EnPHC) interventions: A quasi-experimental controlled study on diabetes and hypertension management in primary healthcare clinics. Prim. Health Care Res. Dev. 2020, 21, 1–12. [Google Scholar] [CrossRef] [PubMed]
- Puspikawati, S.I.; Dewi, D.M.S.K.; Astutik, E.; Kusuma, D.; Melaniani, S.; Sebayang, S.K. Density of outdoor food and beverage advertising around gathering place for children and adolescent in East Java, Indonesia. Public Health Nutr. 2021, 24, 1066–1078. [Google Scholar] [CrossRef] [PubMed]
- Kusuma, D. Lessons from primary health care in the United Kingdom. J. Adm. Kesehat. Indones. 2021, 9, 4–8. [Google Scholar] [CrossRef]
- Poston, L.; Caleyachetty, R.; Cnattingius, S.; Corvalán, C.; Uauy, R.; Herring, S.; Gillman, M.W. Preconceptional and maternal obesity: Epidemiology and health consequences. Lancet Diabetes Endocrinol. 2016, 4, 1025–1036. [Google Scholar] [CrossRef]
- Handayani, S.; Rachmani, E.; Saptorini, K.K.; Manglapy, Y.M.; Ahsan, A.; Kusuma, D. Is Youth Smoking Related to the Density and Proximity of Outdoor Tobacco Advertising Near Schools? Evidence from Indonesia. Int. J. Environ. Res. Public Health 2021, 18, 2556. [Google Scholar] [CrossRef]
- Nurhayati, N.; Kusuma, D.; Tarigan, A.A.; Siregar, P.A.; Hasibuan, R.R.A.; Ahsan, A. Exposure to Outdoor Tobacco Advertisements Near Home is Associated with Smoking among Youth in Indonesia. Asian Pac. J. Cancer Prev. 2022, 23, 2179–2183. [Google Scholar] [CrossRef] [PubMed]
- Nasution, F.; Gurning, F.P.; Siregar, P.A.; Ahsan, A.; Kusuma, D. Implementation of the Smoke-Free Policy in Medan City, Indonesia: Compliance and Challenges. Int. J. Prev. Med. 2022, 13, 30. [Google Scholar] [CrossRef] [PubMed]
- AlJishi, H.; Kusuma, D.; AlQurashi, A.; AlFaiz, A.; AlSaad, A.; Aljishi, M. Compliance with Tobacco Control Policy and Visibility of Cigarette Retailers Around Educational Facilities in Riyadh, Saudi Arabia. Front. Public Health 2022, 10, 713460. [Google Scholar] [CrossRef] [PubMed]
- Song, P.; Gupta, A.; Goon, I.Y.; Hasan, M.; Mahmood, S.; Pradeepa, R.; Siddiqui, S.; Frost, G.S.; Kusuma, D.; Miraldo, M.; et al. Data resource profile: Understanding the patterns and determinants of health in South Asians-the South Asia Biobank. Int. J. Epidemiol. 2021, 50, 717–718e. [Google Scholar] [CrossRef] [PubMed]
| Obesity Prevalence | |||||||
|---|---|---|---|---|---|---|---|
| Poverty | Young | ||||||
| Rates | All | Males | Females | Adults | Adults | Older Adults | |
| (1) | (2) | (3) | (4) | (5) | (6) | (7) | |
| Bali | 4.5% | 21.9% | 19.2% | 24.6% | 11.4% | 26.7% | 14.2% |
| South Kalimantan | 4.8% | 17.9% | 11.8% | 24.3% | 8.6% | 21.9% | 12.0% |
| Central Kalimantan | 5.0% | 17.2% | 11.2% | 24.0% | 7.3% | 21.3% | 10.3% |
| Jakarta | 5.0% | 28.2% | 22.1% | 34.4% | 12.3% | 32.7% | 26.2% |
| Banten | 5.3% | 20.3% | 13.4% | 27.7% | 7.6% | 25.2% | 15.4% |
| Bangka Belitung | 5.4% | 22.0% | 14.0% | 31.1% | 9.9% | 26.6% | 18.5% |
| West Sumatera | 6.6% | 18.7% | 11.6% | 25.8% | 6.9% | 23.8% | 15.3% |
| North Kalimantan | 7.0% | 23.8% | 17.9% | 30.6% | 9.2% | 29.5% | 20.5% |
| East Kalimantan | 7.1% | 26.6% | 20.3% | 33.8% | 13.1% | 31.8% | 19.4% |
| Riau Islands | 7.6% | 24.2% | 19.0% | 29.9% | 8.6% | 29.0% | 20.9% |
| Jambi | 7.8% | 16.1% | 10.7% | 21.9% | 5.7% | 19.8% | 13.8% |
| North Maluku | 7.9% | 22.1% | 14.3% | 30.3% | 6.6% | 28.2% | 21.1% |
| West Java | 7.9% | 21.1% | 13.1% | 29.5% | 9.0% | 26.4% | 15.7% |
| West Kalimantan | 8.1% | 15.6% | 10.2% | 21.3% | 6.6% | 19.6% | 10.7% |
| North Sulawesi | 8.5% | 27.9% | 21.3% | 34.9% | 11.4% | 33.9% | 25.9% |
| Riau | 8.8% | 22.1% | 15.0% | 29.8% | 8.0% | 27.7% | 17.0% |
| South Sulawesi | 9.8% | 17.4% | 11.2% | 23.4% | 7.8% | 22.1% | 12.8% |
| West Sulawesi | 10.3% | 16.8% | 10.7% | 23.1% | 7.6% | 21.3% | 11.6% |
| East Java | 10.9% | 20.9% | 13.9% | 27.9% | 10.0% | 26.1% | 13.6% |
| Central Java | 10.9% | 18.9% | 12.2% | 25.4% | 8.5% | 23.9% | 12.5% |
| North Sumatera | 11.3% | 23.2% | 17.1% | 29.4% | 8.4% | 29.3% | 23.3% |
| Lampung | 12.6% | 15.9% | 8.7% | 23.6% | 6.1% | 19.8% | 11.5% |
| Yogyakarta | 12.7% | 20.3% | 16.5% | 24.0% | 10.8% | 24.8% | 14.5% |
| Southeast Sulawesi | 13.0% | 17.3% | 11.8% | 22.8% | 5.2% | 22.4% | 15.3% |
| South Sumatera | 13.1% | 15.9% | 9.9% | 22.3% | 5.5% | 20.0% | 12.6% |
| Central Sulawesi | 14.6% | 19.0% | 12.5% | 25.9% | 7.5% | 23.4% | 15.4% |
| West Nusa Tenggara | 14.8% | 13.5% | 7.0% | 19.5% | 4.4% | 17.9% | 8.3% |
| Bengkulu | 15.0% | 18.3% | 10.3% | 26.8% | 6.8% | 22.3% | 15.4% |
| Aceh | 16.4% | 22.2% | 13.9% | 30.6% | 8.0% | 28.3% | 17.3% |
| Gorontalo | 16.8% | 22.3% | 14.1% | 30.7% | 9.6% | 28.0% | 17.4% |
| Maluku | 21.8% | 17.8% | 12.3% | 23.4% | 4.1% | 23.9% | 16.0% |
| East Nusa Tenggara | 22.0% | 9.1% | 6.4% | 11.8% | 2.5% | 12.3% | 7.0% |
| West Papua | 26.5% | 24.0% | 17.4% | 31.6% | 8.4% | 30.1% | 18.8% |
| Papua | 29.4% | 18.9% | 15.1% | 23.1% | 8.8% | 21.7% | 17.8% |
| AVERAGE | 19.9% | 13.7% | 26.4% | 8.0% | 24.8% | 15.8% | |
| All | Urban | Rural | Difference | ||||||
|---|---|---|---|---|---|---|---|---|---|
| n | % | n | % | n | % | % | |||
| (1) | (2) | (3) | (4) | (5) | (6) | (7) = (4–6) | |||
| (a) Characteristics | |||||||||
| Sample size district | 514 | 100% | 97 | 100% | 417 | 100% | 0% | ||
| Region | |||||||||
| Papua | 95 | 18.5% | 9 | 9.3% | 86 | 20.6% | 11.3% | ||
| Java | 128 | 24.9% | 35 | 36.1% | 93 | 22.3% | −13.8% | ||
| Sumatera | 154 | 30.0% | 33 | 34.0% | 121 | 29.0% | −5.0% | ||
| Kalimantan | 56 | 10.9% | 9 | 9.3% | 47 | 11.3% | 2.0% | ||
| Sulawesi | 81 | 15.8% | 11 | 11.3% | 70 | 16.8% | 5.4% | ||
| 514 | 97 | 417 | |||||||
| Income/poverty | |||||||||
| Q1 poor | 102 | 19.8% | 3 | 3.1% | 99 | 23.7% | 20.6% | ||
| Q2 | 103 | 20.0% | 5 | 5.2% | 98 | 23.5% | 18.3% | ||
| Q3 | 103 | 20.0% | 13 | 13.4% | 90 | 21.6% | 8.2% | ||
| Q4 | 103 | 20.0% | 22 | 22.7% | 81 | 19.4% | −3.3% | ||
| Q5 rich | 103 | 20.0% | 54 | 55.7% | 49 | 11.8% | −43.9% | ||
| 514 | 97 | 417 | |||||||
| Education | |||||||||
| Q1 least | 103 | 20.0% | 0 | 0.0% | 103 | 24.7% | 24.7% | ||
| Q2 | 103 | 20.0% | 11 | 11.3% | 92 | 22.1% | 10.7% | ||
| Q3 | 103 | 20.0% | 17 | 17.5% | 86 | 20.6% | 3.1% | ||
| Q4 | 103 | 20.0% | 29 | 29.9% | 74 | 17.7% | −12.2% | ||
| Q5 most | 102 | 19.8% | 40 | 41.2% | 62 | 14.9% | −26.4% | ||
| 514 | 97 | 417 | |||||||
| (b) Obesity prevalence | |||||||||
| All adults | n/a | 19.0% | n/a | 24.2% | n/a | 17.9% | 6.3% | * | |
| Male adults | n/a | 12.8% | n/a | 17.9% | n/a | 11.6% | 6.3% | * | |
| Female adults | n/a | 25.6% | n/a | 30.6% | n/a | 24.4% | 6.2% | * | |
| Young adults | n/a | 7.6% | n/a | 9.4% | n/a | 7.1% | 2.3% | * | |
| Adults | n/a | 23.8% | n/a | 29.9% | n/a | 22.4% | 7.5% | * | |
| Older adults | n/a | 14.8% | n/a | 23.3% | n/a | 12.8% | 10.5% | * | |
| Prevalence | Province | Region | Urban | Poverty | Education | Pop (000) | ||
|---|---|---|---|---|---|---|---|---|
| (a) All adults | ||||||||
| Kab. Sumba Tengah | 3.3% | East Nusa Tenggara | Papua | Rural | 35% | 44% | 68 | |
| Kab. Sumba Barat Daya | 3.4% | East Nusa Tenggara | Papua | Rural | 29% | 42% | 319 | |
| Kab. Sabu Raijua | 4.0% | East Nusa Tenggara | Papua | Rural | 31% | 69% | 86 | |
| Kab. Timor Tengah Selatan | 4.3% | East Nusa Tenggara | Papua | Rural | 28% | 52% | 459 | |
| Kab. Manggarai Timur | 5.0% | East Nusa Tenggara | Papua | Rural | 27% | 43% | 272 | |
| Kab. Nias | 5.1% | North Sumatra | Sumatera | Rural | 16% | 62% | 136 | |
| Kab. Belu | 5.3% | East Nusa Tenggara | Papua | Rural | 16% | 54% | 206 | |
| Kab. Sumba Barat | 5.5% | East Nusa Tenggara | Papua | Rural | 29% | 55% | 122 | |
| Kab. Jayawijaya | 5.7% | Papua | Papua | Rural | 39% | 67% | 206 | |
| Kab. Yahukimo | 6.4% | Papua | Papua | Rural | 39% | 12% | 181 | |
| AVERAGE | 29% | 50% | 206 | |||||
| (b) Male adults | ||||||||
| Kab. Sumba Tengah | 2% | East Nusa Tenggara | Papua | Rural | 35% | 44% | 68 | |
| Kab. Sabu Raijua | 2% | East Nusa Tenggara | Papua | Rural | 31% | 69% | 86 | |
| Kab. Manggarai Timur | 3% | East Nusa Tenggara | Papua | Rural | 27% | 43% | 272 | |
| Kab. Yahukimo | 3% | Papua | Papua | Rural | 39% | 12% | 181 | |
| Kab. Sumba Barat Daya | 3% | East Nusa Tenggara | Papua | Rural | 29% | 42% | 319 | |
| Kab. Jayawijaya | 4% | Papua | Papua | Rural | 39% | 67% | 206 | |
| Kab Pesisir Barat | 4% | Lampung | Sumatera | Rural | 15% | 72% | 150 | |
| Kab. Belu | 3.9% | East Nusa Tenggara | Papua | Rural | 16% | 54% | 206 | |
| Kab. Nias | 4.0% | North Sumatra | Sumatera | Rural | 16% | 62% | 136 | |
| Kab. Timor Tengah Selatan | 4.0% | East Nusa Tenggara | Papua | Rural | 28% | 52% | 459 | |
| AVERAGE | 27% | 52% | 208 | |||||
| (c) Female adults | ||||||||
| Kab. Sumba Barat Daya | 4% | East Nusa Tenggara | Papua | Rural | 29% | 42% | 319 | |
| Kab. Timor Tengah Selatan | 5% | East Nusa Tenggara | Papua | Rural | 28% | 52% | 459 | |
| Kab. Sumba Tengah | 5% | East Nusa Tenggara | Papua | Rural | 35% | 44% | 68 | |
| Kab. Sabu Raijua | 6% | East Nusa Tenggara | Papua | Rural | 31% | 69% | 86 | |
| Kab. Nias | 6.1% | North Sumatra | Sumatera | Rural | 16% | 62% | 136 | |
| Kab. Sintang | 6.4% | West Kalimantan | Kalimantan | Rural | 10% | 45% | 396 | |
| Kab. Asmat | 6.6% | Papua | Papua | Rural | 27% | 21% | 88 | |
| Kab. Sumba Barat | 6.6% | East Nusa Tenggara | Papua | Rural | 29% | 55% | 122 | |
| Kab. Belu | 6.7% | East Nusa Tenggara | Papua | Rural | 16% | 54% | 206 | |
| Kab. Manggarai Timur | 7.1% | East Nusa Tenggara | Papua | Rural | 27% | 43% | 272 | |
| AVERAGE | 25% | 49% | 215 | |||||
| (d) Young adults | ||||||||
| Kab. Manggarai Timur | 0% | East Nusa Tenggara | Papua | Rural | 27% | 43% | 272 | |
| Kab. Belu | 0% | East Nusa Tenggara | Papua | Rural | 16% | 54% | 206 | |
| Kab. Sumba Tengah | 1% | East Nusa Tenggara | Papua | Rural | 35% | 44% | 68 | |
| Kab. Jayawijaya | 1% | Papua | Papua | Rural | 39% | 67% | 206 | |
| Kab. Timor Tengah Selatan | 1% | East Nusa Tenggara | Papua | Rural | 28% | 52% | 459 | |
| Kab. Sumba Barat Daya | 1% | East Nusa Tenggara | Papua | Rural | 29% | 42% | 319 | |
| Kab. Lanny Jaya | 1% | Papua | Papua | Rural | 40% | 46% | 172 | |
| Kb. Manggarai | 1% | East Nusa Tenggara | Papua | Rural | 21% | 51% | 319 | |
| Kab. Kupang | 1% | East Nusa Tenggara | Papua | Rural | 23% | 58% | 347 | |
| Kab. Sabu Raijua | 1% | East Nusa Tenggara | Papua | Rural | 31% | 69% | 86 | |
| AVERAGE | 29% | 53% | 246 | |||||
| (e) Adults | ||||||||
| Kab. Sumba Tengah | 4.8% | East Nusa Tenggara | Papua | Rural | 35% | 44% | 68 | |
| Kab. Sumba Barat Daya | 4.9% | East Nusa Tenggara | Papua | Rural | 29% | 42% | 319 | |
| Kab. Sabu Raijua | 5.1% | East Nusa Tenggara | Papua | Rural | 31% | 69% | 86 | |
| Kab. Timor Tengah Selatan | 5.4% | East Nusa Tenggara | Papua | Rural | 28% | 52% | 459 | |
| Kab. Jayawijaya | 6.4% | Papua | Papua | Rural | 39% | 67% | 206 | |
| Kab. Nias | 6.7% | North Sumatra | Sumatera | Rural | 16% | 62% | 136 | |
| Kab. Manggarai Timur | 6.7% | East Nusa Tenggara | Papua | Rural | 27% | 43% | 272 | |
| Kab. Yahukimo | 6.9% | Papua | Papua | Rural | 39% | 12% | 181 | |
| Kab. Asmat | 7.0% | Papua | Papua | Rural | 27% | 21% | 88 | |
| Kab. Sumba Barat | 7.0% | East Nusa Tenggara | Papua | Rural | 29% | 55% | 122 | |
| AVERAGE | 30% | 47% | 194 | |||||
| (f) Older adults | ||||||||
| Kab. Diyai | 0.0% | Papua | Papua | Rural | 43% | 51% | 69 | |
| Kab. Mambramo Tengah | 0.0% | Papua | Papua | Rural | 37% | 54% | 46 | |
| Kab. Nduga | 0.0% | Papua | Papua | Rural | 38% | 9% | 94 | |
| Kab. Puncak Jaya | 0.0% | Papua | Papua | Rural | 36% | 21% | 115 | |
| Kab. Intan Jaya | 0.0% | Papua | Papua | Rural | 43% | 9% | 46 | |
| Kab. Lanny Jaya | 0.0% | Papua | Papua | Rural | 40% | 46% | 172 | |
| Kab. Dogiyai | 0.0% | Papua | Papua | Rural | 30% | 39% | 92 | |
| Kab. Paniayi | 0.0% | Papua | Papua | Rural | 37% | 25% | 164 | |
| Kab. Yalimo | 0.0% | Papua | Papua | Rural | 35% | 28% | 59 | |
| Kab. Waropen | 0.3% | Papua | Papua | Rural | 31% | 61% | 28 | |
| AVERAGE | 37% | 34% | 89 | |||||
| Prevalence | Province | Region | Urban | Poverty | Education | Pop (000) | ||
|---|---|---|---|---|---|---|---|---|
| (a) All adults | ||||||||
| Kab. Yalimo | 40.3% | Papua | Papua | Rural | 35% | 28% | 59 | |
| Kab. Karo | 34.1% | North Sumatera | Sumatera | Rural | 9% | 74% | 389 | |
| Kota Tomohon | 33.8% | North Sulawesi | Sulawesi | Urban | 6% | 71% | 100 | |
| Kota Jakarta Pusat | 32.1% | Jakarta | Jawa | Urban | 4% | 55% | 914 | |
| Kab. Minahasa | 31.7% | North Sulawesi | Sulawesi | Rural | 7% | 65% | 329 | |
| Kota Padang Sidempuan | 31.6% | North Sumatera | Sumatera | Urban | 8% | 77% | 210 | |
| Kota Jakarta Timur | 30.7% | Jakarta | Jawa | Urban | 3% | 67% | 2827 | |
| Kota Pematang Siantar | 30.1% | North Sumatera | Sumatera | Urban | 9% | 77% | 247 | |
| Kab. Minahasa Selatan | 30.0% | North Sulawesi | Sulawesi | Rural | 9% | 62% | 205 | |
| Kota Bitung | 29.9% | North Sulawesi | Sulawesi | Urban | 7% | 57% | 205 | |
| AVERAGE | 10% | 63% | 548 | |||||
| (b) Male adults | ||||||||
| Kab. Yalimo | 41.6% | Papua | Papua | Rural | 35% | 28% | 59 | |
| Kab. Puncak | 30.9% | Papua | Papua | Rural | 38% | 9% | 103 | |
| Kota Tomohon | 27.9% | North Sulawesi | Sulawesi | Urban | 6% | 71% | 100 | |
| Kab. Minahasa | 26.8% | North Sulawesi | Sulawesi | Rural | 7% | 65% | 329 | |
| Kota Jakarta Pusat | 25.8% | Jakarta | Jawa | Urban | 4% | 55% | 914 | |
| Kota Padang Sidempuan | 25.6% | North Sumatera | Sumatera | Urban | 8% | 77% | 210 | |
| Kota Manado | 25.5% | North Sulawesi | Sulawesi | Urban | 5% | 66% | 425 | |
| Kota Denpasar | 25.5% | Bali | Jawa | Urban | 2% | 63% | 879 | |
| Kota Banda Aceh | 25.2% | Aceh | Sumatera | Urban | 7% | 82% | 250 | |
| Kab. Karo | 24.9% | North Sumatera | Sumatera | Rural | 9% | 74% | 389 | |
| AVERAGE | 12% | 59% | 366 | |||||
| (c) Female adults | ||||||||
| Kep Seribu | 44.1% | Jakarta | Jawa | Rural | 12% | 71% | 23 | |
| Kab. Karo | 43.2% | North Sumatera | Sumatera | Rural | 9% | 74% | 389 | |
| Kab Bener Meriah | 42.7% | Aceh | Sumatera | Rural | 20% | 67% | 137 | |
| Kab Aceh Tengah | 41.2% | Aceh | Sumatera | Rural | 16% | 73% | 196 | |
| Kota Tomohon | 39.7% | North Sulawesi | Sulawesi | Urban | 6% | 71% | 100 | |
| Kab. Kep Talaud | 39.7% | North Sulawesi | Sulawesi | Rural | 10% | 71% | 89 | |
| Kab. Minahasa Selatan | 39.5% | North Sulawesi | Sulawesi | Rural | 9% | 62% | 205 | |
| Kota. Tidore Kepulauan | 39.5% | North Maluku | Papua | Urban | 6% | 74% | 97 | |
| Kab. Yalimo | 38.8% | Papua | Papua | Rural | 35% | 28% | 59 | |
| Kab. Manowari Selatan | 38.6% | West Papua | Papua | Rural | 31% | 47% | 22 | |
| AVERAGE | 15% | 64% | 132 | |||||
| (d) Young adults | ||||||||
| Kab. Yalimo | 38.0% | Papua | Papua | Rural | 35% | 28% | 59 | |
| Kab. Pegunungan Bintang | 25.3% | Papua | Papua | Rural | 31% | 21% | 72 | |
| Kab. Waropen | 22.9% | Papua | Papua | Rural | 31% | 61% | 28 | |
| Kab. Paniayi | 18.7% | Papua | Papua | Rural | 37% | 25% | 164 | |
| Kota Samarinda | 18.0% | East Kalimantan | Kalimantan | Urban | 5% | 66% | 811 | |
| Kab Tabanan | 17.3% | Bali | Jawa | Rural | 4% | 81% | 436 | |
| Kab. Boven Digul | 16.6% | Papua | Papua | Rural | 20% | 35% | 63 | |
| Kota Tomohon | 16.6% | North Sulawesi | Sulawesi | Urban | 6% | 71% | 100 | |
| Kota Balikpapan | 16.3% | East Kalimantan | Kalimantan | Urban | 3% | 69% | 615 | |
| Kota Madiun | 16.3% | East Java | Jawa | Urban | 4% | 80% | 175 | |
| AVERAGE | 18% | 54% | 252 | |||||
| (e) Adults | ||||||||
| Kota Padang Sidempuan | 42.1% | North Sumatera | Sumatera | Urban | 8% | 77% | 210 | |
| Kab. Yalimo | 41.1% | Papua | Papua | Rural | 35% | 28% | 59 | |
| Kab. Karo | 40.8% | North Sumatera | Sumatera | Rural | 9% | 74% | 389 | |
| Kota Tomohon | 40.0% | North Sulawesi | Sulawesi | Urban | 6% | 71% | 100 | |
| Kota Lhokseumawe | 38.2% | Aceh | Sumatera | Urban | 12% | 76% | 191 | |
| Kota Pematang Siantar | 38.1% | North Sumatera | Sumatera | Urban | 9% | 77% | 247 | |
| Kota Blitar | 37.9% | East Java | Jawa | Urban | 7% | 84% | 138 | |
| Kota Manado | 37.8% | North Sulawesi | Sulawesi | Urban | 5% | 66% | 425 | |
| Kab. Mahakam Ulu | 37.7% | East Kalimantan | Kalimantan | Rural | 12% | 52% | 26 | |
| Kab. Minahasa | 37.1% | North Sulawesi | Sulawesi | Rural | 7% | 65% | 329 | |
| AVERAGE | 11% | 67% | 211 | |||||
| (f) Older adults | ||||||||
| Kota Banda Aceh | 38.1% | Aceh | Sumatera | Urban | 7% | 82% | 250 | |
| Kep Seribu | 37.9% | Jakarta | Jawa | Rural | 12% | 71% | 23 | |
| Kota Ternate | 36.3% | North Maluku | Papua | Urban | 3% | 63% | 213 | |
| Kota Padang Sidempuan | 35.5% | North Sumatera | Sumatera | Urban | 8% | 77% | 210 | |
| Kota Bekasi | 35.3% | West Java | Jawa | Urban | 4% | 71% | 2709 | |
| Kota Tomohon | 34.9% | North Sulawesi | Sulawesi | Urban | 6% | 71% | 100 | |
| Kota Medan | 34.4% | North Sumatera | Sumatera | Urban | 8% | 62% | 2209 | |
| Kab. Karo | 33.3% | North Sumatera | Sumatera | Rural | 9% | 74% | 389 | |
| Kab. Minahasa Utara | 33.1% | North Sulawesi | Sulawesi | Rural | 7% | 61% | 198 | |
| Kota Jayapura | 32.6% | Papua | Papua | Urban | 11% | 62% | 283 | |
| AVERAGE | 8% | 69% | 658 | |||||
| All Districts (n = 514) | Urban (n = 97) | Rural (n = 417) | |||||||||||||||||
|---|---|---|---|---|---|---|---|---|---|---|---|---|---|---|---|---|---|---|---|
| All | Male | Female | Young | Older | All | Male | Female | Young | Older | All | Male | Female | Young | Older | |||||
| Adults | Adults | Adults | Adults | Adults | Adults | Adults | Adults | Adults | Adults | Adults | Adults | Adults | Adults | Adults | Adults | Adults | Adults | ||
| (1) | (2) | (3) | (4) | (5) | (6) | (7) | (8) | (9) | (10) | (11) | (12) | (13) | (14) | (15) | (16) | (17) | (18) | ||
| Region | |||||||||||||||||||
| Papua | 16.0% | 11.6% | 20.7% | 5.8% | 20.1% | 11.5% | 22.2% | 15.7% | 29.1% | 7.6% | 28.8% | 22.6% | 15.4% | 11.2% | 19.9% | 5.6% | 19.2% | 10.3% | |
| Sulawesi | 19.4% | 13.0% | 25.8% | 7.6% | 24.3% | 15.8% | 23.9% | 18.6% | 29.2% | 9.6% | 30.1% | 24.1% | 18.6% | 12.1% | 25.3% | 7.2% | 23.3% | 14.5% | |
| Kalimantan | 18.6% | 12.6% | 25.3% | 8.0% | 22.9% | 12.5% | 23.5% | 17.6% | 29.9% | 10.7% | 28.7% | 18.0% | 17.6% | 11.6% | 24.4% | 7.5% | 21.8% | 11.5% | |
| Sumatera | 19.5% | 12.5% | 27.0% | 7.1% | 24.5% | 16.5% | 23.6% | 17.1% | 30.3% | 8.4% | 29.4% | 24.1% | 18.4% | 11.2% | 26.1% | 6.7% | 23.2% | 14.4% | |
| Java | 20.7% | 14.0% | 27.4% | 9.3% | 25.7% | 15.5% | 25.4% | 19.1% | 31.8% | 10.5% | 30.8% | 23.8% | 18.9% | 12.1% | 25.8% | 8.9% | 23.8% | 12.3% | |
| Absolute | 4.7% | 2.4% | 6.7% | 3.5% | 5.6% | 4.0% | 3.2% | 3.4% | 2.7% | 2.9% | 2.0% | 1.2% | 3.5% | 0.9% | 5.9% | 3.3% | 4.6% | 2.0% | |
| Relative | 1.29 | 1.21 | 1.32 | 1.60 | 1.28 | 1.35 | 1.14 | 1.22 | 1.09 | 1.38 | 1.07 | 1.05 | 1.23 | 1.08 | 1.30 | 1.59 | 1.24 | 1.19 | |
| Income | |||||||||||||||||||
| Q1 poor | 16.3% | 11.3% | 21.5% | 6.5% | 20.3% | 10.8% | 18.3% | 13.3% | 23.3% | 6.0% | 23.3% | 23.0% | 16.2% | 11.2% | 21.5% | 6.5% | 20.3% | 10.4% | |
| Q2 | 17.1% | 10.7% | 23.6% | 6.4% | 21.7% | 12.7% | 23.9% | 16.5% | 31.8% | 8.4% | 29.8% | 21.4% | 16.7% | 10.4% | 23.2% | 6.3% | 21.2% | 12.3% | |
| Q3 | 19.6% | 12.7% | 26.8% | 8.1% | 24.5% | 15.0% | 22.8% | 17.0% | 28.9% | 8.0% | 28.9% | 21.8% | 19.2% | 12.1% | 26.5% | 8.1% | 23.9% | 14.0% | |
| Q4 | 20.1% | 13.5% | 27.0% | 7.7% | 25.2% | 16.5% | 24.1% | 18.2% | 30.0% | 8.8% | 30.2% | 24.5% | 19.1% | 12.3% | 26.2% | 7.5% | 23.9% | 14.4% | |
| Q5 rich | 22.1% | 15.7% | 28.8% | 9.2% | 27.1% | 18.7% | 24.9% | 18.4% | 31.5% | 10.3% | 30.3% | 23.3% | 19.0% | 12.7% | 25.9% | 7.9% | 23.6% | 13.7% | |
| Absolute | 5.8% | 4.4% | 7.3% | 2.7% | 6.8% | 7.9% | 6.6% | 5.1% | 8.2% | 4.3% | 7.0% | 0.3% | 2.8% | 1.5% | 4.4% | 1.4% | 3.3% | 3.3% | |
| Relative | 1.36 | 1.39 | 1.34 | 1.42 | 1.33 | 1.73 | 1.36 | 1.38 | 1.35 | 1.72 | 1.30 | 1.01 | 1.17 | 1.13 | 1.20 | 1.22 | 1.16 | 1.32 | |
| Education | |||||||||||||||||||
| Q1 least | 16.0% | 10.6% | 21.7% | 6.7% | 19.8% | 10.1% | n/a | n/a | n/a | n/a | n/a | n/a | 16.0% | 10.6% | 21.7% | 6.7% | 19.8% | 10.1% | |
| Q2 | 18.0% | 11.7% | 24.6% | 7.5% | 22.5% | 13.2% | 24.1% | 18.5% | 29.8% | 10.2% | 29.5% | 21.3% | 17.2% | 10.8% | 23.9% | 7.1% | 21.7% | 12.3% | |
| Q3 | 19.4% | 13.0% | 26.2% | 7.5% | 24.4% | 15.2% | 23.1% | 16.6% | 29.8% | 8.9% | 28.5% | 22.6% | 18.7% | 12.2% | 25.5% | 7.2% | 23.6% | 13.8% | |
| Q4 | 20.3% | 13.6% | 27.3% | 7.9% | 25.2% | 17.1% | 23.9% | 17.4% | 30.6% | 9.8% | 29.2% | 23.1% | 18.9% | 12.2% | 26.0% | 7.2% | 23.7% | 14.7% | |
| Q5 most | 21.5% | 15.1% | 28.1% | 8.2% | 27.0% | 18.2% | 24.8% | 18.7% | 31.1% | 9.2% | 31.0% | 24.2% | 19.4% | 12.7% | 26.2% | 7.6% | 24.4% | 14.3% | |
| Absolute | 5.5% | 4.5% | 6.4% | 1.5% | 7.2% | 8.1% | 0.7% | 0.2% | 1.3% | −1.0% | 1.5% | 2.9% | 3.4% | 2.1% | 4.5% | 0.9% | 4.6% | 4.2% | |
| Relative | 1.34 | 1.42 | 1.29 | 1.22 | 1.36 | 1.80 | 1.03 | 1.01 | 1.04 | 0.90 | 1.05 | 1.14 | 1.21 | 1.20 | 1.21 | 1.13 | 1.23 | 1.42 | |
Publisher’s Note: MDPI stays neutral with regard to jurisdictional claims in published maps and institutional affiliations. |
© 2022 by the authors. Licensee MDPI, Basel, Switzerland. This article is an open access article distributed under the terms and conditions of the Creative Commons Attribution (CC BY) license (https://creativecommons.org/licenses/by/4.0/).
Share and Cite
Ayuningtyas, D.; Kusuma, D.; Amir, V.; Tjandrarini, D.H.; Andarwati, P. Disparities in Obesity Rates among Adults: Analysis of 514 Districts in Indonesia. Nutrients 2022, 14, 3332. https://doi.org/10.3390/nu14163332
Ayuningtyas D, Kusuma D, Amir V, Tjandrarini DH, Andarwati P. Disparities in Obesity Rates among Adults: Analysis of 514 Districts in Indonesia. Nutrients. 2022; 14(16):3332. https://doi.org/10.3390/nu14163332
Chicago/Turabian StyleAyuningtyas, Dumilah, Dian Kusuma, Vilda Amir, Dwi Hapsari Tjandrarini, and Pramita Andarwati. 2022. "Disparities in Obesity Rates among Adults: Analysis of 514 Districts in Indonesia" Nutrients 14, no. 16: 3332. https://doi.org/10.3390/nu14163332
APA StyleAyuningtyas, D., Kusuma, D., Amir, V., Tjandrarini, D. H., & Andarwati, P. (2022). Disparities in Obesity Rates among Adults: Analysis of 514 Districts in Indonesia. Nutrients, 14(16), 3332. https://doi.org/10.3390/nu14163332