
Safety and Efficacy of Eucaloric Very Low-Carb Diet (EVLCD) in Type 1 Diabetes: A One-Year Real-Life Retrospective Experience


 , and
, and 
Abstract
:1. Introduction
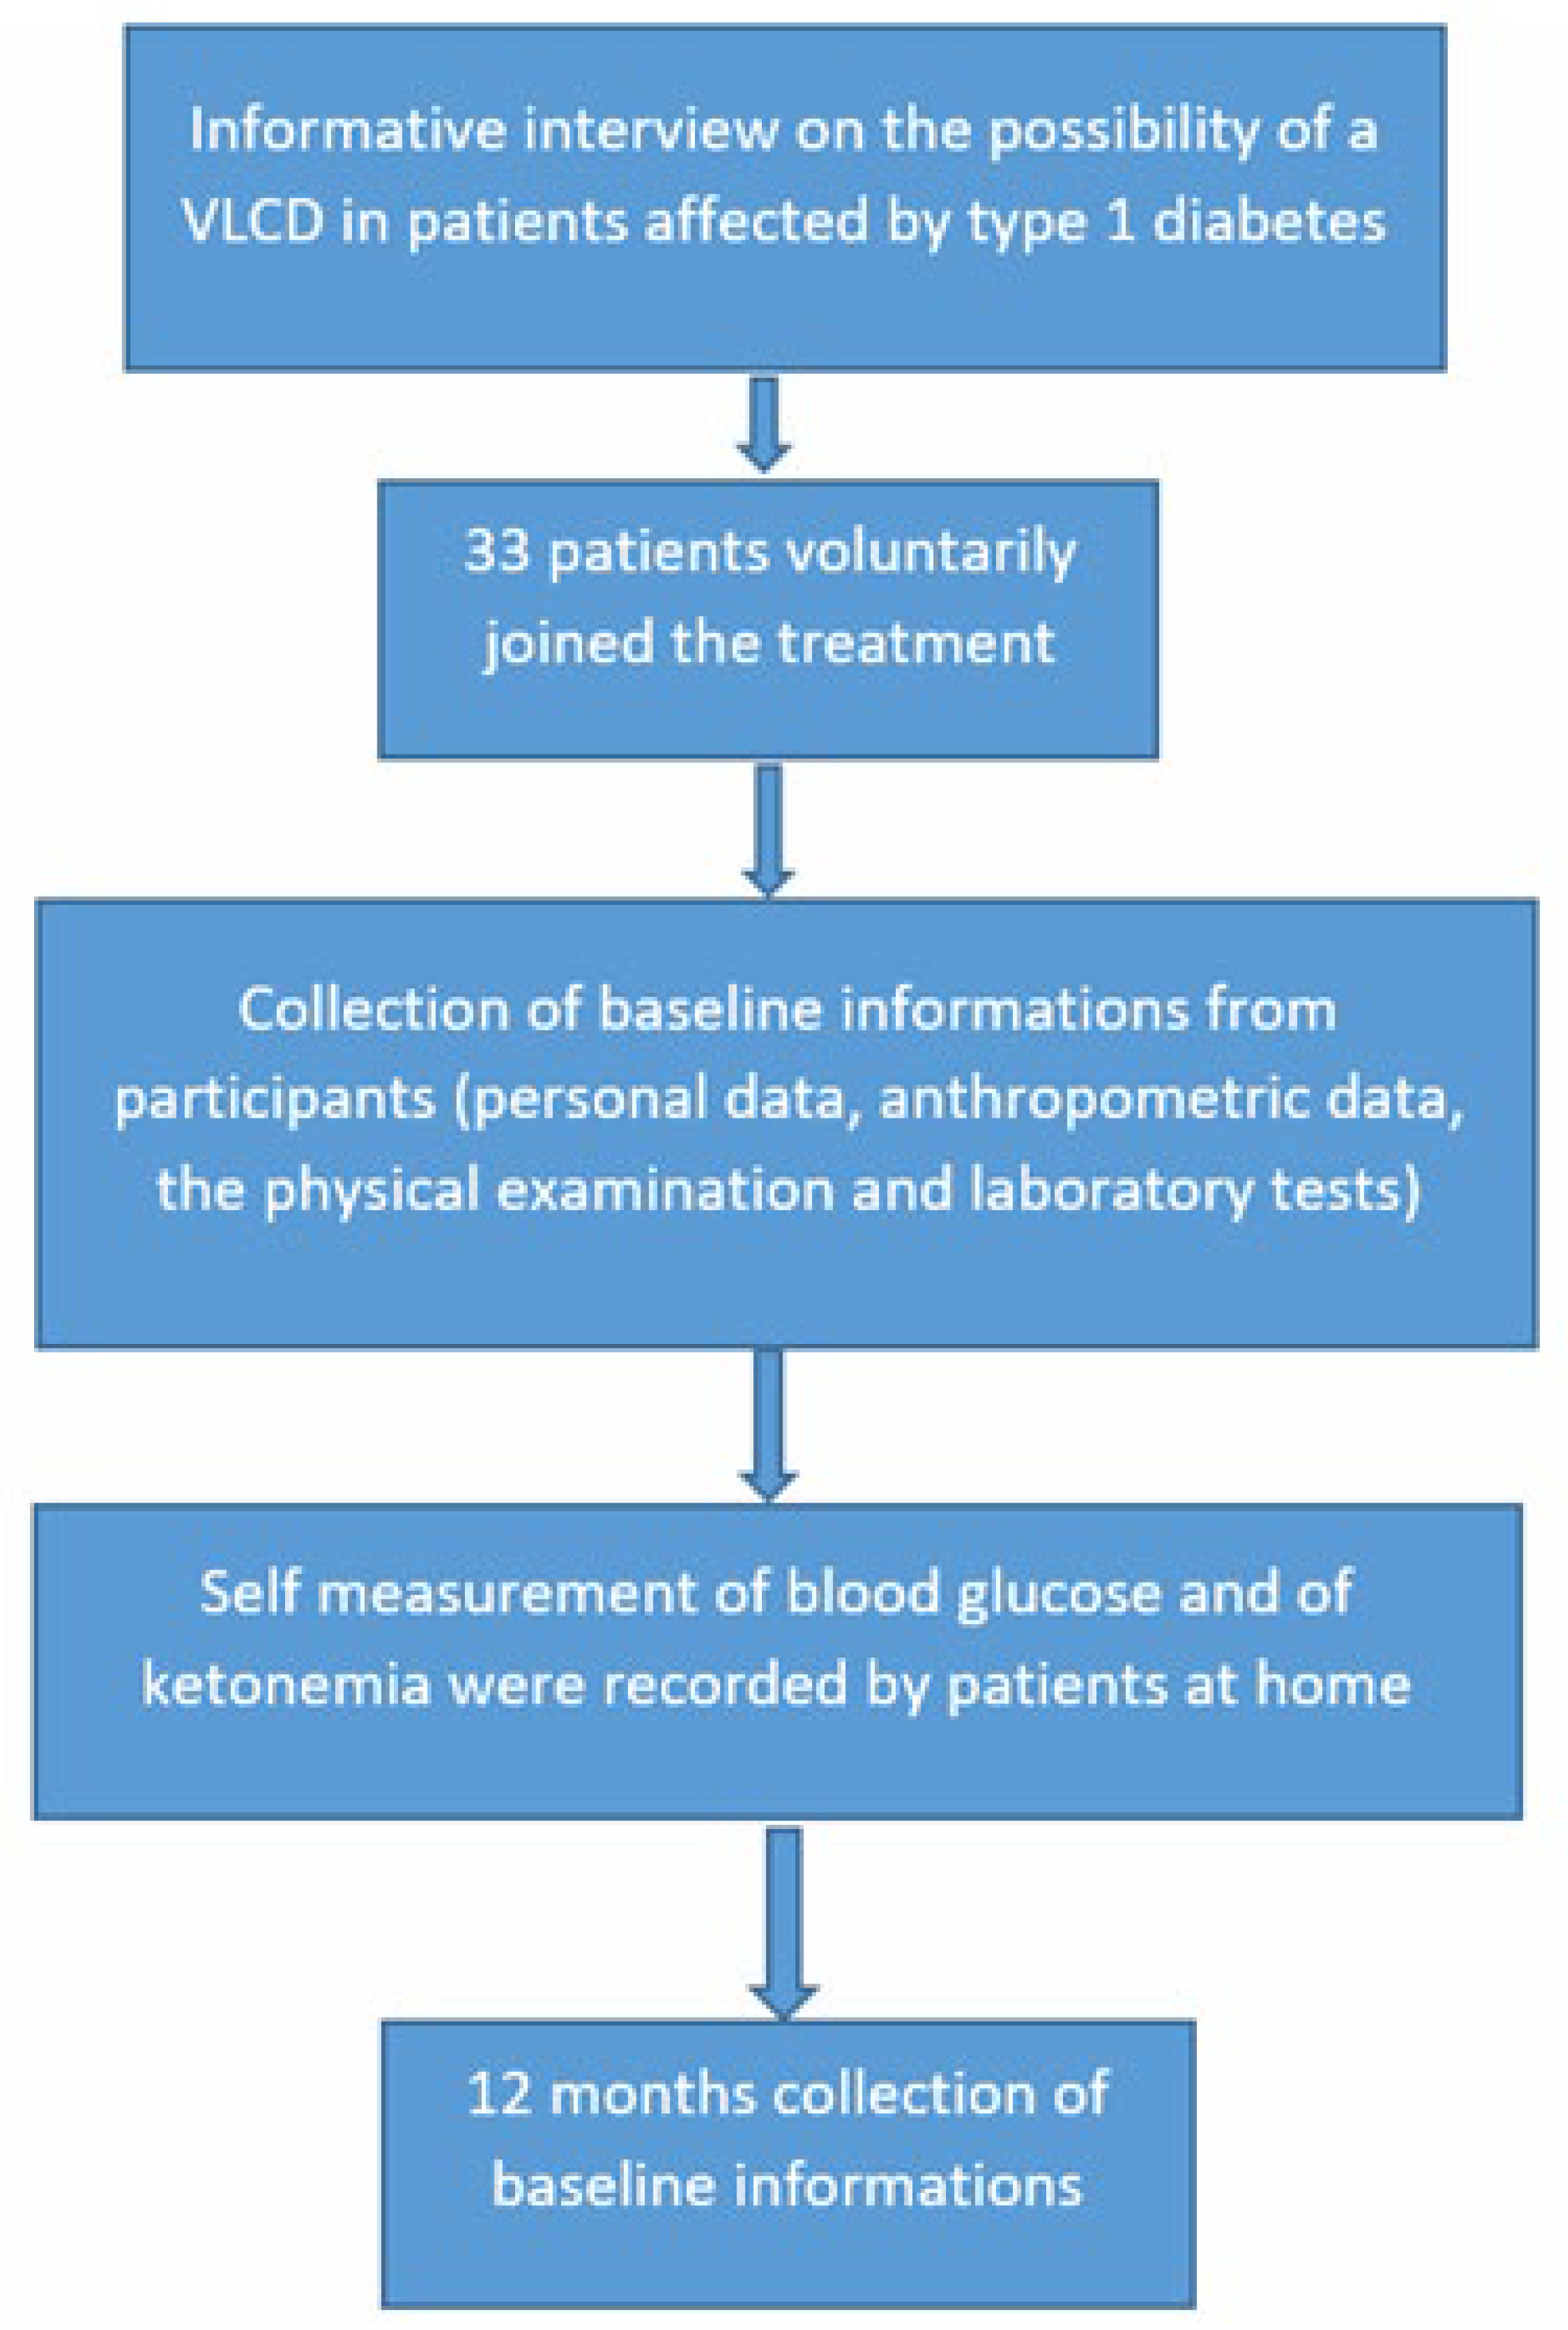
2. Materials and Methods
2.1. Anthropometric Measures
2.2. Blood Exams
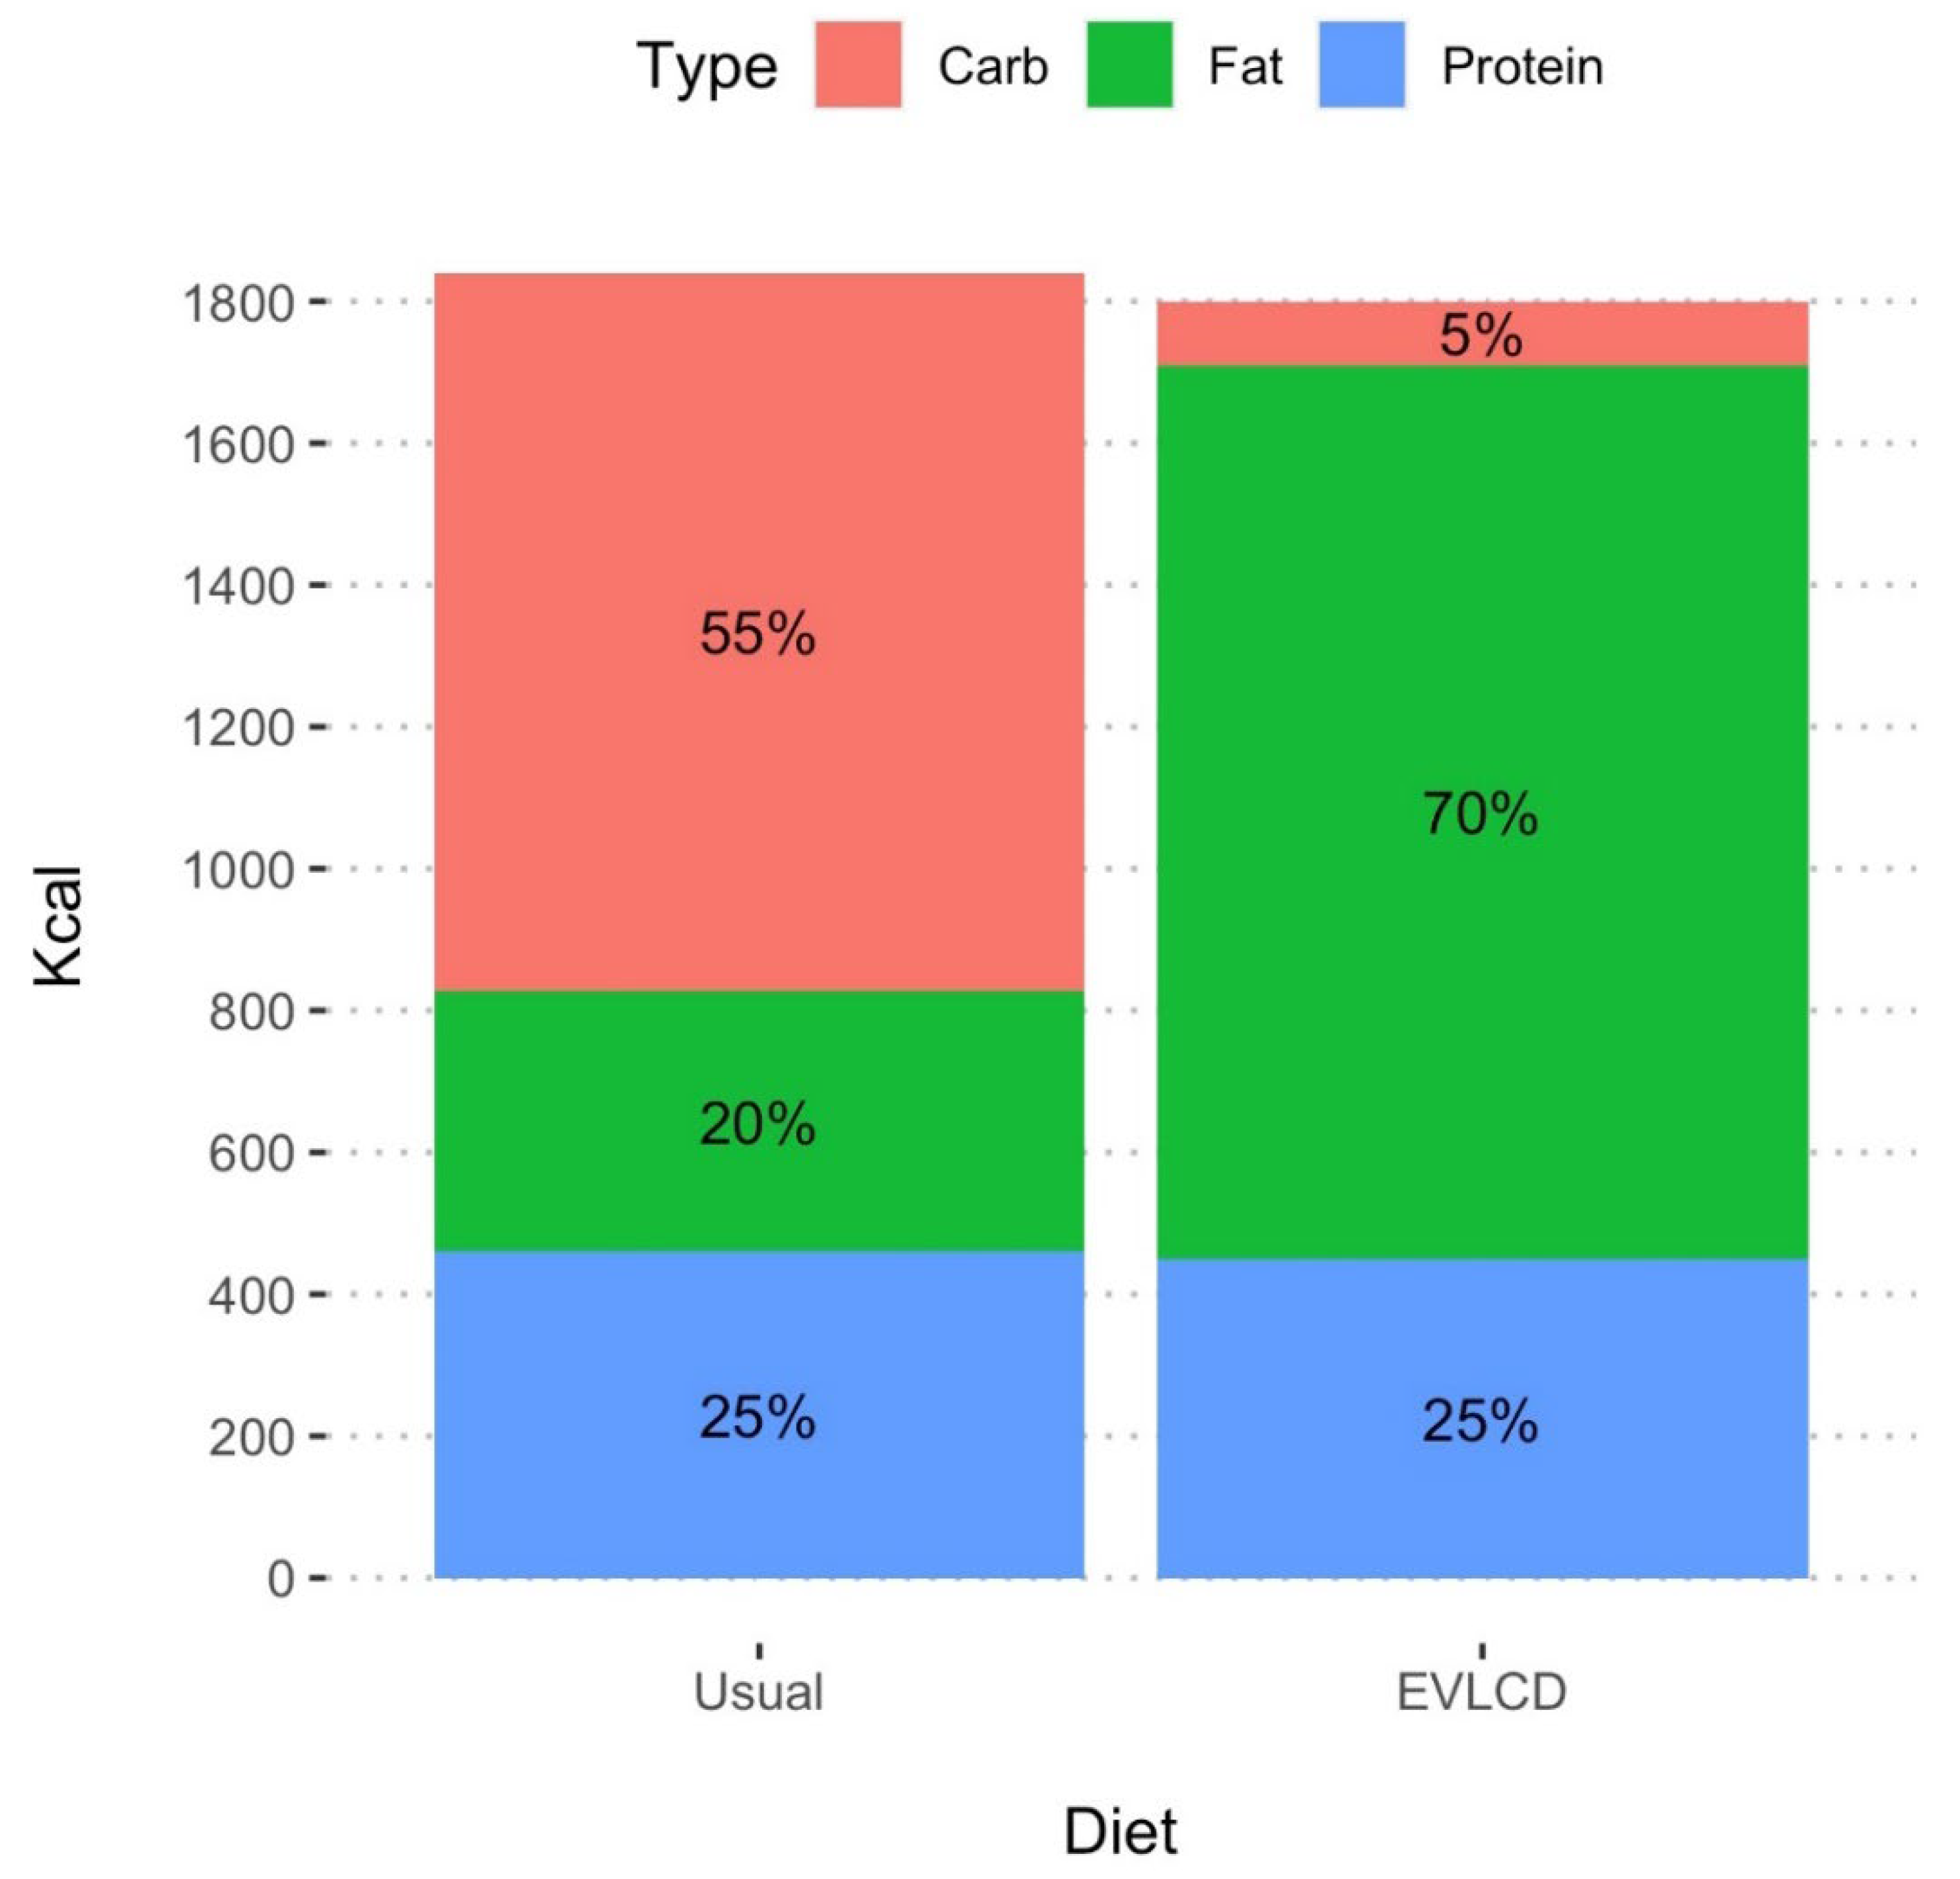
2.3. Eating Pattern
2.4. Insulin Therapy
2.5. Statistical Analysis
2.6. Ethical Approval Statement
3. Results
4. Discussion
5. Conclusions
Author Contributions
Funding
Institutional Review Board Statement
Informed Consent Statement
Data Availability Statement
Conflicts of Interest
References
- Atkinson, M.A.; Maclaren, N.K. The pathogenesis of insulin-dependent diabetes mellitus. N. Engl. J. Med. 1994, 331, 1428–1436. [Google Scholar] [CrossRef] [PubMed]
- Zaccardi, F.; Webb, D.R.; Yates, T.; Davies, M.J. Pathophysiology of type 1 and type 2 diabetes mellitus: A 90-year perspective. Postgrad. Med. J. 2016, 92, 63–69. [Google Scholar] [CrossRef] [PubMed]
- Westman, E.C.; Yancy, W.S., Jr.; Humphreys, M. Dietary treatment of diabetes mellitus in the pre-insulin era (1914-1922). Perspect. Biol. Med. 2006, 49, 77–83. [Google Scholar] [CrossRef] [PubMed]
- Nathan, D.M.; Cleary, P.A.; Backlund, J.Y.; Genuth, S.M.; Lachin, J.M.; Orchard, T.J.; Raskin, P.; Zinman, B. Diabetes Control and Complications Trial/Epidemiology of Diabetes Interventions and Complications (DCCT/EDIC) Study Research Group. Intensive diabetes treatment and cardiovascular disease in patients with type 1 diabetes. N. Engl. J. Med. 2005, 353, 2643–2653. [Google Scholar] [CrossRef] [PubMed]
- Ewers, B.; Vilsbøll, T.; Andersen, H.U.; Bruun, J.M. The dietary education trial in carbohydrate counting (DIET-CARB Study): Study protocol for a randomised, parallel, open-label, intervention study comparing different approaches to dietary self-management in patients with type 1 diabetes. BMJ Open 2019, 9, e029859. [Google Scholar] [CrossRef] [Green Version]
- Barnard-Kelly, K.D.; Naranjo, D.; Majidi, S.; Akturk, H.K.; Breton, M.; Courtet, P.; Olié, E.; Lal, R.A.; Johnson, N.; Renard, E. Suicide and Self-inflicted Injury in Diabetes: A Balancing Act. J. Diabetes Sci Technol. 2020, 14, 1010–1016. [Google Scholar] [CrossRef]
- Mair, C.; Wulaningsih, W.; Jeyam, A.; McGurnaghan, S.; Blackbourn, L.; Kennon, B.; Leese, G.; Lindsay, R.; McCrimmon, R.J.; McKnight, J.; et al. Scottish Diabetes Research Network (SDRN) Epidemiology Group. Glycaemic control trends in people with type 1 diabetes in Scotland 2004-2016. Diabetologia 2019, 62, 1375–1384. [Google Scholar] [CrossRef] [Green Version]
- Gruppo di studio ANNALI AMD. Gli Annali AMD: Un modello di monitoraggio sistematico e miglioramento continuo della qualità dell’assistenza diabetologica [AMD Annals: A model of continuous monitoring and improvement of the quality of diabetes care]. Epidemiol. Prev. 2011, 35, 18–26. (In Italian) [Google Scholar]
- Lam-Chung, C.E.; Martínez Zavala, N.; Ibarra-Salce, R.; Pozos Varela, F.J.; Mena Ureta, T.S.; Berumen Hermosillo, F.; Campos Muñoz, A.; Janka Zires, M.; Almeda-Valdes, P. Association of estimated glucose disposal rate and chronic diabetic complications in patients with type 1 diabetes. Endocrinol. Diabetes Metab. 2021, 4, e00288. [Google Scholar] [CrossRef]
- Rawshani, A.; Rawshani, A.; Franzén, S.; Eliasson, B.; Svensson, A.M.; Miftaraj, M.; McGuire, D.K.; Sattar, N.; Rosengren, A.; Gudbjörnsdottir, S. Mortality and Cardiovascular Disease in Type 1 and Type 2 Diabetes. N. Engl. J. Med. 2017, 376, 1407–1418. [Google Scholar] [CrossRef] [Green Version]
- Iqbal, A.; Heller, S.R. The role of structured education in the management of hypoglycaemia. Diabetologia 2018, 61, 751–760. [Google Scholar] [CrossRef] [PubMed] [Green Version]
- Driscoll, K.A.; Raymond, J.; Naranjo, D.; Patton, S.R. Fear of Hypoglycemia in Children and Adolescents and Their Parents with Type 1 Diabetes. Curr. Diab. Rep. 2016, 16, 77. [Google Scholar] [CrossRef] [PubMed] [Green Version]
- Fazeli Farsani, S.; Brodovicz, K.; Soleymanlou, N.; Marquard, J.; Wissinger, E.; Maiese, B.A. Incidence and prevalence of diabetic ketoacidosis (DKA) among adults with type 1 diabetes mellitus (T1D): A systematic literature review. BMJ Open 2017, 7, e016587. [Google Scholar] [CrossRef] [Green Version]
- Zhong, V.W.; Juhaeri, J.; Cole, S.R.; Kontopantelis, E.; Shay, C.M.; Gordon-Larsen, P.; Mayer-Davis, E.J. Incidence and Trends in Hypoglycemia Hospitalization in Adults with Type 1 and Type 2 Diabetes in England, 1998-2013: A Retrospective Cohort Study. Diabetes Care 2017, 40, 1651–1660. [Google Scholar] [CrossRef] [Green Version]
- Zhong, V.W.; Juhaeri, J.; Mayer-Davis, E.J. Trends in Hospital Admission for Diabetic Ketoacidosis in Adults with Type 1 and Type 2 Diabetes in England, 1998-2013: A Retrospective Cohort Study. Diabetes Care 2018, 41, 1870–1877. [Google Scholar] [CrossRef] [Green Version]
- Bronstone, A.; Graham, C. The Potential Cost Implications of Averting Severe Hypoglycemic Events Requiring Hospitalization in High-Risk Adults with Type 1 Diabetes Using Real-Time Continuous Glucose Monitoring. J. Diabetes Sci. Technol. 2016, 10, 905–913. [Google Scholar] [CrossRef] [PubMed] [Green Version]
- Jensen, M.H.; Dethlefsen, C.; Hejlesen, O.; Vestergaard, P. Association of severe hypoglycemia with mortality for people with diabetes mellitus during a 20-year follow-up in Denmark: A cohort study. Acta Diabetol. 2020, 57, 549–558. [Google Scholar] [CrossRef] [PubMed]
- Benoit, S.R.; Zhang, Y.; Geiss, L.S.; Gregg, E.W.; Albright, A. Trends in Diabetic Ketoacidosis Hospitalizations and In-Hospital Mortality-United States, 2000-2014. MMWR Morb. Mortal Wkly. Rep. 2018, 67, 362–365. [Google Scholar] [CrossRef]
- Sukkar, S.G.; Muscaritoli, M. A Clinical Perspective of Low Carbohydrate Ketogenic Diets: A Narrative Review. Front. Nutr. 2021, 8, 642628. [Google Scholar] [CrossRef]
- Mike, H. An Interview with Low-Carb Pioneer Dr. Richard Bernstein. Available online: https://www.healthline.com/diabetesmine/interview-low-carb-pioneer-dr-richard-bernstein#1 (accessed on 7 February 2018).
- Turton, J.L.; Raab, R.; Rooney, K.B. Low-carbohydrate diets for type 1 diabetes mellitus: A systematic review. PLoS ONE 2018, 13, e0194987. [Google Scholar] [CrossRef] [Green Version]
- Nielsen, J.V.; Gando, C.; Joensson, E.; Paulsson, C. Low carbohydrate diet in type 1 diabetes, long-term improvement and adherence: A clinical audit. Diabetol. Metab. Syndr. 2012, 4, 23. [Google Scholar] [CrossRef] [PubMed] [Green Version]
- Lennerz, B.S.; Barton, A.; Bernstein, R.K.; Dikeman, R.D.; Diulus, C.; Hallberg, S.; Rhodes, E.T.; Ebbeling, C.B.; Westman, E.C.; Yancy, W.S., Jr.; et al. Management of Type 1 Diabetes with a Very Low-Carbohydrate Diet. Pediatrics 2018, 141, e20173349. [Google Scholar] [CrossRef] [Green Version]
- Bolla, A.M.; Caretto, A.; Laurenzi, A.; Scavini, M.; Piemonti, L. Low-Carb and Ketogenic Diets in Type 1 and Type 2 Diabetes. Nutrients 2019, 11, 962. [Google Scholar] [CrossRef] [PubMed] [Green Version]
- Scalfi, L.; Censi, L.; Marra, M.; Maffeis, C.; Pecoraro, P.; Polito, A.; Strata, A.; Tagliabue, A. Nutrients and Energy Reference Intake for Italian Population; 4th Revision; SINU (Italian Society of Human Nutrition): Milan, Italy, 2014. [Google Scholar]
- Diabetes Control and Complications Trial (DCCT); Epidemiology of Diabetes Interventions and Complications (EDIC) Study Research Group. Intensive Diabetes Treatment and Cardiovascular Outcomes in Type 1 Diabetes: The DCCT/EDIC Study 30-Year Follow-up. Diabetes Care 2016, 39, 686–693. [Google Scholar] [CrossRef] [PubMed] [Green Version]
- Oram, R.A.; Jones, A.G.; Besser, R.E.J.; Knight, B.A.; Shields, B.M.; Brown, R.J.; Hattersley, A.T.; McDonald, T.J. The majority of patients with long-duration type 1 diabetes are insulin microsecretors and have functioning beta cells. Diabetologia 2014, 57, 187–191. [Google Scholar] [CrossRef] [PubMed] [Green Version]
- Zhong, W.; Mao, Y. Daily Insulin Dose and Cancer Risk Among Patients with Type 1 Diabetes. JAMA Oncol. 2022. [Google Scholar] [CrossRef] [PubMed]

| Feature | Value * |
|---|---|
| Number of Patients | 33 |
| Number of Females | 23 (69.7%) |
| Age (y) | 41.6 ± 15.0 |
| Years of Diabetes | 14.3 ± 11.3 |
| Before n = 33 | After n = 33 | Variation | ||
|---|---|---|---|---|
| Mean (95% CI) | p * | |||
| Weight (kg) | 68.9 (13.5) | 66 (60, 80) | 0.36 (−0.62, 1.35) | 0.456 |
| BMI (kg/m2) | 23.9 (3.6) | 24.1 (3.1) | 0.14 (−0.20, 0.48) | 0.419 |
| BMI group, N (%) | 0.083 § | |||
| <25 kg/m2 | 24 (72.7) | 26 (78.8) | - | |
| 25–30 kg/m2 | 7 (21.2) | 6 (18.2) | ||
| 30–35 kg/m2 | 2 (6.1) | 1 (3.0) | ||
| SBP (mmHg) | 129.6 (7.8) | 128.6 (10.1) | −0.97 (−3.80, 1.86) | 0.491 |
| DBP (mmHg) | 79.1 (5.1) | 79.0 (5.3) | −0.09 (−2.22, 2.04) | 0.931 |
| Total cholesterol (mg/dL) | 180.3 (36.2) | 169.8 (38.4) | −10.6 (−21.3, 0.1) | 0.052 |
| LDL (mg/dL) | 98.5 (36.1) | 84.4 (26.2) | −14.1 (−23.6, −4.6) | 0.005 |
| HDL (mg/dL) | 67.0 (14.5) | 71.3 (18.9) | 4.27 (0.00, 8.55) | 0.050 |
| Non-HDL (mg/dL) | 113.3 (36.4) | 98.5 (27.3) | −14.9 (−24.4, −5.3) | 0.003 |
| LDL/HDR ratio | 1.6 (0.8) | 1.2 (0.4) | −0.33 (−0.52, −0.13) | 0.002 |
| TG (mg/dL) | 74.2 (31.8) | 70.4 (28.9) | −3.73 (−8.02, 0.57) | 0.087 |
| TG/HDR ratio | 1.2 (0.6) | 1.1 (0.5) | −0.11 (−0.25, 0.02) | 0.097 |
| CKD–EPI (ml/min) | 95.7 (20.9) | 94.2 (20.6) | −1.58 (−3.32, 0.17) | 0.075 |
| N (%) | HbA1c After | ||||
|---|---|---|---|---|---|
| <7 (mg/dL) | 7–8 (mg/dL) | 8–9 (mg/dL) | >9 (mg/dL) | ||
| HbA1c Before | <7 (mg/dL) | 4 (12.1) | 0 (0.0) | 0 (0.0) | 0 (0.0) |
| 7–8 (mg/dL) | 6 (18.2) | 5 (15.2) | 0 (0.0) | 0 (0.0) | |
| 8–9 (mg/dL) | 6 (18.2) | 5 (15.2) | 0 (0.0) | 0 (0.0) | |
| >9 (mg/dL) | 3 (9.1) | 3 (9.1) | 1 (3.0) | 0 (0.0) | |
| Before, n = 33 | After n = 33 | Variation | ||
|---|---|---|---|---|
| Mean (95% CI) | p * | |||
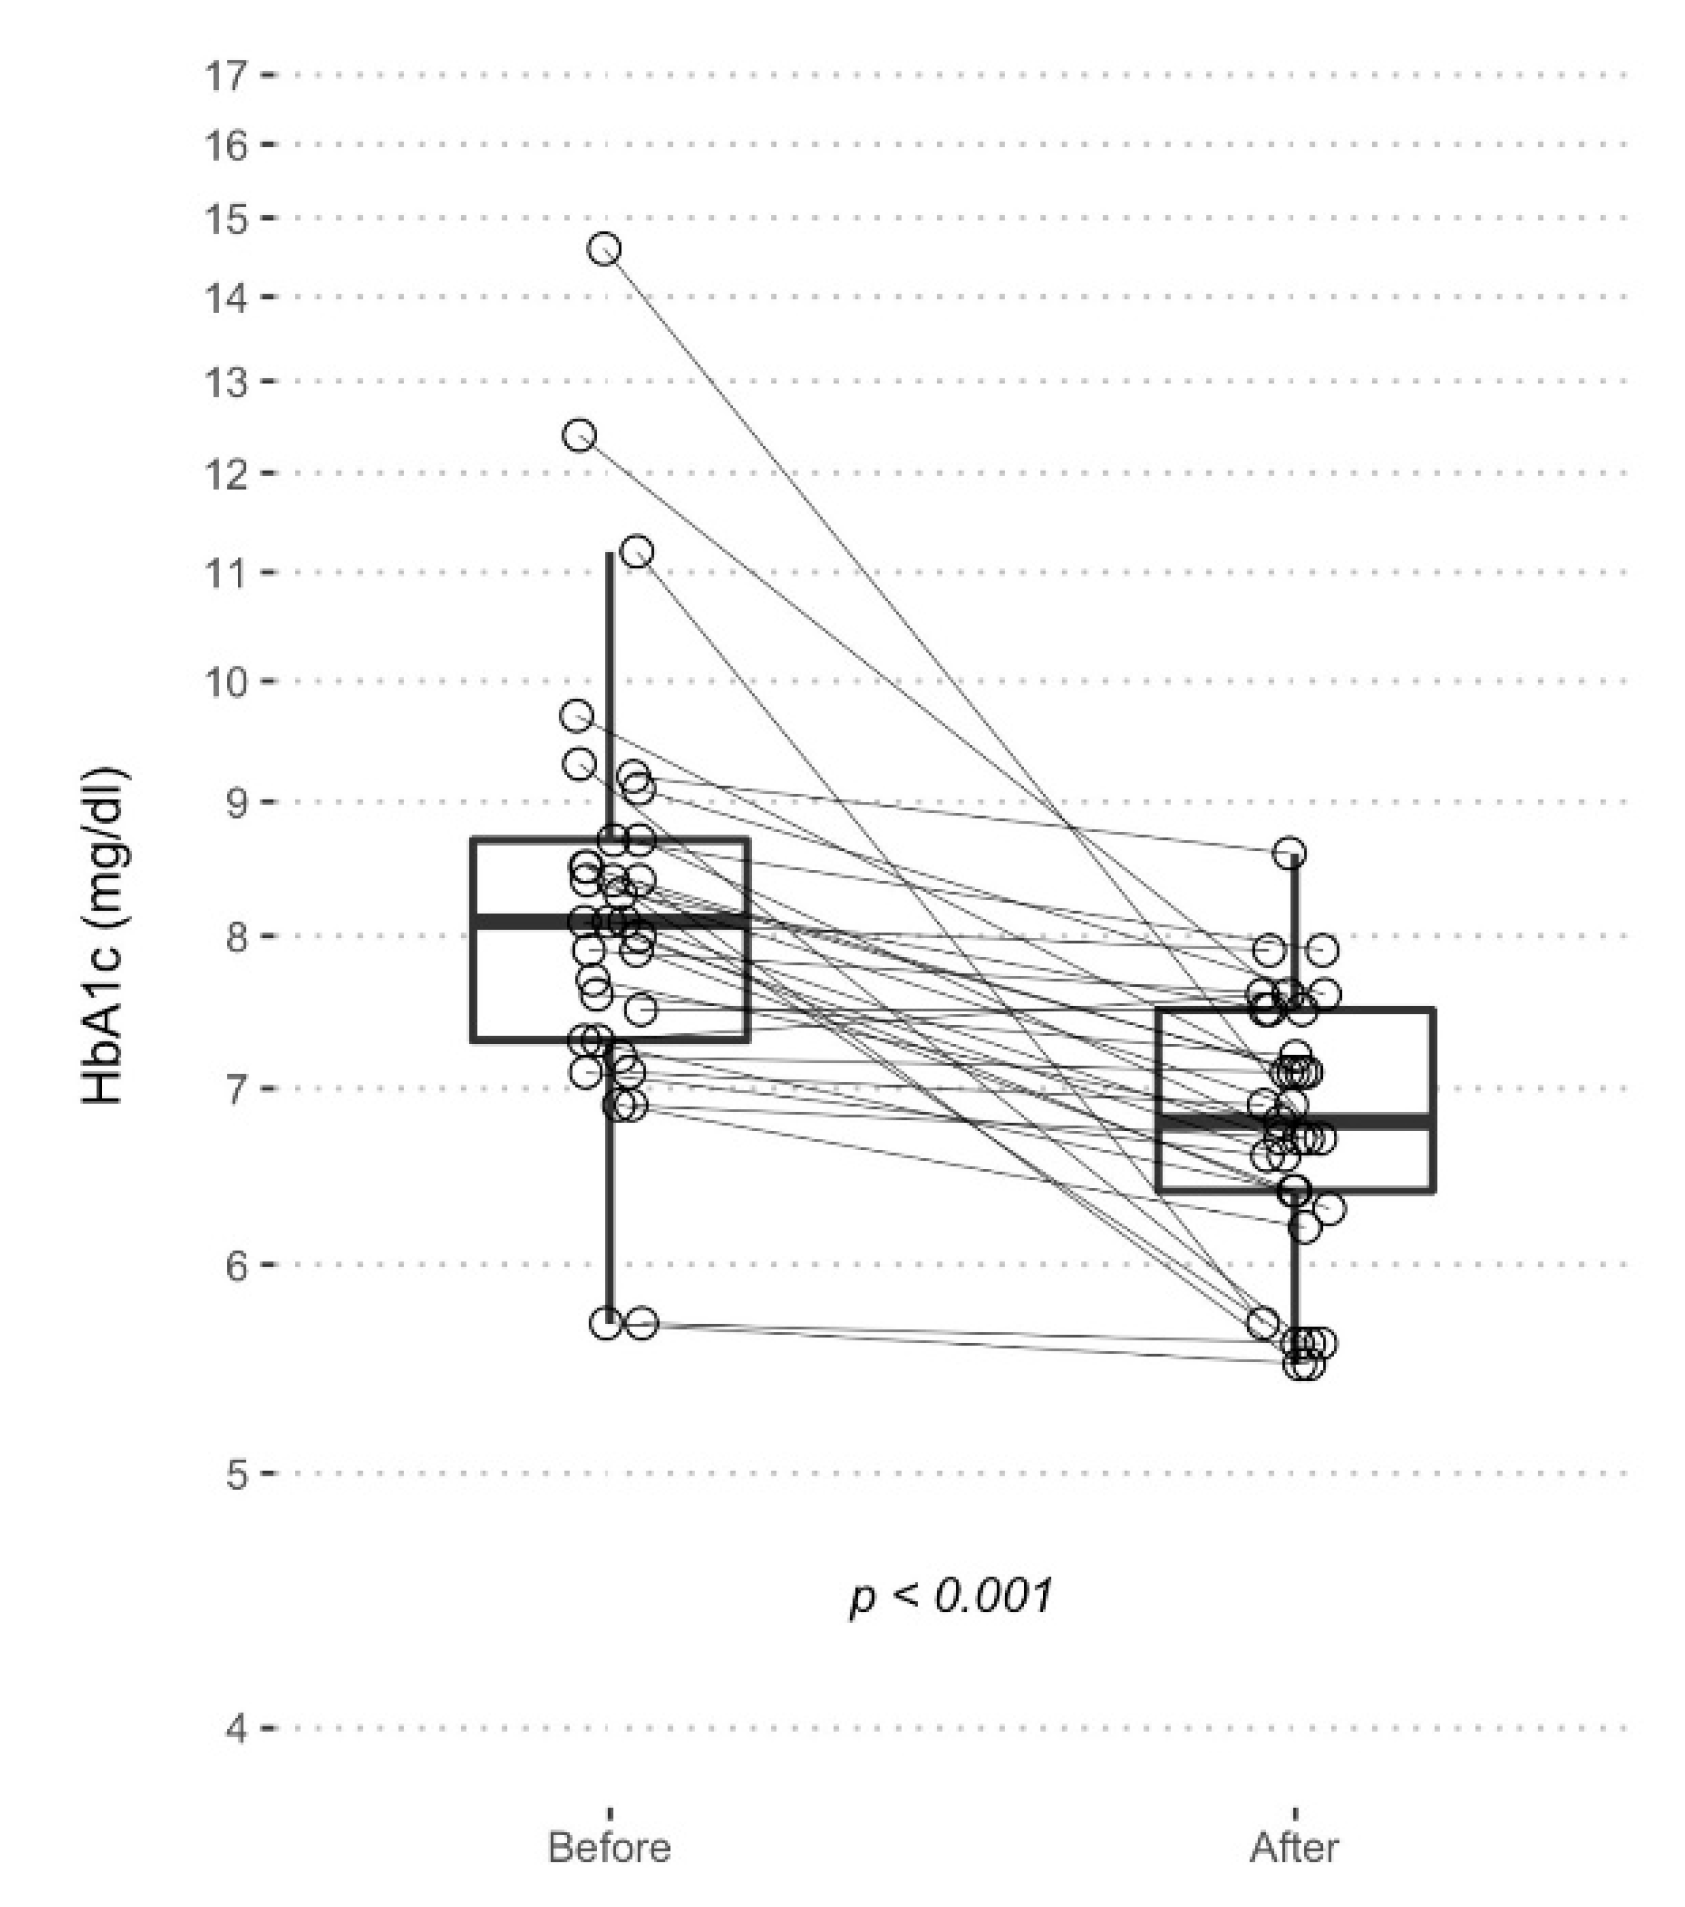
| % HbA1c | 8.3 (1.7) | 6.8 (0.8) | −1.54 (−2.17, −0.91) | <0.001 |
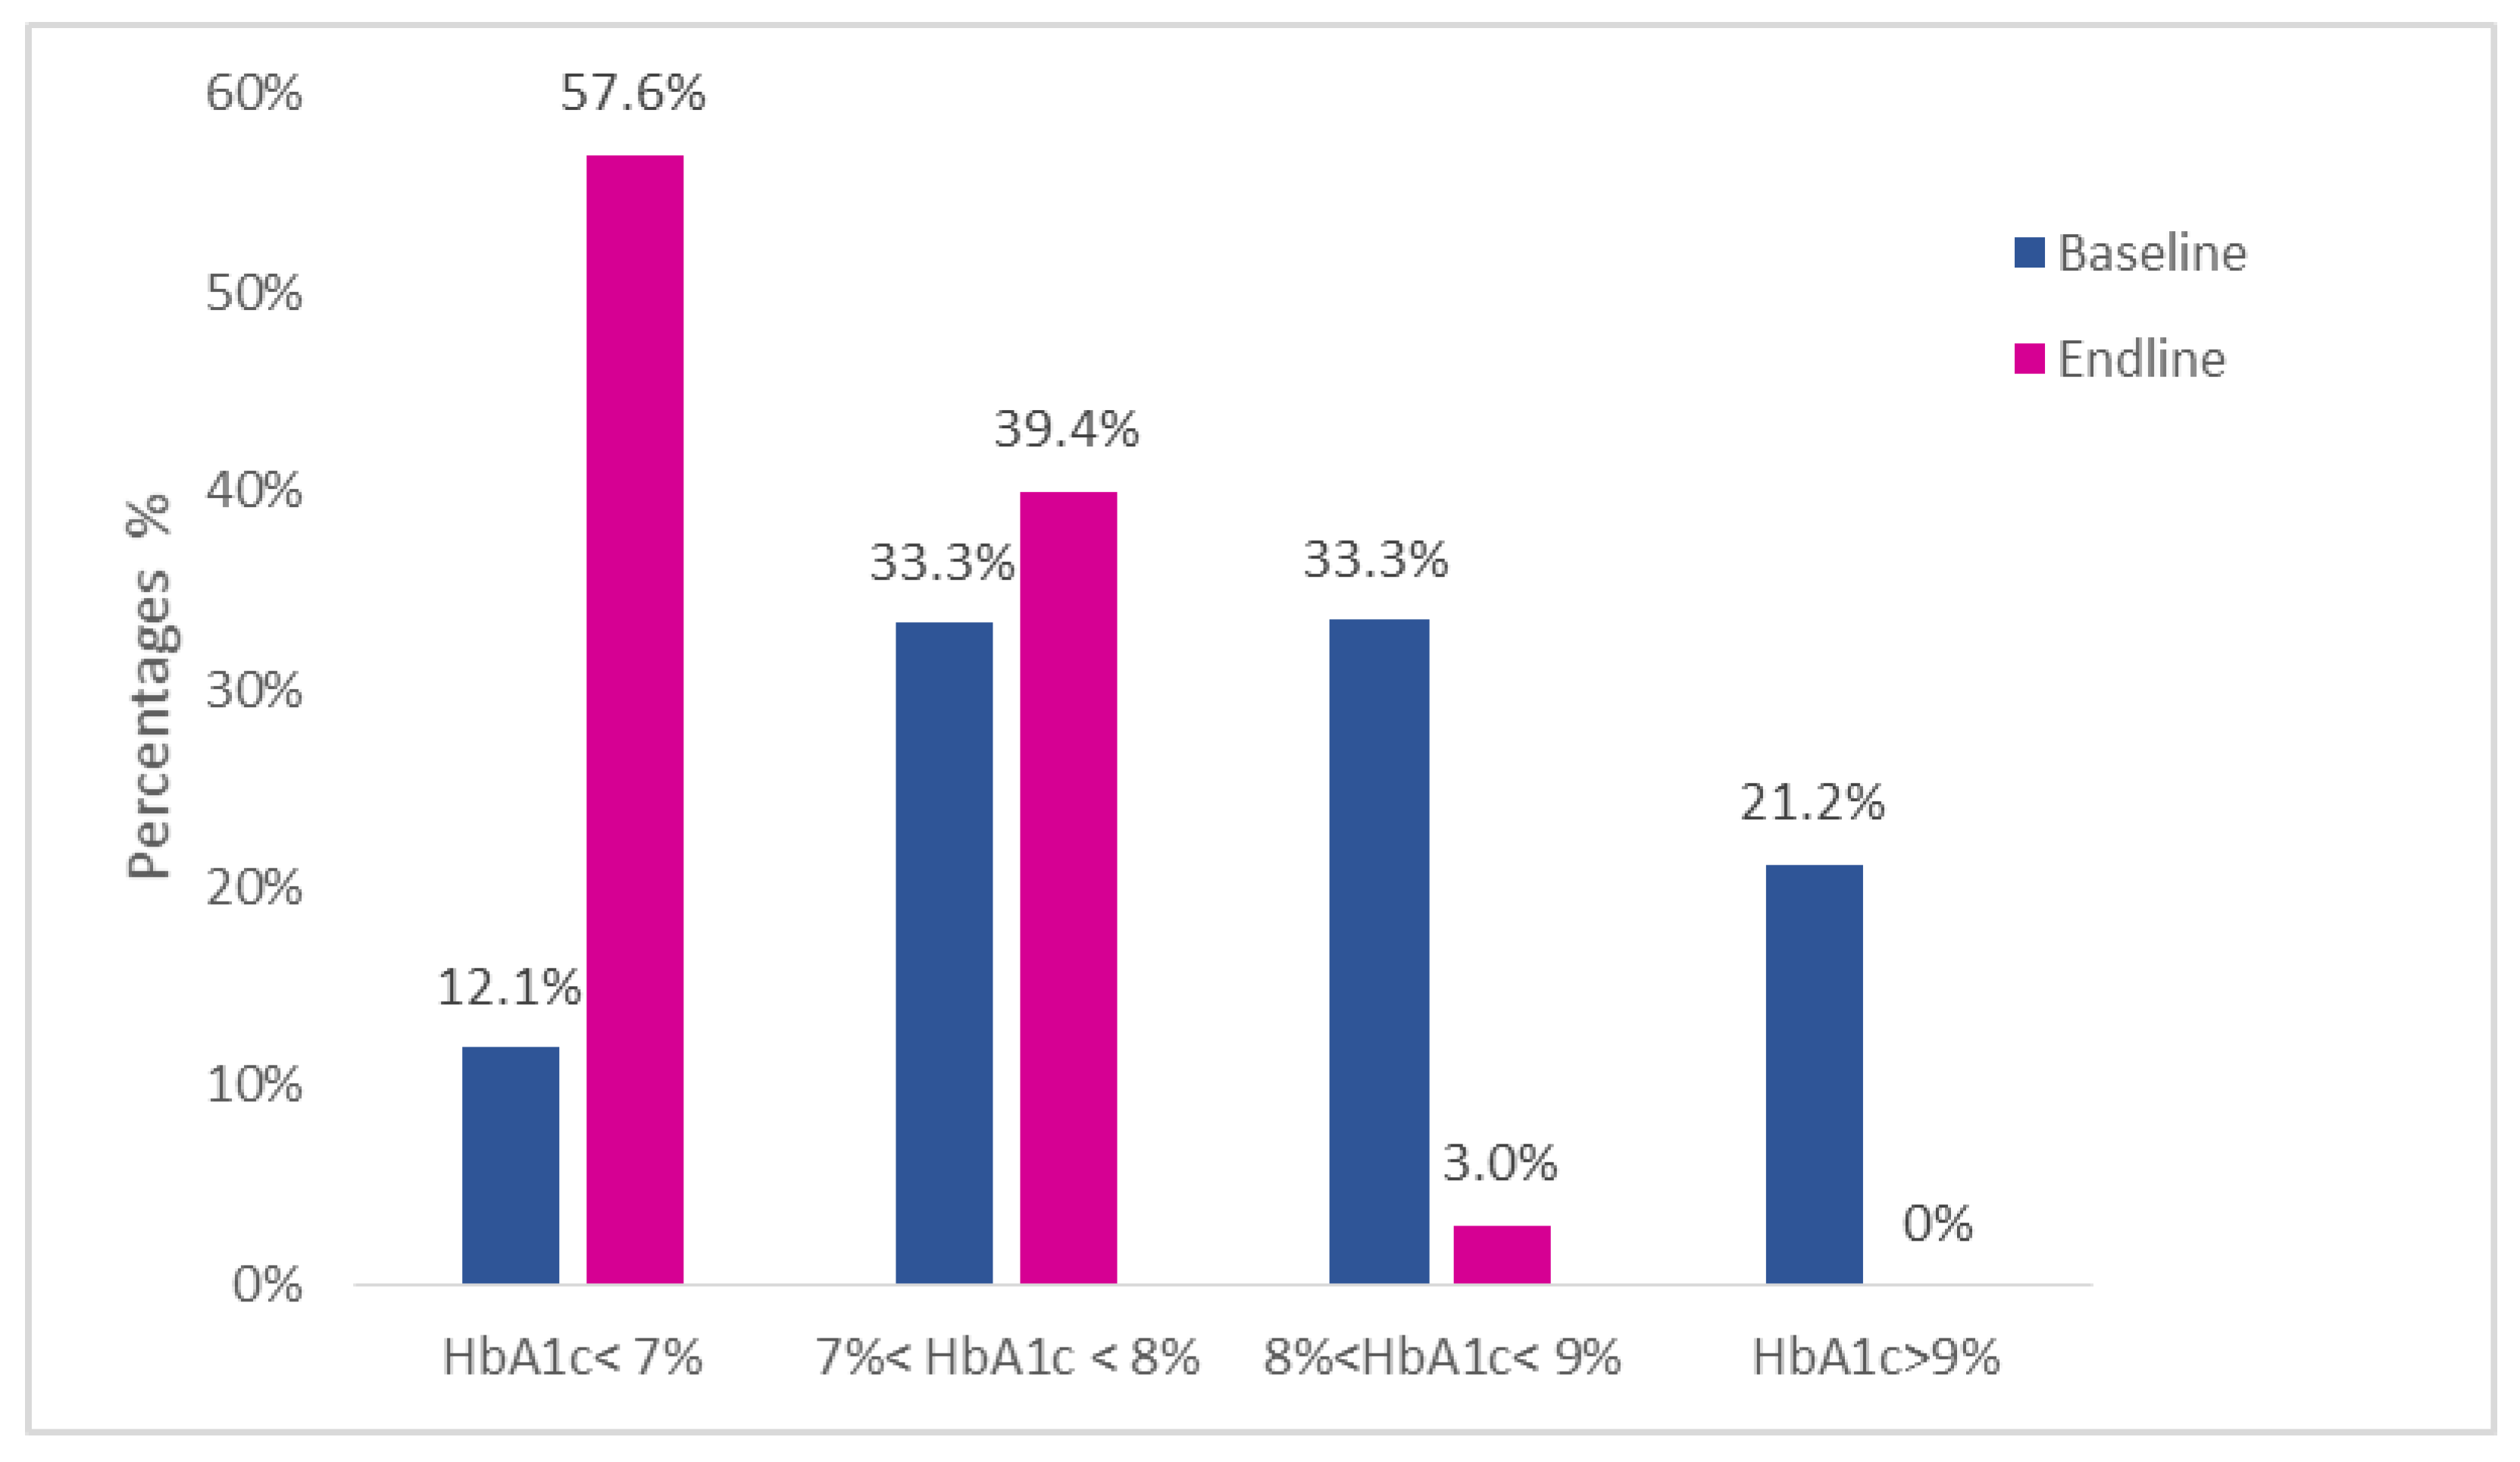
| HbA1c group, N (%) | - | 0.001 | ||
| <7% | 4 (12.1) | 19 (57.6) | ||
| 7 to 8% | 11 (33.3) | 13 (39.4) | ||
| 8 to 9% | 11 (33.3) | 1 (3.0) | ||
| >9% | 7 (21.2) | 0 (0.0) | ||
| Level 2 Hypoglycemia, N (%) | 18 (54.5) | 8 (24.2) | - | 0.034 |
| Severe Hypoglycemia, N (%) | 10 (30.3) | 0 (0) | - | <0.001 |
| IU Total Insulin | 36.7 (14.9) | 28.9 (9.1) | −7.7 (−11.0, −4.5) | <0.001 |
| IU/kg/day | 0.54 (0.22) | 0.42 (0.12) | −0.12 (−0.17, −0.07) | <0.001 |
| IU Rapid-acting Insulin | 18.3 (9.5) | 10.3 (6.5) | -8.0 (−10.3, −5.7) | <0.001 |
| % Rapid-acting Insulin | 49 (13) | 34 (12) | −15 (−19, −11) | <0.001 |
| IU Basal Insulin | 18.3 (8.0) | 18.6 (5.1) | 0.3 (−1.5, 2.1) | 0.760 |
| % Basal Insulin | 0.51 (0.13) | 0.66 (0.12) | 15 (11, 19) | <0.001 |
Publisher’s Note: MDPI stays neutral with regard to jurisdictional claims in published maps and institutional affiliations. |
© 2022 by the authors. Licensee MDPI, Basel, Switzerland. This article is an open access article distributed under the terms and conditions of the Creative Commons Attribution (CC BY) license (https://creativecommons.org/licenses/by/4.0/).
Share and Cite
Kleiner, A.; Cum, B.; Pisciotta, L.; Cincione, I.R.; Cogorno, L.; Prigione, A.; Tramacere, A.; Vignati, A.; Carmisciano, L.; Sukkar, S.G. Safety and Efficacy of Eucaloric Very Low-Carb Diet (EVLCD) in Type 1 Diabetes: A One-Year Real-Life Retrospective Experience. Nutrients 2022, 14, 3208. https://doi.org/10.3390/nu14153208
Kleiner A, Cum B, Pisciotta L, Cincione IR, Cogorno L, Prigione A, Tramacere A, Vignati A, Carmisciano L, Sukkar SG. Safety and Efficacy of Eucaloric Very Low-Carb Diet (EVLCD) in Type 1 Diabetes: A One-Year Real-Life Retrospective Experience. Nutrients. 2022; 14(15):3208. https://doi.org/10.3390/nu14153208
Chicago/Turabian StyleKleiner, Andrea, Barbara Cum, Livia Pisciotta, Ivan Raffaele Cincione, Ludovica Cogorno, Amalia Prigione, Antonio Tramacere, Andrea Vignati, Luca Carmisciano, and Samir Giuseppe Sukkar. 2022. "Safety and Efficacy of Eucaloric Very Low-Carb Diet (EVLCD) in Type 1 Diabetes: A One-Year Real-Life Retrospective Experience" Nutrients 14, no. 15: 3208. https://doi.org/10.3390/nu14153208
APA StyleKleiner, A., Cum, B., Pisciotta, L., Cincione, I. R., Cogorno, L., Prigione, A., Tramacere, A., Vignati, A., Carmisciano, L., & Sukkar, S. G. (2022). Safety and Efficacy of Eucaloric Very Low-Carb Diet (EVLCD) in Type 1 Diabetes: A One-Year Real-Life Retrospective Experience. Nutrients, 14(15), 3208. https://doi.org/10.3390/nu14153208