
Gut Microbiota Patterns Predicting Long-Term Weight Loss Success in Individuals with Obesity Undergoing Nonsurgical Therapy

 , ,
, , 
Abstract
: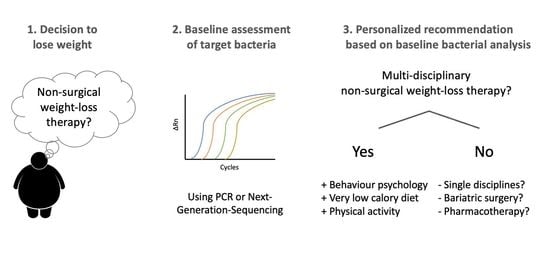
1. Introduction
2. Materials and Methods
2.1. Weight-Loss Intervention Trial
2.2. Analysis of Gut Microbiota
2.3. Correlation Coefficients
2.4. Metagenomic Data Sets Used for Statistical Modeling
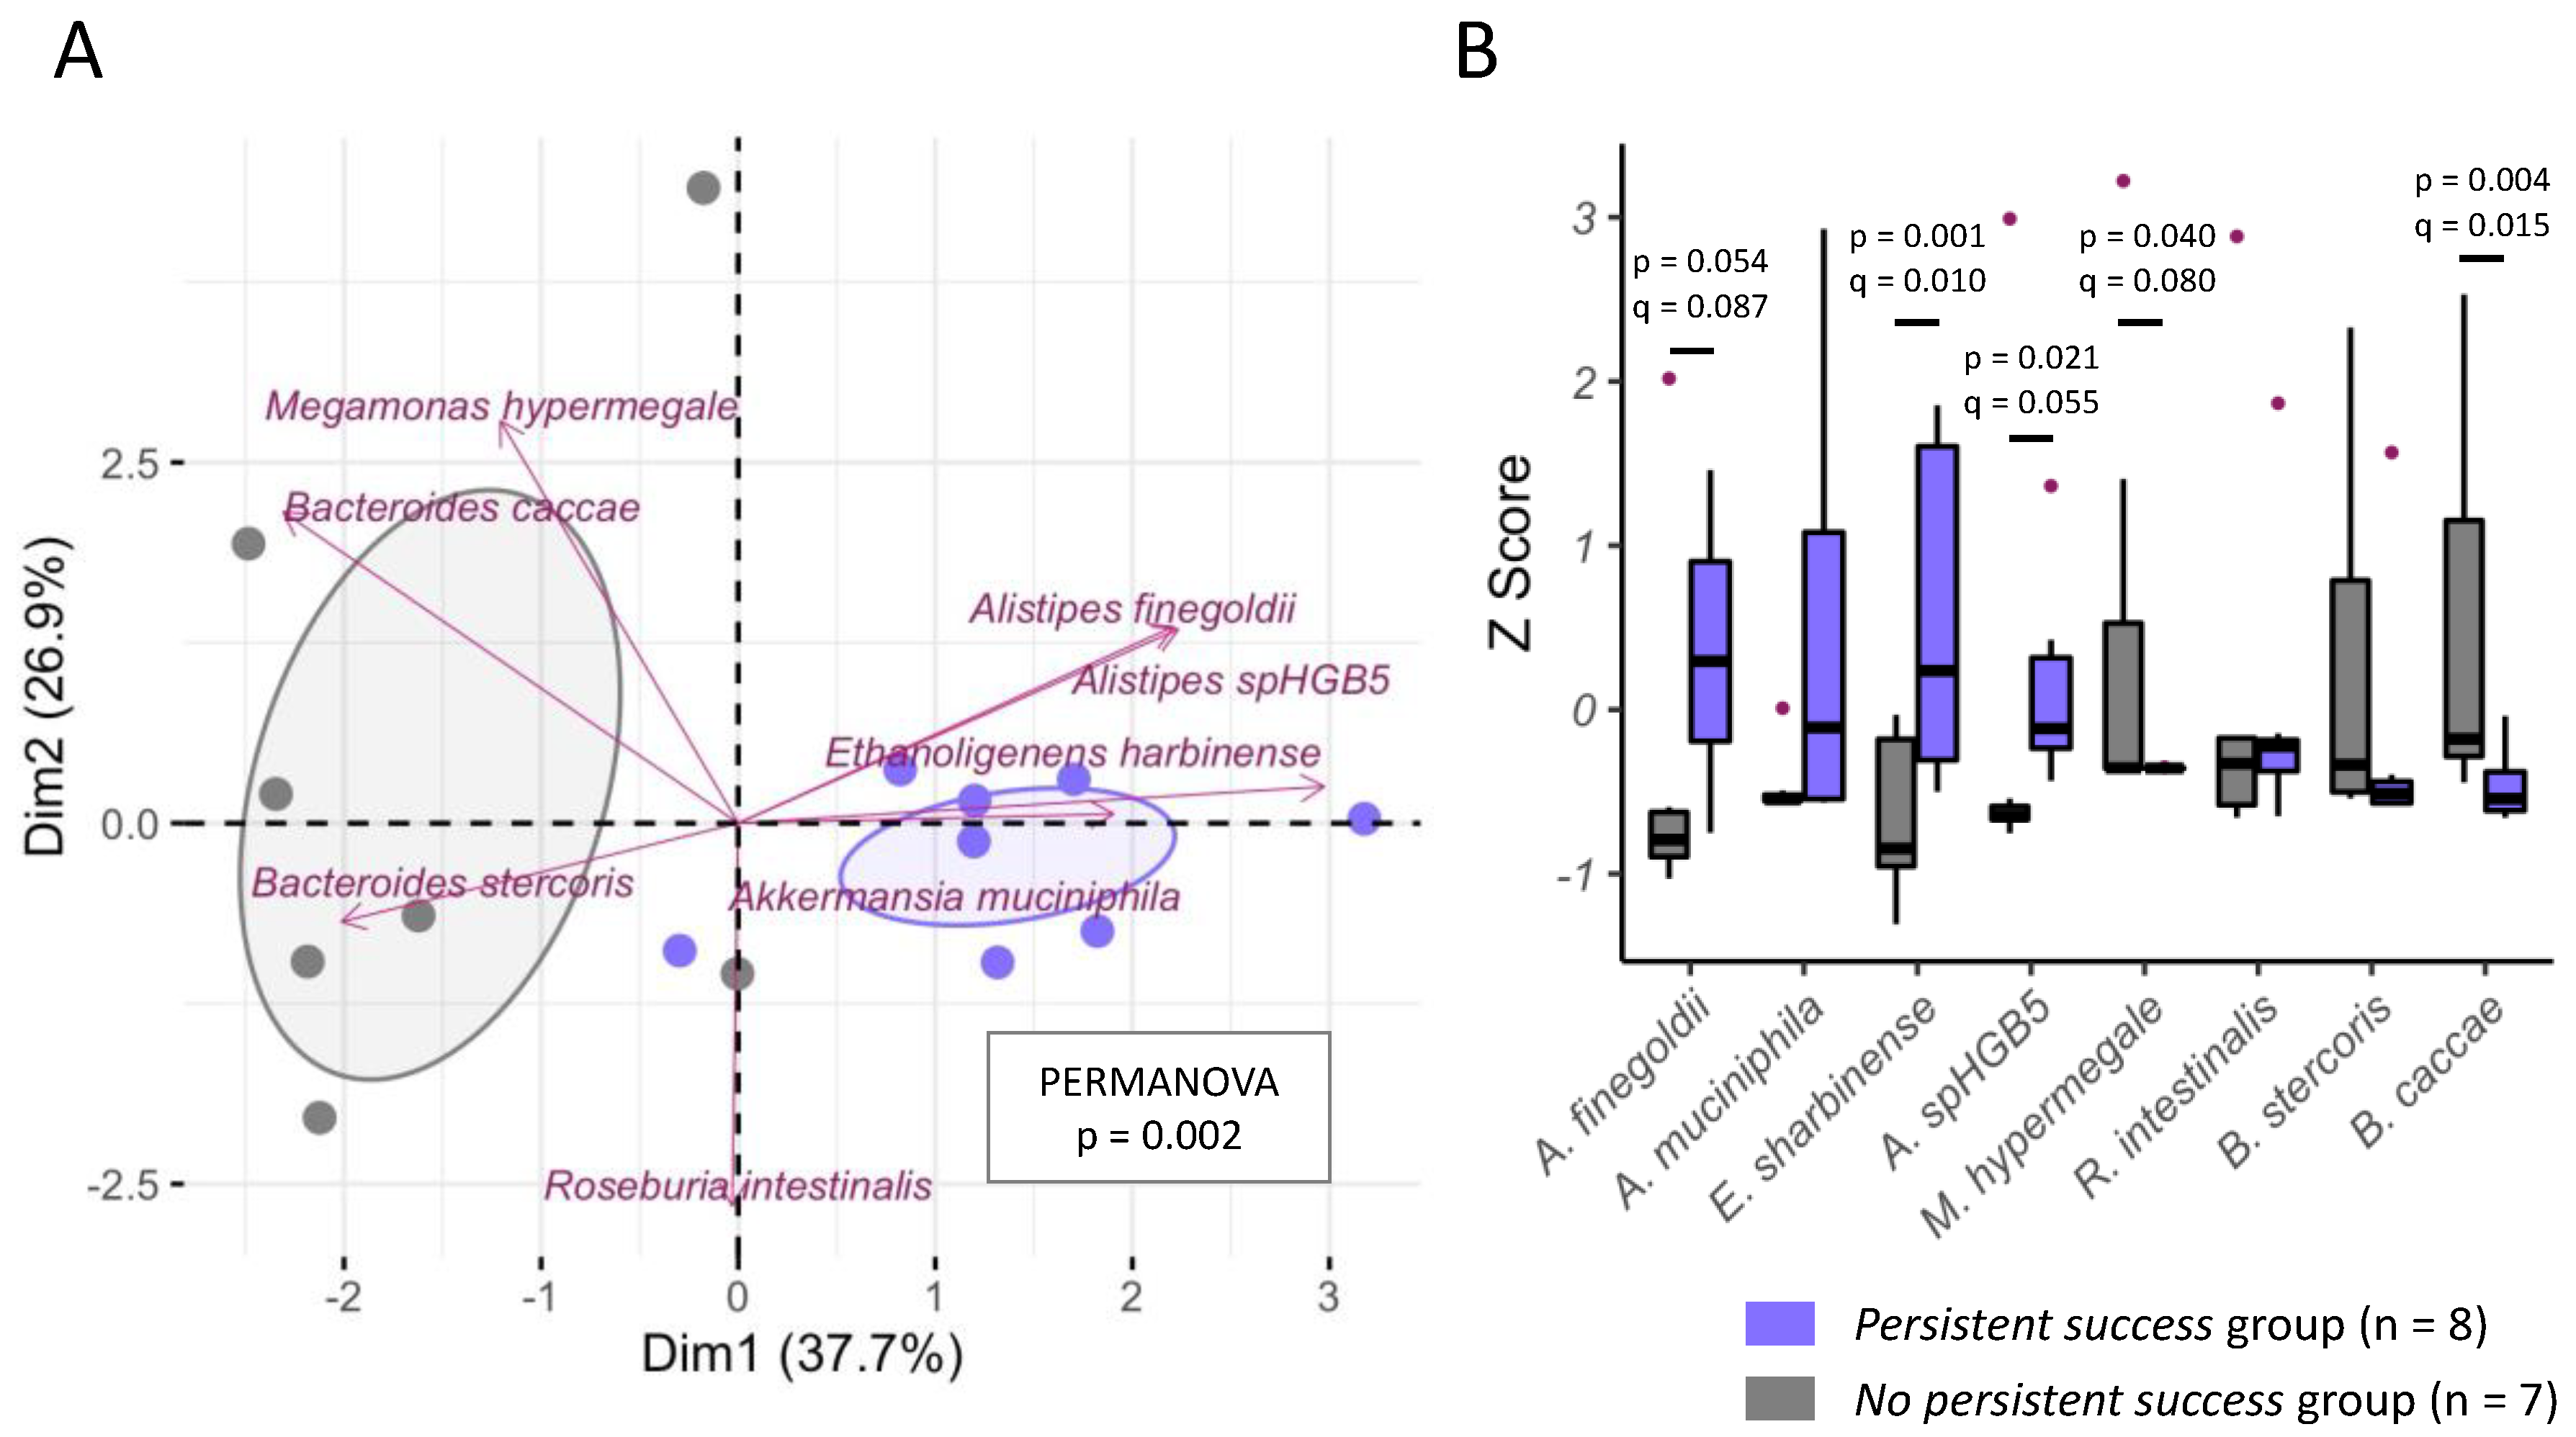
2.5. Ordination and Differential Abundance Analyses
3. Results
3.1. Elastic Net Regularization
3.2. Monte Carlo (MC) Approach Using Multiple Linear Regression Models
3.3. Final List of Selected Predictor Variables
3.4. Weight-Loss Prediction
4. Discussion
5. Conclusions
Supplementary Materials
Author Contributions
Funding
Institutional Review Board Statement
Informed Consent Statement
Data Availability Statement
Conflicts of Interest
References
- Janssen, F.; Bardoutsos, A.; Vidra, N. Obesity Prevalence in the Long-Term Future in 18 European Countries and in the USA. Obes. Facts 2020, 13, 514–527. [Google Scholar] [CrossRef] [PubMed]
- Courcoulas, A.P.; Yanovski, S.Z.; Bonds, D.; Eggerman, T.L.; Horlick, M.; Staten, M.A.; Arterburn, D.E. Long-Term Outcomes of Bariatric Surgery: A National Institutes of Health Symposium. JAMA Surg. 2014, 149, 1323–1329. [Google Scholar] [CrossRef]
- Montesi, L.; El Ghoch, M.; Brodosi, L.; Calugi, S.; Marchesini, G.; Dalle Grave, R. Long-Term Weight Loss Maintenance for Obesity: A Multidisciplinary Approach. Diabetes Metab. Syndr. Obes. Targets Ther. 2016, 9, 37–46. [Google Scholar] [CrossRef] [Green Version]
- Koliaki, C.; Spinos, T.; Spinou, Μ.; Brinia, Μ.-E.; Mitsopoulou, D.; Katsilambros, N. Defining the Optimal Dietary Approach for Safe, Effective and Sustainable Weight Loss in Overweight and Obese Adults. Healthcare 2018, 6, 73. [Google Scholar] [CrossRef] [PubMed] [Green Version]
- Bischoff, S.C.; Damms-Machado, A.; Betz, C.; Herpertz, S.; Legenbauer, T.; Löw, T.; Wechsler, J.G.; Bischoff, G.; Austel, A.; Ellrott, T. Multicenter Evaluation of an Interdisciplinary 52-Week Weight Loss Program for Obesity with Regard to Body Weight, Comorbidities and Quality of Life—A Prospective Study. Int. J. Obes. 2012, 36, 614–624. [Google Scholar] [CrossRef] [Green Version]
- Cotillard, A.; Kennedy, S.P.; Kong, L.C.; Prifti, E.; Pons, N.; Le Chatelier, E.; Almeida, M.; Quinquis, B.; Levenez, F.; Galleron, N.; et al. Dietary Intervention Impact on Gut Microbial Gene Richness. Nature 2013, 500, 585–588. [Google Scholar] [CrossRef]
- Louis, S.; Tappu, R.-M.; Damms-Machado, A.; Huson, D.H.; Bischoff, S.C. Characterization of the Gut Microbial Community of Obese Patients Following a Weight-Loss Intervention Using Whole Metagenome Shotgun Sequencing. PLoS ONE 2016, 11, e0149564. [Google Scholar] [CrossRef]
- Biesiekierski, J.R.; Jalanka, J.; Staudacher, H.M. Can Gut Microbiota Composition Predict Response to Dietary Treatments? Nutrients 2019, 11, 1134. [Google Scholar] [CrossRef] [Green Version]
- Wing, R.R.; Hill, J.O. Successful Weight Loss Maintenance. Annu. Rev. Nutr. 2001, 21, 323–341. [Google Scholar] [CrossRef]
- Schmieder, R.; Edwards, R. Quality Control and Preprocessing of Metagenomic Datasets. Bioinforma. Oxf. Engl. 2011, 27, 863–864. [Google Scholar] [CrossRef] [Green Version]
- Fricker, A.M.; Podlesny, D.; Fricke, W.F. What Is New and Relevant for Sequencing-Based Microbiome Research? A Mini-Review. J. Adv. Res. 2019, 19, 105–112. [Google Scholar] [CrossRef] [PubMed]
- Oksanen, J.; Blanchet, F.G.; Friendly, M.; Kindt, R.; Legendre, P.; McGlinn, D.; Minchin, P.R.; O’Hara, R.B.; Simpson, G.L.; Solymos, P.; et al. Vegan: Community Ecology Package. R Package Version 2.5-7. 2020. Available online: https://CRAN.R-project.org/package=vegan (accessed on 20 November 2021).
- Nguyen, N.K.; Deehan, E.C.; Zhang, Z.; Jin, M.; Baskota, N.; Perez-Muñoz, M.E.; Cole, J.; Tuncil, Y.E.; Seethaler, B.; Wang, T.; et al. Gut Microbiota Modulation with Long-Chain Corn Bran Arabinoxylan in Adults with Overweight and Obesity Is Linked to an Individualized Temporal Increase in Fecal Propionate. Microbiome 2020, 8, 118. [Google Scholar] [CrossRef] [PubMed]
- Vals-Delgado, C.; Alcala-Diaz, J.F.; Molina-Abril, H.; Roncero-Ramos, I.; Caspers, M.P.M.; Schuren, F.H.J.; Van den Broek, T.J.; Luque, R.; Perez-Martinez, P.; Katsiki, N.; et al. An Altered Microbiota Pattern Precedes Type 2 Diabetes Mellitus Development: From the CORDIOPREV Study. J. Adv. Res. 2022, 35, 99–108. [Google Scholar] [CrossRef] [PubMed]
- Deehan, E.C.; Zhang, Z.; Riva, A.; Armet, A.M.; Perez-Muñoz, M.E.; Nguyen, N.K.; Krysa, J.A.; Seethaler, B.; Zhao, Y.-Y.; Cole, J.; et al. Elucidating the Role of the Gut Microbiota in the Physiological Effects of Dietary Fiber. Microbiome 2022, 10, 77. [Google Scholar] [CrossRef] [PubMed]
- Bliesner, A.; Eccles-Smith, J.; Bates, C.; Hayes, O.; Ho, J.Y.; Martins, C.; Truby, H.; Nitert, M.D. Impact of Food-Based Weight Loss Interventions on Gut Microbiome in Individuals with Obesity: A Systematic Review. Nutrients 2022, 14, 1953. [Google Scholar] [CrossRef] [PubMed]
- Lapthorne, S.; Bines, J.E.; Fouhy, F.; Dellios, N.L.; Wilson, G.; Thomas, S.L.; Scurr, M.; Stanton, C.; Cotter, P.D.; Pereira-Fantini, P.M. Changes in the Colon Microbiota and Intestinal Cytokine Gene Expression Following Minimal Intestinal Surgery. World J. Gastroenterol. 2015, 21, 4150–4158. [Google Scholar] [CrossRef]
- Kang, Y.; Li, Y.; Du, Y.; Guo, L.; Chen, M.; Huang, X.; Yang, F.; Hong, J.; Kong, X. Konjaku Flour Reduces Obesity in Mice by Modulating the Composition of the Gut Microbiota. Int. J. Obes. 2019, 43, 1631–1643. [Google Scholar] [CrossRef]
- Dao, M.C.; Everard, A.; Clément, K.; Cani, P.D. Losing Weight for a Better Health: Role for the Gut Microbiota. Clin. Nutr. Exp. 2016, 6, 39–58. [Google Scholar] [CrossRef]
- Zhang, X.; Shen, D.; Fang, Z.; Jie, Z.; Qiu, X.; Zhang, C.; Chen, Y.; Ji, L. Human Gut Microbiota Changes Reveal the Progression of Glucose Intolerance. PLoS ONE 2013, 8, e71108. [Google Scholar] [CrossRef]
- Yassour, M.; Lim, M.Y.; Yun, H.S.; Tickle, T.L.; Sung, J.; Song, Y.-M.; Lee, K.; Franzosa, E.A.; Morgan, X.C.; Gevers, D.; et al. Sub-Clinical Detection of Gut Microbial Biomarkers of Obesity and Type 2 Diabetes. Genome Med. 2016, 8, 17. [Google Scholar] [CrossRef] [Green Version]
- Li, J.; Zhao, F.; Wang, Y.; Chen, J.; Tao, J.; Tian, G.; Wu, S.; Liu, W.; Cui, Q.; Geng, B.; et al. Gut Microbiota Dysbiosis Contributes to the Development of Hypertension. Microbiome 2017, 5, 14. [Google Scholar] [CrossRef] [PubMed] [Green Version]
- Liu, R.; Hong, J.; Xu, X.; Feng, Q.; Zhang, D.; Gu, Y.; Shi, J.; Zhao, S.; Liu, W.; Wang, X.; et al. Gut Microbiome and Serum Metabolome Alterations in Obesity and after Weight-Loss Intervention. Nat. Med. 2017, 23, 859–868. [Google Scholar] [CrossRef]
- Pinart, M.; Dötsch, A.; Schlicht, K.; Laudes, M.; Bouwman, J.; Forslund, S.K.; Pischon, T.; Nimptsch, K. Gut Microbiome Composition in Obese and Non-Obese Persons: A Systematic Review and Meta-Analysis. Nutrients 2021, 14, 12. [Google Scholar] [CrossRef] [PubMed]
- Palleja, A.; Kashani, A.; Allin, K.H.; Nielsen, T.; Zhang, C.; Li, Y.; Brach, T.; Liang, S.; Feng, Q.; Jørgensen, N.B.; et al. Roux-En-Y Gastric Bypass Surgery of Morbidly Obese Patients Induces Swift and Persistent Changes of the Individual Gut Microbiota. Genome Med. 2016, 8, 67. [Google Scholar] [CrossRef] [PubMed] [Green Version]
- Ueda, K.; Beppu, T. Lessons from Studies of Symbiobacterium thermophilum, a Unique Syntrophic Bacterium. Biosci. Biotechnol. Biochem. 2007, 71, 1115–1121. [Google Scholar] [CrossRef] [PubMed] [Green Version]
- Federico, A.; Dallio, M.; Tolone, S.; Gravina, A.G.; Patrone, V.; Romano, M.; Tuccillo, C.; Mozzillo, A.L.; Amoroso, V.; Misso, G.; et al. Gastrointestinal Hormones, Intestinal Microbiota and Metabolic Homeostasis in Obese Patients: Effect of Bariatric Surgery. In Vivo 2016, 30, 321–330. [Google Scholar]
- Patrone, V.; Vajana, E.; Minuti, A.; Callegari, M.L.; Federico, A.; Loguercio, C.; Dallio, M.; Tolone, S.; Docimo, L.; Morelli, L. Postoperative Changes in Fecal Bacterial Communities and Fermentation Products in Obese Patients Undergoing Bilio-Intestinal Bypass. Front. Microbiol. 2016, 7, 200. [Google Scholar] [CrossRef] [Green Version]
- Lippert, K.; Kedenko, L.; Antonielli, L.; Kedenko, I.; Gemeier, C.; Leitner, M.; Kautzky-Willer, A.; Paulweber, B.; Hackl, E. Gut Microbiota Dysbiosis Associated with Glucose Metabolism Disorders and the Metabolic Syndrome in Older Adults. Benef. Microbes 2017, 8, 545–556. [Google Scholar] [CrossRef] [PubMed]
- Hu, H.-J.; Park, S.-G.; Jang, H.B.; Choi, M.-G.; Park, K.-H.; Kang, J.H.; Park, S.I.; Lee, H.-J.; Cho, S.-H. Obesity Alters the Microbial Community Profile in Korean Adolescents. PLoS ONE 2015, 10, e0134333. [Google Scholar] [CrossRef] [PubMed] [Green Version]
- Henning, S.M.; Yang, J.; Hsu, M.; Lee, R.-P.; Grojean, E.M.; Ly, A.; Tseng, C.-H.; Heber, D.; Li, Z. Decaffeinated Green and Black Tea Polyphenols Decrease Weight Gain and Alter Microbiome Populations and Function in Diet-Induced Obese Mice. Eur. J. Nutr. 2018, 57, 2759–2769. [Google Scholar] [CrossRef]
- Menni, C.; Jackson, M.A.; Pallister, T.; Steves, C.J.; Spector, T.D.; Valdes, A.M. Gut Microbiome Diversity and High-Fibre Intake Are Related to Lower Long-Term Weight Gain. Int. J. Obes. 2017, 41, 1099–1105. [Google Scholar] [CrossRef] [PubMed] [Green Version]
- Ranaivo, H.; Zhang, Z.; Alligier, M.; Van Den Berghe, L.; Sothier, M.; Lambert-Porcheron, S.; Feugier, N.; Cuerq, C.; Machon, C.; Neyrinck, A.M.; et al. Chitin-Glucan Supplementation Improved Postprandial Metabolism and Altered Gut Microbiota in Subjects at Cardiometabolic Risk in a Randomized Trial. Sci. Rep. 2022, 12, 8830. [Google Scholar] [CrossRef] [PubMed]
- Neyrinck, A.M.; Rodriguez, J.; Zhang, Z.; Seethaler, B.; Sánchez, C.R.; Roumain, M.; Hiel, S.; Bindels, L.B.; Cani, P.D.; Paquot, N.; et al. Prebiotic Dietary Fibre Intervention Improves Fecal Markers Related to Inflammation in Obese Patients: Results from the Food4Gut Randomized Placebo-Controlled Trial. Eur. J. Nutr. 2021, 60, 3159–3170. [Google Scholar] [CrossRef]
- Raman, M.; Ahmed, I.; Gillevet, P.M.; Probert, C.S.; Ratcliffe, N.M.; Smith, S.; Greenwood, R.; Sikaroodi, M.; Lam, V.; Crotty, P.; et al. Fecal Microbiome and Volatile Organic Compound Metabolome in Obese Humans with Nonalcoholic Fatty Liver Disease. Clin. Gastroenterol. Hepatol. Off. Clin. Pract. J. Am. Gastroenterol. Assoc. 2013, 11, 868–875.e3. [Google Scholar] [CrossRef] [PubMed]
- Tims, S.; Derom, C.; Jonkers, D.M.; Vlietinck, R.; Saris, W.H.; Kleerebezem, M.; de Vos, W.M.; Zoetendal, E.G. Microbiota Conservation and BMI Signatures in Adult Monozygotic Twins. ISME J. 2013, 7, 707–717. [Google Scholar] [CrossRef] [PubMed] [Green Version]
- Walker, A.W.; Ince, J.; Duncan, S.H.; Webster, L.M.; Holtrop, G.; Ze, X.; Brown, D.; Stares, M.D.; Scott, P.; Bergerat, A.; et al. Dominant and Diet-Responsive Groups of Bacteria within the Human Colonic Microbiota. ISME J. 2011, 5, 220–230. [Google Scholar] [CrossRef] [PubMed]
- Ryan, K.K.; Tremaroli, V.; Clemmensen, C.; Kovatcheva-Datchary, P.; Myronovych, A.; Karns, R.; Wilson-Pérez, H.E.; Sandoval, D.A.; Kohli, R.; Bäckhed, F.; et al. FXR Is a Molecular Target for the Effects of Vertical Sleeve Gastrectomy. Nature 2014, 509, 183–188. [Google Scholar] [CrossRef] [Green Version]
- Qin, J.; Li, Y.; Cai, Z.; Li, S.; Zhu, J.; Zhang, F.; Liang, S.; Zhang, W.; Guan, Y.; Shen, D.; et al. A Metagenome-Wide Association Study of Gut Microbiota in Type 2 Diabetes. Nature 2012, 490, 55–60. [Google Scholar] [CrossRef] [PubMed]
- Karlsson, F.H.; Tremaroli, V.; Nookaew, I.; Bergström, G.; Behre, C.J.; Fagerberg, B.; Nielsen, J.; Bäckhed, F. Gut Metagenome in European Women with Normal, Impaired and Diabetic Glucose Control. Nature 2013, 498, 99–103. [Google Scholar] [CrossRef]
- Iatcu, C.O.; Steen, A.; Covasa, M. Gut Microbiota and Complications of Type-2 Diabetes. Nutrients 2021, 14, 166. [Google Scholar] [CrossRef]
- Neyrinck, A.M.; Rodriguez, J.; Zhang, Z.; Seethaler, B.; Mailleux, F.; Vercammen, J.; Bindels, L.B.; Cani, P.D.; Nazare, J.-A.; Maquet, V.; et al. Noninvasive Monitoring of Fibre Fermentation in Healthy Volunteers by Analyzing Breath Volatile Metabolites: Lessons from the FiberTAG Intervention Study. Gut Microbes 2021, 13, 1–16. [Google Scholar] [CrossRef] [PubMed]
- De Paepe, K.; Verspreet, J.; Courtin, C.M.; Van de Wiele, T. Microbial Succession during Wheat Bran Fermentation and Colonisation by Human Faecal Microbiota as a Result of Niche Diversification. ISME J. 2020, 14, 584–596. [Google Scholar] [CrossRef] [PubMed]
- Kieler, I.N.; Shamzir Kamal, S.; Vitger, A.D.; Nielsen, D.S.; Lauridsen, C.; Bjornvad, C.R. Gut Microbiota Composition May Relate to Weight Loss Rate in Obese Pet Dogs. Vet. Med. Sci. 2017, 3, 252–262. [Google Scholar] [CrossRef] [PubMed]


| Parameter | Hypothesis-Generating Cohort |
|---|---|
| n | 15 |
| Weight loss success (n) | 8 |
| Age | 40 ± 6 |
| Blood pressure systolic (mmHg) | 126 ± 15 |
| Blood pressure diastolic (mmHg) | 86 ± 11 |
| Fasting blood glucose (mg/dL) | 105 ± 619 |
| Cholesterol (mg/dL) | 203 ± 641 |
| HDL cholesterol (mg/dL) | 47 ± 610 |
| LDL cholesterol (mg/dL) | 130 ± 27 |
| Triglycerides (mg/dL) | 181 ± 154 |
| WC (cm) | 123 ± 15 |
| Weight (kg) | 128 ± 20 |
| BMI (kg/m2) | 42.4 ± 6 |
| Predictor Variable | Occurrence (Delta BMI) | Occurrence (RWL) | |
|---|---|---|---|
| Genera | Akkermansia | 10.40% | 46.10% |
| Symbiobacterium | 3.40% | 51.80% | |
| Alistipes | 10.40% | 26.40% | |
| Pseudoflavonifractor | 6.90% | 15.90% | |
| Species | Alistipes finegoldii | 100.00% | 22.00% |
| Akkermansia muciniphila | 10.10% | 19.10% | |
| Ethanoligenens harbinense | 0.30% | 17.10% | |
| Bacteroides ovatus | 0.20% | 1.30% | |
| Bacteroides eggerthii | 0.00% | 1.00% | |
| Genera (Weight 1) | Full List | Reduced List | Reduced List | Reduced List | Reduced List |
|---|---|---|---|---|---|
| (A 60%, B 20%, C 20%) | (102 Terms) | (44 Terms) | (23 Terms) | (15 Terms) | (7 Terms) |
| Megasphaera | 0.9957 | 0.9570 | 0.9515 | 0.9397 | 0.9551 |
| Symbiobacterium | 0.8742 | 0.7755 | 0.6916 | 0.6964 | 1.0000 |
| Marvinbryantia | 0.7179 | 0.7126 | 0.7805 | 0.8054 | 0.7513 |
| Blautia | 0.5285 | 0.5802 | 0.5475 | 0.5781 | 0.6515 |
| Dysgonomonas | 0.3212 | 0.6202 | 0.7111 | 0.7311 | 0.3895 |
| Oscillibacter * | 0.3818 | 0.5506 | 0.5359 | 0.5225 | 0.5057 |
| Pseudoflavonifractor | 0.4032 | 0.4131 | 0.4091 | 0.4474 | |
| Burkholderia | 0.3751 | 0.5381 | 0.5932 | 0.6016 | |
| Treponema | 0.3780 | 0.5865 | 0.6172 | 0.6445 | |
| Aeromonas | 0.3029 | 0.4871 | 0.5573 | 0.5955 | |
| Gordonibacter | 0.3518 | 0.3991 | |||
| Streptococcus | 0.3041 | 0.4350 | 0.4969 | 0.5200 | |
| Alistipes | 0.5047 | 0.4468 | 0.4249 | ||
| Haemophilus | 0.3812 | 0.4531 | 0.4335 | ||
| Bordetella | 0.3540 | 0.4177 | 0.4631 | 0.4894 | |
| Genera (weight 2) | Full List | Reduced List | Reduced List | Reduced List | Reduced List |
| (A 45%, B 10%, C 45%) | (102 Terms) | (52 Terms) | (25 Terms) | (15 Terms) | (7 Terms) |
| Megasphaera | 0.9973 | 0.9981 | 0.9686 | 0.9936 | 0.9609 |
| Symbiobacterium | 0.9162 | 0.8792 | 0.8201 | 0.8379 | 1.0000 |
| Marvinbryantia | 0.6671 | 0.6583 | 0.7758 | 0.7302 | 0.7180 |
| Blautia | 0.6315 | 0.6632 | 0.6414 | 0.6044 | 0.6844 |
| Dysgonomonas | 0.3434 | 0.5460 | 0.7008 | 0.7817 | 0.4112 |
| Oscillibacter * | 0.4706 | 0.5025 | 0.5379 | 0.5652 | 0.5645 |
| Pseudoflavonifractor | 0.4946 | 0.4854 | 0.4529 | 0.5026 | |
| Burkholderia | 0.4192 | 0.5271 | 0.6486 | 0.6774 | |
| Treponema | 0.4055 | 0.4918 | 0.5667 | 0.5731 | |
| Aeromonas | 0.3337 | 0.4694 | 0.5539 | 0.6356 | |
| Gordonibacter | 0.4607 | 0.4597 | |||
| Streptococcus | 0.3485 | 0.5570 | 0.5711 | 0.6459 | |
| Alistipes | 0.6135 | 0.5296 | 0.4784 | ||
| Haemophilus | 0.5137 | 0.5667 | 0.5167 | 0.5037 | |
| Bordetella | 0.3599 | 0.4661 | 0.5346 | 0.6305 |
| Species (Weight 1) | Full List | Reduced List | Reduced List | Reduced List | |
|---|---|---|---|---|---|
| (A: 60%, B: 20%, C: 20%) | (106 Terms) | (28 Terms) | (16 Terms) | (8 Terms) | |
| Alistipes finegoldii | 0.9043 | 0.6981 | 0.7663 | 0.9521 | |
| Roseburia intestinalis | 0.6873 | 0.9467 | 0.9814 | 0.8594 | |
| Alistipes spHGB5 | 0.6824 | 0.8763 | 0.9004 | 0.6096 | |
| Bacteroides caccae | 0.6871 | 0.6270 | 0.6522 | 0.8361 | |
| Megamonas hypermegale | 0.5777 | 0.7872 | 0.8143 | 0.6423 | |
| Bacteroides stercoris | 0.4309 | 0.7694 | 0.8154 | 0.6728 | |
| Ethanoligenens harbinense | 0.3782 | 0.4657 | 0.4623 | 0.4312 | |
| Akkermansia muciniphila | 0.4986 | 0.4376 | 0.4079 | 0.4461 | |
| Prevotella dentalis | 0.3424 | 0.5949 | 0.6055 | ||
| Bifidobacterium bifidum | 0.4589 | 0.5286 | 0.5876 | ||
| Pseudoflavonifractor capillosus | 0.3900 | 0.5629 | 0.5214 | ||
| Bacteroides ovatus | 0.3736 | 0.5577 | 0.5795 | ||
| Clostridium hathewayi | 0.3342 | ||||
| Species (Weight 2) | Full List | Reduced List | Reduced List | Reduced List | Reduced List |
| (A: 45%, B: 10%, C: 45%) | (106 Terms) | (32 Terms) | (21 Terms) | (15 Terms) | (8 Terms) |
| Alistipes finegoldii | 0.9522 | 0.8361 | 0.8729 | 0.8527 | 0.9760 |
| Roseburia intestinalis | 0.6167 | 0.8676 | 0.9245 | 0.9609 | 0.8501 |
| Alistipes spHGB5 | 0.6871 | 0.8249 | 0.8489 | 0.8990 | 0.6666 |
| Bacteroides caccae | 0.7308 | 0.7343 | 0.7362 | 0.7914 | 0.8713 |
| Megamonas hypermegale | 0.5581 | 0.7228 | 0.7384 | 0.7799 | 0.7011 |
| Bacteroides stercoris | 0.4554 | 0.6997 | 0.7370 | 0.7894 | 0.6564 |
| Ethanoligenens harbinense | 0.5017 | 0.5354 | 0.5162 | 0.5548 | 0.4834 |
| Akkermansia muciniphila | 0.6040 | 0.5443 | 0.5195 | 0.4576 | 0.5029 |
| Prevotella dentalis | 0.3577 | 0.6112 | 0.6224 | 0.6351 | |
| Bifidobacterium bifidum | 0.4012 | 0.5426 | 0.5808 | 0.6033 | |
| Pseudoflavonifractor capillosus | 0.5032 | 0.6374 | 0.5877 | 0.5341 | |
| Bacteroides ovatus | 0.3828 | 0.5227 | 0.5328 | 0.5515 | |
| Clostridium hathewayi | 0.2808 |
| Weight (Importance) | |||||
|---|---|---|---|---|---|
| 1 | 1 | 3 | 1 | ||
| Selected genera | Full MC list (102 terms) Average rank | Final MC list (7 terms) Average rank | Elastic net selected | Strong Correlation (+ or −) | Final score |
| Symbiobacterium | 2 | 1 | 1 | 1.5 | 15.5 |
| Megasphaera | 1 | 2 | - | –0.5 | 11.5 |
| Marvinbryantia | 3 | 3 | - | - | 8 |
| Alistipes | 5 | - | 1 | 1.5 | 6.5 |
| Blautia | 4 | 4 | - | - | 6 |
| Akkermansia | - | - | 1 | 1.5 | 4.5 |
| Pseudoflavonifractor | - | - | 1 | 0.5 | 3.5 |
| Selected species | Full MC list (106 terms) Average rank | Final MC list (8 terms) Average rank | Elastic net selected | Strong Correlation (+ or −) | Final score |
| Alistipes finegoldii | 1 | 1 | 1 | 2 | 17 |
| Bacteroides caccae | 3 | 2.5 | - | −0.5 | 9 |
| Roseburia intestinalis | 3 | 2.5 | - | - | 8.5 |
| Akkermansia muciniphila | 5 | - | 1 | 1.5 | 6.5 |
| Alistipes spHGB5 | 3 | 5.5 | - | - | 5.5 |
| Megamonas hypermegale | 5 | 4.5 | - | - | 4.5 |
| Ethanoligenens harbinense | - | - | 1 | 1 | 4 |
| Bacteroides stercoris | - | 5 | - | - | 2 |
| Classification | Classification | Classification | Classification | Classification | |
|---|---|---|---|---|---|
| RWL | RWL | RWL | RWL | RWL | |
| DS | 1 Term Model | 2 Terms Model | 3 Terms Model | 4 Terms Model | 5 Terms Model |
| 1 | correct(−) | correct(−) | correct(−) | correct(−) | correct(−) |
| 2 | correct(−) | correct(−) | correct(−) | correct(−) | correct(−) |
| 3 | underpredicted | underpredicted | correct(+) | correct(+) | correct(+) |
| 4 | correct(−) | correct(−) | correct(−) | correct(−) | correct(−) |
| 5 | correct(−) | correct(−) | correct(−) | correct(−) | correct(−) |
| 6 | correct(+) | correct(+) | correct(+) | correct(+) | correct(+) |
| 7 | correct(−) | correct(−) | correct(−) | overpredicted | correct(−) |
| 8 | correct(+) | correct(+) | correct(+) | correct(+) | correct(+) |
| 9 | correct(+) | correct(+) | correct(+) | correct(+) | correct(+) |
| 10 | underpredicted | correct(+) | correct(+) | correct(+) | correct(+) |
| 11 | overpredicted | correct(−) | correct(−) | correct(−) | correct(−) |
| 12 | underpredicted | correct(+) | correct(+) | underpredicted | underpredicted |
| 13 | correct(−) | correct(−) | correct(−) | correct(−) | correct(−) |
| 14 | underpredicted | underpredicted | underpredicted | correct(+) | correct(+) |
| 15 | correct(+) | correct(+) | correct(+) | correct(+) | correct(+) |
| correct(+) | 4 | 6 | 7 | 7 | 7 |
| correct(−) | 6 | 7 | 7 | 6 | 7 |
| underpredicted | 4 | 2 | 1 | 1 | 1 |
| overpredicted | 1 | 0 | 0 | 1 | 0 |
| sum correct | 10 | 13 | 14 | 13 | 14 |
| sum incorrect | 5 | 2 | 1 | 2 | 1 |
Publisher’s Note: MDPI stays neutral with regard to jurisdictional claims in published maps and institutional affiliations. |
© 2022 by the authors. Licensee MDPI, Basel, Switzerland. This article is an open access article distributed under the terms and conditions of the Creative Commons Attribution (CC BY) license (https://creativecommons.org/licenses/by/4.0/).
Share and Cite
Bischoff, S.C.; Nguyen, N.K.; Seethaler, B.; Beisner, J.; Kügler, P.; Stefan, T. Gut Microbiota Patterns Predicting Long-Term Weight Loss Success in Individuals with Obesity Undergoing Nonsurgical Therapy. Nutrients 2022, 14, 3182. https://doi.org/10.3390/nu14153182
Bischoff SC, Nguyen NK, Seethaler B, Beisner J, Kügler P, Stefan T. Gut Microbiota Patterns Predicting Long-Term Weight Loss Success in Individuals with Obesity Undergoing Nonsurgical Therapy. Nutrients. 2022; 14(15):3182. https://doi.org/10.3390/nu14153182
Chicago/Turabian StyleBischoff, Stephan C., Nguyen K. Nguyen, Benjamin Seethaler, Julia Beisner, Philipp Kügler, and Thorsten Stefan. 2022. "Gut Microbiota Patterns Predicting Long-Term Weight Loss Success in Individuals with Obesity Undergoing Nonsurgical Therapy" Nutrients 14, no. 15: 3182. https://doi.org/10.3390/nu14153182
APA StyleBischoff, S. C., Nguyen, N. K., Seethaler, B., Beisner, J., Kügler, P., & Stefan, T. (2022). Gut Microbiota Patterns Predicting Long-Term Weight Loss Success in Individuals with Obesity Undergoing Nonsurgical Therapy. Nutrients, 14(15), 3182. https://doi.org/10.3390/nu14153182