
The Effect of a Peanut-Enriched Weight Loss Diet Compared to a Low-Fat Weight Loss Diet on Body Weight, Blood Pressure, and Glycemic Control: A Randomized Controlled Trial

 , and
, and 
Abstract
:1. Introduction
2. Materials and Methods
2.1. Study Design
2.2. Participants
2.3. Dietary Intervention
2.4. Outcomes
2.5. Statistical Analyses
3. Results
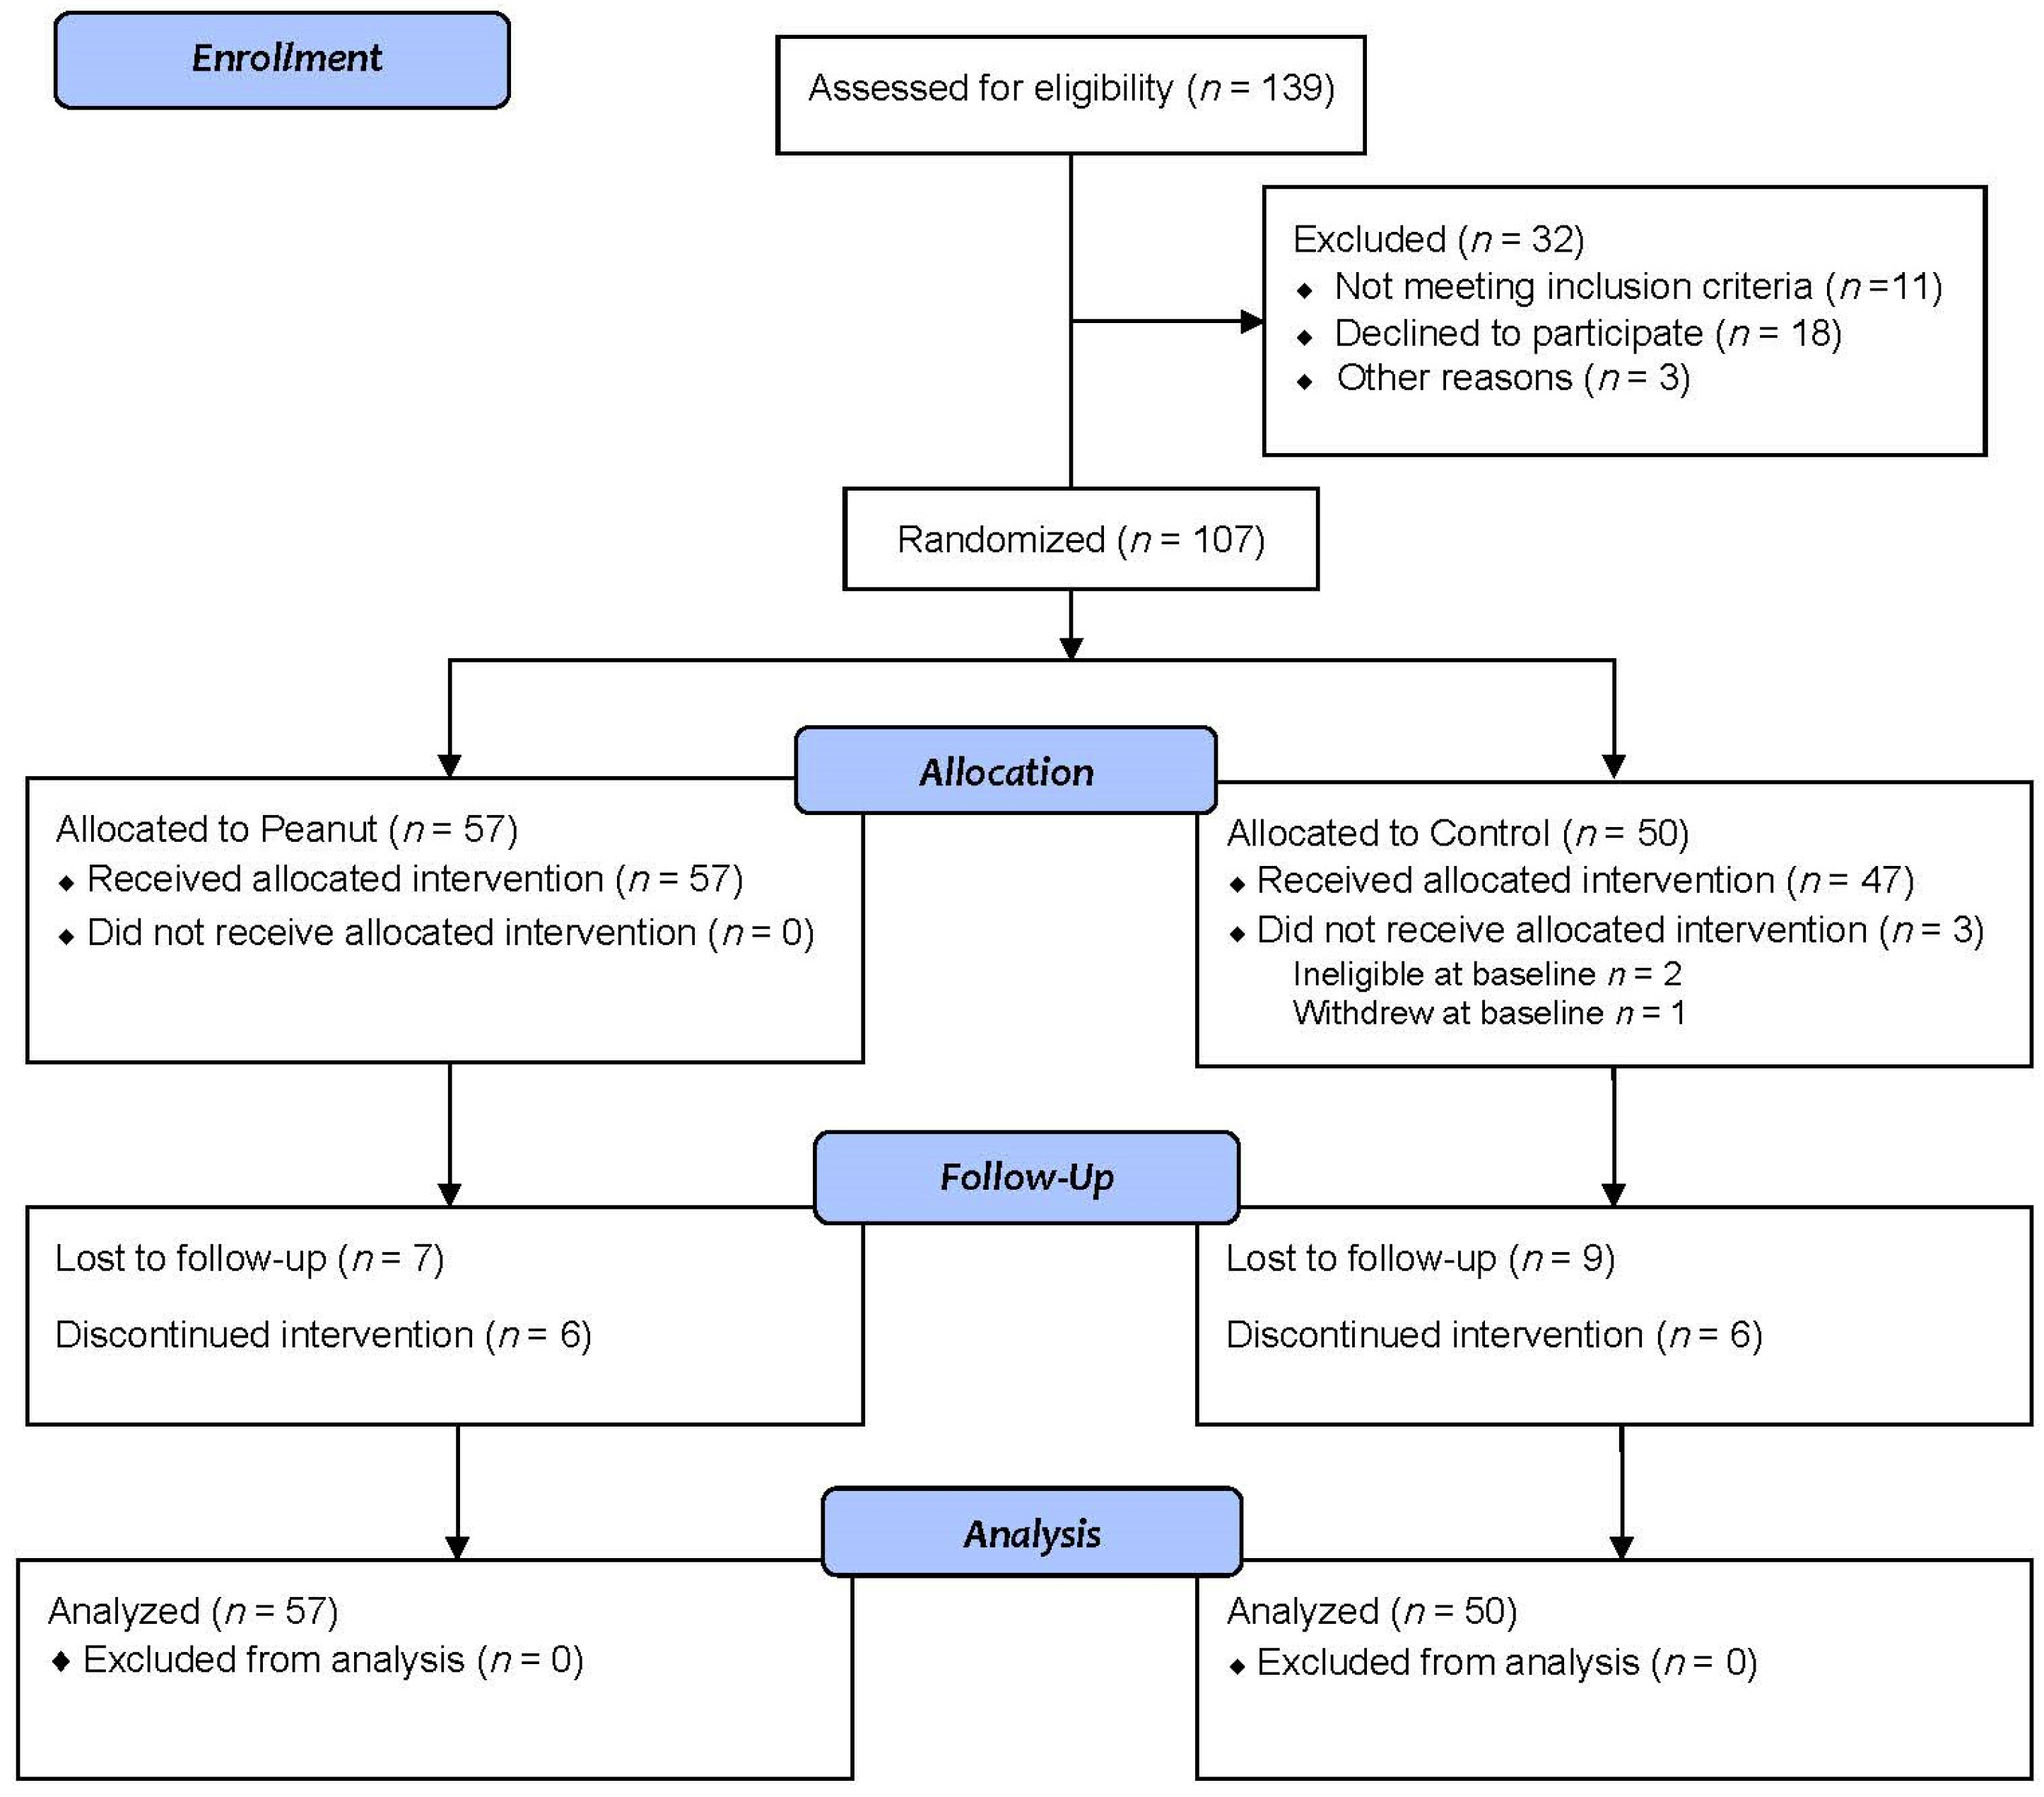
3.1. Participants
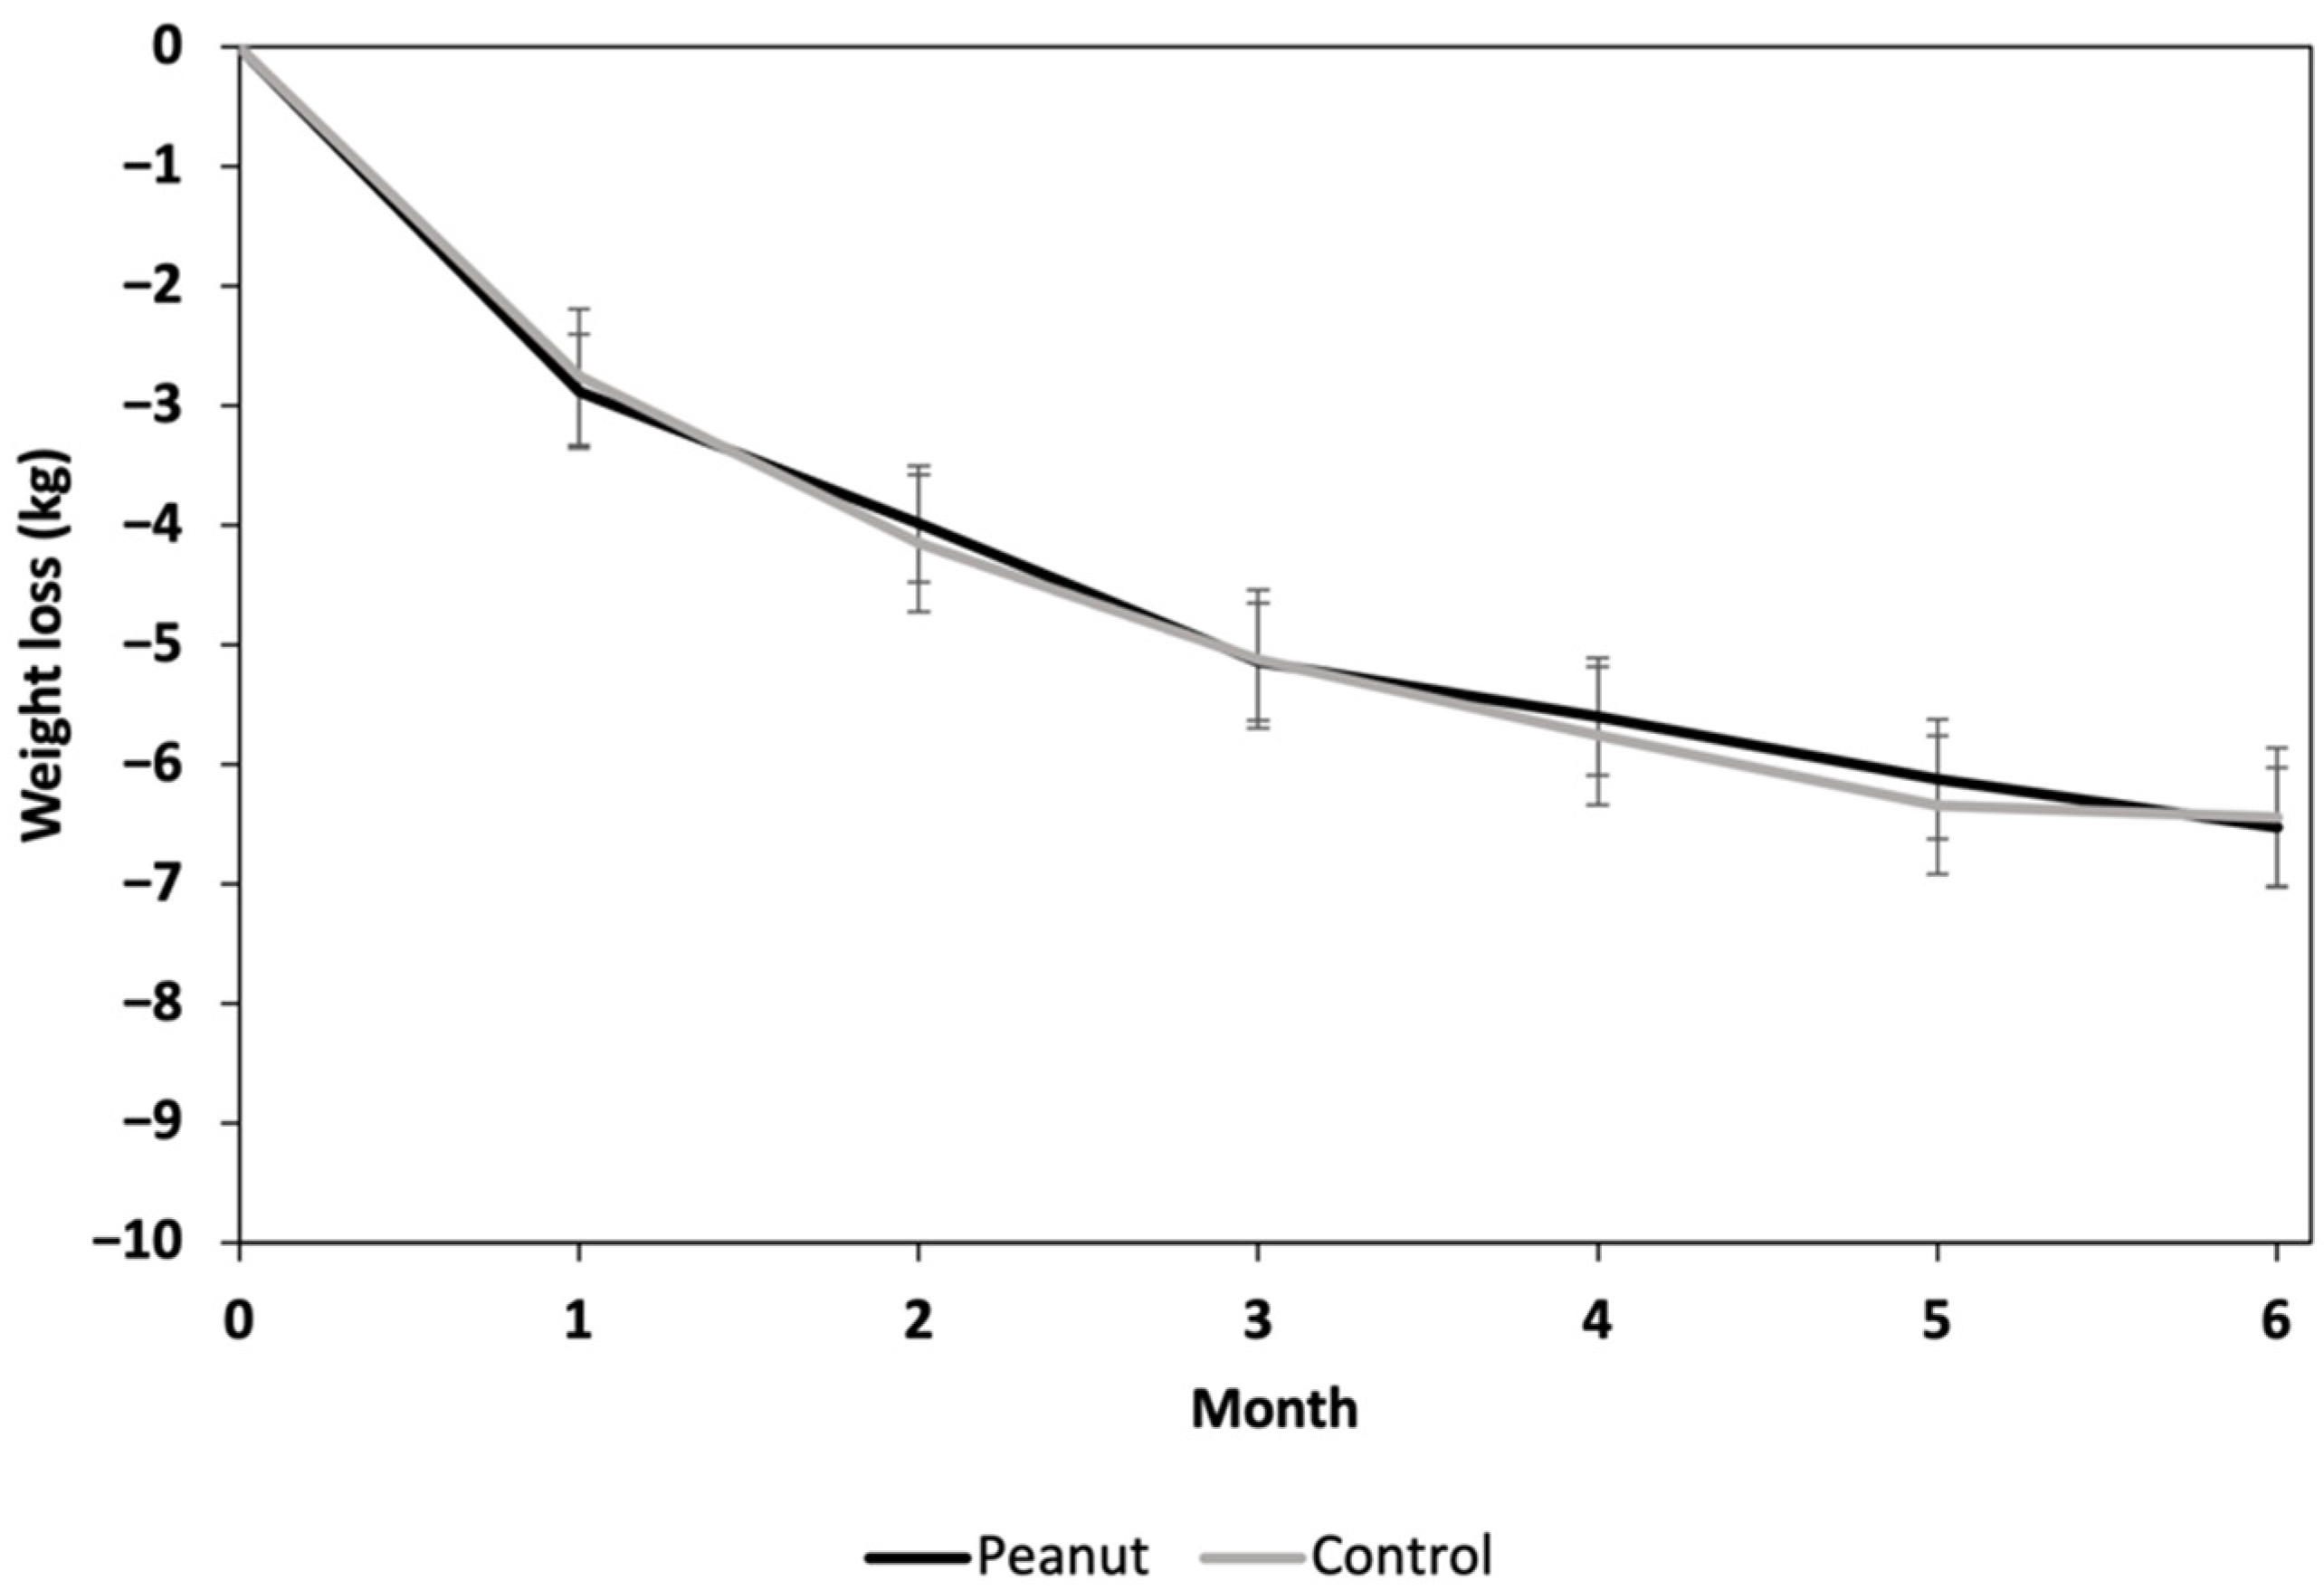
3.2. Weight
3.3. Blood Pressure
3.4. Glycemic Outcomes
3.5. Dietary Intake
4. Discussion
5. Conclusions
Author Contributions
Funding
Institutional Review Board Statement
Informed Consent Statement
Data Availability Statement
Acknowledgments
Conflicts of Interest
References
- Centers for Disease Control and Prevention. Obesity and Overweight. Available online: https://www.cdc.gov/nchs/fastats/obesity-overweight.htm (accessed on 26 February 2022).
- Australian Bureau of Statistics. Overweight and Obesity. Available online: https://www.abs.gov.au/statistics/health/health-conditions-and-risks/overweight-and-obesity/latest-release (accessed on 26 February 2022).
- Khan, S.S.; Ning, H.; Wilkins, J.T.; Allen, N.; Carnethon, M.; Berry, J.D.; Sweis, R.N.; Lloyd-Jones, D.M. Association of Body Mass Index with Lifetime Risk of Cardiovascular Disease and Compression of Morbidity. JAMA Cardiol. 2018, 3, 280–287. [Google Scholar] [CrossRef] [PubMed]
- Ligthart, S.; van Herpt, T.T.W.; Leening, M.J.G.; Kavousi, M.; Hofman, A.; Stricker, B.H.C.; van Hoek, M.; Sijbrands, E.J.G.; Franco, O.H.; Dehghan, A. Lifetime Risk of Developing Impaired Glucose Metabolism and Eventual Progression from Prediabetes to Type 2 Diabetes: A Prospective Cohort Study. Lancet Diabetes Endocrinol. 2016, 4, 44–51. [Google Scholar] [CrossRef]
- Jensen, M.D.; Ryan, D.H.; Apovian, C.M.; Ard, J.D.; Comuzzie, A.G.; Donato, K.A.; Hu, F.B.; Hubbard, V.S.; Jakicic, J.M.; Kushner, R.F.; et al. 2013 AHA/ACC/TOS Guideline for the Management of Overweight and Obesity in Adults: A Report of the American College of Cardiology/American Heart Association Task Force on Practice Guidelines and The Obesity Society. Circulation 2014, 129 (Suppl. S2), S102–S138. [Google Scholar] [CrossRef] [PubMed] [Green Version]
- Glynn, E.L.; Fleming, S.A.; Edwards, C.G.; Wilson, M.J.; Evans, M.; Leidy, H.J. Consuming a Protein and Fiber-Based Supplement Preload Promotes Weight Loss and Alters Metabolic Markers in Overweight Adults in a 12-Week, Randomized, Double-Blind, Placebo-Controlled Trial. J. Nutr. 2022, 152, 1415–1425. [Google Scholar] [CrossRef] [PubMed]
- Watson, L.E.; Phillips, L.K.; Wu, T.; Bound, M.J.; Checklin, H.; Grivell, J.; Jones, K.L.; Horowitz, M.; Rayner, C.K. Differentiating the Effects of Whey Protein and Guar Gum Preloads on Postprandial Glycemia in Type 2 Diabetes. Clin. Nutr. 2019, 38, 2827–2832. [Google Scholar] [CrossRef]
- Watson, L.E.; Phillips, L.K.; Wu, T.; Bound, M.J.; Checklin, H.L.; Grivell, J.; Jones, K.L.; Clifton, P.M.; Horowitz, M.; Rayner, C.K. A Whey/Guar “Preload” Improves Postprandial Glycaemia and Glycated Haemoglobin Levels in Type 2 Diabetes: A 12-week, Single-blind, Randomized, Placebo-controlled Trial. Diabetes Obes. Metab. 2019, 21, 930–938. [Google Scholar] [CrossRef]
- Ma, J.; Stevens, J.E.; Cukier, K.; Maddox, A.F.; Wishart, J.M.; Jones, K.L.; Clifton, P.M.; Horowitz, M.; Rayner, C.K. Effects of a Protein Preload on Gastric Emptying, Glycemia, and Gut Hormones after a Carbohydrate Meal in Diet-Controlled Type 2 Diabetes. Diabetes Care 2009, 32, 1600–1602. [Google Scholar] [CrossRef] [Green Version]
- Gentilcore, D.; Chaikomin, R.; Jones, K.L.; Russo, A.; Feinle-Bisset, C.; Wishart, J.M.; Rayner, C.K.; Horowitz, M. Effects of Fat on Gastric Emptying of and the Glycemic, Insulin, and Incretin Responses to a Carbohydrate Meal in Type 2 Diabetes. J. Clin. Endocrinol. Metab. 2006, 91, 2062–2067. [Google Scholar] [CrossRef]
- Fysekidis, M.; Cosson, E.; Banu, I.; Duteil, R.; Cyrille, C.; Valensi, P. Increased Glycemic Variability and Decrease of the Postprandial Glucose Contribution to HbA1c in Obese Subjects across the Glycemic Continuum from Normal Glycemia to First Time Diagnosed Diabetes. Metabolism 2014, 63, 1553–1561. [Google Scholar] [CrossRef]
- Afshin, A.; Micha, R.; Khatibzadeh, S.; Mozaffarian, D. Consumption of Nuts and Legumes and Risk of Incident Ischemic Heart Disease, Stroke, and Diabetes: A Systematic Review and Meta-Analysis. Am. J. Clin. Nutr. 2014, 100, 278–288. [Google Scholar] [CrossRef]
- Guasch-Ferré, M.; Li, J.; Hu, F.B.; Salas-Salvadó, J.; Tobias, D.K. Effects of Walnut Consumption on Blood Lipids and Other Cardiovascular Risk Factors: An Updated Meta-Analysis and Systematic Review of Controlled Trials. Am. J. Clin. Nutr. 2018, 108, 174–187. [Google Scholar] [CrossRef] [PubMed] [Green Version]
- Liu, K.; Hui, S.; Wang, B.; Kaliannan, K.; Guo, X.; Liang, L. Comparative Effects of Different Types of Tree Nut Consumption on Blood Lipids: A Network Meta-Analysis of Clinical Trials. Am. J. Clin. Nutr. 2020, 111, 219–227. [Google Scholar] [CrossRef] [PubMed]
- Del Gobbo, L.C.; Falk, M.C.; Feldman, R.; Lewis, K.; Mozaffarian, D. Effects of Tree Nuts on Blood Lipids, Apolipoproteins, and Blood Pressure: Systematic Review, Meta-Analysis, and Dose-Response of 61 Controlled Intervention Trials. Am. J. Clin. Nutr. 2015, 102, 1347–1356. [Google Scholar] [CrossRef] [PubMed] [Green Version]
- Viguiliouk, E.; Kendall, C.W.C.; Mejia, S.B.; Cozma, A.I.; Ha, V.; Mirrahimi, A.; Jayalath, V.H.; Augustin, L.S.A.; Chiavaroli, L.; Leiter, L.A.; et al. Effect of Tree Nuts on Glycemic Control in Diabetes: A Systematic Review and Meta-Analysis of Randomized Controlled Dietary Trials. PLoS ONE 2014, 9, e103376. [Google Scholar] [CrossRef] [PubMed]
- Tindall, A.M.; Johnston, E.A.; Kris-Etherton, P.M.; Petersen, K.S. The Effect of Nuts on Markers of Glycemic Control: A Systematic Review and Meta-Analysis of Randomized Controlled Trials. Am. J. Clin. Nutr. 2019, 109, 297–314. [Google Scholar] [CrossRef] [PubMed]
- Tan, S.Y.; Dhillon, J.; Mattes, R.D. A Review of the Effects of Nuts on Appetite, Food Intake, Metabolism, and Body Weight. Am. J. Clin. Nutr. 2014, 100 (Suppl. S1), 412S–422S. [Google Scholar] [CrossRef] [Green Version]
- Guarneiri, L.L.; Cooper, J.A. Intake of Nuts or Nut Products Does Not Lead to Weight Gain, Independent of Dietary Substitution Instructions: A Systematic Review and Meta-Analysis of Randomized Trials. Adv. Nutr. 2021, 12, 384–401. [Google Scholar] [CrossRef]
- Australian Government Department of Health. The Australian Type 2 Diabetes Risk Assessment Tool (AUSDRISK). Available online: https://www.health.gov.au/resources/apps-and-tools/the-australian-type-2-diabetes-risk-assessment-tool-ausdrisk (accessed on 26 February 2022).
- Noakes, M.; Keogh, J.B.; Foster, P.R.; Clifton, P.M. Effect of an Energy-Restricted, High-Protein, Low-Fat Diet Relative to a Conventional High-Carbohydrate, Low-Fat Diet on Weight Loss, Body Composition, Nutritional Status, and Markers of Cardiovascular Health in Obese Women. Am. J. Clin. Nutr. 2005, 81, 1298–1306. [Google Scholar] [CrossRef] [Green Version]
- Wycherley, T.P.; Moran, L.J.; Clifton, P.M.; Noakes, M.; Brinkworth, G.D. Effects of Energy-Restricted High-Protein, Low-Fat Compared with Standard-Protein, Low-Fat Diets: A Meta-Analysis of Randomized Controlled Trials. Am. J. Clin. Nutr. 2012, 96, 1281–1298. [Google Scholar] [CrossRef] [Green Version]
- Raynor, H.A.; Champagne, C.M. Position of the Academy of Nutrition and Dietetics: Interventions for the Treatment of Overweight and Obesity in Adults. J. Acad. Nutr. Diet. 2016, 116, 129–147. [Google Scholar] [CrossRef]
- Matthews, D.R.; Hosker, J.P.; Rudenski, A.S.; Naylor, B.A.; Treacher, D.F.; Turner, R.C. Homeostasis Model Assessment: Insulin Resistance and β-Cell Function from Fasting Plasma Glucose and Insulin Concentrations in Man. Diabetologia 1985, 28, 412–419. [Google Scholar] [CrossRef] [PubMed] [Green Version]
- The National Cancer Institute. National Cancer Institute Diet Assessment Primer. Available online: https://dietassessmentprimer.cancer.gov/approach/table.html (accessed on 13 June 2022).
- National Cancer Institute Division of Cancer Control and Population Sciences. Reviewing & Cleaning ASA24® Data. Available online: https://epi.grants.cancer.gov/asa24/resources/cleaning.html (accessed on 26 February 2022).
- Freeman, A.M.; Morris, P.B.; Barnard, N.; Esselstyn, C.B.; Ros, E.; Agatston, A.; Devries, S.; O’Keefe, J.; Miller, M.; Ornish, D. Trending Cardiovascular Nutrition Controversies. J. Am. Coll. Cardiol. 2017, 69, 1172–1187. [Google Scholar] [CrossRef] [PubMed]
- Rahimi, K.; Bidel, Z.; Nazarzadeh, M.; Copland, E.; Canoy, D.; Ramakrishnan, R.; Pinho-Gomes, A.-C.; Woodward, M.; Adler, A.; Agodoa, L. Pharmacological Blood Pressure Lowering for Primary and Secondary Prevention of Cardiovascular Disease across Different Levels of Blood Pressure: An Individual Participant-Level Data Meta-Analysis. Lancet 2021, 397, 1625–1636. [Google Scholar] [CrossRef]
- Whelton, P.K.; Carey, R.M.; Aronow, W.S.; Casey, D.E.; Collins, K.J.; Himmelfarb, C.D.; DePalma, S.M.; Gidding, S.; Jamerson, K.A.; Jones, D.W. 2017 ACC/AHA/AAPA/ABC/ACPM/AGS/APhA/ASH/ASPC/NMA/PCNA Guideline for the Prevention, Detection, Evaluation, and Management of High Blood Pressure in Adults: A Report of the American College of Cardiology/American Heart Association Task Force on Clinical Pr. J. Am. Coll. Cardiol. 2018, 71, e127–e248. [Google Scholar] [CrossRef]
- Gay, H.C.; Rao, S.G.; Vaccarino, V.; Ali, M.K. Effects of Different Dietary Interventions on Blood Pressure: Systematic Review and Meta-Analysis of Randomized Controlled Trials. Hypertension 2016, 67, 733–739. [Google Scholar] [CrossRef]
- Neter, J.E.; Stam, B.E.; Kok, F.J.; Grobbee, D.E.; Geleijnse, J.M. Influence of Weight Reduction on Blood Pressure: A Meta-Analysis of Randomized Controlled Trials. Hypertension 2003, 42, 878–884. [Google Scholar] [CrossRef]
- Mohammadifard, N.; Salehi-Abargouei, A.; Salas-Salvadó, J.; Guasch-Ferré, M.; Humphries, K.; Sarrafzadegan, N. The Effect of Tree Nut, Peanut, and Soy Nut Consumption on Blood Pressure: A Systematic Review and Meta-Analysis of Randomized Controlled Clinical Trials. Am. J. Clin. Nutr. 2015, 101, 966–982. [Google Scholar] [CrossRef] [Green Version]
- Jafari Azad, B.; Daneshzad, E.; Azadbakht, L. Peanut and Cardiovascular Disease Risk Factors: A Systematic Review and Meta-Analysis. Crit. Rev. Food Sci. Nutr. 2020, 60, 1123–1140. [Google Scholar] [CrossRef]
- Qian, F.; Korat, A.A.; Malik, V.; Hu, F.B. Metabolic Effects of Monounsaturated Fatty Acid–Enriched Diets Compared with Carbohydrate or Polyunsaturated Fatty Acid–Enriched Diets in Patients with Type 2 Diabetes: A Systematic Review and Meta-Analysis of Randomized Controlled Trials. Diabetes Care 2016, 39, 1448–1457. [Google Scholar] [CrossRef] [Green Version]
- Jovanovski, E.; de Castro Ruiz Marques, A.; Li, D.; Ho, H.V.T.; Blanco Mejia, S.; Sievenpiper, J.L.; Zurbau, A.; Komishon, A.; Duvnjak, L.; Bazotte, R.B. Effect of High-Carbohydrate or High-monounsaturated Fatty Acid Diets on Blood Pressure: A Systematic Review and Meta-Analysis of Randomized Controlled Trials. Nutr. Rev. 2019, 77, 19–31. [Google Scholar] [CrossRef]
- National Academies of Sciences and Medicine Engineering. Dietary Reference Intakes for Sodium and Potassium; National Academies Press: Washington, DC, USA, 2019. [Google Scholar]
- Imamura, F.; Micha, R.; Wu, J.H.Y.; de Oliveira Otto, M.C.; Otite, F.O.; Abioye, A.I.; Mozaffarian, D. Effects of Saturated Fat, Polyunsaturated Fat, Monounsaturated Fat, and Carbohydrate on Glucose-Insulin Homeostasis: A Systematic Review and Meta-Analysis of Randomised Controlled Feeding Trials. PLoS Med. 2016, 13, e1002087. [Google Scholar] [CrossRef] [PubMed] [Green Version]
- Muniyappa, R.; Madan, R.; Varghese, R.T. Assessing Insulin Sensitivity and Resistance in Humans; Feingold, K., Anawalt, B., Boyce, A., Eds.; MDText. com, Inc.: South Dartmouth, MA, USA, 2021. [Google Scholar]
- Reis, C.E.G.; Ribeiro, D.N.; Costa, N.M.B.; Bressan, J.; Alfenas, R.C.G.; Mattes, R.D. Acute and Second-Meal Effects of Peanuts on Glycaemic Response and Appetite in Obese Women with High Type 2 Diabetes Risk: A Randomised Cross-over Clinical Trial. Br. J. Nutr. 2013, 109, 2015–2023. [Google Scholar] [CrossRef] [PubMed] [Green Version]


| Outcome Assessment | Time (Months) | ||||||
|---|---|---|---|---|---|---|---|
| 0 | 1 | 2 | 3 | 4 | 5 | 6 | |
| Weight | X | X | X | X | X | X | X |
| Height | X | ||||||
| Blood pressure | X | X | X | ||||
| 24 h dietary recall | X | X | X | ||||
| Study food checklist | X | X | X | X | X | X | X |
| HbA1c | X | X | X | ||||
| Fasting blood glucose and insulin | X | X | X | ||||
| 2-h glucose tolerance test | X | X | X | ||||
| Total (n = 107) | Peanut (n = 57) | Control (n = 50) | |
|---|---|---|---|
| Age, years | 58 ± 14 | 59 ± 14 | 58 ± 15 |
| Female, n (%) | 70 (65) | 41 (72) | 29 (58) |
| Weight, kg | 92.2 ± 17.2 | 91.6 ± 17.6 | 92.9 ± 16.9 |
| BMI, kg/m2 | 33.1 ± 5.4 | 33.1 ± 4.9 | 33.0 ± 6.0 |
| Waist circumference, cm | 109 ± 12.9 | 108 ± 13.4 | 109 ± 12.5 |
| Systolic blood pressure, mmHg | 128 ± 16 | 126 ± 15 | 129 ± 17 |
| Diastolic blood pressure, mmHg | 81 ± 10 | 81 ± 10 | 81 ± 10 |
| AUSDRISK Score | 15.3 ± 4.7 | 15.0 ± 4.7 | 15.6 ± 4.7 |
| Fasting plasma glucose, mmol/L | 5.1 ± 0.7 | 5.1 ± 0.6 1 | 5.2 ± 0.8 2 |
| Fasting insulin, u/mL | 11.1 ± 6.7 | 10.6 ± 6.9 | 11.8 ± 6.3 2 |
| HbA1c, % | 5.6 ± 0.4 | 5.6 ± 0.3 | 5.6 ± 0.6 3 |
| 2-h glucose, mmol/L | 5.9 ± 2.3 | 5.7 ± 1.8 1 | 6.2 ± 2.9 2 |
| Prescribed antihypertensive medication, n (%) | 14 (13) | 5 (9) | 9 (18) |
| Peanut Group | Control Group | p-Values | |||||||
|---|---|---|---|---|---|---|---|---|---|
| Time (Months) | 0 (n = 57) | 3 (n = 47) | 6 (n = 44) | 0 (n = 50) | 3 (n = 33) | 6 (n = 31) | Diet | Visit | Diet x Visit |
| SBP, mmHg | 127 ± 0.9 | 119 ± 1.0 | 117 ± 1.1 | 127 ± 1.0 | 122 ± 1.2 | 122 ± 1.3 | 0.007 | <0.001 | 0.063 |
| DBP, mmHg | 81 ± 0.6 | 77 ± 0.7 | 75 ± 0.7 | 81 ± 0.7 | 77 ± 0.8 | 76 ± 0.8 | 0.52 | <0.001 | 0.70 |
| Peanut Group | Control Group | p-Values | |||||||
|---|---|---|---|---|---|---|---|---|---|
| Time (Months) | 0 (n = 57) | 3 (n = 46) | 6 (n = 43) | 0 (n= 44) | 3 (n = 35) | 6 (n = 32) | Diet | Visit | Diet x Visit |
| Fasting glucose, mmol/L | 5.12 ± 0.04 1 | 5.01 ± 0.05 | 4.99 ± 0.05 | 5.13 ± 0.05 | 4.96 ± 0.05 4 | 4.90 ± 0.06 5 | 0.37 | <0.001 | 0.46 |
| Fasting insulin, u/mL | 10.89 ± 0.52 | 8.95 ± 0.58 | 8.14 ± 0.59 3 | 11.42 ± 0.59 | 8.15 ± 0.67 | 7.33 ± 0.70 | 0.50 | <0.001 | 0.41 |
| 2-h glucose, mmol/L | 5.84 ± 0.17 1 | 5.93 ± 0.19 2 | 6.06 ± 0.19 | 5.89 ± 0.19 | 6.30 ± 0.21 4 | 6.41 ± 0.22 5 | 0.18 | 0.09 | 0.58 |
| HbA1c, % | 5.61 ± 0.02 | 5.50 ± 0.02 | 5.48 ± 0.02 | 5.61 ± 0.02 2 | 5.55 ± 0.02 | 5.49 ± 0.02 | 0.21 | <0.001 | 0.32 |
| HOMA-IR | 2.49 ± 0.12 1 | 2.09 ± 0.14 | 1.88 ± 0.14 | 2.66 ± 0.14 | 1.83 ± 0.16 4 | 1.60 ± 0.17 5 | 0.35 | <0.001 | 0.17 |
| Peanut Group | Control Group | p-Values | |||||||
|---|---|---|---|---|---|---|---|---|---|
| Time (Months) | 0 (n= 57) | 3 (n = 48) | 6 (n = 44) | 0 (n = 47) | 3 (n = 34) | 6 (n= 32) | Diet | Visit | Diet x Visit |
| Energy (kJ) | 8340 ± 295 | 7011 ± 322 | 7657 ± 336 | 8770 ± 325 | 6126 ± 382 | 5926 ± 394 | 0.01 | <0.001 | 0.005 |
| Protein (g) | 91 ± 3.6 | 87 ± 4.0 | 97 ± 4.1 | 91 ± 4.0 | 72 ± 4.7 | 79 ± 4.9 | 0.005 | 0.02 | 0.055 |
| Protein (% kJ) | 19 ± 0.6 | 21 ± 0.6 | 21 ± 0.7 | 18 ± 0.7 | 20 ± 0.8 | 22 ± 0.8 | 0.52 | <0.001 | 0.27 |
| Total Fat (g) | 80 ± 4.0 | 75 ± 4.4 | 88 ± 4.6 | 83 ± 4.4 | 50 ± 5.2 | 52 ± 5.4 | <0.001 | <0.001 | <0.001 |
| Total Fat (% kJ) | 36 ± 1.1 | 40 ± 1.2 | 44 ± 1.2 | 35 ± 1.2 | 29 ± 1.4 | 32 ± 1.4 | <0.001 | 0.03 | <0.001 |
| Saturated Fat (g) | 29 ± 1.5 | 21 ± 1.7 | 24 ± 1.7 | 30 ± 1.7 | 18 ± 2.0 | 18 ± 2.0 | 0.07 | <0.001 | 0.17 |
| Saturated Fat (% kJ) | 13 ± 0.5 | 11 ± 0.5 | 12 ± 0.5 | 12 ± 0.5 | 10 ± 0.6 | 11 ± 0.6 | 0.25 | 0.005 | 0.88 |
| MUFA (g) | 32 ± 1.9 | 38 ± 2.1 | 45 ± 2.1 | 34 ± 2.1 | 18 ± 2.4 | 20 ± 2.5 | <0.001 | 0.09 | <0.001 |
| MUFA (% kJ) | 14 ± 0.7 | 21 ± 0.7 | 23 ± 0.7 | 14 ± 0.7 | 11 ± 0.8 | 12 ± 0.9 | <0.001 | <0.001 | <0.001 |
| PUFA (g) | 13 ± 0.7 | 10 ± 0.8 | 12 ± 0.8 | 13 ± 0.8 | 8 ± 1.0 | 9 ± 1.0 | 0.03 | <0.001 | 0.22 |
| PUFA (% kJ) | 5.8 ± 0.3 | 5.1 ± 0.3 | 5.7 ± 0.3 | 5.5 ± 0.3 | 4.8 ± 0.4 | 5.4 ± 0.4 | 0.24 | 0.08 | >0.99 |
| Carbohydrates (g) | 192 ± 7.5 | 138 ± 8.1 | 140 ± 8.5 | 201 ± 8.2 | 167 ± 9.7 | 144 ± 10 | 0.055 | <0.001 | 0.33 |
| Carbohydrates (% kJ) | 39 ± 1.1 | 33 ± 1.2 | 30 ± 1.2 | 39 ± 1.2 | 46 ± 1.4 | 40 ± 1.5 | <0.001 | 0.003 | <0.001 |
| Total Sugars (g) | 81 ± 3.8 | 66 ± 4.1 | 66 ± 4.3 | 86 ± 4.2 | 70 ± 4.9 | 70 ± 5.1 | 0.21 | <0.001 | 0.99 |
| Total Fiber (g) | 25 ± 1.2 | 29 ± 1.3 | 29 ± 1.3 | 26 ± 1.3 | 27 ± 1.5 | 23 ± 1.6 | 0.18 | 0.13 | 0.03 |
| Sodium (mg) | 2319 ± 118 | 1950 ± 129 | 1968 ± 135 | 2380 ± 131 | 2098 ± 153 | 1850 ± 158 | 0.81 | 0.002 | 0.61 |
| Potassium (mg) | 3287 ± 137 | 3352 ± 149 | 3619 ± 156 | 3442 ± 150 | 2877 ± 177 | 2973 ± 183 | 0.02 | 0.24 | 0.02 |
Publisher’s Note: MDPI stays neutral with regard to jurisdictional claims in published maps and institutional affiliations. |
© 2022 by the authors. Licensee MDPI, Basel, Switzerland. This article is an open access article distributed under the terms and conditions of the Creative Commons Attribution (CC BY) license (https://creativecommons.org/licenses/by/4.0/).
Share and Cite
Petersen, K.S.; Murphy, J.; Whitbread, J.; Clifton, P.M.; Keogh, J.B. The Effect of a Peanut-Enriched Weight Loss Diet Compared to a Low-Fat Weight Loss Diet on Body Weight, Blood Pressure, and Glycemic Control: A Randomized Controlled Trial. Nutrients 2022, 14, 2986. https://doi.org/10.3390/nu14142986
Petersen KS, Murphy J, Whitbread J, Clifton PM, Keogh JB. The Effect of a Peanut-Enriched Weight Loss Diet Compared to a Low-Fat Weight Loss Diet on Body Weight, Blood Pressure, and Glycemic Control: A Randomized Controlled Trial. Nutrients. 2022; 14(14):2986. https://doi.org/10.3390/nu14142986
Chicago/Turabian StylePetersen, Kristina S., Jess Murphy, Jane Whitbread, Peter M. Clifton, and Jennifer B. Keogh. 2022. "The Effect of a Peanut-Enriched Weight Loss Diet Compared to a Low-Fat Weight Loss Diet on Body Weight, Blood Pressure, and Glycemic Control: A Randomized Controlled Trial" Nutrients 14, no. 14: 2986. https://doi.org/10.3390/nu14142986