
Associations between Dietary Intake and Attention Deficit Hyperactivity Disorder (ADHD) Scores by Repeated Measurements in School-Age Children

 , , ,
, , ,
Abstract
:1. Introduction
2. Materials and Methods
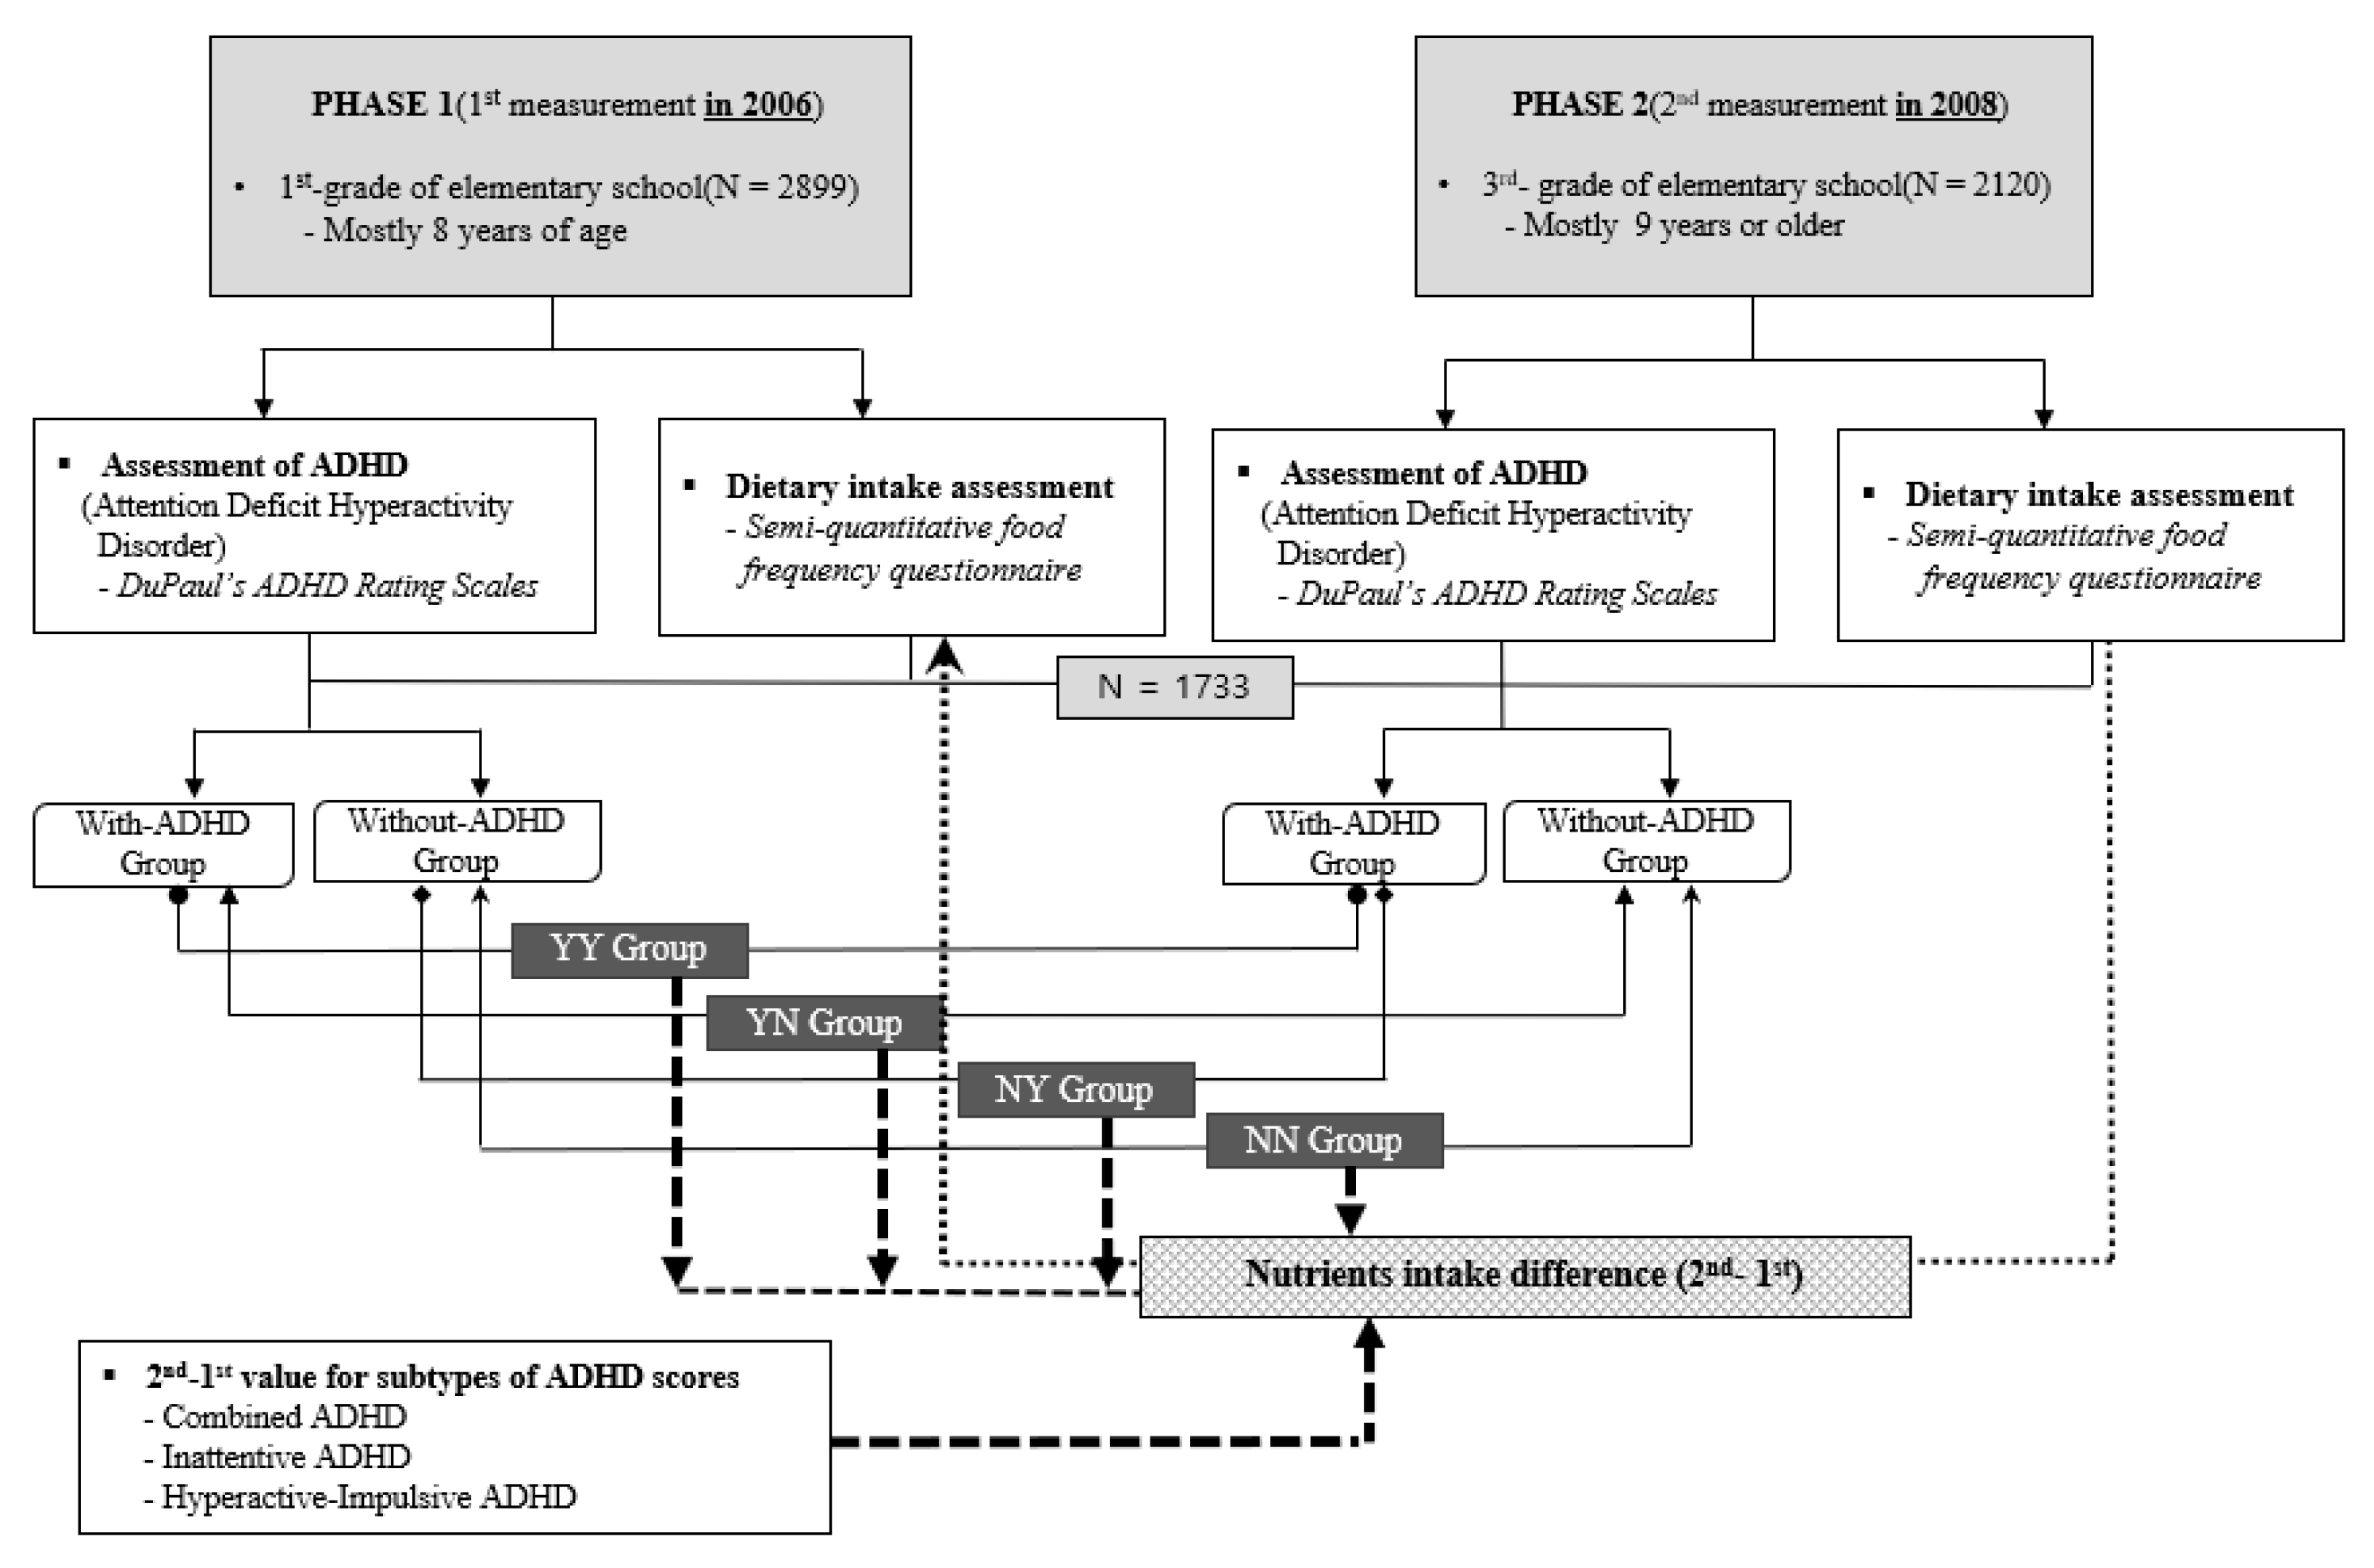
2.1. Study Design
2.2. Study Participants
2.3. Secondary Outcome Measure: Dietary Intake
2.4. Other Measurements
2.5. Statistical Analysis
3. Results
4. Discussion
5. Conclusions
Author Contributions
Funding
Institutional Review Board Statement
Informed Consent Statement
Data Availability Statement
Acknowledgments
Conflicts of Interest
References
- Christensen, D.; Fahey, M.T.; Giallo, R.; Hancock, K.J. Longitudinal trajectories of mental health in Australian children aged 4–5 to 14–15 years. PLoS ONE 2017, 12, e0187974. [Google Scholar] [CrossRef] [PubMed] [Green Version]
- Spencer, T.J.; Biederman, J.; Mick, E. Attention-deficit/hyperactivity disorder: Diagnosis, lifespan, comorbidities, and neurobiology. Ambul. Pediatr. 2007, 7 (Suppl. S1), 73–81. [Google Scholar] [CrossRef] [PubMed]
- Fuentes-Albero, M.; Martínez-Martínez, M.I.; Cauli, O. Omega-3 long-chain polyunsaturated fatty acids intake in children with attention deficit and hyperactivity disorder. Brain Sci. 2019, 9, 120. [Google Scholar] [CrossRef] [PubMed] [Green Version]
- Leventakou, V.; Micali, N.; Georgiou, V.; Sarri, K.; Koutra, K.; Koinaki, S.; Vassilaki, M.; Kogevinas, M.; Chatzi, L. Is there an association between eating behaviour and attention-deficit/hyperactivity disorder symptoms in preschool children? J. Child Psychol. Psychiatry 2016, 57, 676–684. [Google Scholar] [CrossRef]
- Konikowska, K.; Regulska-Ilow, B.; Rózańska, D. The influence of components of diet on the symptoms of ADHD in children. Rocz. Panstw. Zakl. Hig. 2012, 63, 127–134. [Google Scholar]
- Abel, M.H.; Ystrom, E.; Caspersen, I.H.; Meltzer, H.M.; Aase, H.; Torheim, L.E.; Askeland, R.B.; Reichborn-Kjennerud, T.; Brantsæter, A.L. Maternal iodine intake and offspring attention-deficit/hyperactivity disorder: Results from a large prospective cohort study. Nutrients 2017, 9, 1239. [Google Scholar] [CrossRef] [Green Version]
- Bowling, A.; Davison, K.; Haneuse, S.; Beardslee, W.; Miller, D.P. ADHD medication, dietary patterns, physical activity, and BMI in children: A longitudinal analysis of the ECLS-K study. Obesity 2017, 25, 1802–1808. [Google Scholar] [CrossRef] [Green Version]
- Yan, S.; Cao, H.; Gu, C.; Ni, L.; Tao, H.; Shao, T.; Xu, Y.; Tao, F. Dietary patterns are associated with attention-deficit/hyperactivity disorder (ADHD) symptoms among preschoolers in mainland China. Eur. J. Clin. Nutr. 2018, 72, 1517–1523. [Google Scholar] [CrossRef]
- Rowland, A.S.; Skipper, B.J.; Umbach, D.M.; Rabiner, D.L.; Campbell, R.A.; Naftel, A.J.; Sandler, D.P. The prevalence of ADHD in a population-based sample. J. Atten. Disord. 2015, 19, 741–754. [Google Scholar] [CrossRef] [Green Version]
- Wu, X.; Ohinmaa, A.; Veugelers, P.J. The influence of health behaviours in childhood on attention deficit and hyperactivity disorder in adolescence. Nutrients 2016, 8, 788. [Google Scholar] [CrossRef] [Green Version]
- Polanczyk, G.; de Lima, M.S.; Horta, B.L.; Biederman, J.; Rohde, L.A. The worldwide prevalence of ADHD: A systematic review and metaregression analysis. Am. J. Psychiatry 2007, 164, 942–948. [Google Scholar] [CrossRef] [PubMed]
- Scahill, L.; Schwab-Stone, M. Epidemiology of ADHD in school-age children. Child Adolesc. Psychiatr. Clin. N. Am. 2000, 9, 541–555. [Google Scholar] [CrossRef]
- Willcutt, E.G. The prevalence of DSM-IV attention-deficit/hyperactivity disorder: A meta-analytic review. Neurotherapeutics 2012, 9, 490–499. [Google Scholar] [CrossRef] [PubMed] [Green Version]
- Huang, C.L.; Chu, C.C.; Cheng, T.J.; Weng, S.F. Epidemiology of treated attention-deficit/hyperactivity disorder (ADHD) across the lifespan in Taiwan: A nationwide population-based longitudinal study. PLoS ONE 2014, 9, e95014. [Google Scholar]
- Kim, E.J.; Kwon, H.J.; Ha, M.; Lim, M.H.; Oh, S.Y.; Kim, J.H.; Yoo, S.J.; Paik, K.C. Relationship among attention-deficit hyperactivity disorder, dietary behaviours and obesity. Child Care Health Dev. 2014, 40, 698–705. [Google Scholar] [CrossRef]
- Kim, K.M.; Lim, M.H.; Kwon, H.J.; Yoo, S.J.; Kim, E.J.; Kim, J.W.; Ha, M.; Paik, K.C. Associations between attention-deficit/hyperactivity disorder symptoms and dietary habits in elementary school children. Appetite 2018, 127, 274–279. [Google Scholar] [CrossRef]
- Chauhan, A.; Sahu, J.K.; Singh, M.; Jaiswal, N.; Agarwal, A.; Bhanudeep, S.; Pradhan, P.; Singh, M. Burden of Attention Deficit Hyperactivity Disorder (ADHD) in Indian Children: A Systematic Review and Meta-Analysis. Indian J. Pediatr. 2022, 89, 570–578. [Google Scholar] [CrossRef]
- Sayal, K.; Prasad, V.; Daley, D.; Ford, T.; Coghill, D. ADHD in children and young people: Prevalence, care pathways, and service provision. Lancet Psychiatry 2018, 5, 175–186. [Google Scholar] [CrossRef]
- Thomas, R.; Sanders, S.; Doust, J.; Beller, E.; Glasziou, P. Prevalence of attention-deficit/hyperactivity disorder: A systematic review and meta-analysis. Pediatrics 2015, 135, e994–e1001. [Google Scholar] [CrossRef] [Green Version]
- Kazda, L.; Bell, K.; Thomas, R.; McGeechan, K.; Sims, R.; Barratt, A. Overdiagnosis of Attention-Deficit/Hyperactivity Disorder in Children and Adolescents: A Systematic Scoping Review. JAMA Netw. Open 2021, 4, e215335. [Google Scholar] [CrossRef]
- Catalá-López, F.; Ridao, M.; Núñez-Beltrán, A.; Gènova-Maleras, R.; Alonso-Arroyo, A.; Aleixandre-Benavent, R.; Catalá, M.A.; Tabarés-Seisdedos, R. Prevalence and comorbidity of attention deficit hyperactivity disorder in Spain: Study protocol for extending a systematic review with updated meta-analysis of observational studies. Syst. Rev. 2019, 8, 49. [Google Scholar] [CrossRef] [PubMed]
- Wang, L.J.; Yu, Y.H.; Fu, M.L.; Yeh, W.T.; Hsu, J.L.; Yang, Y.H.; Yang, H.T.; Huang, S.Y.; Wei, I.L.; Chen, W.J.; et al. Dietary profiles, nutritional biochemistry status, and attention-deficit/hyperactivity disorder: Path analysis for a case-control study. J. Clin. Med. 2019, 8, 709. [Google Scholar] [CrossRef] [PubMed] [Green Version]
- Froehlich, T.E.; Anixt, J.S.; Loe, I.M.; Chirdkiatgumchai, V.; Kuan, L.; Gilman, R.C. Update on environmental risk factors for attention-deficit/hyperactivity disorder. Curr. Psychiatry Rep. 2011, 13, 333–344. [Google Scholar] [CrossRef] [PubMed]
- Millichap, J.G.; Yee, M.M. The diet factor in attention-deficit/hyperactivity disorder. Pediatrics 2012, 129, 330–337. [Google Scholar] [CrossRef] [Green Version]
- Koo, N.S.; Koo, K.O.; Chung, J. Study on dietary factors associated with characteristics of attention deficit hyperactivity disorder. J. Korean Soc. Food Cult. 2012, 27, 544–551. [Google Scholar] [CrossRef] [Green Version]
- Verlaet, A.A.J.; Maasakkers, C.M.; Hermans, N.; Savelkoul, H.F.J. Rationale for dietary antioxidant treatment of ADHD. Nutrients 2018, 10, 405. [Google Scholar] [CrossRef] [Green Version]
- Mohammadpour, N.; Jazayeri, S.; Tehrani-Doost, M.; Djalali, M.; Hosseini, M.; Effatpanah, M.; Davari-Ashtiani, R.; Karami, E. Effect of vitamin D supplementation as adjunctive therapy to methylphenidate on ADHD symptoms: A randomized, double blind, placebo-controlled trial. Nutr. Neurosci. 2018, 21, 202–209. [Google Scholar] [CrossRef]
- Velasco, I.; Bath, S.C.; Rayman, M.P. Iodine as essential nutrient during the first 1000 days of life. Nutrients 2018, 10, 290. [Google Scholar] [CrossRef] [Green Version]
- Chou, W.J.; Lee, M.F.; Hou, M.L.; Hsiao, L.S.; Lee, M.J.; Chou, M.C.; Wang, L.J. Dietary and nutrient status of children with attention-deficit/ hyperactivity disorder: A case-control study. Asia Pac. J. Clin. Nutr. 2018, 27, 1325–1331. [Google Scholar]
- Lu, S.; Perez, L.; Leslein, A.; Hatsu, I. The relationship between food insecurity and symptoms of attention-deficit hyperactivity disorder in children: A summary of the literature. Nutrients 2019, 11, 659. [Google Scholar] [CrossRef] [Green Version]
- Ognjenovic, M.; Ambrosini, G.L.; Malacova, E.; Doherty, D.A.; Oddy, W.H.; Handelsman, D.J.; McLachlan, R.; Dickinson, J.; Hart, R.J. Associations between major dietary patterns and testicular function in a population-based cohort of young men: Results from the Western Australian Pregnancy Cohort (Raine) Study. Andrology 2019, 7, 273–280. [Google Scholar] [CrossRef] [PubMed] [Green Version]
- Zhou, F.; Wu, F.; Zou, S.; Chen, Y.; Feng, C.; Fan, G. Dietary, nutrient patterns and blood essential elements in Chinese children with ADHD. Nutrients 2016, 8, 352. [Google Scholar] [CrossRef] [PubMed]
- Del-Ponte, B.; Santos, I.S.; Tovo-Rodrigues, L.; Anselmi, L.; Munhoz, T.N.; Matijasevich, A. Caffeine consumption during pregnancy and ADHD at the age of 11 years: A birth cohort study. BMJ Open 2016, 6, e012749. [Google Scholar] [CrossRef] [PubMed] [Green Version]
- Jacob, L.; Stubbs, B.; Koyanagi, A. Consumption of carbonated soft drinks and suicide attempts among 105,061 adolescents aged 12–15 years from 6 high-income, 22 middle-income, and 4 low-income countries. Clin. Nutr. 2020, 39, 886–892. [Google Scholar] [CrossRef]
- Phillips, W. Nutrition management of children with attention deficit hyperactivity disorder. ICAN Infant Child Adolesc. Nutr. 2014, 6, 320–326. [Google Scholar] [CrossRef]
- Wu, X.Y.; Zhuang, L.H.; Li, W.; Guo, H.W.; Zhang, J.H.; Zhao, Y.K.; Hu, J.W.; Gao, Q.Q.; Luo, S.; Ohinmaa, A.; et al. The influence of diet quality and dietary behavior on health-related quality of life in the general population of children and adolescents: A systematic review and meta-analysis. Qual. Life Res. 2019, 28, 1989–2015. [Google Scholar] [CrossRef]
- Wu, X.Y.; Ohinmaa, A.; Veugelers, P.J. Diet quality, physical activity, body weight and health-related quality of life among grade 5 students in Canada. Public Health Nutr. 2012, 15, 75–81. [Google Scholar] [CrossRef]
- Muros, J.J.; Salvador Pérez, F.; Zurita Ortega, F.; Gámez Sánchez, V.M.; Knox, E. The association between healthy lifestyle behaviors and health-related quality of life among adolescents. J. Pediatr. 2017, 93, 406–412. [Google Scholar] [CrossRef]
- Shareghfarid, E.; Sangsefidi, Z.S.; Salehi-Abargouei, A.; Hosseinzadeh, M. Empirically derived dietary patterns and food groups intake in relation with Attention Deficit/Hyperactivity Disorder (ADHD): A systematic review and meta-analysis. Clin. Nutr. ESPEN 2020, 36, 28–35. [Google Scholar] [CrossRef]
- Rojo-Marticella, M.; Arija, V.; Alda, J.Á.; Morales-Hidalgo, P.; Esteban-Figuerola, P.; Canals, J. Do Children with Attention-Deficit/Hyperactivity Disorder Follow a Different Dietary Pattern than That of Their Control Peers? Nutrients 2022, 14, 1131. [Google Scholar] [CrossRef]
- Robinette, L.M.; Hatsu, I.E.; Johnstone, J.M.; Tost, G.; Bruton, A.M.; Leung, B.M.Y.; Odei, J.B.; Orchard, T.; Gracious, B.L.; Arnold, L.E. Fruit and vegetable intake is inversely associated with severity of inattention in a pediatric population with ADHD symptoms: The MADDY Study. Nutr. Neurosci. 2022, 1–10. [Google Scholar] [CrossRef] [PubMed]
- Lertxundi, N.; Molinuevo, A.; Valvi, D.; Gorostiaga, A.; Balluerka, N.; Shivappa, N.; Hebert, J.; Navarrete-Muñoz, E.M.; Vioque, J.; Tardón, A.; et al. Dietary inflammatory index of mothers during pregnancy and Attention Deficit-Hyperactivity Disorder symptoms in the child at preschool age: A prospective investigation in the INMA and RHEA cohorts. Eur. Child Adolesc. Psychiatry 2022, 31, 615–624. [Google Scholar] [CrossRef] [PubMed]
- Lee, S.Y.; Kim, B.S.; Kwon, S.O.; Oh, S.Y.; Shin, H.L.; Jung, Y.H.; Lee, E.; Yang, S.I.; Kim, H.Y.; Seo, J.H.; et al. Modification of additive effect between vitamins and ETS on childhood asthma risk according to GSTP1 polymorphism: A cross–sectional study. BMC Pulm. Med. 2015, 15, 125. [Google Scholar] [CrossRef] [PubMed] [Green Version]
- So, Y.K.; Noh, J.S.; Kim, Y.S.; Ko, S.G.; Koh, Y.J. The reliability and validity of Korean parent and teacher ADHD rating scale. J. Korean Neuropsychiatr. Assoc. 2002, 41, 283–289. [Google Scholar]
- DuPaul, G.J.; Power, T.J.; Anastopoulos, A.D.; Reid, R. ADHD Rating Scale—IV: Checklists, Norms, and Clinical Interpretation; Guilford: New York, YN, USA, 1998. [Google Scholar]
- Park, W.J.; Seo, J.Y.; Kim, M.Y. Meta analysis of variables related to attention deficit hyperactivity disorder in school-age children. J. Korean Acad. Nurs. 2011, 41, 256–268. [Google Scholar] [CrossRef] [Green Version]
- Lim, Y.; Oh, S.Y. Development of a semi-quantitative food frequency questionnaire for pre-school children in Korea. Korean J. Community Nutr. 2022, 7, 58–66. [Google Scholar]
- Azadbakht, L.; Esmaillzadeh, A. Dietary patterns and attention deficit hyperactivity disorder among Iranian children. Nutrition 2012, 28, 242–249. [Google Scholar] [CrossRef]
- Smithers, L.G.; Golley, R.K.; Mittinty, M.N.; Brazionis, L.; Northstone, K.; Emmett, P.; Lynch, J.W. Dietary patterns at 6, 15 and 24 months of age are associated with IQ at 8 years of age. Eur. J. Epidemiol. 2012, 27, 525–535. [Google Scholar] [CrossRef]
- Wiles, N.J.; Northstone, K.; Emmett, P.; Lewis, G. “Junk food” diet and childhood behavioral problems: Results from the ALSPAC cohort. Eur. J. Clin. Nutr. 2009, 63, 491–498. [Google Scholar] [CrossRef] [Green Version]
- Woo, H.D.; Kim, D.W.; Hong, Y.S.; Kim, Y.M.; Seo, J.H.; Choe, B.M.; Park, J.H.; Kang, J.W.; Yoo, J.H.; Chueh, H.W.; et al. Dietary patterns in children with attention deficit/hyperactivity disorder (ADHD). Nutrients 2014, 6, 1539–1553. [Google Scholar] [CrossRef]
- Rosenblatt, M. A central limit theorem and a strong mixing condition. Proc. Natl. Acad. Sci. USA 1956, 42, 43–47. [Google Scholar] [CrossRef] [PubMed] [Green Version]
- Polanczyk, G.V.; Willcutt, E.G.; Salum, G.A.; Kieling, C.; Rohde, L.A. ADHD prevalence estimates across three decades: An updated systematic review and meta-regression analysis. Int. J. Epidemiol. 2014, 43, 434–442. [Google Scholar] [CrossRef] [PubMed]
- Del-Ponte, B.; Quinte, G.C.; Cruz, S.; Grellert, M.; Santos, I.S. Dietary patterns and attention deficit/hyperactivity disorder (ADHD): A systematic review and meta-analysis. J. Affect. Disord. 2019, 252, 160–173. [Google Scholar] [CrossRef] [PubMed]
- Lee, K.S.; Choi, Y.J.; Lim, Y.H.; Lee, J.Y.; Shin, M.K.; Kim, B.N.; Shin, C.H.; Lee, Y.A.; Kim, J.I.; Hong, Y.C. Dietary patterns are associated with attention-deficit hyperactivity disorder (ADHD) symptoms among preschoolers in South Korea: A prospective cohort study. Nutr. Neurosci. 2022, 25, 603–611. [Google Scholar] [CrossRef]
- Granero, R.; Pardo-Garrido, A.; Carpio-Toro, I.L.; Ramírez-Coronel, A.A.; Martínez-Suárez, P.C.; Reivan-Ortiz, G.G. The Role of Iron and Zinc in the Treatment of ADHD among Children and Adolescents: A Systematic Review of Randomized Clinical Trials. Nutrients 2021, 13, 4059. [Google Scholar] [CrossRef]
- Farsad-Naeimi, A.; Asjodi, F.; Omidian, M.; Askari, M.; Nouri, M.; Pizarro, A.B.; Daneshzad, E. Sugar consumption, sugar sweetened beverages and Attention Deficit Hyperactivity Disorder: A systematic review and meta-analysis. Complement. Ther. Med. 2020, 53, 102512. [Google Scholar] [CrossRef]
- Choi, J.Y.; Lee, S.S. Relation between Dietary Habit and Nutrition Knowledge, and Attention Deficit Hyperactivity Disorder (ADHD) in the Middle School Students in Seoul. Korean J. Nutr. 2009, 42, 682–690. [Google Scholar] [CrossRef] [Green Version]
- Reinblatt, S.P.; Mahone, E.M.; Tanofsky-Kraff, M.; Lee-Winn, A.E.; Yenokyan, G.; Leoutsakos, J.M.; Moran, T.H.; Guarda, A.S.; Riddle, M.A. Pediatric loss of control eating syndrome: Association with attention-deficit/hyperactivity disorder and impulsivity. Int. J. Eat. Disord. 2015, 48, 580–588. [Google Scholar] [CrossRef] [Green Version]
- Merkt, J.; Gawrilow, C. Health, Dietary Habits, and Achievement Motivation in College Students with Self-Reported ADHD Diagnosis. J. Atten. Disord. 2016, 20, 727–740. [Google Scholar] [CrossRef]


| Characteristics by Survey Time | |||||||||||
|---|---|---|---|---|---|---|---|---|---|---|---|
| Phase 1 (n = 2741) | p | Phase 2 (n = 2102) | p | Final (n = 1733) | p | ||||||
| Mean age 7.4 [SD 0.6] Boys 1348 (51.16%)/Girls 1287 (48.84%) | Mean age 9.4 [SD 0.6] Boys 1069 (50.86%)/Girls 1033 (49.14%) | Boys 882 (50.9%)/ Girls 851 (49.1%) | 0.555 | ||||||||
| Family income (104 KRW) | <200 | 847 (32.8) | <0.001 | 479 (27.0) | <0.001 | - | |||||
| 200–500 | 1466 (56.7) | 1055 (59.4) | |||||||||
| >500 | 273 (10.2) | 243 (13.7) | |||||||||
| Marital status of parent | Single | 96 (3.7) | <0.001 | 65 (3.1) | <0.001 | - | |||||
| Married | 2272 (83.9) | 1807 (87.5) | |||||||||
| Divorced | 216 (8.4) | 194 (9.4) | |||||||||
| Father’s education level | High school | - | - | 796 (47.4) | <0.001 | ||||||
| College | 211 (12.6) | ||||||||||
| University | 615 (36.6) | ||||||||||
| Graduate school | 58 (3.5) | ||||||||||
| Mother’s education level | High school | - | - | 1013 (60.7) | <0.001 | ||||||
| College | 194 (11.6) | ||||||||||
| University | 440 (26.4) | ||||||||||
| Graduate school | 22 (1.3) | ||||||||||
| Prevalence | 12.1% | 9.1% | - | ||||||||
| Total Sample (n = 2568) | Non-ADHD (n = 2238) | ADHD (n = 330) | p | Total Sample (n = 2094) | Non-ADHD (n = 1894) | ADHD (n = 200) | p | ||||
| Gender (M) (%) | Boys | 1317 | 1075 (81.6) | 242 (18.4) | <0.001 *** | 1062 | 920 (86.6) | 142 (13.4) | <0.001 *** | ||
| Girls | 1251 | 1163 (92.9) | 88 (7.1) | 1032 | 974 (94.4) | 58 (5.6) | |||||
| BMI (mean ± SD) (kg/m2) | 16.8 ± 2.5 | 17.1 ± 2.6 | 0.0223 | 18.1 ± 2.9 | 18.3 ± 3.3 | 0.2975 | |||||
| Family income | |||||||||||
| Low income | 685 (27.1) | 123 (4.9) | 0.0453 | 407 (22.9) | 70 (4.0) | <0.0001 | |||||
| Middle income | 1271 (50.4) | 173 (6.8) | 967 (54.5) | 87 (4.9) | |||||||
| High income | 243 (9.6) | 29 (1.2) | 227 (12.8) | 16 (0.9) | |||||||
| Marital status of parents | |||||||||||
| Single | 79 (3.1) | 11 (0.4) | <0.0001 | 62 (3.0) | 3 (0.2) | <0.0001 | |||||
| Married (living together) | 1964 (77.8) | 264 (10.5) | 1651 (80.2) | 149 (7.2) | |||||||
| Divorced (widowed or separated) | 156 (6.2) | 51 (2.0) | 149 (7.2) | 45 (2.2) | |||||||
| Characteristics by four ADHD groups | |||||||||||
| NN | YN | YY | NY | p | |||||||
| Frequency | 1422 (83.6) | 125 (7.4) | 82 (4.8) | 72 (4.2) | 0.005 | ||||||
| Age in Phase 1 | 7.4 [0.6] | 7.3 [0.6] | 7.4 [0.5] | 7.5 [0.8] | - | ||||||
| Age in Phase 2 | 9.4 [0.6] | 9.3 [0.6] | 9.4 [0.5] | 9.5 [0.8] | - | ||||||
| Gender | Boys | 662 (38.9) | 92 (5.4) | 64 (3.8) | 49 (2.9) | <0.001 *** | |||||
| Girls | 760 (44.7) | 33 (1.9) | 18 (1.1) | 23 (1.3) | |||||||
| Family income in Phase 1 | <200 | 395 (80.6) | 37 (7.6) | 32 (6.5) | 26 (6.2) | ||||||
| 200–500 | 870 (84.7) | 80 (7.8) | 41 (4.0) | 43 (3.7) | |||||||
| >500 | 19 (86.4) | 1 (4.6) | 2 (9.1) | 5 (2.8) | |||||||
| Family income in Phase 2 | <200 | 282 (79.2) | 25 (7.9) | 27 (4.1) | 22 (6.2) | 0.013 ** | |||||
| 200–500 | 976 (84.3) | 92 (5.4) | 47 (2.8) | 43 (3.7) | |||||||
| >500 | 158 (88.8) | 8 (4.5) | 7 (3.9) | 5 (2.8) | |||||||
| Marital status in Phase 1 | Single | 45 (3.2) | 3 (2.4) | 2 (2.5) | 1 (1.4) | 0.001 ** | |||||
| Married | 1293 (91.6) | 110 (88.0) | 65 (80.3) | 64 (90.1) | |||||||
| Divorced | 74 (5.2) | 12 (9.6) | 14 (17.3) | 6 (8.5) | |||||||
| Marital status in Phase 2 | Single | 36 (2.6) | 4 (3.2) | 2 (2.5) | 0 (0.0) | 0.000 ** | |||||
| Married | 1287 (91.2) | 108 (86.4) | 63 (77.8) | 63 (88.7) | |||||||
| Divorced | 89 (6.3) | 13 (10.4) | 16 (19.8) | 8 (11.3) | |||||||
| Model 1 (Unadjusted) | ||||||
| Phase 1 (n = 1733) | Phase 2 (n = 1733) | |||||
| Boys (n = 882) | Girls (n = 851) | p | Boys (n = 882) | Girls (n = 851) | p | |
| Energy (kcal) | 1757.4 ± 742.1 | 1584.6 ± 673.9 | <0.0001 | 1753.6 ± 849.1 | 1603.2 ± 850.9 | 0.0002 |
| Protein (g) | 62.4 ± 28.7 | 56.6 ± 28.2 | <0.0001 | 61.4 ± 30.6 | 56.8 ± 34.2 | 0.003 |
| Vegetable | 27.7 ± 12.1 | 25.5 ± 11.4 | 0.0001 | 27.8 ± 13.6 | 26.4 ± 15.0 | 0.04 |
| Animal | 34.6 ± 19.7 | 31.0 ± 20.3 | 0.0002 | 33.6 ± 19.8 | 30.3 ± 22.1 | 0.001 |
| Fat (g) | 55.0 ± 29.3 | 49.9 ± 27.3 | 0.0002 | 53.4 ± 31.2 | 48.3 ± 32.6 | 0.0009 |
| Vegetable | 23.9 ± 14.1 | 22.1 ± 13.0 | 0.008 | 23.1 ± 15.4 | 21.6 ± 16.4 | 0.05 |
| Animal | 31.1 ± 17.9 | 27.7 ± 16.4 | <0.0001 | 30.3 ± 18.2 | 26.7 ± 18.1 | <0.0001 |
| Carbohydrate (g) | 256.3 ± 107.6 | 230.4 ± 98.0 | <0.0001 | 259.6 ± 126.3 | 238.0 ± 120.7 | 0.0003 |
| Fiber (g) | 3.6 ± 2.1 | 3.5 ± 2.1 | 0.71 | 13.1 ± 7.5 | 12.8 ± 8.2 | 0.43 |
| Calcium (mg) | 728.0 ± 459.7 | 634.2 ± 367.4 | <0.0001 | 659.4 ± 475.2 | 581.1 ± 394.0 | 0.0002 |
| Vegetable | 199.6 ± 118.7 | 192.9 ± 115.9 | 0.23 | 190.9 ± 134.1 | 185.9 ± 134.3 | 0.44 |
| Animal | 528.4 ± 397.4 | 441.3 ± 297.8 | <0.0001 | 468.4 ± 385.5 | 395.1 ± 315.0 | <0.0001 |
| Phosphorus (mg) | 15.8 ± 8.9 | 14.9 ± 8.8 | 0.04 | 15.9 ± 10.3 | 15.2 ± 11.0 | 0.18 |
| Iron (mg) | 9.6 ± 4.7 | 8.9 ± 4.4 | 0.004 | 9.4 ± 5.0 | 9.0 ± 5.4 | 0.09 |
| Vegetable | 7.0 ± 3.5 | 6.5 ± 3.3 | 0.007 | 6.8 ± 3.7 | 6.5 ± 3.9 | 0.20 |
| Animal | 2.5 ± 1.5 | 2.3 ± 1.6 | 0.01 | 2.5 ± 1.5 | 2.4 ± 1.7 | 0.02 |
| Sodium (mg) | 2874.9 ± 1734.5 | 2799.9 ± 1815.7 | 0.37 | 2844.8 ± 1782.9 | 2780.0 ± 2067.3 | 0.48 |
| Potassium (mg) | 2338.4 ± 1272.3 | 2173.6 ± 1166.9 | 0.005 | 2187.9 ± 1320.5 | 2043.9 ± 1284.6 | 0.02 |
| Zinc (mg) | 9.5 ± 5.6 | 9.1 ± 7.8 | 0.20 | 8.1 ± 4.0 | 7.6 ± 4.1 | 0.002 |
| Vitamin A (μg RE) | 605.9 ± 406.6 | 584.4 ± 400.0 | 0.26 | 643.7 ± 462.8 | 614.2 ± 451.0 | 0.17 |
| Retinol (μg) | 236.3 ± 165.9 | 201.7 ± 122.9 | <0.0001 | 224.9 ± 149.5 | 189.6 ± 128.4 | <0.0001 |
| β-carotene (μg) | 2015.7 ± 1818.6 | 2103.1 ± 1886.1 | 0.32 | 2323.6 ± 2120.0 | 2350.9 ± 2080.7 | 0.78 |
| Vitamin B1 (mg) | 1.0 ± 0.5 | 0.9 ± 0.4 | <0.0001 | 1.0 ± 0.5 | 0.9 ± 0.5 | 0.0005 |
| Vitamin B2 (mg) | 1.3 ± 0.7 | 1.2 ± 0.6 | <0.0001 | 1.3 ± 0.7 | 1.1 ± 0.7 | <0.0001 |
| Vitamin B6 (mg) | 1.4 ± 0.8 | 1.3 ± 0.8 | 0.01 | 1.4 ± 0.8 | 1.3 ± 0.9 | 0.07 |
| Niacin (mg) | 12.1 ± 6.6 | 11.1 ± 6.7 | 0.001 | 12.0 ± 6.3 | 11.3 ± 7.7 | 0.05 |
| Vitamin C (mg) | 81.1 ± 68.9 | 77.7 ± 63.9 | 0.27 | 72.7 ± 66.8 | 70.9 ± 64.8 | 0.57 |
| Folate (μg) | 206.5 ± 123.6 | 196.3 ± 113.1 | 0.07 | 190.5 ± 118.1 | 185.5 ± 124.5 | 0.38 |
| Vitamin E (mg) | 11.3 ± 7.4 | 10.5 ± 7.1 | 0.02 | 12.9 ± 7.9 | 12.4 ± 9.5 | 0.30 |
| Cholesterol (mg) | 295.7 ± 175.4 | 270.5 ± 168.3 | 0.002 | 316.2 ± 196.3 | 283.2 ± 200.1 | 0.0006 |
| Total fatty acid (g) | 28.3 ± 16.8 | 25.2 ± 13.3 | <0.0001 | 33.1 ± 18.9 | 29.8 ± 19.4 | 0.0004 |
| SFA (g) | 13.5 ± 8.5 | 11.9 ± 6.8 | <0.0001 | 14.1 ± 8.6 | 12.2 ± 7.7 | <0.0001 |
| MUFA (g) | 9.5 ± 6.0 | 8.5 ± 4.5 | <0.0001 | 11.4 ± 6.5 | 10.3 ± 6.8 | 0.0005 |
| PUFA (g) | 5.2 ± 3.2 | 4.8 ± 2.8 | 0.006 | 7.5 ± 4.6 | 7.2 ± 5.7 | 0.23 |
| ω3 fatty acid (g) | 0.6 ± 0.4 | 0.5 ± 0.5 | 0.07 | 0.8 ± 0.5 | 0.8 ± 0.8 | 0.69 |
| ω6 fatty acid (g) | 4.6 ± 2.9 | 4.2 ± 2.5 | 0.004 | 6.3 ± 3.9 | 6.1 ± 4.7 | 0.22 |
| Model 2 (Energy-adjusted model) | ||||||
| Phase 1 (n = 1733) | Phase 2 (n = 1733) | |||||
| Boys (n = 882) | Girls (n = 851) | p | Boys (n = 882) | Girls (n = 851) | p | |
| Energy (kcal) | ||||||
| Protein (g) | 59.7 ± 8.8 | 59.6 ± 9.5 | 0.64 | 59.0 ± 8.5 | 59.2 ± 8.7 | 0.58 |
| Vegetable | 26.6 ± 4.9 | 27.0 ± 5.0 | 0.18 | 26.8 ± 4.8 | 27.7 ± 5.0 | <0.0001 |
| Animal | 32.7 ± 10.4 | 32.8 ± 11.2 | 0.92 | 32.2 ± 10.8 | 31.7 ± 10.2 | 0.36 |
| Fat (g) | 51.9 ± 12.6 | 52.7 ± 13.8 | 0.16 | 50.9 ± 13.3 | 50.4 ± 12.7 | 0.36 |
| Vegetable | 22.5 ± 6.9 | 23.2 ± 7.4 | 0.02 | 21.9 ± 7.0 | 22.2 ± 6.9 | 0.31 |
| Animal | 29.3 ± 9.6 | 29.4 ± 9.9 | 0.83 | 29.9 ± 10.6 | 29.1 ± 9.8 | 0.09 |
| Carbohydrate (g) | 245.1 ± 31.3 | 244.1 ± 33.9 | 0.55 | 244.5 ± 33.1 | 246.9 ± 31.6 | 0.12 |
| Fiber (g) | 3.4 ± 1.3 | 3.7 ± 1.4 | <0.0001 | 3.4 ± 0.9 | 3.6 ± 1.1 | <0.0001 |
| Calcium (mg) | 684.4 ± 666.0 | 681.1 ± 661.7 | 0.80 | 686.3 ± 296.4 | 686.3 ± 278.9 | 0.99 |
| Vegetable | 190.6 ± 70.9 | 201.9 ± 75.7 | 0.001 | 189.3 ± 66.8 | 204.6 ± 87.2 | <0.0001 |
| Animal | 494.8 ± 476.6 | 484.1 ± 465.7 | 0.41 | 503.3 ± 314.3 | 492.1 ± 287.1 | 0.44 |
| Phosphorus (mg) | 15.0 ± 4.9 | 15.7 ± 5.6 | 0.01 | 15.1 ± 5.6 | 16.0 ± 6.7 | 0.004 |
| Iron (mg) | 9.1 ± 1.7 | 9.4 ± 1.9 | 0.0004 | 9.1 ± 1.5 | 9.5 ± 1.8 | <0.0001 |
| Vegetable | 6.6 ± 1.5 | 6.9 ± 1.7 | 0.001 | 6.6 ± 1.5 | 7.0 ± 1.7 | <0.0001 |
| Animal | 2.4 ± 0.8 | 2.5 ± 0.9 | 0.14 | 2.4 ± 0.8 | 2.4 ± 0.8 | 0.48 |
| Sodium (mg) | 2761.4 ± 1147.4 | 2954.7 ± 1319.0 | 0.001 | 2753.2 ± 1020.2 | 1352.9 ± 1352.9 | 0.0004 |
| Potassium (mg) | 2209.1 ± 578.8 | 2294.9 ± 663.1 | 0.004 | 2213.4 ± 562.0 | 2294.2 ± 646.8 | 0.005 |
| Zinc (mg) | 9.0 ± 2.5 | 9.5 ± 5.8 | 0.009 | 8.9 ± 0.9 | 9.0 ± 1.0 | 0.007 |
| Vitamin A (μg RE) | 572.4 ± 249.6 | 619.4 ± 329.0 | 0.001 | 572.7 ± 247.4 | 611.8 ± 264.0 | 0.001 |
| Retinol (μg) | 221.9 ± 104.3 | 217.8 ± 98.7 | 0.40 | 227.8 ± 108.0 | 216.3 ± 105.9 | 0.02 |
| β-carotene (μg) | 1918.2 ± 1332.6 | 2192.3 ± 1520.6 | <0.0001 | 1855.8 ± 1199.7 | 2121.5 ± 1317.0 | <0.0001 |
| Vitamin B1 (mg) | 1.0 ± 0.1 | 1.0 ± 0.2 | 0.99 | 1.0 ± 0.2 | 1.0 ± 0.1 | 0.43 |
| Vitamin B2 (mg) | 1.3 ± 0.3 | 1.2 ± 0.3 | 0.72 | 1.3 ± 0.3 | 1.2 ± 0.3 | 0.12 |
| Vitamin B6 (mg) | 1.3 ± 0.3 | 1.4 ± 0.3 | 0.002 | 1.4 ± 0.3 | 1.4 ± 0.3 | 0.004 |
| Niacin (mg) | 11.4 ± 2.6 | 11.6 ± 2.6 | 0.22 | 11.4 ± 2.8 | 11.7 ± 2.6 | 0.07 |
| Vitamin C (mg) | 75.6 ± 72.3 | 81.4 ± 49.8 | 0.01 | 74.5 ± 42.9 | 82.4 ± 48.4 | 0.0004 |
| Folate (μg) | 195.4 ± 70.5 | 207.5 ± 73.9 | 0.0005 | 194.4 ± 66.0 | 209.0 ± 77.8 | <0.0001 |
| Vitamin E (mg) | 10.6 ± 3.8 | 11.1 ± 4.2 | 0.004 | 10.5 ± 3.5 | 10.9 ± 3.4 | 0.01 |
| Cholesterol (mg) | 283.9 ± 119.9 | 287.7 ± 126.6 | 0.52 | 291.3 ± 127.9 | 285.4 ± 117.9 | 0.31 |
| Total fatty acid (g) | 26.8 ± 9.0 | 27.1 ± 9.3 | 0.40 | 27.3 ± 9.8 | 26.8 ± 8.6 | 0.25 |
| SFA (g) | 12.8 ± 5.4 | 12.9 ± 5.5 | 0.82 | 13.0 ± 5.5 | 12.6 ± 5.2 | 0.08 |
| MUFA (g) | 9.0 ± 3.1 | 9.1 ± 3.1 | 0.35 | 9.2 ± 3.6 | 9.0 ± 2.9 | 0.18 |
| PUFA (g) | 4.9 ± 1.7 | 5.1 ± 1.8 | 0.02 | 5.0 ± 1.9 | 5.1 ± 1.8 | 0.21 |
| ω3 fatty acid (g) | 0.5 ± 0.2 | 0.6 ± 0.3 | 0.06 | 0.5 ± 0.2 | 0.6 ± 0.2 | 0.10 |
| ω6 fatty acid (g) | 4.4 ± 1.5 | 4.5 ± 1.6 | 0.03 | 4.5 ± 1.7 | 4.6 ± 1.6 | 0.22 |
| Phase 1 | Phase 2 | |||||
| Normal (n = 1497) | ADHD (n = 207) | p | Normal (n = 1571) | ADHD (n = 158) | p | |
| Mean ± SD | Mean ± SD | Mean ± SD | Mean ± SD | |||
| Energy (kcal) | 1674.7 ± 717.9 | 1652.5 ± 631.6 | 0.64 | 1657.5 ± 822.7 | 1905.9 ± 1087.3 | 0.005 |
| Protein (g) | 59.8 ± 28.7 | 57.8 ± 24.5 | 0.27 | 58.4 ± 31.8 | 66.3 ± 38.0 | 0.01 |
| Vegetable | 26.8 ± 11.8 | 25.8 ± 11.3 | 0.28 | 26.9 ± 14.0 | 29.6 ± 17.1 | 0.05 |
| Animal | 33.0 ± 20.2 | 31.9 ± 16.2 | 0.37 | 31.5 ± 20.8 | 36.7 ± 23.1 | 0.007 |
| Fat (g) | 52.5 ± 28.5 | 52.8 ± 25.7 | 0.85 | 50.1 ± 31.1 | 59.5 ± 38.8 | 0.003 |
| Vegetable | 23.0 ± 13.6 | 23.1 ± 13.2 | 0.91 | 21.9 ± 15.3 | 26.1 ± 20.2 | 0.01 |
| Animal | 29.4 ± 17.3 | 29.7 ± 15.7 | 0.81 | 28.1 ± 17.8 | 33.3 ± 21.1 | 0.003 |
| Carbohydrate (g) | 243.9 ± 104.3 | 239.3 ± 92.2 | 0.50 | 246.0 ± 119.4 | 279.6 ± 160.3 | 0.01 |
| Fiber (g) | 3.6 ± 2.1 | 3.3 ± 2.1 | 0.09 | 12.8 ± 7.8 | 13.6 ± 9.0 | 0.31 |
| Calcium (mg) | 688.5 ± 416.8 | 646.1 ± 405.2 | 0.16 | 613.0 ± 417.0 | 705.5 ± 612.6 | 0.06 |
| Vegetable | 197.6 ± 117.0 | 187.3 ± 115.8 | 0.23 | 187.5 ± 130.1 | 199.3 ± 169.5 | 0.39 |
| Animal | 490.9 ± 351.7 | 458.8 ± 347.1 | 0.21 | 425.5 ± 339.2 | 506.1 ± 477.7 | 0.03 |
| Phosphorus (mg) | 15.4 ± 8.8 | 14.7 ± 8.0 | 0.24 | 15.4 ± 10.5 | 16.5 ± 12.0 | 0.28 |
| Iron (mg) | 9.3 ± 4.6 | 8.9 ± 4.1 | 0.15 | 9.1 ± 5.0 | 10.0 ± 6.4 | 0.08 |
| Vegetable | 6.8 ± 3.4 | 6.4 ± 3.2 | 0.14 | 6.6 ± 3.7 | 7.1 ± 4.9 | 0.22 |
| Animal | 2.4 ± 1.5 | 2.4 ± 1.4 | 0.55 | 2.4 ± 1.6 | 2.8 ± 1.8 | 0.004 |
| Sodium (mg) | 2845.4 ± 1760.7 | 2738.8 ± 1631.8 | 0.41 | 2793.7 ± 1914.2 | 2985.2 ± 2000.0 | 0.23 |
| Potassium (mg) | 2274.7 ± 1228.6 | 2135.3 ± 1056.9 | 0.08 | 2101.3 ± 1259.7 | 2287.0 ± 1684.3 | 0.17 |
| Zinc (mg) | 9.3 ± 6.0 | 9.3 ± 10.9 | 0.97 | 7.8 ± 3.9 | 8.8 ± 5.3 | 0.02 |
| Vitamin A (μg RE) | 599.8 ± 400.1 | 567.4 ± 405.6 | 0.27 | 625.7 ± 448.9 | 666.7 ± 533.1 | 0.35 |
| Retinol (μg) | 219.9 ± 148.9 | 220.0 ± 133.5 | 0.99 | 203.2 ± 136.1 | 250.6 ± 173.1 | 0.001 |
| β-carotene (μg) | 2081.4 ± 1837.6 | 1889.5 ± 1870.1 | 0.16 | 2342.1 ± 2071.8 | 2299.8 ± 2383.9 | 0.83 |
| Vitamin B1 (mg) | 1.0 ± 0.5 | 1.0 ± 0.4 | 0.30 | 1.0 ± 0.5 | 1.1 ± 0.6 | 0.005 |
| Vitamin B2 (mg) | 1.3 ± 0.7 | 1.2 ± 0.6 | 0.23 | 1.2 ± 0.7 | 1.4 ± 0.9 | 0.01 |
| Vitamin B6 (mg) | 1.4 ± 0.8 | 1.3 ± 0.7 | 0.30 | 1.4 ± 0.9 | 1.5 ± 1.1 | 0.05 |
| Niacin (mg) | 11.6 ± 6.8 | 11.2 ± 5.4 | 0.34 | 11.5 ± 6.9 | 13.3 ± 8.3 | 0.01 |
| Vitamin C (mg) | 80.1 ± 67.4 | 74.9 ± 57.5 | 0.23 | 71.4 ± 63.8 | 76.2 ± 83.9 | 0.49 |
| Folate (μg) | 203.6 ± 119.4 | 186.0 ± 103.5 | 0.02 | 187.1 ± 118.4 | 198.2 ± 147.9 | 0.36 |
| Vitamin E (mg) | 10.9 ± 7.2 | 10.6 ± 6.5 | 0.45 | 12.5 ± 8.7 | 13.9 ± 9.3 | 0.06 |
| Cholesterol (mg) | 284.4 ± 172.9 | 276.9 ± 152.6 | 0.51 | 295.0 ± 197.5 | 345.2 ± 197.4 | 0.002 |
| Total fatty acid (g) | 26.8 ± 15.3 | 27.1 ± 14.6 | 0.84 | 31.1 ± 19.0 | 35.7 ± 21.1 | 0.008 |
| SFA (g) | 12.7 ± 7.8 | 12.9 ± 7.7 | 0.82 | 13.0 ± 8.0 | 15.2 ± 9.7 | 0.005 |
| MUFA (g) | 9.0 ± 5.4 | 9.2 ± 5.0 | 0.72 | 10.7 ± 6.7 | 12.4 ± 7.1 | 0.003 |
| PUFA (g) | 5.0 ± 3.0 | 4.9 ± 3.0 | 0.80 | 7.3 ± 5.2 | 8.1 ± 4.9 | 0.08 |
| ω3 fatty acid (g) | 0.6 ± 0.4 | 0.5 ± 0.4 | 0.84 | 0.8 ± 0.7 | 0.9 ± 0.6 | 0.27 |
| ω6 fatty acid (g) | 4.4 ± 2.7 | 4.4 ± 2.7 | 0.88 | 6.2 ± 4.3 | 6.8 ± 4.2 | 0.10 |
| NN (n = 1422) | YN (n = 125) | |||||||
|---|---|---|---|---|---|---|---|---|
| Phase 1 | Phase 2 | Phase 2–Phase 1 | p | Phase 1 | Phase 2 | Phase 2–Phase 1 | p | |
| Energy | 1664.4 ± 709.9 | 1650.9 ± 835. | −13.5 ± 888.9 | 0.567 | 1585.3 ± 613.9 | 1735.6 ± 627.6 | 150.3 ± 702.0 | 0.018 ** |
| Energy-adjusted | ||||||||
| Protein (g) | 59.7 ± 9.0 | 59.3 ± 8.3 | 0.4 ± 10.5 | 0.09 | 58.6 ± 10.1 | 57.8 ± 9.2 | 0.7 ± 11.3 | 0.43 |
| Vegetable | 26.9 ± 4.9 | 27.3 ± 4.9 | −0.4 ± 5.7 | 0.002 ** | 26.3 ± 5.5 | 27.6 ± 5.1 | −1.2 ± 6.3 | 0.03 ** |
| Animal | 32.9 ± 10.7 | 32.1 ± 10.3 | 0.7 ± 12.8 | 0.02 ** | 32.3 ± 11.5 | 30.2 ± 11.4 | 2.0 ± 13.2 | 0.08 |
| Fat (g) | 52.4 ± 13.0 | 50.6 ± 13.0 | 1.7 ± 16.6 | <0.0001 *** | 52.8 ± 14.5 | 49.7 ± 14.2 | 3.0 ± 18.7 | 0.06 |
| Vegetable | 22.9 ± 7.1 | 21.9 ± 6.8 | 0.9 ± 8.8 | <0.0001 *** | 23.2 ± 8.2 | 22.5 ± 8.5 | 0.7 ± 10.9 | 0.42 |
| Animal | 29.4 ± 9.7 | 29.6 ± 10.3 | −0.2 ± 12.2 | 0.50 | 29.4 ± 10.1 | 28.1 ± 11.2 | 1.3 ± 13.0 | 0.26 |
| Carbohydrate (g) | 244.3 ± 32.1 | 245.8 ± 32.3 | −1.4 ± 40.3 | 0.16 | 244.7 ± 35.5 | 248.1 ± 35.1 | −3.4 ± 44.0 | 0.38 |
| Fiber (g) | 3.6 ± 1.3 | 3.5 ± 1.0 | 0.07 ± 1.3 | 0.04 | 3.4 ± 1.5 | 3.3 ± 1.0 | 0.08 ± 1.6 | 0.57 |
| Calcium (mg) | 691.6 ± 281.2 | 694.2 ± 290.0 | −2.5 ± 347.7 | 0.77 | 644.8 ± 283.2 | 623.6 ± 256.1 | 21.2 ± 325.5 | 0.46 |
| Vegetable | 198.0 ± 73.2 | 198.7 ± 69.1 | −0.6 ± 84.2 | 0.77 | 192.6 ± 85.9 | 186.6 ± 79.5 | 5.9 ± 100.3 | 0.50 |
| Animal | 496.2 ± 272.6 | 505.0 ± 308.1 | −9.2 ± 354.8 | 0.32 | 454.1 ± 279.7 | 439.5 ± 250.5 | 14.5 ± 319.2 | 0.61 |
| Phosphorus (mg) | 15.4 ± 5.1 | 15.7 ± 6.1 | −0.2 ± 7.0 | 0.25 | 15.5 ± 6.7 | 14.9 ± 5.8 | 0.6 ± 7.5 | 0.34 |
| Iron (mg) | 9.3 ± 1.8 | 9.3 ± 1.6 | −0.009 ± 2.0 | 0.85 | 9.0 ± 1.9 | 9.0 ± 1.7 | −0.001 ± 2.1 | 0.99 |
| Vegetable | 6.8 ± 1.6 | 6.8 ± 1.5 | −0.02 ± 1.8 | 0.59 | 6.6 ± 1.7 | 6.6 ± 1.6 | −0.05 ± 2.0 | 0.74 |
| Animal | 2.4 ± 0.8 | 2.4 ± 0.7 | 0.005 ± 1.0 | 0.85 | 2.4 ± 0.9 | 2.3 ± 0.9 | 0.06 ± 1.0 | 0.50 |
| Sodium (mg) | 2871.0 ± 1214.8 | 2869.1 ± 1087.7 | 1.8 ± 1395.2 | 0.96 | 2966.5 ± 1583.1 | 2751.2 ± 1132.6 | 215.3 ± 1664.5 | 0.15 |
| Potassium (mg) | 2276.8 ± 626.3 | 2276.6 ± 572.1 | 0.2 ± 716.3 | 0.99 | 2187.5 ± 636.8 | 2130.9 ± 603.2 | 56.6 ± 769.8 | 0.41 |
| Zinc (mg) | 9.2 ± 3.3 | 9.0 ± 0.9 | 0.2 ± 3.3 | 0.004 ** | 8.8 ± 2.5 | 8.6 ± 0.9 | 0.1 ± 2.5 | 0.50 |
| Vitamin A (μg RE) | 604.2 ± 298.6 | 598.1 ± 253.3 | 6.3 ± 343.4 | 0.48 | 568.9 ± 287.5 | 559.7 ± 241.6 | 9.1 ± 316.9 | 0.74 |
| Retinol (μg) | 220.0 ± 98.9 | 221.5 ± 106.5 | −1.4 ± 120.0 | 0.65 | 216.3 ± 101.7 | 217.5 ± 111.9 | −1.2 ± 126.7 | 0.91 |
| β-carotene (μg) | 2100.0 ± 1461.4 | 2021.4 ± 1225.1 | 79.4 ± 1620.6 | 0.06 | 1925.5 ± 1459.6 | 1844.6 ± 1265.6 | 80.9 ± 1614.5 | 0.57 |
| Vitamin B1 (mg) | 1.0 ± 0.1 | 1.0 ± 0.1 | −0.002 ± 0.2 | 0.75 | 1.0 ± 0.1 | 1.0 ± 0.1 | 0.002 ± 0.2 | 0.90 |
| Vitamin B2 (mg) | 1.3 ± 0.3 | 1.3 ± 0.3 | 0.002 ± 0.4 | 0.86 | 1.2 ± 0.4 | 1.2 ± 0.3 | 0.03 ± 0.4 | 0.43 |
| Vitamin B6 (mg) | 1.4 ± 0.3 | 1.4 ± 0.3 | −0.008 ± 0.4 | 0.46 | 1.4 ± 0.3 | 1.3 ± 0.4 | 0.02 ± 0.5 | 0.59 |
| Niacin (mg) | 11.5 ± 2.5 | 11.6 ± 2.6 | −0.06 ± 3.2 | 0.45 | 11.4 ± 2.7 | 11.3 ± 2.5 | 0.07 ± 3.2 | 0.79 |
| Vitamin C (mg) | 79.7 ± 51.7 | 79.8 ± 44.4 | −0.04 ± 58.8 | 0.97 | 74.1 ± 46.8 | 71.2 ± 46.5 | 2.8 ± 62.2 | 0.60 |
| Folate (μg) | 204.2 ± 72.8 | 204.2 ± 68.5 | 0.01 ± 81.2 | 0.99 | 191.7 ± 74.4 | 189.4 ± 66.6 | 2.2 ± 88.0 | 0.77 |
| Vitamin E (mg) | 10.9 ± 3.9 | 10.8 ± 3.4 | 0.1 ± 4.5 | 0.26 | 10.6 ± 4.2 | 10.3 ± 4.0 | 0.2 ± 5.3 | 0.58 |
| Cholesterol (mg) | 286.7 ± 124.7 | 286.8 ± 116.5 | −0.03 ± 140.1 | 0.99 | 280.8 ± 121.1 | 285.4 ± 141.5 | −4.6 ± 156.8 | 0.74 |
| Total fatty acid (g) | 27.1 ± 9.1 | 27.3 ± 9.4 | −0.1 ± 11.8 | 0.55 | 26.4 ± 9.4 | 25.6 ± 9.1 | 0.8 ± 11.9 | 0.41 |
| SFA (g) | 12.9 ± 5.4 | 12.9 ± 5.5 | 0.01 ± 6.8 | 0.92 | 12.4 ± 5.2 | 12.0 ± 5.3 | 0.4 ± 6.7 | 0.49 |
| MUFA (g) | 9.1 ± 3.0 | 9.2 ± 3.4 | −0.1 ± 4.2 | 0.30 | 9.0 ± 3.4 | 8.6 ± 3.0 | 0.3 ± 4.1 | 0.29 |
| PUFA (g) | 5.0 ± 1.7 | 5.1 ± 1.8 | −0.08 ± 2.2 | 0.15 | 4.9 ± 1.9 | 4.8 ± 2.0 | 0.1 ± 2.4 | 0.59 |
| ω3 fatty acid (g) | 0.6 ± 0.2 | 0.6 ± 0.2 | −0.01 ± 0.3 | 0.18 | 0.5 ± 0.3 | 0.5 ± 0.2 | 0.009 ± 0.3 | 0.78 |
| ω6 fatty acid (g) | 4.5 ± 1.5 | 4.5 ± 1.7 | −0.08 ± 2.0 | 0.11 | 4.4 ± 1.8 | 4.3 ± 1.8 | 0.1 ± 2.2 | 0.51 |
| NY (n = 72) | YY (n = 82) | |||||||
| Phase 1 | Phase 2 | Phase 2–Phase 1 | p | Phase 1 | Phase 2 | Phase 2–Phase 1 | p | |
| Energy | 1851.1 ± 841.7 | 1917.2 ± 1301.1 | 66.1 ± 1409.9 | 0.692 | 1755.0 ± 648.3 | 1919.3 ± 874.6 | 164.3 ± 893.8 | 0.100 |
| Energy-adjusted | ||||||||
| Protein (g) | 59.1 ± 9.6 | 58.4 ± 9.6 | 0.6 ± 10.1 | 0.57 | 58.3 ± 8.1 | 58.8 ± 8.1 | −0.4 ± 9.9 | 0.65 |
| Vegetable | 26.7 ± 5.5 | 26.4 ± 4.4 | 0.2 ± 6.5 | 0.76 | 25.9 ± 5.0 | 26.2 ± 4.3 | −0.3 ± 6.0 | 0.62 |
| Animal | 32.7 ± 10.5 | 31.9 ± 11.7 | 0.7 ± 12.5 | 0.62 | 32.5 ± 9.2 | 32.5 ± 9.6 | −0.04 ± 12.7 | 0.97 |
| Fat (g) | 51.1 ± 13.5 | 50.4 ± 12.1 | 0.7 ± 16.2 | 0.71 | 54.2 ± 11.7 | 52.7 ± 10.6 | 1.4 ± 14.0 | 0.36 |
| Vegetable | 22.4 ± 6.9 | 22.1 ± 6.7 | 0.3 ± 9.6 | 0.77 | 23.3 ± 6.7 | 22.9 ± 7.0 | 0.4 ± 7.5 | 0.59 |
| Animal | 29.0 ± 9.0 | 29.1 ± 9.3 | −0.1 ± 10.9 | 0.89 | 30.7 ± 8.7 | 30.7 ± 8.5 | −0.004 ± 11.6 | 0.99 |
| Carbohydrate (g) | 245.9 ± 34.8 | 244.8 ± 32.2 | 1.1 ± 41.5 | 0.82 | 241.0 ± 27.0 | 240.3 ± 27.3 | 0.7 ± 34.9 | 0.85 |
| Fiber (g) | 3.3 ± 1.1 | 3.2 ± 0.8 | 0.1 ± 1.3 | 0.40 | 3.4 ± 1.3 | 3.3 ± 0.8 | 0.09 ± 1.2 | 0.49 |
| Calcium (mg) | 672.4 ± 302.3 | 664.4 ± 267.6 | 7.9 ± 350.2 | 0.84 | 665.1 ± 269.3 | 664.0 ± 269.5 | 1.1 ± 334.9 | 0.97 |
| Vegetable | 182.4 ± 70.2 | 171.9 ± 57.0 | 10.4 ± 81.9 | 0.28 | 188.6 ± 57.3 | 181.1 ± 50.4 | 7.4 ± 59.9 | 0.26 |
| Animal | 498.1 ± 290.8 | 498.1 ± 280.3 | 0.08 ± 369.3 | 0.99 | 477.3 ± 269.4 | 483.6 ± 270.7 | −6.3 ± 335.1 | 0.86 |
| Phosphorus (mg) | 14.6 ± 5.1 | 13.7 ± 3.4 | 0.9 ± 5.7 | 0.16 | 14.3 ± 4.0 | 15.0 ± 4.5 | −0.6 ± 5.7 | 0.33 |
| Iron (mg) | 8.9 ± 1.7 | 8.9 ± 1.3 | 0.06 ± 1.9 | 0.77 | 8.9 ± 1.7 | 8.8 ± 1.3 | 0.1 ± 1.8 | 0.59 |
| Vegetable | 6.5 ± 1.5 | 6.3 ± 1.3 | 0.2 ± 1.7 | 0.32 | 6.4 ± 1.3 | 6.3 ± 1.3 | 0.09 ± 1.4 | 0.56 |
| Animal | 2.4 ± 0.8 | 2.5 ± 1.0 | −0.1 ± 1.0 | 0.38 | 2.5 ± 1.3 | 2.4 ± 0.8 | 0.03 ± 1.3 | 0.83 |
| Sodium (mg) | 2700.7 ± 1182.0 | 2539.3 ± 843.4 | 161.4 ± 1362.0 | 0.31 | 2662.0 ± 959.6 | 2722.1 ± 797.0 | −60.0 ± 1099.4 | 0.62 |
| Potassium (mg) | 2102.2 ± 466.5 | 2059.0 ± 454.8 | 43.1 ± 507.6 | 0.47 | 2145.4 ± 517.7 | 2145.0 ± 464.9 | 0.4 ± 659.1 | 0.99 |
| Zinc (mg) | 8.9 ± 2.3 | 8.8 ± 1.0 | 0.1 ± 2.2 | 0.52 | 10.2 ± 14.4 | 8.7 ± 1.0 | 1.5 ± 14.4 | 0.34 |
| Vitamin A (μg RE) | 531.3 ± 214.4 | 511.6 ± 161.7 | 17.4 ± 226.0 | 0.51 | 575.5 ± 244.3 | 575.8 ± 309.3 | −0.2 ± 309.7 | 0.99 |
| Retinol (μg) | 225.5 ± 139.0 | 227.3 ± 91.8 | −2.8 ± 126.0 | 0.85 | 230.6 ± 96.4 | 242.5 ± 125.9 | −11.9 ± 153.9 | 0.48 |
| β-carotene (μg) | 1664.1 ± 969.1 | 1512.4 ± 707.8 | 143.9 ± 1011.3 | 0.23 | 1897.8 ± 1252.5 | 1811.9 ± 1584.7 | 85.9 ± 1437.5 | 0.58 |
| Vitamin B1 (mg) | 1.0 ± 0.2 | 1.0 ± 0.1 | 0.03 ± 0.2 | 0.21 | 1.0 ± 0.1 | 1.0 ± 0.2 | −0.06 ± 0.31 | 0.05 ** |
| Vitamin B2 (mg) | 1.2 ± 0.4 | 1.2 ± 0.2 | 0.02 ± 0.4 | 0.63 | 1.2 ± 0.3 | 1.3 ± 0.3 | −0.07 ± 0.4 | 0.14 |
| Vitamin B6 (mg) | 1.3 ± 0.3 | 1.3 ± 0.2 | 0.03 ± 0.3 | 0.37 | 1.4 ± 0.3 | 1.4 ± 0.3 | −0.01 ± 0.4 | 0.76 |
| Niacin (mg) | 11.2 ± 3.2 | 11.1 ± 2.3 | 0.1 ± 2.9 | 0.61 | 11.2 ± 2.5 | 11.8 ± 3.4 | −0.5 ± 4.1 | 0.26 |
| Vitamin C (mg) | 67.1 ± 32.0 | 61.8 ± 29.9 | 5.1 ± 36.6 | 0.24 | 77.2 ± 45.7 | 72.5 ± 32.8 | 4.6 ± 53.7 | 0.43 |
| Folate (μg) | 184.4 ± 60.8 | 183.2 ± 58.1 | 1.1 ± 64.5 | 0.87 | 188.4 ± 62.8 | 184.4 ± 53.5 | 3.9 ± 70.4 | 0.60 |
| Vitamin E (mg) | 10.2 ± 4.1 | 10.1 ± 3.3 | 0.1 ± 4.9 | 0.85 | 11.0 ± 4.8 | 10.4 ± 3.0 | 0.5 ± 5.7 | 0.37 |
| Cholesterol (mg) | 294.5 ± 126.6 | 317.0 ± 157.4 | −24.3 ± 145.4 | 0.16 | 280.4 ± 99.0 | 292.6 ± 123.2 | −12.1 ± 122.2 | 0.37 |
| Total fatty acid (g) | 26.5 ± 9.8 | 26.2 ± 8.7 | 0.2 ± 11.9 | 0.84 | 28.5 ± 8.2 | 27.3 ± 7.2 | 0.8 ± 11.0 | 0.48 |
| SFA (g) | 12.7 ± 5.8 | 12.4 ± 4.4 | 0.2 ± 6.6 | 0.70 | 13.7 ± 5.2 | 13.0 ± 4.3 | 0.6 ± 6.4 | 0.35 |
| MUFA (g) | 9.0 ± 3.4 | 8.9 ± 3.0 | 0.07 ± 4.2 | 0.87 | 9.4 ± 2.6 | 9.3 ± 2.5 | 0.1 ± 3.7 | 0.7 |
| PUFA (g) | 4.7 ± 1.8 | 4.8 ± 1.8 | −0.07 ± 2.4 | 0.78 | 5.0 ± 1.7 | 4.9 ± 1.5 | 0.07 ± 2.2 | 0.75 |
| ω3 fatty acid (g) | 0.5 ± 0.3 | 0.5 ± 0.2 | 0.02 ± 0.3 | 0.64 | 0.6 ± 0.2 | 0.5 ± 0.2 | 0.03 ± 0.3 | 0.37 |
| ω6 fatty acid (g) | 4.2 ± 1.6 | 4.2 ± 1.6 | −0.05 ± 2.1 | 0.82 | 4.5 ± 1.6 | 4.4 ± 1.4 | 0.1 ± 2.0 | 0.63 |
| Combined (2) | Inattention (2) | Hyperactivity (2) | ||||||||||
|---|---|---|---|---|---|---|---|---|---|---|---|---|
| β | SE | p-Value | β | SE | p-Value | β | SE | p-Value | ||||
| Protein (g) (3) | 3.39 | ± | 11.16 | 0.761 | 6.51 | ± | 6.71 | 0.332 | −0.86 | ± | 5.66 | 0.879 |
| Vegetable | −26.29 | ± | 21.03 | 0.212 | −22.64 | ± | 12.64 | 0.074 * | −5.22 | ± | 10.66 | 0.625 |
| Animal | 7.97 | ± | 9.59 | 0.406 | 9.51 | ± | 5.76 | 0.099 * | 0.45 | ± | 4.86 | 0.927 |
| Fat (g) | 11.67 | ± | 8.62 | 0.176 | 10.25 | ± | 5.17 | 0.048 ** | 2.66 | ± | 4.37 | 0.543 |
| Vegetable | 18.65 | ± | 14.37 | 0.194 | 12.77 | ± | 8.63 | 0.139 | 5.21 | ± | 7.29 | 0.474 |
| Animal | 8.48 | ± | 11.27 | 0.452 | 9.67 | ± | 6.77 | 0.154 | 1.34 | ± | 5.71 | 0.814 |
| Carbohydrate (g) | −3.62 | ± | 3.28 | 0.270 | −3.37 | ± | 1.97 | 0.088 * | −0.84 | ± | 1.66 | 0.614 |
| Fiber (g) | −4.28 | ± | 29.33 | 0.884 | 0.78 | ± | 17.62 | 0.965 | −7.23 | ± | 14.87 | 0.627 |
| Calcium (mg) | −0.65 | ± | 0.43 | 0.131 | −0.21 | ± | 0.26 | 0.412 | −0.41 | ± | 0.22 | 0.057 * |
| Vegetable | −1.69 | ± | 1.54 | 0.273 | −0.69 | ± | 0.93 | 0.458 | −0.97 | ± | 0.78 | 0.216 |
| Animal | −0.52 | ± | 0.43 | 0.224 | −0.16 | ± | 0.26 | 0.535 | −0.34 | ± | 0.22 | 0.116 |
| Phosphorus (mg) | −0.58 | ± | 0.60 | 0.337 | −0.05 | ± | 0.36 | 0.888 | −0.46 | ± | 0.30 | 0.131 |
| Iron (mg) | −97.53 | ± | 61.84 | 0.115 | −42.69 | ± | 37.17 | 0.251 | −47.39 | ± | 31.37 | 0.131 |
| Vegetable | −125.07 | ± | 66.58 | 0.061 * | −80.61 | ± | 40.03 | 0.044 ** | −45.29 | ± | 33.79 | 0.180 |
| Animal | 37.46 | ± | 118.08 | 0.751 | 97.38 | ± | 70.95 | 0.170 | −30.35 | ± | 59.84 | 0.612 |
| Sodium (mg) | 0.00 | ± | 0.10 | 0.979 | 0.03 | ± | 0.06 | 0.608 | −0.02 | ± | 0.05 | 0.637 |
| Potassium (mg) | −0.12 | ± | 0.20 | 0.547 | 0.00 | ± | 0.12 | 0.970 | −0.11 | ± | 0.10 | 0.263 |
| Zinc (mg) | −56.55 | ± | 24.65 | 0.022 ** | −23.13 | ± | 14.83 | 0.119 | −33.79 | ± | 12.49 | 0.007 ** |
| Vitamin A (μg RE) | −0.47 | ± | 0.40 | 0.239 | −0.17 | ± | 0.24 | 0.490 | −0.28 | ± | 0.20 | 0.169 |
| Retinol (μg) | 0.39 | ± | 1.10 | 0.725 | 0.61 | ± | 0.66 | 0.358 | −0.05 | ± | 0.56 | 0.926 |
| β-carotene (μg) | −0.10 | ± | 0.07 | 0.177 | −0.05 | ± | 0.04 | 0.300 | −0.05 | ± | 0.04 | 0.155 |
| Vitamin B1 (mg) | 191.22 | ± | 520.76 | 0.714 | 226.78 | ± | 312.73 | 0.469 | −16.35 | ± | 264.10 | 0.951 |
| Vitamin B2 (mg) | −116.69 | ± | 300.09 | 0.697 | 72.34 | ± | 180.25 | 0.688 | −166.18 | ± | 152.13 | 0.275 |
| Vitamin B6 (mg) | 92.33 | ± | 293.33 | 0.753 | 160.48 | ± | 176.19 | 0.363 | −23.65 | ± | 148.76 | 0.874 |
| Niacin (mg) | 31.81 | ± | 33.01 | 0.335 | 21.59 | ± | 19.84 | 0.277 | 13.35 | ± | 16.74 | 0.425 |
| Vitamin C (mg) | −0.21 | ± | 2.35 | 0.929 | 0.60 | ± | 1.41 | 0.669 | −0.72 | ± | 1.19 | 0.548 |
| Folate (μg) | −1.51 | ± | 1.70 | 0.373 | −0.83 | ± | 1.02 | 0.415 | −0.59 | ± | 0.86 | 0.494 |
| Vitamin E (mg) | 1.93 | ± | 25.05 | 0.939 | 8.46 | ± | 15.05 | 0.574 | −2.75 | ± | 12.70 | 0.829 |
| Cholesterol (mg) | 0.56 | ± | 0.94 | 0.551 | 0.78 | ± | 0.56 | 0.166 | 0.03 | ± | 0.48 | 0.954 |
| Total fatty acid (g) | 6.10 | ± | 11.17 | 0.585 | 4.76 | ± | 6.71 | 0.478 | 3.85 | ± | 5.66 | 0.496 |
| SFA (g) | −4.93 | ± | 20.67 | 0.812 | 0.87 | ± | 12.42 | 0.944 | −2.65 | ± | 10.47 | 0.800 |
| MUFA (g) | 30.79 | ± | 30.60 | 0.315 | 18.25 | ± | 18.38 | 0.321 | 19.81 | ± | 15.50 | 0.202 |
| PUFA (g) | 54.31 | ± | 44.50 | 0.223 | 32.81 | ± | 26.74 | 0.220 | 31.46 | ± | 22.55 | 0.163 |
| ω3 fatty acid (g) | −5.77 | ± | 261.83 | 0.982 | 32.17 | ± | 157.35 | 0.838 | 14.40 | ± | 132.74 | 0.914 |
| ω6 fatty acid (g) | 53.42 | ± | 52.47 | 0.309 | 30.17 | ± | 31.53 | 0.339 | 34.10 | ± | 26.59 | 0.200 |
Publisher’s Note: MDPI stays neutral with regard to jurisdictional claims in published maps and institutional affiliations. |
© 2022 by the authors. Licensee MDPI, Basel, Switzerland. This article is an open access article distributed under the terms and conditions of the Creative Commons Attribution (CC BY) license (https://creativecommons.org/licenses/by/4.0/).
Share and Cite
Ryu, S.-a.; Choi, Y.-J.; An, H.; Kwon, H.-J.; Ha, M.; Hong, Y.-C.; Hong, S.-J.; Hwang, H.-J. Associations between Dietary Intake and Attention Deficit Hyperactivity Disorder (ADHD) Scores by Repeated Measurements in School-Age Children. Nutrients 2022, 14, 2919. https://doi.org/10.3390/nu14142919
Ryu S-a, Choi Y-J, An H, Kwon H-J, Ha M, Hong Y-C, Hong S-J, Hwang H-J. Associations between Dietary Intake and Attention Deficit Hyperactivity Disorder (ADHD) Scores by Repeated Measurements in School-Age Children. Nutrients. 2022; 14(14):2919. https://doi.org/10.3390/nu14142919
Chicago/Turabian StyleRyu, Su-a, Yean-Jung Choi, Hyojin An, Ho-Jang Kwon, Mina Ha, Yun-Chul Hong, Soo-Jong Hong, and Hyo-Jeong Hwang. 2022. "Associations between Dietary Intake and Attention Deficit Hyperactivity Disorder (ADHD) Scores by Repeated Measurements in School-Age Children" Nutrients 14, no. 14: 2919. https://doi.org/10.3390/nu14142919
APA StyleRyu, S.-a., Choi, Y.-J., An, H., Kwon, H.-J., Ha, M., Hong, Y.-C., Hong, S.-J., & Hwang, H.-J. (2022). Associations between Dietary Intake and Attention Deficit Hyperactivity Disorder (ADHD) Scores by Repeated Measurements in School-Age Children. Nutrients, 14(14), 2919. https://doi.org/10.3390/nu14142919