
Weekend–Weekday Differences in Adherence to the Mediterranean Diet among Spanish University Students


Abstract
:1. Introduction
2. Materials and Methods
2.1. Participant Recruitment
- The objectives and participation in the study: to participate, interested students had to send an email to the address provided for the study;
- Inclusion criteria: over the age of 18; no chronic pathologies, food intolerances or pregnancy (situations that could require specialized dietary recommendations); be a student at the Faculties of Medicine or Pharmacy (University of Seville); and possess a mobile telephone with Internet access and an iOS or Android operating system;
- How the e-12HR app works.
- Informed consent: the student had to sign and return it to the same e-mail address;
- An initial document with personal information (date of birth, gender, center of study, height, weight, smoking status): the student must complete and return to the same e-mail address;
- Their assigned personal alphanumeric code;
- The method for downloading the e-12HR app: the app is free to download in the Apple Store (for iOS operating systems) or the Play Store (for devices with the Android operating system);
- A user manual with detailed information for using the e-12HR app.
2.2. e-12HR App
2.3. Usability Rating Questionnaire for e-12HR
2.4. Adherence to Mediterranean Diet (AMD) Assessment
- Specific food groups (compatible with the MD);
- Recommendations for consumption frequency for standard servings (per meal, daily or weekly);
- A numerical score assigned to each item (Appendix A, Table A3).
- Fruits contribute 1 point for 1 to 2 servings, 2 points for 2 to 3 servings, and 3 points for 3–6 servings per day.
- Vegetables contribute 1 point for 2 to 4 servings, 2 points for 4 to 6 servings, and 3 points for ≥6 servings per day.
- Cereals contribute 1 point for 1 to 2 servings, 2 points for 2 to 3 servings, and 3 points for 3–6 servings per day.
- Olive oil contributes 1 point for 1 to 2 serving, 2 points for 2 to 3 servings, and 3 points for 3–4 servings per day.
- Milk and dairy products contribute 1 point for 1 to 2 servings and 2 points for 2–3 servings per day.
- Nuts contribute 2 points for 1–2 servings per day.
2.5. Statistical Analysis
3. Results
3.1. Database
3.2. Scores and Levels of the AMD Index
3.3. Stratification of AMD Items (Food Groups)
3.4. Usability Rating Questionnaire for e-12HR
4. Discussion
Future Research Related to the Current Study
5. Conclusions
Funding
Institutional Review Board Statement

Informed Consent Statement
Data Availability Statement
Acknowledgments
Conflicts of Interest
Appendix A

| Questions About Food Groups: |
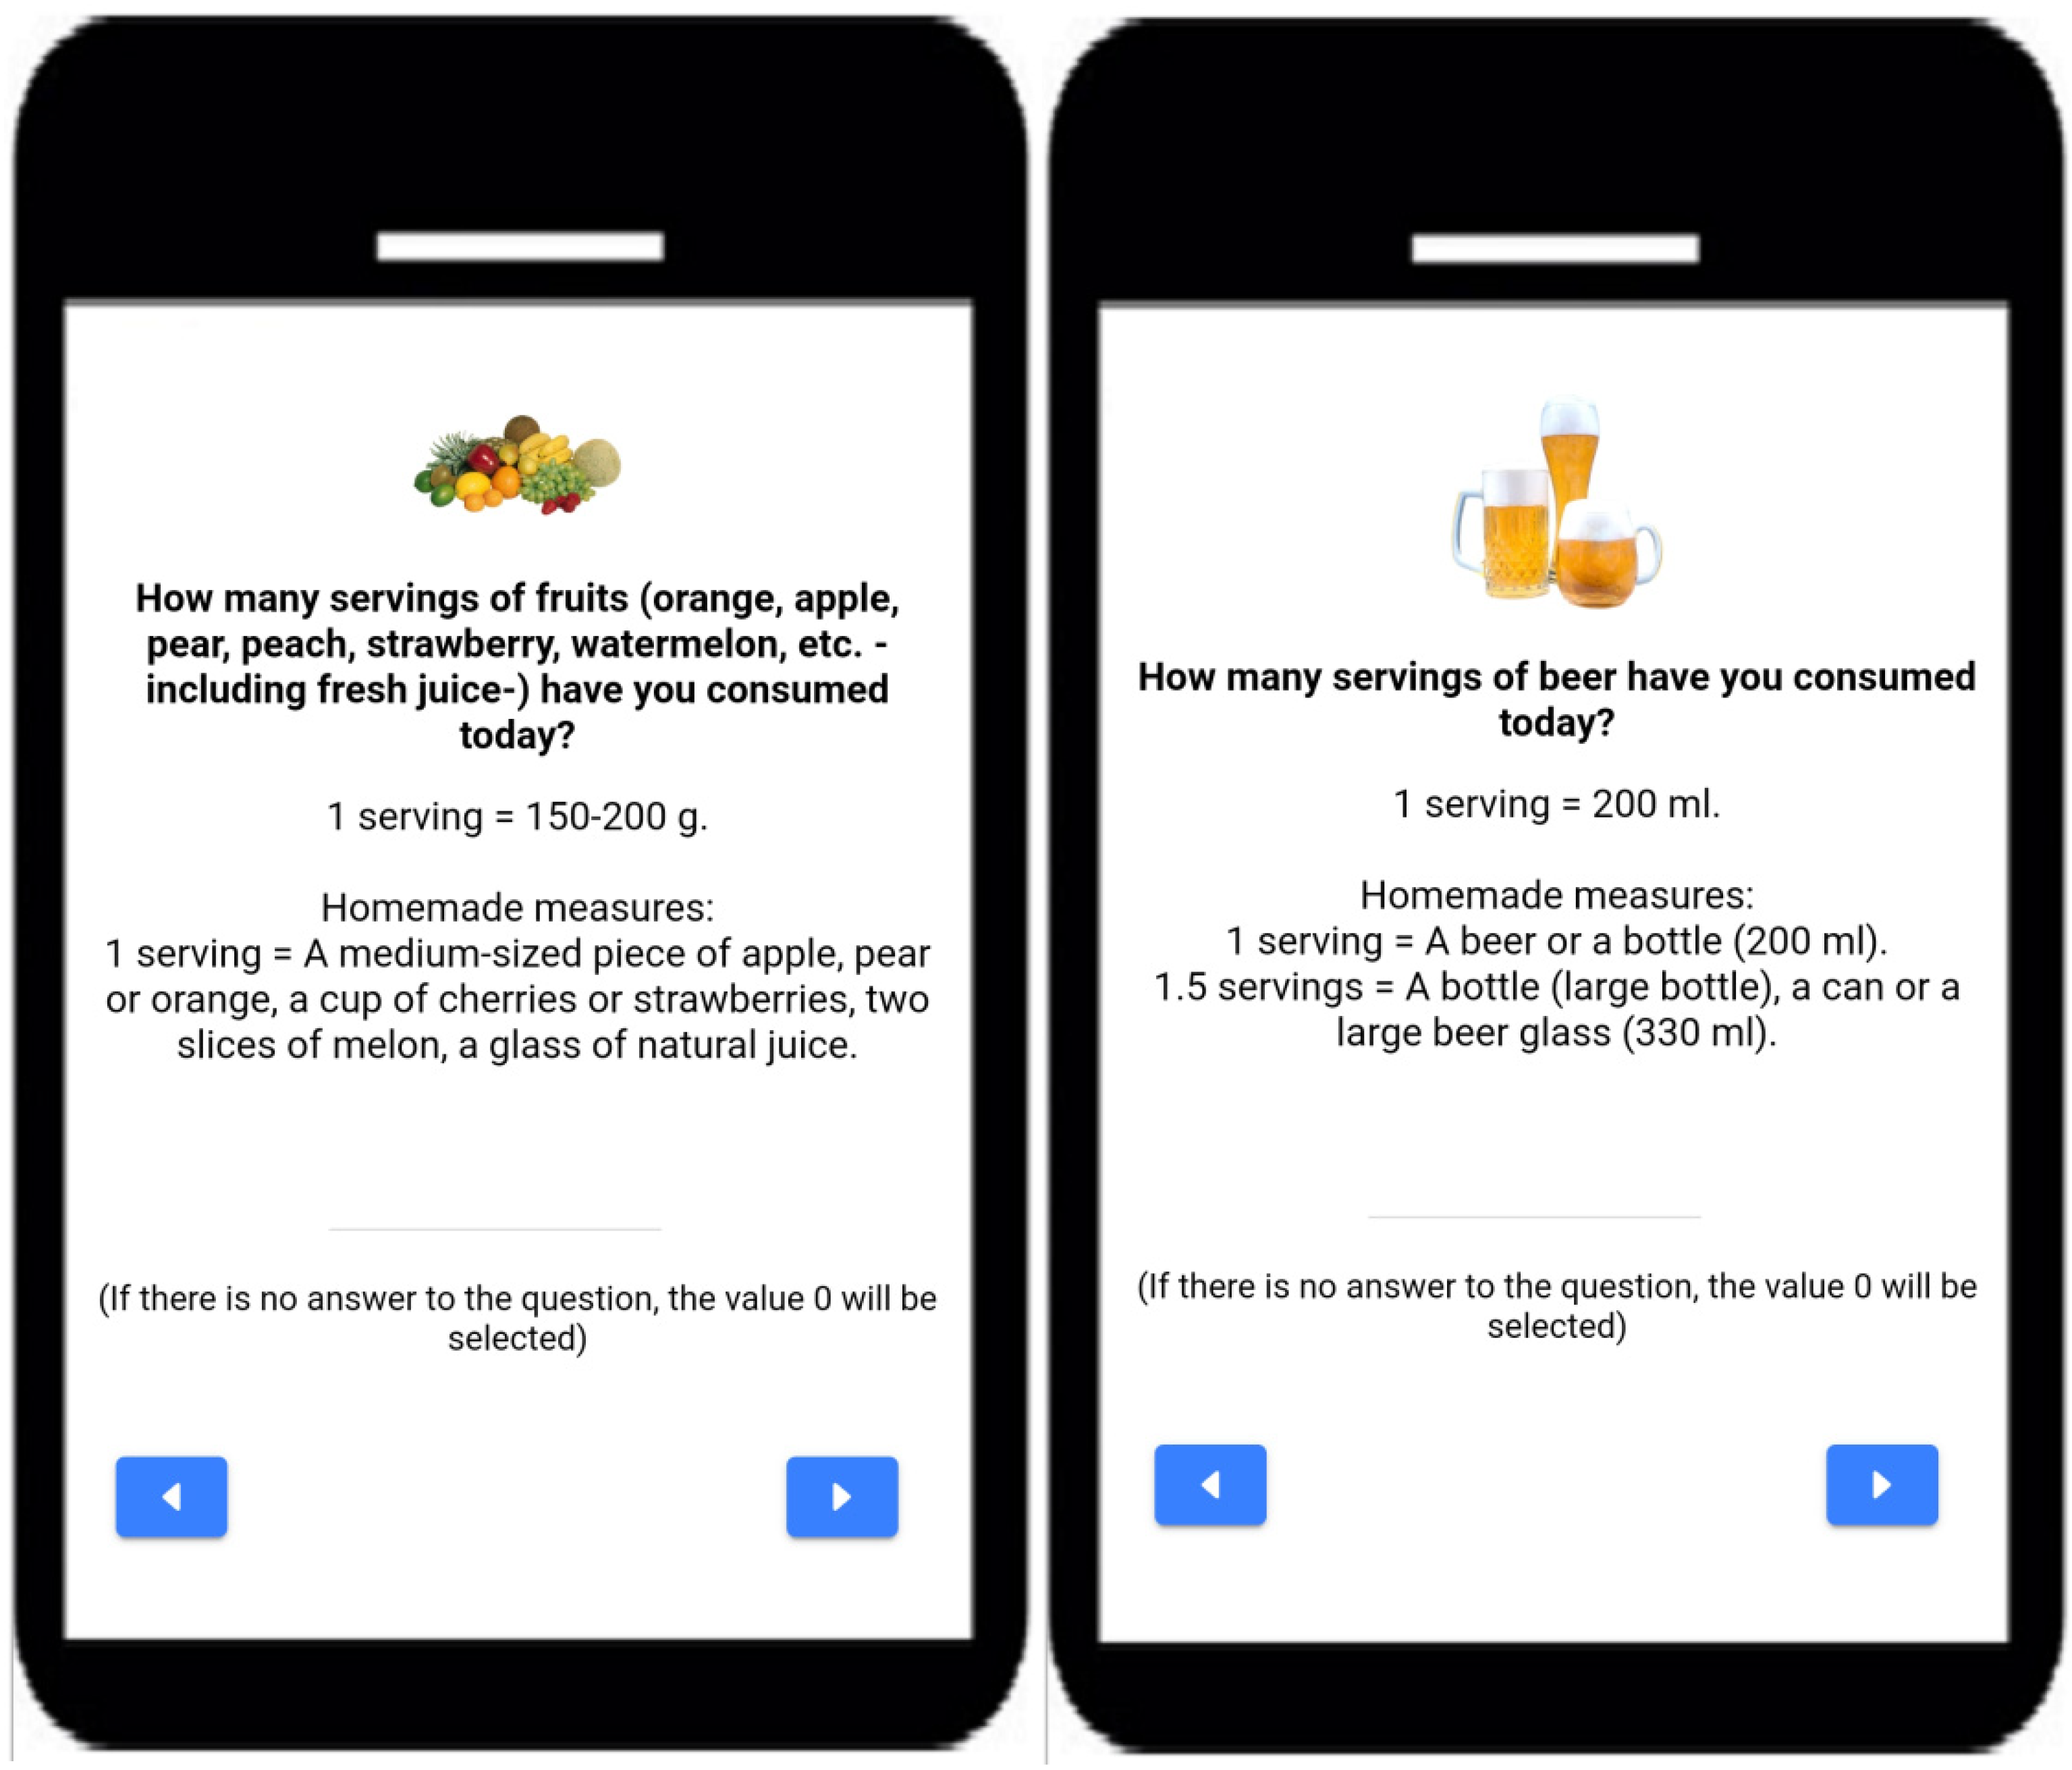
| 1. How many servings of fruits (orange, apple, pear, peach, strawberry, watermelon, etc., including fresh juice) have you consumed today? 1 serving = 150–200 g. Homemade measures: 1 serving = A medium-sized piece of apple, pear or orange, a cup of cherries or strawberries, two slices of melon, a glass of natural juice. |
| 2. How many servings of vegetables (tomato, carrot, bell pepper, lettuce, zucchini, etc.) have you consumed today? 1 serving = 150–250 g. Homemade measures: 1 serving = One normal single plate of salad, one normal single plate of cooked vegetables, one large tomato, two carrots. |
| 3. How many servings of breakfast cereals have you consumed today? 1 serving = 20–30 g. Homemade measures: 1 serving = One individual normal bowl. |
| 4. How many servings of pasta have you consumed today? 1 serving = 50–70 g. Homemade measures: 1 serving = One normal individual plate. |
| 5. How many servings of rice have you consumed today? 1 serving = 50–70 g. Homemade measures: 1 serving = One normal individual plate. |
| 6. How many servings of bread have you consumed today? 1 serving = 30–60 g. Homemade measures: 1 serving = Three or four slices of bread or a muffin. |
| 7. How many servings of olive oil have you consumed today (used for salad, to add to bread or for cooking)? 1 serving = 15 mL. Homemade measures: 1 serving = One tablespoon. |
| 8. How many servings of milk and dairy products (yogurt, fresh cheese, aged cheese) have you consumed today? 1 serving of milk = 200–250 mL. 1 serving of yogurt = 125 g. 1 serving of fresh cheese = 60–80 g. 1 serving of aged cheese = 30–40 g. Homemade measures: 1 serving = A glass of milk, a yogurt, a tub or individual portion of fresh cheese, two or three slices of aged cheese. |
| 9. How many servings of nuts (almonds, walnuts, hazelnuts, etc.) and/or olives have you consumed today? 1 serving = 20–30 g. Homemade measures: 1 serving = A handful of olives (8–10 units), a handful of hazelnuts (18-20 units), three or four walnuts. |
| 10. How many servings of beer have you consumed today? 1 serving = 200 mL. Homemade measures: 1 serving = A beer or a bottle (200 mL). 1.5 servings = A bottle (large bottle), a can or a large beer glass (330 mL). |
| 11. How many servings of wine have you consumed today? 1 serving = 100 mL. Homemade measures: 1 serving = A glass of wine (100 mL). |
| 12. How many servings of potatoes have you consumed today (cooked, roasted or fried)? 1 serving = 100–150 g. Homemade measures: 1 serving = One large potato or two small potatoes. |
| 13. How many servings of legumes (lentils, beans, chickpeas, peas, etc.) have you consumed today? 1 serving = 50–70 g. Homemade measures: 1 serving = One normal individual plate. |
| 14. How many servings of eggs have you consumed today? 1 serving = One medium egg (50–70 g). |
| 15. How many servings of fish (and / or shellfish) have you consumed today? 1 serving = 100–150 g. Homemade measures: 1 serving = One single regular steak. 0.5 servings = One can of tuna, etc. |
| 16. How many servings of white meat (poultry) have you consumed today? 1 serving = 100–125 g. Homemade measures: 1 serving = One regular single filet or a chicken leg quarter. 0.5 servings = Two or three slices of chicken or turkey. |
| 17. How many servings of red meat (beef, pork or lamb) have you consumed today? 1 serving = 100–125 g. Homemade measures: 1 serving = One single regular steak. |
| 18. How many servings of processed meats (hamburgers, sausages) and/or cold cuts (salami, chorizo, cooked ham) have you consumed today? 1 serving = 90–100 g. Homemade measures: 1 serving = a hamburger, a large sausage or two small sausages, eight or ten thin slices of cold cuts (salami, chorizo), four or five thin slices of cooked ham. |
| 19. How many sweets (sugar, candies, pastries, sweetened fruit juices and soft drinks) have you consumed today? Consider the number of units consumed regardless of the serving size. |
| Additional questions about physical activities: |
| 20. For how many minutes have you practiced moderate physical activity today? Consider only those moderate physical activities that you practiced for at least 10 min at a time. According to the WHO, these activities require moderate effort, which perceptibly accelerates the heart rate. Examples: fast walking, cycling, dancing, housework, active participation in games and sports with children, etc. |
| 21. For how many minutes have you practiced intense physical activity today? Consider only those intense physical activities that you practiced for at least 10 min at a time. According to the WHO, these activities require a great deal of effort and cause rapid breathing and a substantial increase in heart rate. Examples: running, cycling fast, competitive sports and games, etc. |
| 1. SI found e-12HR easy to complete: |
| Strongly agree. Agree. Neither agree nor disagree. Disagree. Strongly disagree. |
| 2. I found e-12HR interesting to complete: |
| Strongly agree. Agree. Neither agree nor disagree. Disagree. Strongly disagree. |
| 3. I found the questions of e-12HR understandable: |
| Strongly agree. Agree. Neither agree nor disagree. Disagree. Strongly disagree. |
| 4. In the future, I would be willing to complete e-12HR again: |
| Strongly agree. Agree. Neither agree nor disagree. Disagree. Strongly disagree. |
| 5. How much time was needed to complete the daily questionnaire on the app: |
| Less than 1 min per day. Approximately 1 min per day. Approximately 2 min per day. Approximately 3 min per day. Approximately 4 min per day. 5 min per day or more. |
| Food Group | Recommendation | Score |
|---|---|---|
| Fruits | 1–2 servings/main meal | 3 |
| Vegetables | ≥2 servings/main meal | 3 |
| Cereals | 1–2 servings/main meal | 3 |
| Olive oil | 1 serving/main meal | 3 |
| Milk and dairy products | 2 servings/day | 2 |
| Nuts | 1–2 servings/day | 2 |
| Fermented beverages | 1–2 glass/day | 1 |
| Potatoes | ≤3 servings/week | 1 |
| Legumes | ≥2 servings/week | 1 |
| Eggs | 2–4 servings/week | 1 |
| Fish | ≥2 servings/week | 1 |
| White meat | 2 servings/week | 1 |
| Red meat | <2 servings/week | 1 |
| Sweets | ≤2 servings/week | 1 |
| Total maximum score | 24 | |
References
- WHO. Global Strategy on Diet, Physical Activity and Health. 2004. Available online: https://www.who.int/publications/i/item/9241592222 (accessed on 14 June 2022).
- Gotsis, E.; Anagnostis, P.; Mariolis, A.; Vlachou, A.; Katsiki, N.; Karagiannis, A. Health benefits of the Mediterranean Diet: An update of research over the last 5 years. Angiology 2015, 66, 304–318. [Google Scholar] [CrossRef] [PubMed]
- Ventriglio, A.; Sancassiani, F.; Contu, M.P.; Latorre, M.; Di Slavatore, M.; Fornaro, M.; Bhugra, D. Mediterranean Diet and its Benefits on Health and Mental Health: A Literature Review. Clin. Pract. Epidemiol. Ment. Health 2020, 16, 156–164. [Google Scholar] [CrossRef] [PubMed]
- Lăcătușu, C.M.; Grigorescu, E.D.; Floria, M.; Onofriescu, A.; Mihai, B.M. The Mediterranean Diet: From an Environment-Driven Food Culture to an Emerging Medical Prescription. Int. J. Environ. Res. Public Health 2019, 16, 942. [Google Scholar] [CrossRef] [PubMed] [Green Version]
- Katz, D.L.; Meller, S. Can we say what diet is best for health? Annu. Rev. Public Health 2014, 35, 83–103. [Google Scholar] [CrossRef] [PubMed] [Green Version]
- Dernini, S.; Berry, E.M.; Serra-Majem, L.; La Vecchia, C.; Capone, R.; Medina, F.X.; Aranceta-Bartrina, J.; Belahsen, R.; Burlingame, B.; Calabrese, G.; et al. Med Diet 4.0: The Mediterranean diet with four sustainable benefits. Public Health Nutr. 2017, 20, 1322–1330. [Google Scholar] [CrossRef] [Green Version]
- Karam, J.; Bibiloni, M.D.M.; Serhan, M.; Tur, J.A. Adherence to Mediterranean Diet among Lebanese University Students. Nutrients 2021, 13, 1264. [Google Scholar] [CrossRef]
- Berry, E.M. Sustainable Food Systems and the Mediterranean Diet. Nutrients 2019, 11, 2229. [Google Scholar] [CrossRef] [Green Version]
- Dernini, S.; Berry, E.M. Mediterranean Diet: From a Healthy Diet to a Sustainable Dietary Pattern. Front. Nutr. 2015, 7, 15. [Google Scholar] [CrossRef] [Green Version]
- Berry, E.M.; Dernini, S.; Burlingame, B.; Meybeck, A.; Conforti, P. Food security and sustainability: Can one exist without the other? Public Health Nutr. 2015, 18, 2293–2302. [Google Scholar] [CrossRef]
- Burlingame, B.; Dernini, S. Sustainable Diets and Biodiversity; Food and Agriculture Organization of the United Nations (FAO): Rome, Italy, 2012; p. 309. [Google Scholar]
- Lacirignola, C.; Capone, R. Mediterranean Food Consumption Patterns Diet, Environment, Society, Economy and Health; Food and Agriculture Organization of the United Nations (FAO): Rome, Italy, 2015; p. 77. [Google Scholar]
- Burlingame, B.; Dernini, S. Sustainable diets: The Mediterranean diet as an example. Public Health Nutr. 2011, 14, 2285–2287. [Google Scholar] [CrossRef] [Green Version]
- McCarthy, S. Weekly patterns, diet quality and energy balance. Physiol. Behav. 2014, 134, 55–59. [Google Scholar] [CrossRef] [PubMed]
- Nordman, M.; Matthiessen, J.; Biltoft-Jensen, A.; Ritz, C.; Hjorth, M.F. Weekly variation in diet and physical activity among 4-75-year-old Danes. Public Health Nutr. 2020, 23, 1350–1361. [Google Scholar] [CrossRef] [PubMed] [Green Version]
- Cullen, K.W.; Lara, K.M.; de Moor, C. Children’s dietary fat intake and fat practices vary by meal and day. J. Am. Diet Assoc. 2002, 102, 1773–1778. [Google Scholar] [CrossRef]
- Hart, C.N.; Raynor, H.A.; Osterholt, K.M.; Jelalian, E.; Wing, R.R. Eating and activity habits of overweight children on weekdays and weekends. Int. J. Pediatr. Obes. 2011, 6, 467–742. [Google Scholar] [CrossRef] [PubMed] [Green Version]
- Brazendale, K.; Rayan, S.; Eisenstein, D.; Blankenship, M.; Rey, A.; Garcia, J.; Odahowski, C.L.; Leon, A. Obesogenic Behaviors of Rural Children on School and Nonschool Days. Child Obes. 2021, 17, 483–492. [Google Scholar] [CrossRef]
- Hoffmann, D.A.; Marx, J.M.; Burmeister, J.M.; Musher-Eizenman, D.R. Friday Night Is Pizza Night: A Comparison of Children’s Dietary Intake and Maternal Perceptions and Feeding Goals on Weekdays and Weekends. Int. J. Environ. Res. Public Health 2018, 11, 720. [Google Scholar] [CrossRef] [Green Version]
- Rothausen, B.W.; Matthiessen, J.; Hoppe, C.; Brockhoff, P.B.; Andersen, L.F.; Tetens, I. Differences in Danish children’s diet quality on weekdays v. weekend days. Public Health Nutr. 2012, 15, 1653–1660. [Google Scholar] [CrossRef] [Green Version]
- Rothausen, B.W.; Matthiessen, J.; Andersen, L.F.; Brockhoff, P.B.; Tetens, I. Dietary patterns on weekdays and weekend days in 4-14-year-old Danish children. Br. J. Nutr. 2013, 109, 1704–1713. [Google Scholar] [CrossRef] [Green Version]
- Rockell, J.E.; Parnell, W.R.; Wilson, N.C.; Skidmore, P.M.; Regan, A. Nutrients and foods consumed by New Zealand children on schooldays and non-schooldays. Public Health Nutr. 2011, 14, 203–208. [Google Scholar] [CrossRef] [Green Version]
- Svensson, A.; Larsson, C.; Eiben, G.; Lanfer, A.; Pala, V.; Hebestreit, A.; Huybrechts, I.; Fernández-Alvira, J.M.; Russo, P.; Koni, A.C.; et al. European children’s sugar intake on weekdays versus weekends: The IDEFICS study. Eur. J. Clin. Nutr. 2014, 68, 822–828. [Google Scholar] [CrossRef]
- Lachapelle, D.; Gamache, C.; Brodeur, J.M.; Sévigny, J. Frequency of food consumption in children: Weekdays versus weekends. J. Can. Dent. Assoc. 1989, 55, 61e5. [Google Scholar]
- Dutch, D.C.; Golley, R.K.; Johnson, B.J. Diet Quality of Australian Children and Adolescents on Weekdays versus Weekend Days: A Secondary Analysis of the National Nutrition and Physical Activity Survey 2011–2012. Nutrients 2021, 13, 4128. [Google Scholar] [CrossRef] [PubMed]
- Hanson, K.L.; Olson, C.M. School meals participation and weekday dietary quality were associated after controlling for weekend eating among U.S. school children aged 6 to 17 years. J. Nutr. 2013, 143, 714–721. [Google Scholar] [CrossRef] [PubMed]
- Kim, M.J. Comparison of food and nutrient intake between weekday and weekend for elementary and middle school students by gender in Busan and some parts of Kyungsangnamdo. J. Nutr. Health 2013, 46, 332–345. [Google Scholar] [CrossRef] [Green Version]
- Smith, K.L.; Straker, L.M.; Kerr, D.A.; Smith, A.J. Overweight adolescents eat what? And when? Analysis of consumption patterns to guide dietary message development for intervention. J. Hum. Nutr. Diet. 2015, 28, 80–93. [Google Scholar] [CrossRef]
- Haines, P.S.; Hama, M.Y.; Guilkey, D.K.; Popkin, B.M. Weekend eating in the United States is linked with greater energy, fat, and alcohol intake. Obes. Res. 2003, 11, 945–949. [Google Scholar] [CrossRef]
- Monteiro, L.S.; Hassan, B.K.; Estima, C.C.P.; Souza, A.M.; Verly, E.; Sichieri, R.; Pereira, R.A. Food Consumption According to the Days of the Week-National Food Survey, 2008–2009. Rev. Saude Publica 2017, 51, 93. [Google Scholar] [CrossRef] [Green Version]
- Yang, P.H.W.; Black, J.L.; Barr, S.I.; Vatanparast, H. A temporal analysis of Canadian dietary choices using the Canadian Community Health Survey Cycle 2.2: Does nutrient intake and diet quality vary on weekends versus weekdays. FASEB J. 2013, 27, 354. [Google Scholar] [CrossRef]
- An, R. Weekend-weekday differences in diet among U.S. adults, 2003–2012. Ann. Epidemiol. 2016, 26, 57–65. [Google Scholar] [CrossRef]
- Racette, S.B.; Weiss, E.P.; Schechtman, K.B.; Steger-May, K.; Villareal, D.T.; Obert, K.A.; Holloszy, J.O. Influence of weekend lifestyle patterns on body weight. Obesity 2008, 16, 1826–1830. [Google Scholar] [CrossRef]
- Jahns, L.; Conrad, Z.; Johnson, L.K.; Scheett, A.J.; Stote, K.S.; Raatz, S.K. Diet Quality Is Lower and Energy Intake Is Higher on Weekends Compared with Weekdays in Midlife Women: A 1-Year Cohort Study. J. Acad. Nutr. Diet. 2017, 117, 1080–1086. [Google Scholar] [CrossRef] [PubMed]
- Yang, P.H.; Black, J.L.; Barr, S.I.; Vatanparast, H. Examining differences in nutrient intake and dietary quality on weekdays versus weekend days in Canada. Appl. Physiol. Nutr. Metab. 2014, 39, 1413–1417. [Google Scholar] [CrossRef] [PubMed]
- Rhodes, D.G.; Cleveland, L.E.; Murayi, T.; Moshfegh, A.J. The effect of weekend eating on nutrient intakes and dietary patterns. FASEB J. 2007, 21, 835. [Google Scholar] [CrossRef]
- Hartline-Grafton, H.L.; Rose, D.; Johnson, C.C.; Rice, J.C.; Webber, L.S. The influence of weekday eating patterns on energy intake and BMI among female elementary school personnel. Obesity 2010, 18, 736–742. [Google Scholar] [CrossRef]
- Yahia, N.; Achkar, A.; Abdallah, A.; Rizk, S. Eating habits and obesity among Lebanese university students. Nutr. J. 2008, 7, 32. [Google Scholar] [CrossRef] [Green Version]
- Béjar, L.M.; Sharp, B.N.; García-Perea, M.D. The e-EPIDEMIOLOGY Mobile Phone App for Dietary Intake Assessment: Comparison with a Food Frequency Questionnaire. JMIR Res. Protoc. 2016, 5, e208. [Google Scholar] [CrossRef] [Green Version]
- Béjar, L.M.; Vázquez-Limón, E. Is there any alternative to traditional food frequency questionnaire for evaluating habitual dietary intake? Nutr. Hosp. 2017, 34, 880–888. [Google Scholar] [CrossRef]
- Béjar, L.M. First evaluation steps of a new method for dietary intake estimation regarding a list of key food groups in adults and in different sociodemographic and health-related behaviour strata. Public Health Nutr. 2017, 20, 2660–2669. [Google Scholar] [CrossRef] [Green Version]
- Béjar, L.M.; Reyes, Ó.A.; García-Perea, M.D. Electronic 12-Hour Dietary Recall (e-12HR): Comparison of a Mobile Phone App for Dietary Intake Assessment with a Food Frequency Questionnaire and Four Dietary Records. JMIR Mhealth Uhealth 2018, 6, e10409. [Google Scholar] [CrossRef]
- Béjar, L.M.; García-Perea, M.D.; Reyes, Ó.A.; Vázquez-Limón, E. Relative Validity of a Method Based on a Smartphone App (Electronic 12-Hour Dietary Recall) to Estimate Habitual Dietary Intake in Adults. JMIR Mhealth Uhealth 2019, 7, e11531. [Google Scholar] [CrossRef] [Green Version]
- Knudsen, V.K.; Hatch, E.E.; Cueto, H.; Tucker, K.L.; Wise, L.; Christensen, T.; Mikkelsen, E.M. Relative validity of a semi-quantitative, web-based FFQ used in the ‘Snart Forældre’ cohort—A Danish study of diet and fertility. Public Health Nutr. 2016, 19, 1027–1034. [Google Scholar] [CrossRef] [PubMed] [Green Version]
- Medin, A.C.; Astrup, H.; Kåsin, B.M.; Andersen, L.F. Evaluation of a web-based food record for children using direct unobtrusive lunch observations: A validation study. J. Med. Internet Res. 2015, 17, e273. [Google Scholar] [CrossRef] [PubMed] [Green Version]
- Rodríguez, I.T.; Ballart, J.F.; Pastor, G.C.; Jordà, E.B.; Val, V.A. Validation of a short questionnaire on frequency of dietary intake: Reproducibility and validity. Nutr. Hosp. 2008, 23, 242–252. [Google Scholar] [PubMed]
- Forster, H.; Fallaize, R.; Gallagher, C.; O’Donovan, C.B.; Woolhead, C.; Walsh, M.C.; Macready, A.L.; Lovegrove, J.A.; Mathers, J.C.; Gibney, M.J.; et al. Online dietary intake estimation: The Food4Me food frequency questionnaire. J. Med. Internet Res. 2014, 16, e150. [Google Scholar] [CrossRef] [Green Version]
- Svensson, A.; Larsson, C. A mobile phone app for dietary intake assessment in adolescents: An evaluation study. JMIR Mhealth Uhealth 2015, 3, e93. [Google Scholar] [CrossRef]
- Hongu, N.; Pope, B.T.; Bilgiç, P.; Orr, B.J.; Suzuki, A.; Kim, A.S.; Merchant, N.C.; Roe, D.J. Usability of a smartphone food picture app for assisting 24-hour dietary recall: A pilot study. Nutr. Res. Pract. 2015, 9, 207–212. [Google Scholar] [CrossRef] [Green Version]
- Monteagudo, C.; Mariscal-Arcas, M.; Rivas, A.; Lorenzo-Tovar, M.L.; Tur, J.A.; Olea-Serrano, F. Proposal of a Mediterranean Diet Serving Score. PLoS ONE 2015, 10, e0128594. [Google Scholar] [CrossRef] [Green Version]
- Vasiloglou, M.F.; Lu, Y.; Stathopoulou, T.; Papathanail, I.; Fäh, D.; Ghosh, A.; Baumann, M.; Mougiakakou, S. Assessing Mediterranean Diet Adherence with the Smartphone: The Medipiatto Project. Nutrients 2020, 12, 3763. [Google Scholar] [CrossRef]
- Duan, Y.P.; Wienert, J.; Hu, C.; Si, G.Y.; Lippke, S. Web-Based Intervention for Physical Activity and Fruit and Vegetable Intake Among Chinese University Students: A Randomized Controlled Trial. J. Med. Internet Res. 2017, 19, e106. [Google Scholar] [CrossRef]
- García-Meseguer, M.J.; Burriel, F.C.; García, C.V.; Serrano-Urrea, R. Adherence to Mediterranean diet in a Spanish university population. Appetite 2014, 78, 156–164. [Google Scholar] [CrossRef]
- Solera, A.; Gamero, A. Healthy habits in university students of health sciences and other branches of knowledge: A comparative study. Rev. Esp. Nutr. Hum. Diet. 2019, 23, 271–282. [Google Scholar]
- Cancela-Carral, J.M.; Ayán-Pérez, C. Prevalence and relationship between physical activity and abnormal eating attitudes in Spanish women university students in Health and Education Sciences. Rev. Esp. Salud Publica 2011, 85, 499–505. [Google Scholar] [CrossRef] [PubMed]
- Ramón-Arbués, E.; Granada-López, J.M.; Martínez-Abadía, B.; Echániz-Serrano, E.; Antón-Solanas, I.; Jerue, B.A. Factors Related to Diet Quality: A Cross-Sectional Study of 1055 University Students. Nutrients 2021, 13, 3512. [Google Scholar] [CrossRef] [PubMed]
- Telleria-Aramburu, N.; Bermúdez-Marín, N.; Rocandio, A.M.; Telletxea, S.; Basabe, N.; Rebato, E.; Arroyo-Izaga, M. Nutritional quality and carbon footprint of university students’ diets: Results from the EHU12/24 study. Public Health Nutr. 2022, 25, 183–195. [Google Scholar] [CrossRef]
- López-Moreno, M.; Garcés-Rimón, M.; Miguel, M.; Iglesias-López, M.T. Adherence to Mediterranean Diet, Alcohol Consumption and Emotional Eating in Spanish University Students. Nutrients 2021, 13, 3174. [Google Scholar] [CrossRef]
- Cobo-Cuenca, A.I.; Garrido-Miguel, M.; Soriano-Cano, A.; Ferri-Morales, A.; Martínez-Vizcaíno, V.; Martín-Espinosa, N.M. Adherence to the Mediterranean Diet and Its Association with Body Composition and Physical Fitness in Spanish University Students. Nutrients 2019, 11, 2830. [Google Scholar] [CrossRef] [Green Version]
- Willett, W. Nutritional Epidemiology, 3rd ed.; Oxford University Press: New York, NY, USA, 2013; p. 552. [Google Scholar]
- Rutishauser, I.H. Dietary intake measurements. Public Health Nutr. 2005, 8, 1100–1107. [Google Scholar] [CrossRef] [Green Version]
- Tucker, K.L.; Smith, C.E.; Lai, C.Q.; Ordovas, J.M. Quantifying diet for nutrigenomic studies. Annu. Rev. Nutr. 2013, 33, 349–371. [Google Scholar] [CrossRef] [Green Version]
- Gibson, R. Principles of Nutritional Assessment, 2nd ed.; Oxford University Press: New York, NY, USA, 2005; p. 908. [Google Scholar]
- Martín-Moreno, J.M.; Gorgojo, L. Assessment of dietary intake at the population level through individual questionnaires: Meth-odological shadows and lights. Rev. Esp. Salud Publica 2007, 81, 507–518. [Google Scholar] [CrossRef]
- Dhurandhar, N.V.; Schoeller, D.; Brown, A.W.; Heymsfield, S.B.; Thomas, D.; Sørensen, T.I.; Speakman, J.R.; Jeansonne, M.; Allison, D.B.; Energy Balance Measurement Working Group. Energy balance measurement: When something is not better than nothing. Int. J. Obes. 2015, 39, 1109–1113. [Google Scholar] [CrossRef] [Green Version]
- Illner, A.K.; Freisling, H.; Boeing, H.; Huybrechts, I.; Crispim, S.P.; Slimani, N. Review and evaluation of innovative technologies for measuring diet in nutritional epidemiology. Int. J. Epidemiol. 2012, 41, 1187–1203. [Google Scholar] [CrossRef] [PubMed] [Green Version]
- Steele, R. An overview of the state of the art of automated capture of dietary intake information. Crit. Rev. Food Sci. Nutr. 2015, 55, 1929–1938. [Google Scholar] [CrossRef] [PubMed]
- Hassannejad, H.; Matrella, G.; Ciampolini, P.; De Munari, I.; Mordonini, M.; Cagnoni, S. Automatic diet monitoring: A review of computer vision and wearable sensor-based methods. Int. J. Food Sci. Nutr. 2017, 68, 656–670. [Google Scholar] [CrossRef] [PubMed]
- Thong, Y.J.; Nguyen, T.; Zhang, Q.; Karunanithi, M.; Yu, L. Predicting food nutrition facts using pocket-size near-infrared sensor. Annu. Int. Conf. IEEE Eng. Med. Biol. Soc. 2017, 2017, 742–745. [Google Scholar] [CrossRef]
- Carroll, R.J.; Midthune, D.; Subar, A.F.; Shumakovich, M.; Freedman, L.S.; Thompson, F.E.; Kipnis, V. Taking advantage of the strengths of 2 different dietary assessment instruments to improve intake estimates for nutritional epidemiology. Am. J. Epidemiol. 2012, 175, 340–347. [Google Scholar] [CrossRef] [Green Version]
| Scoring of Food Groups Calculated on a Daily Basis | ||
|---|---|---|
| Food Group | Servings Per Day | Score (e-12HR) |
| Fruits | 3–6 servings | 3 |
| Vegetables | ≥6 servings | 3 |
| Cereals | 3–6 servings | 3 |
| Olive oil | 3–4 servings | 3 |
| Milk and dairy products | 2–3 servings | 2 |
| Nuts | 1–2 servings | 2 |
| Fermented beverages | 1–2 servings | 1 |
| Scoring of food groups calculated on a weekly basis | ||
| Food group | Servings per week | Score (e-12HR) |
| Potatoes | ≤3 servings | 1 |
| Legumes | ≥2 servings | 1 |
| Eggs | 2–4 servings | 1 |
| Fish | ≥2 servings | 1 |
| White meat | 2–3 servings | 1 |
| Red meat | <2 servings | 1 |
| Sweets | ≤2 servings | 1 |
| Total maximum score | 24 | |
| Characteristics | N (%) | Mean (SD) | Median (IQR) |
|---|---|---|---|
| Participants who completed the study | 361 (82.2) | -* | - |
| Participants who did not complete the study | 78 (17.8) | - | - |
| Number of days app task completed | - | - | - |
| >30 days | 143 (39.6) | - | - |
| 28–30 days | 143 (39.6) | - | - |
| 21–27 days | 55 (15.2) | - | - |
| 14–20 days | 20 (5.5) | - | - |
| Number of days app task completed (weekdays: Monday–Thursday) | - | - | - |
| 15–32 days | 287 (79.5) | - | - |
| 7–14 days | 73 (20.2) | - | - |
| 3–6 days | 1 (0.3) | - | - |
| Number of days app task completed (weekend days: Friday–Sunday and holidays) | - | - | - |
| 15–32 days | 137 (37.9) | - | - |
| 7–14 days | 212 (58.7) | - | - |
| 3–6 days | 12 (3.3) | - | - |
| Age (years) | - | 20.6 (2.8) | 20.0 (2.0) |
| <20 | 185 (51.2) | - | - |
| ≥20 | 176 (48.8) | - | - |
| Gender | - | - | - |
| Females | 263 (72.9) | - | - |
| Males | 98 (27.1) | - | - |
| Studies | - | - | - |
| Pharmacy | 210 (58.2) | - | - |
| Medicine | 151 (41.8) | - | - |
| BMI (kg/m2) | - | 21.9 (3.3) | 21.1 (4.0) |
| <25 | 317 (87.8) | - | - |
| ≥25 | 44 (12.2) | - | - |
| Smoking status | - | - | - |
| No | 330 (91.4) | - | - |
| Yes | 31 (8.6) | - | - |
| Physical activity status (minutes/week) | - | - | - |
| ≥150 | 280 (77.6) | - | - |
| <150 | 81 (22.4) | - | - |
| Total Monitoring Period | Index | Level | ||||
|---|---|---|---|---|---|---|
| Mean (SD) | Median (IQR) | p * | Low: 0–8 | Moderate–High ≥ 9 | p ** | |
| All | 8.7 (2.9) | 8.0 (3.0) | 188 (52.1) | 173 (47.9) | ||
| Age (years) | ||||||
| <20 | 8.7 (2.8) | 8.0 (4.0) | 0.860 | 99 (53.5) | 86 (46.5) | 0.576 |
| ≥20 | 8.7 (2.9) | 8.0 (3.0) | 89 (50.6) | 87 (49.4) | ||
| Gender | ||||||
| Females | 8.5 (2.8) | 8.0 (3.0) | 0.049 | 141 (53.6) | 122 (46.4) | 0.339 |
| Males | 9.2 (3.1) | 9.0 (4.0) | 47 (48.0) | 51 (52.0) | ||
| Studies | ||||||
| Pharmacy | 8.6 (2.9) | 8.0 (3.0) | 0.496 | 113 (53.8) | 97 (46.2) | 0.437 |
| Medicine | 8.8 (2.8) | 9.0 (4.0) | 75 (49.7) | 76 (50.3) | ||
| BMI (kg/m2) | ||||||
| <25 | 8.8 (2.9) | 8.0 (4.0) | 0.026 | 159 (50.2) | 158 (49.8) | 0.050 |
| ≥25 | 7.8 (2.4) | 7.0 (3.0) | 29 (65.9) | 15 (34.1) | ||
| Smoking status | ||||||
| No | 8.8 (2.9) | 8.0 (3.0) | 0.078 | 169 (51.2) | 161 (48.8) | 0.283 |
| Yes | 7.7 (2.6) | 7.0 (3.0) | 19 (61.3) | 12 (38.7) | ||
| Physical activity status (minutes/week) | ||||||
| ≥150 | 9.0 (2.9) | 9.0 (4.0) | 0.000 | 132 (47.1) | 148 (52.9) | 0.000 |
| <150 | 7.6 (2.5) | 7.0 (3.0) | 56 (69.1) | 25 (30.9) | ||
| Weekdays | Weekends | ||||
|---|---|---|---|---|---|
| Mean (SD) | Median (IQR) | Mean (SD) | Median (IQR) | p | |
| All | 9.3 (3.0) | 9.0 (4.0) | 8.1 (2.9) | 8.0 (4.0) | 0.000 ** |
| Age (years) | |||||
| <20 | 9.3 (3.0) | 9.0 (4.0) | 8.1 (3.0) | 8.0 (4.0) | 0.000 ** |
| ≥20 | 9.2 (3.0) | 9.0 (4.0) | 8.1 (2.8) | 8.0 (4.0) | 0.000 ** |
| Gender | |||||
| Females | 9.0 (2.9) | 9.0 (4.0) | 7.9 (2.8) | 8.0 (4.0) | 0.000 ** |
| Males | 9.9 (3.2) | 10.0 (4.0) | 8.6 (3.2) | 8.0 (4.0) | 0.000 ** |
| Studies | |||||
| Pharmacy | 9.1 (2.9) | 9.0 (4.0) | 8.0 (3.0) | 8.0 (4.0) | 0.000 ** |
| Medicine | 9.4 (3.0) | 9.0 (4.0) | 8.2 (2.8) | 8.0 (3.0) | 0.000 ** |
| BMI (kg/m2) | |||||
| <25 | 9.4 (3.0) | 9.0 (4.0) | 8.2 (2.9) | 8.0 (4.0) | 0.000 ** |
| ≥25 | 8.5 (2.5) | 8.0 (4.0) | 7.4 (2.7) | 7.0 (5.0) | 0.001 * |
| Smoking status | |||||
| No | 9.3 (3.0) | 9.0 (4.0) | 8.2 (3.0) | 8.0 (4.0) | 0.000 ** |
| Yes | 8.5 (2.7) | 8.0 (4.0) | 7.0 (2.4) | 7.0 (4.0) | 0.000 ** |
| Physical activity status (minutes/week) | |||||
| ≥150 | 9.6 (3.0) | 9.0 (4.0) | 8.4 (2.9) | 8.0 (4.0) | 0.000 ** |
| <150 | 8.1 (2.4) | 8.0 (4.0) | 7.0 (2.7) | 7.0 (4.0) | 0.000 ** |
| Weekdays | Weekends | p * | |||
|---|---|---|---|---|---|
| Low: 0–8 | Moderate–High ≥ 9 | Low: 0–8 | Moderate–high ≥ 9 | ||
| N (%) | N (%) | N (%) | N (%) | ||
| All | 159 (44.0) | 202 (56.0) | 223 (61.8) | 138 (38.2) | 0.000 |
| Age (years) | |||||
| <20 | 78 (42.2) | 107 (57.8) | 117 (63.2) | 68 (36.8) | 0.000 |
| ≥20 | 81 (46.0) | 95 (54.0) | 106 (60.2) | 70 (39.8) | 0.000 |
| Gender | |||||
| Females | 124 (47.1) | 139 (52.9) | 170 (64.6) | 93 (35.4) | 0.000 |
| Males | 35 (35.7) | 63 (64.3) | 53 (54.1) | 45 (45.9) | 0.002 |
| Studies | |||||
| Pharmacy | 94 (44.8) | 116 (55.2) | 135 (64.3) | 75 (35.7) | 0.000 |
| Medicine | 65 (43.0) | 86 (57.0) | 88 (58.3) | 63 (41.7) | 0.001 |
| BMI (kg/m2) | |||||
| <25 | 136 (42.9) | 181 (57.1) | 192 (60.6) | 125 (39.4) | 0.000 |
| ≥25 | 23 (52.3) | 21 (47.7) | 31 (70.5) | 13 (29.5) | 0.021 |
| Smoking status | |||||
| No | 141 (42.7) | 189 (57.3) | 200 (60.6) | 130 (39.4) | 0.000 |
| Yes | 18 (58.1) | 13 (41.9) | 23 (74.2) | 8 (25.8) | 0.125 |
| Physical activity status (minutes/week) | |||||
| ≥150 | 112 (40.0) | 168 (60.0) | 162 (57.9) | 118 (42.1) | 0.000 |
| <150 | 47 (58.0) | 34 (42.0) | 61 (75.3) | 20 (24.7) | 0.007 |
| Total Monitoring Period | All | Age (Years) | Gender | ||
|---|---|---|---|---|---|
| - | - | <20 | ≥20 | Female | Male |
| Food group | N (%) | N (%) | N (%) | N (%) | N (%) |
| Fruits | 22 (6.1) | 17 (9.2) | 5 (2.8) * | 16 (6.1) | 6 (6.1) |
| Vegetables | 0 (0.0) | 0 (0.0) | 0 (0.0) | 0 (0.0) | 0 (0.0) |
| Cereals | 52 (14.4) | 28 (15.1) | 24 (13.6) | 22 (8.4) | 30 (30.6) * |
| Olive oil | 15 (4.2) | 6 (3.2) | 9 (5.1) | 10 (3.8) | 5 (5.1) |
| Milk and dairy products | 85 (23.5) | 44 (23.8) | 41(23.3) | 61 (23.2) | 24 (24.5) |
| Nuts | 28 (7.8) | 16 (8.6) | 12 (6.8) | 15 (5.7) | 13 (13.3) * |
| Fermented beverages | 351 (97.2) | 181 (97.8) | 170 (96.6) | 261 (99.2) | 90 (91.8) * |
| Potatoes | 147 (40.7) | 77 (41.6) | 70 (39.8) | 117 (44.5) | 30 (30.6) * |
| Legumes | 116 (32.1) | 54 (29.2) | 62 (35.2) | 75 (28.5) | 41 (41.8) * |
| Eggs | 171 (47.4) | 76 (41.1) | 95 (54.0) * | 141 (53.6) | 30 (30.6) * |
| Fish | 230 (63.7) | 124 (67.0) | 106 (60.2) | 161 (61.2) | 69 (70.4) |
| White meat | 306 (84.8) | 156 (84.3) | 150 (85.2) | 218 (82.9) | 88 (89.8) |
| Red meat | 59 (16.3) | 31 (16.8) | 28 (15.9) | 51 (19.4) | 8 (8.2) * |
| Sweets | 95 (26.3) | 43 (23.2) | 52 (29.5) | 61 (23.2) | 34 (34.7) * |
| Total monitoring period | All | Studies | BMI (kg/m2) | ||
| - | - | Pharmacy | Medicine | <25 | ≥25 |
| Food group | N (%) | N (%) | N (%) | N (%) | N (%) |
| Fruits | 22 (6.1) | 10 (4.8) | 12 (7.9) | 21 (6.6) | 1 (2.3) |
| Vegetables | 0 (0.0) | 0 (0.0) | 0 (0.0) | 0 (0.0) | 0 (0.0) |
| Cereals | 52 (14.4) | 26 (12.4) | 26 (17.2) | 45 (14.2) | 7 (15.9) |
| Olive oil | 15 (4.2) | 10 (4.8) | 5 (3.3) | 14 (4.4) | 1 (2.3) |
| Milk and dairy products | 85 (23.5) | 51 (24.3) | 34 (22.5) | 77 (24.3) | 8 (18.2) |
| Nuts | 28 (7.8) | 15 (7.1) | 13 (8.6) | 26 (8.2) | 2 (4.5) |
| Fermented beverages | 351 (97.2) | 202 (96.2) | 149 (98.7) | 309 (97.5) | 42 (95.5) |
| Potatoes | 147 (40.7) | 88 (41.9) | 59 (39.1) | 136 (42.9) | 11 (25.0) * |
| Legumes | 116 (32.1) | 66 (31.4) | 50 (33.1) | 105 (33.1) | 11 (25.0) |
| Eggs | 171 (47.4) | 111 (52.9) | 60 (39.7) * | 151 (47.6) | 20 (45.5) |
| Fish | 230 (63.7) | 139 (66.2) | 91 (60.3) | 199 (62.8) | 31 (70.5) |
| White meat | 306 (84.8) | 175 (83.3) | 131 (86.8) | 269 (84.9) | 37 (84.1) |
| Red meat | 59 (16.3) | 33 (15.7) | 26 (17.2) | 54 (17.0) | 5 (11.4) |
| Sweets | 95 (26.3) | 54 (25.7) | 41 (27.2) | 86 (27.1) | 9 (20.5) |
| Total monitoring period | All | Smoking status | Physical activity status (minutes/week) | ||
| - | - | No | Yes | ≥150 | <150 |
| Food group | N (%) | N (%) | N (%) | N (%) | N (%) |
| Fruits | 22 (6.1) | 22 (6.7) | 0 (0.0) | 21 (7.5) | 1 (1.2) * |
| Vegetables | 0 (0.0) | 0 (0.0) | 0 (0.0) | 0 (0.0) | 0 (0.0) |
| Cereals | 52 (14.4) | 48 (14.5) | 4 (12.9) | 44 (15.7) | 8 (9.9) |
| Olive oil | 15 (4.2) | 13 (3.9) | 2 (6.5) | 12 (4.3) | 3 (3.7) |
| Milk and dairy products | 85 (23.5) | 77 (23.3) | 8 (25.8) | 74 (26.4) | 11 (13.6) * |
| Nuts | 28 (7.8) | 27 (8.2) | 1 (3.2) | 24 (8.6) | 4 (4.9) |
| Fermented beverages | 351 (97.2) | 325 (98.5) | 26 (83.9)* | 272 (97.1) | 79 (97.5) |
| Potatoes | 147 (40.7) | 141 (42.7) | 6 (19.4)* | 111 (39.6) | 36 (44.4) |
| Legumes | 116 (32.1) | 110 (33.3) | 6 (19.4) | 92 (32.9) | 24 (29.6) |
| Eggs | 171 (47.4) | 153 (46.4) | 18 (58.1) | 122 (43.6) | 49 (60.5) * |
| Fish | 230 (63.7) | 212 (64.2) | 18 (58.1) | 184 (65.7) | 46 (56.8) |
| White meat | 306 (84.8) | 278 (84.2) | 28 (90.3) | 244 (87.1) | 62 (76.5) * |
| Red meat | 59 (16.3) | 57 (17.3) | 2 (6.5) | 46 (16.4) | 13 (16.0) |
| Sweets | 95 (26.3) | 89 (27.0) | 6 (19.4) | 81 (28.9) | 14 (17.3) * |
| All | Age (Years) | |||||
|---|---|---|---|---|---|---|
| - | <20 | ≥20 | ||||
| N (%) | N (%) | N (%) | ||||
| Food Group | Weekdays | Weekends | Weekdays | Weekends | Weekdays | Weekends |
| Fruits | 22 (6.1) | 20 (5.5) | 16 (8.6) | 16 (8.6) | 6 (3.4) | 4 (2.3) |
| Vegetables | 1 (0.3) | 0 (0.0) | 1 (0.5) | 0 (0.0) | 0 (0.0) | 0 (0.0) |
| Cereals | 58 (16.1) | 54 (15.0) | 34 (18.4) | 29 (15.7) | 24 (13.6) | 25 (14.2) |
| Olive oil | 18 (5.0) | 17 (4.7) | 8 (4.3) | 8 (4.3) | 10 (5.7) | 9 (5.1) |
| Milk and dairy products | 98 (27.1) | 76 (21.1) * | 53 (28.6) | 40 (21.6) * | 45 (25.6) | 36 (20.5) * |
| Nuts | 31 (8.6) | 28 (7.8) | 18 (9.7) | 16 (8.6) | 13 (7.4) | 12 (6.8) |
| Fermented beverages | 355 (98.3) | 335 (92.8) * | 182 (98.4) | 170 (91.9) * | 173 (98.3) | 165 (93.8) * |
| Potatoes | 187 (51.8) | 127 (35.2) * | 96 (51.9) | 64 (34.6) * | 91 (51.7) | 63 (35.8) * |
| Legumes | 151 (41.8) | 89 (24.7) * | 76 (41.1) | 41 (22.2) * | 75 (42.6) | 48 (27.3) * |
| Eggs | 152 (42.1) | 126 (34.9) * | 75 (40.5) | 54 (29.2) * | 77 (43.8) | 72 (40.9) |
| Fish | 216 (59.8) | 205 (56.8) | 111 (60.0) | 111 (60.0) | 105 (59.7) | 94 (53.4) |
| White meat | 299 (82.8) | 278 (77.0) * | 156 (84.3) | 146 (78.9) | 143 (81.3) | 132 (75.0) |
| Red meat | 85 (23.5) | 59 (16.3) * | 42 (22.7) | 32 (17.3) | 43 (24.4) | 27 (15.3) * |
| Sweets | 145 (40.2) | 70 (19.4) * | 73 (39.5) | 32 (17.3) * | 72 (40.9) | 38 (21.6) * |
| All | Gender | |||||
| - | Female | Male | ||||
| N (%) | N (%) | N (%) | ||||
| Food group | Weekdays | Weekends | Weekdays | Weekends | Weekdays | Weekends |
| Fruits | 22 (6.1) | 20 (5.5) | 16 (6.1) | 15 (5.7) | 6 (6.1) | 5 (5.1) |
| Vegetables | 1 (0.3) | 0 (0.0) | 1 (0.4) | 0 (0.0) | 0 (0.0) | 0 (0.0) |
| Cereals | 58 (16.1) | 54 (15.0) | 30 (11.4) | 26 (9.9) | 28 (28.6) | 28 (28.6) |
| Olive oil | 18 (5.0) | 17 (4.7) | 10 (3.8) | 12 (4.6) | 8 (8.2) | 5 (5.1) |
| Milk and dairy products | 98 (27.1) | 76 (21.1) * | 68 (25.9) | 56 (21.3) * | 30 (30.6) | 20 (20.4) * |
| Nuts | 31 (8.6) | 28 (7.8) | 19 (7.2) | 14 (5.3) | 12 (12.2) | 14 (14.3) |
| Fermented beverages | 355 (98.3) | 335 (92.8) * | 263 (100.0) | 251 (95.4) * | 92 (93.9) | 84 (85.7)* |
| Potatoes | 187 (51.8) | 127 (35.2) * | 141 (53.6) | 98 (37.3) * | 46 (46.9) | 29 (29.6) * |
| Legumes | 151 (41.8) | 89 (24.7) * | 102 (38.8) | 59 (22.4) * | 49 (50.0) | 30 (30.6) * |
| Eggs | 152 (42.1) | 126 (34.9) * | 126 (47.9) | 103 (39.2) * | 26 (26.5) | 23 (23.5) |
| Fish | 216 (59.8) | 205 (56.8) | 150 (57.0) | 143 (54.4) | 66 (67.3) | 62 (63.3) |
| White meat | 299 (82.8) | 278 (77.0) * | 212 (80.6) | 198 (75.3) | 87 (88.8) | 80 (81.6) |
| Red meat | 85 (23.5) | 59 (16.3) * | 73 (27.8) | 50 (19.0) * | 12 (12.2) | 9 (9.2) |
| Sweets | 145 (40.2) | 70 (19.4) * | 95 (36.1) | 41 (15.6) * | 50 (51.0) | 29 (29.6) * |
| All | Studies | |||||
| - | Pharmacy | Medicine | ||||
| N (%) | N (%) | N (%) | ||||
| Food group | Weekdays | Weekends | Weekdays | Weekends | Weekdays | Weekends |
| Fruits | 22 (6.1) | 20 (5.5) | 9 (4.3) | 9 (4.3) | 13 (8.6) | 11 (7.3) |
| Vegetables | 1 (0.3) | 0 (0.0) | 0 (0.0) | 0 (0.0) | 1 (0.7) | 0 (0.0) |
| Cereals | 58 (16.1) | 54 (15.0) | 34 (16.2) | 25 (11.9) | 24 (15.9) | 29 (19.2) |
| Olive oil | 18 (5.0) | 17 (4.7) | 8 (3.8) | 13 (6.2) | 10 (6.6) | 4 (2.6) * |
| Milk and dairy products | 98 (27.1) | 76 (21.1) * | 57 (27.1) | 43 (20.5) * | 41 (27.2) | 33 (21.9) |
| Nuts | 31 (8.6) | 28 (7.8) | 14 (6.7) | 18 (8.6) | 17 (11.3) | 10 (6.6) * |
| Fermented beverages | 355 (98.3) | 335 (92.8) * | 205 (97.6) | 193 (91.9) * | 150 (99.3) | 142 (94.0) * |
| Potatoes | 187 (51.8) | 127 (35.2) * | 112 (53.3) | 71 (33.8) * | 75 (49.7) | 56 (37.1) * |
| Legumes | 151 (41.8) | 89 (24.7)* | 87 (41.4) | 49 (23.3) * | 64 (42.4) | 40 (26.5) * |
| Eggs | 152 (42.1) | 126 (34.9)* | 101 (48.1) | 73 (34.8) * | 51 (33.8) | 53 (35.1) |
| Fish | 216 (59.8) | 205 (56.8) | 132 (62.9) | 124 (59.0) | 84 (55.6) | 81 (53.6) |
| White meat | 299 (82.8) | 278 (77.0)* | 173 (82.4) | 162 (77.1) | 126 (83.4) | 116 (76.8) |
| Red meat | 85 (23.5) | 59 (16.3)* | 50 (23.8) | 34 (16.2) * | 35 (23.2) | 25 (16.6) |
| Sweets | 145 (40.2) | 70 (19.4)* | 84 (40.0) | 39 (18.6) * | 61 (40.4) | 31 (20.5) * |
| All | BMI (kg/m2) | |||||
| - | <25 | ≥25 | ||||
| N (%) | N (%) | N (%) | ||||
| Food group | Weekdays | Weekends | Weekdays | Weekends | Weekdays | Weekends |
| Fruits | 22 (6.1) | 20 (5.5) | 20 (6.3) | 19 (6.0) | 2 (4.5) | 1 (2.3) |
| Vegetables | 1 (0.3) | 0 (0.0) | 1 (0.3) | 0 (0.0) | 0 (0.0) | 0 (0.0) |
| Cereals | 58 (16.1) | 54 (15.0) | 49 (15.5) | 46 (14.5) | 9 (20.5) | 8 (18.2) |
| Olive oil | 18 (5.0) | 17 (4.7) | 17 (5.4) | 15 (4.7) | 1 (2.3) | 2 (4.5) |
| Milk and dairy products | 98 (27.1) | 76 (21.1) * | 89 (28.1) | 69 (21.8) * | 9 (20.5) | 7 (15.9) |
| Nuts | 31 (8.6) | 28 (7.8) | 29 (9.1) | 27 (8.5) | 2 (4.5) | 1 (2.3) |
| Fermented beverages | 355 (98.3) | 335 (92.8) * | 311 (98.1) | 298 (94.0) * | 44 (100.0) | 37 (84.1) * |
| Potatoes | 187 (51.8) | 127 (35.2) * | 170 (53.6) | 115 (36.3) * | 17 (38.6) | 12 (27.3) |
| Legumes | 151 (41.8) | 89 (24.7) * | 139 (43.8) | 78 (24.6) * | 12 (27.3) | 11 (25.0) |
| Eggs | 152 (42.1) | 126 (34.9)* | 133 (42.0) | 107 (33.8) * | 19 (43.2) | 19 (43.2) |
| Fish | 216 (59.8) | 205 (56.8) | 188 (59.3) | 181 (57.1) | 28 (63.6) | 24 (54.5) |
| White meat | 299 (82.8) | 278 (77.0) * | 263 (83.0) | 242 (76.3) * | 36 (81.8) | 36 (81.8) |
| Red meat | 85 (23.5) | 59 (16.3) * | 77 (24.3) | 54 (17.0) * | 8 (18.2) | 5 (11.4) |
| Sweets | 145 (40.2) | 70 (19.4) * | 127 (40.1) | 60 (18.9) * | 18 (40.9) | 10 (22.7) * |
| All | Smoking status | |||||
| - | No | Yes | ||||
| N (%) | N (%) | N (%) | ||||
| Food group | Weekdays | Weekends | Weekdays | Weekends | Weekdays | Weekends |
| Fruits | 22 (6.1) | 20 (5.5) | 22 (6.7) | 20 (6.1) | 0 (0.0) | 0 (0.0) |
| Vegetables | 1 (0.3) | 0 (0.0) | 1 (0.3) | 0 (0.0) | 0 (0.0) | 0 (0.0) |
| Cereals | 58 (16.1) | 54 (15.0) | 54 (16.4) | 52 (15.8) | 4 (12.9) | 2 (6.5) |
| Olive oil | 18 (5.0) | 17 (4.7) | 16 (4.8) | 15 (4.5) | 2 (6.5) | 2 (6.5) |
| Milk and dairy products | 98 (27.1) | 76 (21.1) * | 88 (26.7) | 71 (21.5) * | 10 (32.3) | 5 (16.1) |
| Nuts | 31 (8.6) | 28 (7.8) | 29 (8.8) | 27 (8.2) | 2 (6.5) | 1 (3.2) |
| Fermented beverages | 355 (98.3) | 335 (92.8) * | 326 (98.8) | 313 (94.8) * | 29 (93.5) | 22 (71.0) * |
| Potatoes | 187 (51.8) | 127 (35.2) * | 176 (53.3) | 121 (36.7) * | 11 (35.5) | 6 (19.4) |
| Legumes | 151 (41.8) | 89 (24.7) * | 142 (43.0) | 83 (25.2) * | 9 (29.0) | 6 (19.4) |
| Eggs | 152 (42.1) | 126 (34.9) * | 136 (41.2) | 114 (34.5) | 16 (51.6) | 12 (38.7) |
| Fish | 216 (59.8) | 205 (56.8) | 199 (60.3) | 187 (56.7) | 17 (54.8) | 18 (58.1) |
| White meat | 299 (82.8) | 278 (77.0) * | 270 (81.8) | 252 (76.4) * | 29 (93.5) | 26 (83.9) |
| Red meat | 85 (23.5) | 59 (16.3) * | 80 (24.2) | 57 (17.3) * | 5 (16.1) | 2 (6.5) |
| Sweets | 145 (40.2) | 70 (19.4) * | 134 (40.6) | 67 (20.3) * | 11 (35.5) | 3 (9.7) * |
| All | Physical activity status (minutes/week) | |||||
| - | ≥150 | <150 | ||||
| N (%) | N (%) | N (%) | ||||
| Food group | Weekdays | Weekends | Weekdays | Weekends | Weekdays | Weekends |
| Fruits | 22 (6.1) | 20 (5.5) | 22 (7.9) | 19 (6.8) | 0 (0.0) | 1 (1.2) |
| Vegetables | 1 (0.3) | 0 (0.0) | 1 (0.4) | 0 (0.0) | 0 (0.0) | 0 (0.0) |
| Cereals | 58 (16.1) | 54 (15.0) | 52 (18.6) | 47 (16.8) | 6 (7.4) | 7 (8.6) |
| Olive oil | 18 (5.0) | 17 (4.7) | 16 (5.7) | 12 (4.3) | 2 (2.5) | 5 (6.2) |
| Milk and dairy products | 98 (27.1) | 76 (21.1) * | 84 (30.0) | 66 (23.6) * | 14 (17.3) | 10 (12.3) |
| Nuts | 31 (8.6) | 28 (7.8) | 27 (9.6) | 25 (8.9) | 4 (4.9) | 3 (3.7) |
| Fermented beverages | 355 (98.3) | 335 (92.8) * | 275 (98.2) | 259 (92.5) * | 80 (98.8) | 76 (93.8) |
| Potatoes | 187 (51.8) | 127 (35.2) * | 144 (51.4) | 103 (36.8) * | 43 (53.1) | 24 (29.6) * |
| Legumes | 151 (41.8) | 89 (24.7) * | 119 (42.5) | 72 (25.7) * | 32 (39.5) | 17 (21.0) * |
| Eggs | 152 (42.1) | 126 (34.9) * | 101 (36.1) | 94 (33.6) | 51 (63.0) | 32 (39.5) * |
| Fish | 216 (59.8) | 205 (56.8) | 171 (61.1) | 161 (57.5) | 45 (55.6) | 44 (54.3) |
| White meat | 299 (82.8) | 278 (77.0) * | 238 (85.0) | 220 (78.6) * | 61 (75.3) | 58 (71.6) |
| Red meat | 85 (23.5) | 59 (16.3) * | 69 (24.6) | 47 (16.8) * | 16 (19.8) | 12 (14.8) |
| Sweets | 145 (40.2) | 70 (19.4) * | 121 (43.2) | 57 (20.4) * | 24 (29.6) | 13 (16.0) * |
| Questions, n (%) | ||||
|---|---|---|---|---|
| Options | Easy to Complete | Interesting to Complete | Understandable Questions | I Would Be Willing to Complete Again |
| Strongly agree | 117 (67.2) | 110 (63.2) | 120 (69.0) | 54 (31.0) |
| Agree | 54 (31.0) | 57 (32.7) | 52 (29.9) | 88 (50.6) |
| Neither agree nor disagree | 3 (1.7) | 6 (3.4) | 2 (1.1) | 28 (16.1) |
| Disagree | 0 (0.0) | 1 (0.6) | 0 (0.0) | 4 (2.3) |
| Strongly disagree | 0 (0.0) | 0 (0.0) | 0 (0.0) | 0 (0.0) |
| Questions, n (%) | ||||
| Options | Time to Complete the App | |||
| <1 min/day | 16 (9.2) | |||
| Approximately 1 min/day | 37 (21.3) | |||
| Approximately 2 min/day | 63 (36.2) | |||
| Approximately 3 min/day | 43 (24.7) | |||
| Approximately 4 min/day | 11 (6.3) | |||
| 5 min/day or more | 4 (2.3) | |||
Publisher’s Note: MDPI stays neutral with regard to jurisdictional claims in published maps and institutional affiliations. |
© 2022 by the author. Licensee MDPI, Basel, Switzerland. This article is an open access article distributed under the terms and conditions of the Creative Commons Attribution (CC BY) license (https://creativecommons.org/licenses/by/4.0/).
Share and Cite
Béjar, L.M. Weekend–Weekday Differences in Adherence to the Mediterranean Diet among Spanish University Students. Nutrients 2022, 14, 2811. https://doi.org/10.3390/nu14142811
Béjar LM. Weekend–Weekday Differences in Adherence to the Mediterranean Diet among Spanish University Students. Nutrients. 2022; 14(14):2811. https://doi.org/10.3390/nu14142811
Chicago/Turabian StyleBéjar, Luis M. 2022. "Weekend–Weekday Differences in Adherence to the Mediterranean Diet among Spanish University Students" Nutrients 14, no. 14: 2811. https://doi.org/10.3390/nu14142811
APA StyleBéjar, L. M. (2022). Weekend–Weekday Differences in Adherence to the Mediterranean Diet among Spanish University Students. Nutrients, 14(14), 2811. https://doi.org/10.3390/nu14142811