
CYP7A1, NPC1L1, ABCB1, and CD36 Polymorphisms Associated with Coenzyme Q10 Availability Affect the Subjective Quality of Life Score (SF-36) after Long-Term CoQ10 Supplementation in Women


Abstract
1. Introduction
2. Materials and Methods
2.1. Study Design
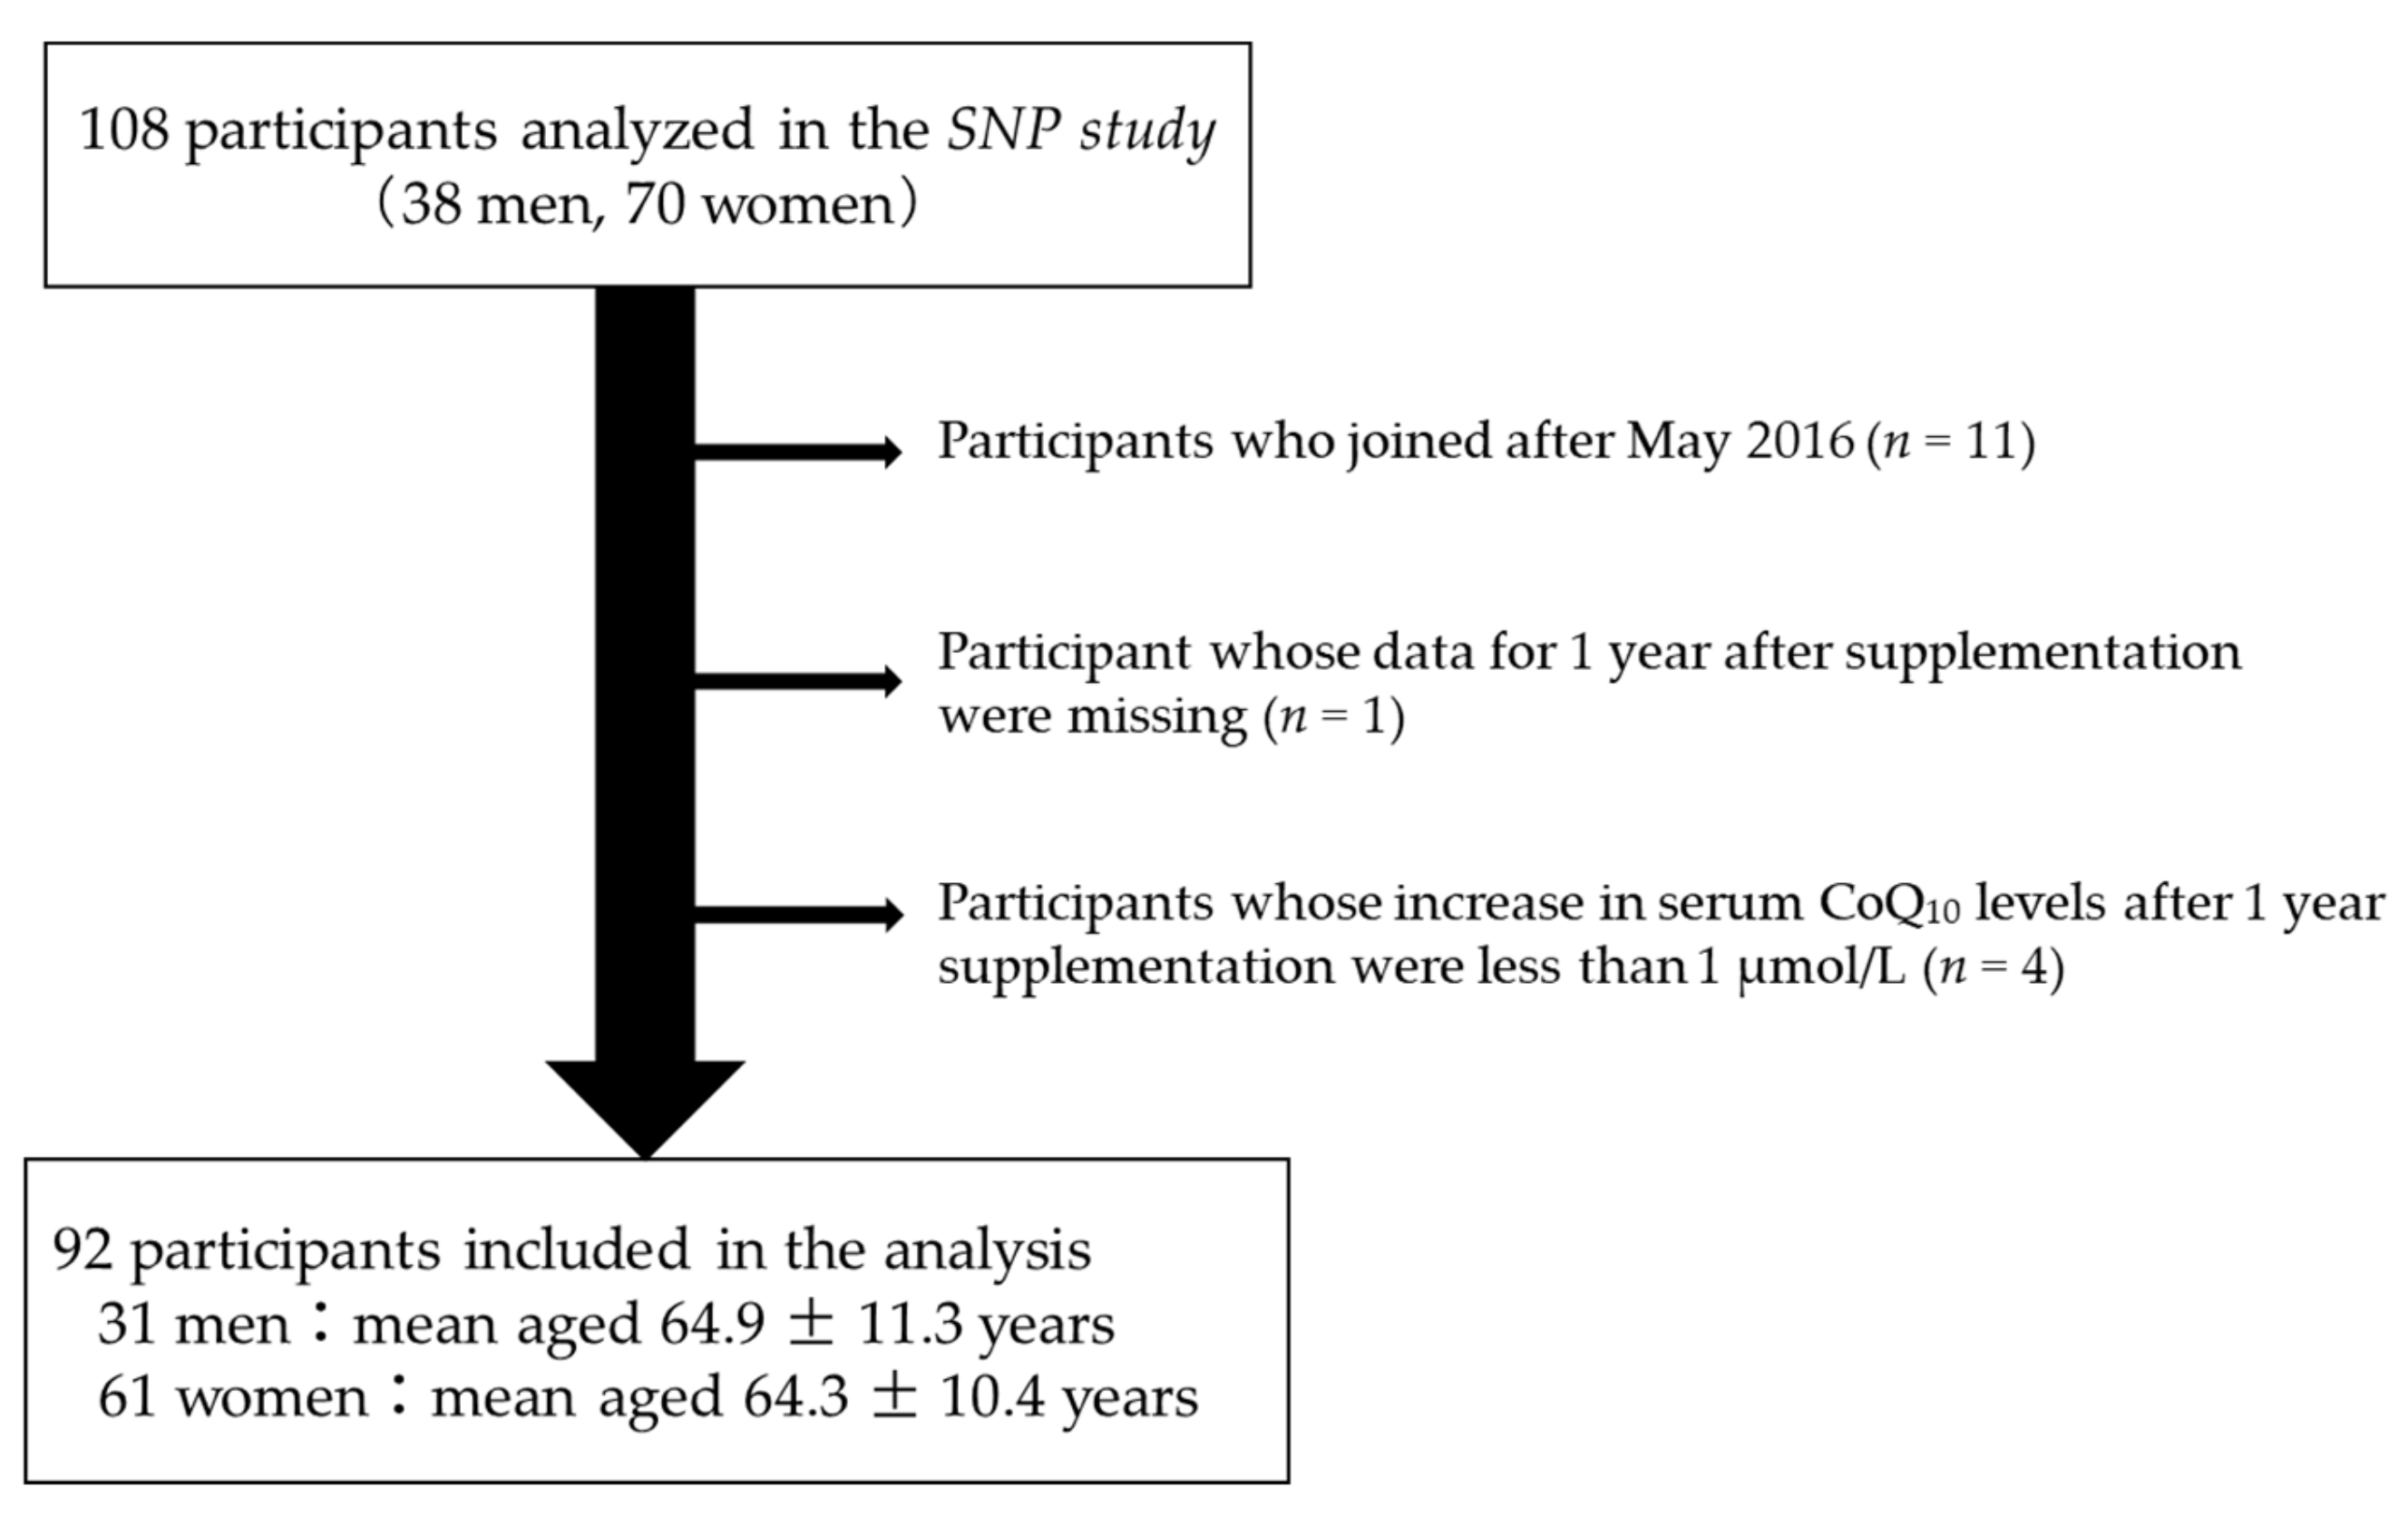
2.2. Participants
2.3. CoQ10 Supplementation
2.4. Data Analysis
3. Results
4. Discussion
5. Conclusions
Supplementary Materials
Author Contributions
Funding
Institutional Review Board Statement
Informed Consent Statement
Data Availability Statement
Acknowledgments
Conflicts of Interest
References
- Crane, F.L. Biochemical functions of coenzyme Q10. J. Am. Coll. Nutr. 2001, 20, 591–598. [Google Scholar] [CrossRef]
- Frei, B.; Kim, M.C.; Ames, B.N. Ubiquinol-10 is an effective lipid-soluble antioxidant at physiological concentrations. Proc. Natl. Acad. Sci. USA 1990, 87, 4879–4883. [Google Scholar] [CrossRef]
- Lopez-Lluch, G.; Rodriguez-Aguilera, J.C.; Santos-Ocana, C.; Navas, P. Is coenzyme Q a key factor in aging? Mech. Ageing Dev. 2010, 131, 225–235. [Google Scholar] [CrossRef] [PubMed]
- Tian, G.; Sawashita, J.; Kubo, H.; Nishio, S.Y.; Hashimoto, S.; Suzuki, N.; Yoshimura, H.; Tsuruoka, M.; Wang, Y.; Liu, Y.; et al. Ubiquinol-10 supplementation activates mitochondria functions to decelerate senescence in senescence-accelerated mice. Antioxid. Redox Signal. 2014, 20, 2606–2620. [Google Scholar] [CrossRef]
- Yan, J.; Fujii, K.; Yao, J.; Kishida, H.; Hosoe, K.; Sawashita, J.; Takeda, T.; Mori, M.; Higuchi, K. Reduced coenzyme Q10 supplementation decelerates senescence in SAMP1 mice. Exp. Gerontol. 2006, 41, 130–140. [Google Scholar] [CrossRef] [PubMed]
- Varela-Lopez, A.; Ochoa, J.J.; Llamas-Elvira, J.M.; Lopez-Frias, M.; Planells, E.; Ramirez-Tortosa, M.; Ramirez-Tortosa, C.L.; Giampieri, F.; Battino, M.; Quiles, J.L. Age-Related Loss in Bone Mineral Density of Rats Fed Lifelong on a Fish Oil-Based Diet Is Avoided by Coenzyme Q10 Addition. Nutrients 2017, 9, 176. [Google Scholar] [CrossRef] [PubMed]
- Andreani, C.; Bartolacci, C.; Guescini, M.; Battistelli, M.; Stocchi, V.; Orlando, F.; Provinciali, M.; Amici, A.; Marchini, C.; Tiano, L.; et al. Combination of Coenzyme Q10 Intake and Moderate Physical Activity Counteracts Mitochondrial Dysfunctions in a SAMP8 Mouse Model. Oxid. Med. Cell. Longev. 2018, 2018, 8936251. [Google Scholar] [CrossRef] [PubMed]
- Belviranli, M.; Okudan, N. Effect of Coenzyme Q10 Alone and in Combination with Exercise Training on Oxidative Stress Biomarkers in Rats. Int. J. Vitam. Nutr. Res. 2018, 88, 126–136. [Google Scholar] [CrossRef] [PubMed]
- Chis, B.A.; Chis, A.F.; Muresan, A.; Fodor, D. Q10 Coenzyme Supplementation can Improve Oxidative Stress Response to Exercise in Metabolic Syndrome in Rats. Int. J. Vitam. Nutr. Res. 2020, 90, 33–41. [Google Scholar] [CrossRef]
- Sandhir, R.; Sethi, N.; Aggarwal, A.; Khera, A. Coenzyme Q10 treatment ameliorates cognitive deficits by modulating mitochondrial functions in surgically induced menopause. Neurochem. Int. 2014, 74, 16–23. [Google Scholar] [CrossRef]
- Dumont, M.; Kipiani, K.; Yu, F.; Wille, E.; Katz, M.; Calingasan, N.Y.; Gouras, G.K.; Lin, M.T.; Beal, M.F. Coenzyme Q10 decreases amyloid pathology and improves behavior in a transgenic mouse model of Alzheimer’s disease. J. Alzheimer’s Dis. 2011, 27, 211–223. [Google Scholar] [CrossRef] [PubMed]
- Muthukumaran, K.; Kanwar, A.; Vegh, C.; Marginean, A.; Elliott, A.; Guilbeault, N.; Badour, A.; Sikorska, M.; Cohen, J.; Pandey, S. Ubisol-Q10 (a Nanomicellar Water-Soluble Formulation of CoQ10) Treatment Inhibits Alzheimer-Type Behavioral and Pathological Symptoms in a Double Transgenic Mouse (TgAPEswe, PSEN1dE9) Model of Alzheimer’s Disease. J. Alzheimer’s Dis. 2018, 61, 221–236. [Google Scholar] [CrossRef] [PubMed]
- Deguchi, S.; Fujii, K.; Kurihara, T. The effect of the reduced form of coenzyme Q10 (ubiquinol, Kaneka QHTM) on QOL improvement in the elderly. J. Clin. Ther. Med. 2008, 24, 233–238. [Google Scholar]
- Kinoshita, T.; Maruyama, K.; Tanigawa, T. The Effects of Long-Term Ubiquinol Intake on Improving the Quality of Life of Community Residents. Funct. Foods Health Dis. 2016, 6, 16–32. [Google Scholar] [CrossRef][Green Version]
- Mantle, D.; Hargreaves, I. Coenzyme Q10 and Degenerative Disorders Affecting Longevity: An Overview. Antioxidants 2019, 8, 44. [Google Scholar] [CrossRef]
- Kennedy, C.; Koller, Y.; Surkova, E. Effect of Coenzyme Q10 on statin-associated myalgia and adherence to statin therapy: A systematic review and meta-analysis. Atherosclerosis 2020, 299, 1–8. [Google Scholar] [CrossRef]
- Negida, A.; Menshawy, A.; El Ashal, G.; Elfouly, Y.; Hani, Y.; Hegazy, Y.; El Ghonimy, S.; Fouda, S.; Rashad, Y. Coenzyme Q10 for Patients with Parkinson’s Disease: A Systematic Review and Meta-Analysis. CNS Neurol. Disord. Drug Targets 2016, 15, 45–53. [Google Scholar] [CrossRef]
- Saboori, S.; Rad, E.Y.; Mardani, M.; Khosroshahi, M.Z.; Nouri, Y.; Falahi, E. Effect of Q10 supplementation on body weight and body mass index: A systematic review and meta-analysis of randomized controlled clinical trials. Diabetes Metab. Syndr. 2019, 13, 1179–1185. [Google Scholar] [CrossRef]
- Alehagen, U.; Aaseth, J.; Alexander, J.; Johansson, P.; Larsson, A. Supplemental selenium and coenzyme Q10 reduce glycation along with cardiovascular mortality in an elderly population with low selenium status—A four-year, prospective, randomised, double-blind placebo-controlled trial. J. Trace Elem. Med. Biol. 2020, 61, 126541. [Google Scholar] [CrossRef]
- Kinoshita, T.; Fujii, K. Long-term intake of ubiquinol may improve cognitive performance in community residents. J. Jpn. Assoc. Rural Med. 2019, 68, 8–17. [Google Scholar] [CrossRef][Green Version]
- Takahashi, M.; Kinoshita, T.; Kaneko, T.; Suzuki, T. Investigation of the influence of dietary habits on serum coenzyme Q10 level with long-term CoQ10 supplement intake. J. Wayo Women’s Univ. 2018, 58, 111–118. [Google Scholar] [CrossRef]
- Takahashi, M.; Nagata, M.; Kinoshita, T.; Kaneko, T.; Suzuki, T. CYP7A1, NPC1L1, ABCB1, and CD36 Polymorphisms Are Associated with Increased Serum Coenzyme Q10 after Long-Term Supplementation in Women. Antioxidants 2021, 10, 431. [Google Scholar] [CrossRef] [PubMed]
- Meaney, S. Epigenetic regulation of cholesterol homeostasis. Front. Genet. 2014, 5, 311. [Google Scholar] [CrossRef]
- Sahoo, S.; Aurich, M.K.; Jonsson, J.J.; Thiele, I. Membrane transporters in a human genome-scale metabolic knowledgebase and their implications for disease. Front. Physiol. 2014, 5, 91. [Google Scholar] [CrossRef] [PubMed]
- Takekawa, Y.; Sato, Y.; Yamaki, Y.; Imai, M.; Noto, K.; Sumi, M.; Takekuma, Y.; Iseki, K.; Sugawara, M. An Approach to Improve Intestinal Absorption of Poorly Absorbed Water-Insoluble Components via Niemann-Pick C1-Like 1. Biol. Pharm. Bull. 2016, 39, 301–307. [Google Scholar] [CrossRef]
- Itagaki, S.; Ochiai, A.; Kobayashi, M.; Sugawara, M.; Hirano, T.; Iseki, K. Interaction of coenzyme Q10 with the intestinal drug transporter P-glycoprotein. J. Agric. Food Chem. 2008, 56, 6923–6927. [Google Scholar] [CrossRef]
- Anderson, C.M.; Kazantzis, M.; Wang, J.; Venkatraman, S.; Goncalves, R.L.; Quinlan, C.L.; Ng, R.; Jastroch, M.; Benjamin, D.I.; Nie, B.; et al. Dependence of brown adipose tissue function on CD36-mediated coenzyme Q uptake. Cell Rep. 2015, 10, 505–515. [Google Scholar] [CrossRef]
- Fukuhara, S.; Bito, S.; Green, J.; Hsiao, A.; Kurokawa, K. Translation, adaptation, and validation of the SF-36 Health Survey for use in Japan. J. Clin. Epidemiol. 1998, 51, 1037–1044. [Google Scholar] [CrossRef]
- Fukuhara, S.; Ware, J.E., Jr.; Kosinski, M.; Wada, S.; Gandek, B. Psychometric and clinical tests of validity of the Japanese SF-36 Health Survey. J. Clin. Epidemiol. 1998, 51, 1045–1053. [Google Scholar] [CrossRef]
- Granado-Lorencio, F.; de Las Heras, L.; Millan, C.S.; Garcia-Lopez, F.J.; Blanco-Navarro, I.; Perez-Sacristan, B.; Dominguez, G. β-Cryptoxanthin modulates the response to phytosterols in postmenopausal women carrying NPC1L1 L272L and ABCG8 A632 V polymorphisms: An exploratory study. Genes Nutr. 2014, 9, 428. [Google Scholar] [CrossRef]
- MacKay, D.S.; Eck, P.K.; Gebauer, S.K.; Baer, D.J.; Jones, P.J. CYP7A1-rs3808607 and APOE isoform associate with LDL cholesterol lowering after plant sterol consumption in a randomized clinical trial. Am. J. Clin. Nutr. 2015, 102, 951–957. [Google Scholar] [CrossRef] [PubMed]
- Ramos-Arellano, L.E.; Salgado-Bernabe, A.B.; Guzman-Guzman, I.P.; Salgado-Goytia, L.; Munoz-Valle, J.F.; Parra-Rojas, I. CD36 haplotypes are associated with lipid profile in normal-weight subjects. Lipids Health Dis. 2013, 12, 167. [Google Scholar] [CrossRef] [PubMed]
- Arturo Panduro, O.R. Genetic Variant in the CD36 Gene (rs1761667) is Associated with Higher Fat Intake and High Serum Cholesterol among the Population of West Mexico. J. Nutr. Food Sci. 2015, 5, 353. [Google Scholar] [CrossRef]
- Wang, Y.; Harding, S.V.; Thandapilly, S.J.; Tosh, S.M.; Jones, P.J.H.; Ames, N.P. Barley β-glucan reduces blood cholesterol levels via interrupting bile acid metabolism. Br. J. Nutr. 2017, 118, 822–829. [Google Scholar] [CrossRef] [PubMed]
- Taleb-Belkadi, O.; Chaib, H.; Zemour, L.; Fatah, A.; Chafi, B.; Mekki, K. Lipid profile, inflammation, and oxidative status in peri- and postmenopausal women. Gynecol. Endocrinol. 2016, 32, 982–985. [Google Scholar] [CrossRef] [PubMed]
- Sanchez-Rodriguez, M.A.; Castrejon-Delgado, L.; Zacarias-Flores, M.; Arronte-Rosales, A.; Mendoza-Nunez, V.M. Quality of life among post-menopausal women due to oxidative stress boosted by dysthymia and anxiety. BMC Women’s Health 2017, 17, 1. [Google Scholar] [CrossRef] [PubMed]
- Song, Y.; Liu, J.; Zhao, K.; Gao, L.; Zhao, J. Cholesterol-induced toxicity: An integrated view of the role of cholesterol in multiple diseases. Cell Metab. 2021, 33, 1911–1925. [Google Scholar] [CrossRef]
- Pequeno, N.P.F.; Cabral, N.L.A.; Marchioni, D.M.; Lima, S.C.V.C.; Lyra, C.O. Quality of life assessment instruments for adults: A systematic review of population-based studies. Health Qual. Life Outcomes 2020, 18, 208. [Google Scholar] [CrossRef]
- Hernandez-Camacho, J.D.; Garcia-Corzo, L.; Fernandez-Ayala, D.J.M.; Navas, P.; Lopez-Lluch, G. Coenzyme Q at the Hinge of Health and Metabolic Diseases. Antioxidants 2021, 10, 1785. [Google Scholar] [CrossRef]
- Kannel, W.B.; Wilson, P.W. Risk factors that attenuate the female coronary disease advantage. Arch. Intern. Med. 1995, 155, 57–61. [Google Scholar] [CrossRef]
- Kreisberg, R.A.; Kasim, S. Cholesterol metabolism and aging. Am. J. Med. 1987, 82, 54–60. [Google Scholar] [CrossRef]


| Men (n = 31) | Women (n = 61) | |||||
|---|---|---|---|---|---|---|
| Baseline | After 1 Year | p-Value | Baseline | After 1 Year | p-Value | |
| Age (years) | 64.9 ± 11.3 | — | 64.3 ± 10.4 | — | ||
| BMI (kg/m2) | 23.7 ± 3.0 | — | 23.8 ± 4.5 | — | ||
| TC (mmol/L) | 4.88 ± 0.90 | — | 5.15 ± 0.72 | — | ||
| CoQ10 (µmol/L) | 1.32 ± 0.37 | 5.35 ± 2.12 | 2.7 × 10⁻¹² | 1.07 ± 0.33 | 5.80 ± 1.99 | 1.9 × 10⁻²⁷ |
| SF-36 Scores | ||||||
| PF (Physical functioning) | 50.9 ± 11.0 | 51.2 ± 9.2 | 0.77 | 48.4 ± 9.3 | 47.9 ± 11.2 | 0.58 |
| RP (Role physical) | 50.2 ± 8.7 | 49.5 ± 8.5 | 0.69 | 46.6 ± 11.3 | 49.7 ± 10.1 | 0.066 |
| BP (Bodily pain) | 50.6 ± 9.3 | 48.9 ± 8.9 | 0.42 | 49.1 ± 8.6 | 50.3 ± 7.7 | 0.27 |
| GH (General health) | 50.1 ± 6.6 | 51.5 ± 6.3 | 0.29 | 48.8 ± 6.5 | 49.1 ± 7.7 | 0.62 |
| VT (Vitality) | 52.9 ± 8.4 | 54.7 ± 6.0 | 0.23 | 51.0 ± 8.1 | 53.7 ± 6.9 | 0.007 |
| SF (Social functioning) | 50.5 ± 7.4 | 52.4 ± 7.2 | 0.22 | 48.7 ± 10.1 | 51.2 ± 9.4 | 0.11 |
| RE (Role emotional) | 49.6 ± 9.9 | 50.8 ± 7.2 | 0.39 | 48.2 ± 11.1 | 49.9 ± 9.1 | 0.18 |
| MH (Mental health) | 50.8 ± 8.2 | 52.4 ± 6.5 | 0.29 | 51.2 ± 8.9 | 53.0 ± 7.7 | 0.11 |
| PCS (Physical component summary) | 49.8 ± 9.0 | 48.4 ± 7.7 | 0.33 | 47.1 ± 10.4 | 46.1 ± 10.3 | 0.36 |
| MCS (Mental component summary) | 52.1 ± 7.8 | 54.0 ± 5.7 | 0.18 | 52.3 ± 8.8 | 54.0 ± 7.8 | 0.087 |
| RCS (Role/Social component summary) | 49.1 ± 8.5 | 50.1 ± 8.2 | 0.49 | 47.5 ± 12.8 | 50.4 ± 9.9 | 0.068 |
| GT/TT (n = 42) | GG (n = 19) | p-Value for Interaction | |||||
|---|---|---|---|---|---|---|---|
| Baseline | After 1 Year | (p-Value) | Baseline | After 1 Year | (p-Value) | ||
| Age (years) | 66.7 ± 8.9 | — | 59.2 ± 11.9 | — | |||
| BMI (kg/m2) | 23.5 ± 4.3 | — | 24.5 ± 4.9 | — | |||
| TC (mmol/L) | 5.11 ± 0.77 | — | 5.23 ± 0.62 | — | |||
| CoQ10 (µmol/L) | 1.08 ± 0.36 | 6.13 ± 1.96 | (1.4 × 10⁻²⁰) | 1.03 ± 0.27 | 5.09 ± 1.92 | (2.1 × 10⁻⁸) | 0.060 |
| SF-36 Scores | |||||||
| PF (Physical functioning) | 47.2 ± 9.4 | 46.6 ± 12.1 | (0.60) | 51.1 ± 8.8 | 50.7 ± 8.3 | (0.83) | 0.90 |
| RP (Role physical) | 45.1 ± 10.9 | 48.7 ± 10.3 | (0.10) | 50.0 ± 11.5 | 51.9 ± 9.4 | (0.42) | 0.66 |
| BP (Bodily pain) | 50.0 ± 8.7 | 50.9 ± 7.0 | (0.45) | 47.0 ± 8.3 | 48.7 ± 8.9 | (0.42) | 0.76 |
| GH (General health) | 48.3 ± 6.4 | 48.0 ± 7.6 | (0.78) | 49.8 ± 6.7 | 51.6 ± 7.4 | (0.21) | 0.22 |
| VT (Vitality) | 51.3 ± 7.5 | 53.7 ± 7.5 | (0.052) | 50.2 ± 9.5 | 53.9 ± 5.6 | (0.062) | 0.56 |
| SF (Social functioning) | 49.3 ± 10.1 | 51.6 ± 8.7 | (0.23) | 47.4 ± 10.4 | 50.2 ± 11.1 | (0.28) | 0.90 |
| RE (Role emotional) | 46.2 ± 12.4 | 49.4 ± 9.3 | (0.063) | 52.5 ± 6.1 | 51.2 ± 8.6 | (0.45) | 0.10 |
| MH (Mental health) | 50.9 ± 9.1 | 53.5 ± 7.5 | (0.041) | 52.1 ± 8.7 | 52.0 ± 8.4 | (0.97) | 0.26 |
| PCS (Physical component summary) | 46.3 ± 10.4 | 44.7 ± 10.8 | (0.22) | 48.8 ± 10.4 | 49.3 ± 8.5 | (0.75) | 0.34 |
| MCS (Mental component summary) | 53.3 ± 8.3 | 54.5 ± 7.6 | (0.27) | 50.2 ± 9.8 | 52.7 ± 8.5 | (0.18) | 0.53 |
| RCS (Role/Social component summary) | 46.0 ± 14.4 | 50.4 ± 9.7 | (0.037) | 50.6 ± 7.6 | 50.3 ± 10.6 | (0.90) | 0.17 |
| CC (n = 20) | CG/GG (n = 41) | p-Value for Interaction | |||||
|---|---|---|---|---|---|---|---|
| Baseline | After 1 Year | (p-Value) | Baseline | After 1 Year | (p-Value) | ||
| Age (years) | 66.4 ± 11.2 | — | 63.3 ± 10.0 | — | |||
| BMI (kg/m2) | 22.2 ± 3.3 | — | 24.6 ± 4.8 | — | |||
| TC (mmol/L) | 5.22 ± 0.62 | — | 5.12 ± 0.78 | — | |||
| CoQ10 (µmol/L) | 1.04 ± 0.32 | 5.79 ± 2.13 | (1.4 × 10⁻⁹) | 1.08 ± 0.34 | 5.81 ± 1.95 | (8.9 × 10⁻¹⁹) | 0.96 |
| SF-36 Scores | |||||||
| PF (Physical functioning) | 49.8 ± 7.3 | 48.8 ± 10.4 | (0.56) | 47.7 ± 10.2 | 47.4 ± 11.6 | (0.78) | 0.77 |
| RP (Role physical) | 46.0 ± 11.4 | 50.6 ± 8.8 | (0.17) | 46.9 ± 11.3 | 49.3 ± 10.8 | (0.23) | 0.52 |
| BP (Bodily pain) | 48.6 ± 9.0 | 52.2 ± 8.7 | (0.11) | 49.3 ± 8.5 | 49.3 ± 7.1 | (0.97) | 0.13 |
| GH (General health) | 48.9 ± 9.0 | 50.4 ± 9.2 | (0.21) | 48.7 ± 5.0 | 48.5 ± 6.8 | (0.90) | 0.35 |
| VT (Vitality) | 49.7 ± 8.3 | 54.1 ± 6.5 | (0.034) | 51.6 ± 8.0 | 53.6 ± 7.2 | (0.088) | 0.26 |
| SF (Social functioning) | 47.9 ± 8.6 | 52.2 ± 9.7 | (0.055) | 49.1 ± 10.9 | 50.7 ± 9.4 | (0.44) | 0.42 |
| RE (Role emotional) | 46.8 ± 11.2 | 51.9 ± 7.4 | (0.064) | 48.9 ± 11.2 | 49.0 ± 9.7 | (0.94) | 0.065 |
| MH (Mental health) | 48.8 ± 8.2 | 53.6 ± 6.5 | (0.046) | 52.4 ± 9.1 | 52.7 ± 8.4 | (0.80) | 0.051 |
| PCS (Physical component summary) | 49.1 ± 8.4 | 47.3 ± 11.9 | (0.23) | 46.1 ± 11.2 | 45.5 ± 9.5 | (0.70) | 0.57 |
| MCS (Mental component summary) | 50.6 ± 9.7 | 54.4 ± 8.0 | (0.039) | 53.1 ± 8.4 | 53.7 ± 7.8 | (0.59) | 0.11 |
| RCS (Role/Social component summary) | 45.8 ± 14.5 | 51.3 ± 8.8 | (0.062) | 48.3 ± 12.0 | 49.9 ± 10.5 | (0.40) | 0.24 |
| GG (n = 13) | GT/TT (n = 48) | p-Value for Interaction | |||||
|---|---|---|---|---|---|---|---|
| Baseline | After 1 Year | (p-Value) | Baseline | After 1 Year | (p-Value) | ||
| Age (years) | 60.9 ± 12.7 | — | 65.3 ± 9.6 | — | |||
| BMI (kg/m2) | 24.7 ± 6.2 | — | 23.6 ± 3.9 | — | |||
| TC (mmol/L) | 4.94 ± 0.66 | — | 5.20 ± 0.74 | — | |||
| CoQ10 (µmol/L) | 1.11 ± 0.36 | 5.85 ± 1.63 | (1.4 × 10⁻⁷) | 1.05 ± 0.33 | 5.79 ± 2.09 | (5.8 × 10⁻²¹) | 0.99 |
| SF-36 Scores | |||||||
| PF (Physical functioning) | 47.0 ± 13.0 | 46.7 ± 15.2 | (0.90) | 48.8 ± 8.2 | 48.2 ± 10.0 | (0.58) | 0.88 |
| RP (Role physical) | 46.0 ± 11.6 | 50.7 ± 6.9 | (0.082) | 46.8 ± 11.3 | 49.4 ± 10.9 | (0.19) | 0.61 |
| BP (Bodily pain) | 49.7 ± 8.7 | 49.2 ± 8.6 | (0.87) | 48.9 ± 8.7 | 50.5 ± 7.5 | (0.15) | 0.43 |
| GH (General health) | 50.7 ± 7.2 | 51.5 ± 7.9 | (0.60) | 48.2 ± 6.2 | 48.5 ± 7.6 | (0.76) | 0.79 |
| VT (Vitality) | 53.8 ± 7.2 | 56.9 ± 6.5 | (0.059) | 50.2 ± 8.2 | 52.9 ± 6.8 | (0.030) | 0.88 |
| SF (Social functioning) | 52.0 ± 9.0 | 51.0 ± 11.2 | (0.74) | 47.8 ± 10.3 | 51.2 ± 9.0 | (0.058) | 0.24 |
| RE (Role emotional) | 49.7 ± 10.5 | 51.7 ± 6.7 | (0.48) | 47.8 ± 11.4 | 49.5 ± 9.6 | (0.25) | 0.93 |
| MH (Mental health) | 53.6 ± 8.6 | 54.0 ± 7.7 | (0.83) | 50.6 ± 9.0 | 52.7 ± 7.8 | (0.10) | 0.52 |
| PCS (Physical component summary) | 44.6 ± 12.7 | 45.2 ± 12.8 | (0.81) | 47.7 ± 9.8 | 46.4 ± 9.6 | (0.24) | 0.45 |
| MCS (Mental component summary) | 55.9 ± 9.1 | 56.3 ± 9.2 | (0.87) | 51.3 ± 8.6 | 53.3 ± 7.4 | (0.075) | 0.47 |
| RCS (Role/Social component summary) | 48.8 ± 11.9 | 50.8 ± 8.6 | (0.58) | 47.1 ± 13.1 | 50.2 ± 10.3 | (0.082) | 0.76 |
| GA/AA (n = 29) | GG (n = 32) | p-Value for Interaction | |||||
|---|---|---|---|---|---|---|---|
| Baseline | After 1 Year | (p-Value) | Baseline | After 1 Year | (p-Value) | ||
| Age (years) | 63.0 ± 10.5 | — | 65.5 ± 10.3 | — | |||
| BMI (kg/m2) | 24.0 ± 4.3 | — | 23.7 ± 4.7 | — | |||
| TC (mmol/L) | 5.23 ± 0.76 | — | 5.08 ± 0.70 | — | |||
| CoQ10 (µmol/L) | 1.08 ± 0.31 | 5.85 ± 2.22 | (1.2 × 10⁻¹²) | 1.05 ± 0.36 | 5.76 ± 1.79 | (5.4 × 10⁻¹⁶) | 0.91 |
| SF-36 Scores | |||||||
| PF (Physical functioning) | 50.2 ± 8.7 | 51.4 ± 9.2 | (0.39) | 46.8 ± 9.7 | 44.7 ± 12.0 | (0.14) | 0.098 |
| RP (Role physical) | 45.7 ± 12.2 | 52.8 ± 7.4 | (0.003) | 47.5 ± 10.5 | 46.9 ± 11.4 | (0.78) | 0.016 |
| BP (Bodily pain) | 49.1 ± 7.3 | 51.8 ± 6.5 | (0.14) | 49.0 ± 9.7 | 48.9 ± 8.4 | (0.93) | 0.21 |
| GH (General health) | 49.0 ± 6.8 | 50.6 ± 7.5 | (0.16) | 48.5 ± 6.2 | 47.8 ± 7.7 | (0.54) | 0.15 |
| VT (Vitality) | 50.7 ± 9.3 | 54.7 ± 6.9 | (0.026) | 51.2 ± 6.9 | 52.9 ± 6.9 | (0.13) | 0.25 |
| SF (Social functioning) | 49.4 ± 9.8 | 52.6 ± 7.3 | (0.11) | 48.1 ± 10.5 | 49.9 ± 11.0 | (0.44) | 0.67 |
| RE (Role emotional) | 47.6 ± 11.7 | 50.1 ± 9.5 | (0.26) | 48.7 ± 10.8 | 49.8 ± 8.8 | (0.47) | 0.58 |
| MH (Mental health) | 49.6 ± 10.4 | 54.0 ± 7.5 | (0.015) | 52.8 ± 7.1 | 52.1 ± 8.0 | (0.60) | 0.017 |
| PCS (Physical component summary) | 48.7 ± 11.4 | 49.5 ± 9.0 | (0.60) | 45.6 ± 9.3 | 43.1 ± 10.5 | (0.080) | 0.11 |
| MCS (Mental component summary) | 51.6 ± 9.1 | 54.1 ± 7.3 | (0.13) | 53.0 ± 8.6 | 53.8 ± 8.4 | (0.43) | 0.37 |
| RCS (Role/Social component summary) | 46.6 ± 14.0 | 50.9 ± 9.3 | (0.060) | 48.3 ± 11.8 | 49.8 ± 10.6 | (0.48) | 0.37 |
| Group 1 (n = 32) | Group 2 (n = 29) | p-Value for Interaction | |||||
|---|---|---|---|---|---|---|---|
| Baseline | After 1 Year | (p-Value) | Baseline | After 1 Year | (p-Value) | ||
| Age (years) | 65.8 ± 10.5 | — | 62.7 ± 10.2 | — | |||
| BMI (kg/m2) | 23.5 ± 4.4 | — | 24.1 ± 4.6 | — | |||
| TC (mmol/L) | 5.19 ± 0.72 | — | 5.10 ± 0.74 | — | |||
| CoQ10 (µmol/L) | 1.13 ± 0.37 | 6.48 ± 1.99 | (1.6 × 10⁻¹⁶) | 0.99 ± 0.28 | 5.05 ± 1.73 | (4.3 × 10⁻¹³) | 0.008 |
| SF-36 Scores | |||||||
| PF (Physical functioning) | 48.6 ± 10.0 | 49.0 ± 11.8 | (0.78) | 48.2 ± 8.8 | 46.6 ± 10.5 | (0.27) | 0.32 |
| RP (Role physical) | 44.6 ± 12.1 | 50.6 ± 9.6 | (0.017) | 48.8 ± 10.0 | 48.7 ± 10.7 | (0.96) | 0.064 |
| BP (Bodily pain) | 49.6 ± 8.6 | 52.2 ± 7.4 | (0.12) | 48.5 ± 8.7 | 48.1 ± 7.5 | (0.78) | 0.17 |
| GH (General health) | 49.3 ± 7.6 | 51.2 ± 8.3 | (0.042) | 48.1 ± 5.0 | 46.8 ± 6.2 | (0.33) | 0.045 |
| VT (Vitality) | 51.4 ± 7.2 | 54.6 ± 7.2 | (0.035) | 50.5 ± 9.0 | 52.8 ± 6.5 | (0.099) | 0.71 |
| SF (Social functioning) | 50.7 ± 7.9 | 53.4 ± 7.1 | (0.12) | 46.4 ± 11.8 | 48.7 ± 11.1 | (0.40) | 0.90 |
| RE (Role emotional) | 46.2 ± 13.0 | 51.1 ± 9.2 | (0.016) | 50.4 ± 8.2 | 48.6 ± 8.9 | (0.22) | 0.008 |
| MH (Mental health) | 50.1 ± 8.7 | 54.3 ± 6.4 | (0.009) | 52.5 ± 9.0 | 51.6 ± 8.9 | (0.56) | 0.019 |
| PCS (Physical component summary) | 47.2 ± 10.5 | 47.2 ± 10.9 | (0.95) | 46.9 ± 10.5 | 44.9 ± 9.6 | (0.19) | 0.30 |
| MCS (Mental component summary) | 53.2 ± 8.8 | 55.4 ± 7.2 | (0.12) | 51.3 ± 8.9 | 52.4 ± 8.4 | (0.43) | 0.56 |
| RCS (Role/Social component summary) | 45.9 ± 14.5 | 51.1 ± 8.6 | (0.026) | 49.2 ± 10.7 | 49.6 ± 11.3 | (0.85) | 0.13 |
Publisher’s Note: MDPI stays neutral with regard to jurisdictional claims in published maps and institutional affiliations. |
© 2022 by the authors. Licensee MDPI, Basel, Switzerland. This article is an open access article distributed under the terms and conditions of the Creative Commons Attribution (CC BY) license (https://creativecommons.org/licenses/by/4.0/).
Share and Cite
Takahashi, M.; Kinoshita, T.; Maruyama, K.; Suzuki, T. CYP7A1, NPC1L1, ABCB1, and CD36 Polymorphisms Associated with Coenzyme Q10 Availability Affect the Subjective Quality of Life Score (SF-36) after Long-Term CoQ10 Supplementation in Women. Nutrients 2022, 14, 2579. https://doi.org/10.3390/nu14132579
Takahashi M, Kinoshita T, Maruyama K, Suzuki T. CYP7A1, NPC1L1, ABCB1, and CD36 Polymorphisms Associated with Coenzyme Q10 Availability Affect the Subjective Quality of Life Score (SF-36) after Long-Term CoQ10 Supplementation in Women. Nutrients. 2022; 14(13):2579. https://doi.org/10.3390/nu14132579
Chicago/Turabian StyleTakahashi, Michiyo, Tetsu Kinoshita, Koutatsu Maruyama, and Toshikazu Suzuki. 2022. "CYP7A1, NPC1L1, ABCB1, and CD36 Polymorphisms Associated with Coenzyme Q10 Availability Affect the Subjective Quality of Life Score (SF-36) after Long-Term CoQ10 Supplementation in Women" Nutrients 14, no. 13: 2579. https://doi.org/10.3390/nu14132579
APA StyleTakahashi, M., Kinoshita, T., Maruyama, K., & Suzuki, T. (2022). CYP7A1, NPC1L1, ABCB1, and CD36 Polymorphisms Associated with Coenzyme Q10 Availability Affect the Subjective Quality of Life Score (SF-36) after Long-Term CoQ10 Supplementation in Women. Nutrients, 14(13), 2579. https://doi.org/10.3390/nu14132579