
Plasma Fatty Acids Pattern and Dry Eye Disease in the Elderly: The Montrachet Population-Based Study

 , ,
, ,  , , , , and
Abstract
1. Introduction
2. Methods
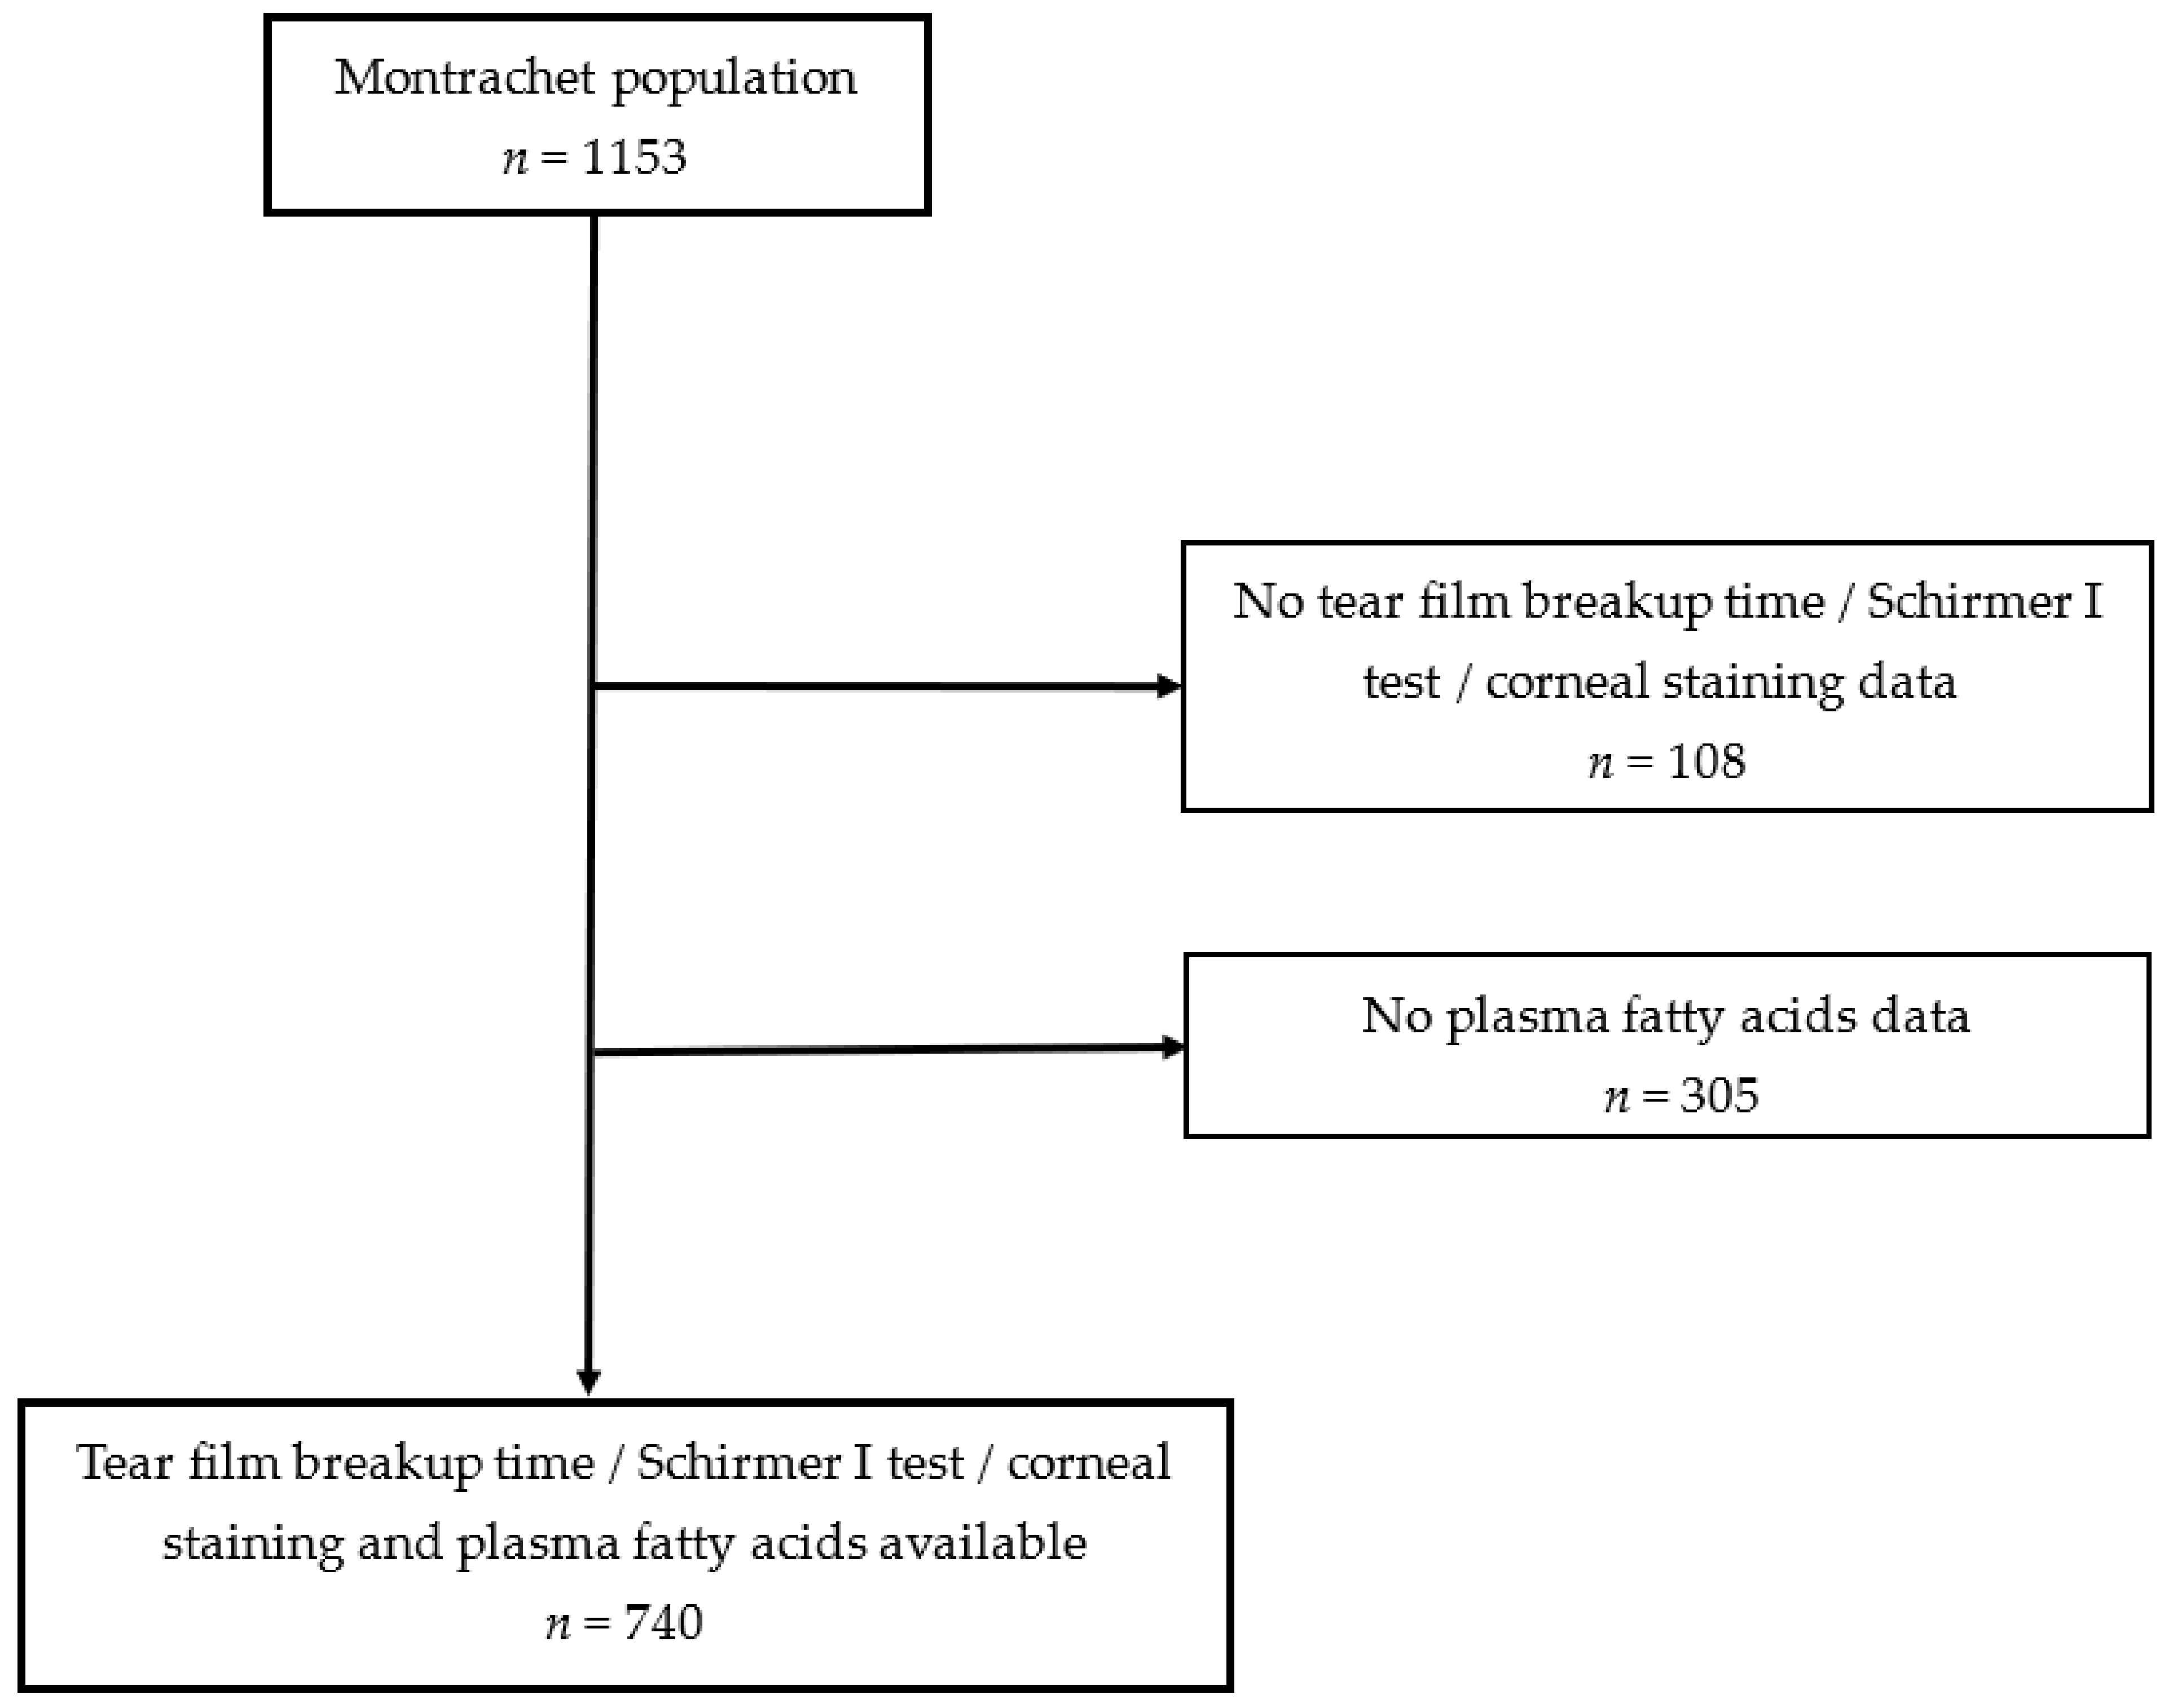
2.1. Population Study
2.2. DED Evaluation and Definition
2.3. Plasma Lipids Measurement
2.4. Statistics
3. Results
3.1. Demographic, Lifestyle and Clinical Characteristics of Participants
3.2. Plasma Fatty Acids and DED
3.3. Demographic, Lifestyle and Medical Characteristics, DED and FAs Pattern Scores
4. Discussion
5. Conclusions
Supplementary Materials
Author Contributions
Funding
Institutional Review Board Statement
Informed Consent Statement
Data Availability Statement
Acknowledgments
Conflicts of Interest
References
- Schaumberg, D.A.; Sullivan, D.A.; Buring, J.E.; Dana, M.R. Prevalence of dry eye syndrome among US women. Am. J. Ophthalmol. 2003, 136, 318–326. [Google Scholar] [CrossRef]
- Schaumberg, D.A.; Dana, R.; Buring, J.E.; Sullivan, D.A. Prevalence of dry eye disease among US men: Estimates from the Physicians’ Health Studies. Arch. Ophthalmol. 2009, 127, 763–768. [Google Scholar] [CrossRef] [PubMed]
- Moss, S.E.; Klein, R.; Klein, B.E. Prevalence of and risk factors for dry eye syndrome. Arch. Ophthalmol. 2000, 118, 1264–1268. [Google Scholar] [CrossRef] [PubMed]
- Schein, O.D.; Muñoz, B.; Tielsch, J.M.; Bandeen-Roche, K.; West, S. Prevalence of dry eye among the elderly. Am. J. Ophthalmol. 1997, 124, 723–728. [Google Scholar] [CrossRef]
- Lee, A.J.; Lee, J.; Saw, S.-M.; Gazzard, G.; Koh, D.; Widjaja, D.; Tan, D.T. Prevalence and risk factors associated with dry eye symptoms: A population based study in Indonesia. Br. J. Ophthalmol. 2002, 86, 1347–1351. [Google Scholar] [CrossRef]
- Ferrero, A.; Alassane, S.; Binquet, C.; Bretillon, L.; Acar, N.; Arnould, L.; Muselier-Mathieu, A.; Delcourt, C.; Bron, A.M.; Creuzot-Garcher, C. Dry eye disease in the elderly in a French population-based study (the Montrachet study: Maculopathy, Optic Nerve, nuTRition, neurovAsCular and HEarT diseases): Prevalence and associated factors. Ocul. Surf. 2018, 16, 112–119. [Google Scholar] [CrossRef]
- Miljanović, B.; Dana, R.; Sullivan, D.A.; Schaumberg, D.A. Impact of dry eye syndrome on vision-related quality of life. Am. J. Ophthalmol. 2007, 143, 409–415. [Google Scholar] [CrossRef]
- The epidemiology of dry eye disease: Report of the Epidemiology Subcommittee of the International Dry Eye WorkShop. Ocul. Surf. 2007, 5, 93–107. [CrossRef]
- Maïssa, C.; Guillon, M. Tear film dynamics and lipid layer characteristics-effect of age and gender. Cont. Lens Anterior Eye 2010, 33, 176–182. [Google Scholar] [CrossRef]
- Uchino, Y.; Kawakita, T.; Miyazawa, M.; Ishii, T.; Onouchi, H.; Yasuda, K.; Ogawa, Y.; Shimmura, S.; Ishii, N.; Tsubota, K. Oxidative stress induced inflammation initiates functional decline of tear production. PLoS ONE 2012, 7, e45805. [Google Scholar] [CrossRef]
- Seen, S.; Tong, L. Dry eye disease and oxidative stress. Acta Ophthalmol. 2018, 96, e412–e420. [Google Scholar] [CrossRef] [PubMed]
- Stevenson, W.; Chauhan, S.K.; Dana, R. Dry eye disease: An immune-mediated ocular surface disorder. Arch. Ophthalmol. 2012, 130, 90–100. [Google Scholar] [CrossRef] [PubMed]
- SanGiovanni, J.P.; Chew, E.Y. The role of omega-3 long-chain polyunsaturated fatty acids in health and disease of the retina. Prog. Retin. Eye Res. 2005, 24, 87–138. [Google Scholar] [CrossRef] [PubMed]
- Merle, B.M.J.; Benlian, P.; Puche, N.; Bassols, A.; Delcourt, C.; Souied, E.H. Circulating omega-3 Fatty acids and neovascular age-related macular degeneration. Investig. Ophthalmol. Vis. Sci. 2014, 55, 2010–2019. [Google Scholar] [CrossRef]
- Li, Z.; Choi, J.-H.; Oh, H.-J.; Park, S.-H.; Lee, J.-B.; Yoon, K.C. Effects of eye drops containing a mixture of omega-3 essential fatty acids and hyaluronic acid on the ocular surface in desiccating stress-induced murine dry eye. Curr. Eye Res. 2014, 39, 871–878. [Google Scholar] [CrossRef]
- Rand, A.L.; Asbell, P.A. Nutritional supplements for dry eye syndrome. Curr. Opin. Ophthalmol. 2011, 22, 279–282. [Google Scholar] [CrossRef]
- Jones, L.; Downie, L.E.; Korb, D.; Benitez-Del-Castillo, J.M.; Dana, R.; Deng, S.X.; Dong, P.N.; Geerling, G.; Hida, R.Y.; Liu, Y.; et al. TFOS DEWS II Management and Therapy Report. Ocul. Surf. 2017, 15, 575–628. [Google Scholar]
- Miljanović, B.; Trivedi, K.A.; Dana, M.R.; Gilbard, J.P.; Buring, J.E.; Schaumberg, D.A. The relationship between dietary n-3 and n-6 fatty acids and clinically diagnosed dry eye syndrome in women. Am. J. Clin. Nutr. 2005, 82, 887–893. [Google Scholar] [CrossRef]
- Barabino, S.; Horwath-Winter, J.; Messmer, E.M.; Rolando, M.; Aragona, P.; Kinoshita, S. The role of systemic and topical fatty acids for dry eye treatment. Prog. Retin. Eye Res. 2017, 61, 23–34. [Google Scholar] [CrossRef]
- Aragona, P.; Bucolo, C.; Spinella, R.; Giuffrida, S.; Ferreri, G. Systemic omega-6 essential fatty acid treatment and pge1 tear content in Sjögren’s syndrome patients. Investig. Ophthalmol. Vis. Sci. 2005, 46, 4474–4479. [Google Scholar] [CrossRef]
- 3C Study Group. Vascular factors and risk of dementia: Design of the Three-City Study and baseline characteristics of the study population. Neuroepidemiology 2003, 22, 316–325. [Google Scholar] [CrossRef] [PubMed]
- Creuzot-Garcher, C.; Binquet, C.; Daniel, S.; Bretillon, L.; Acar, N.; de Lazzer, A.; Arnould, L.; Tzourio, C.; Bron, A.M.; Delcourt, C. The Montrachet Study: Study design, methodology and analysis of visual acuity and refractive errors in an elderly population. Acta Ophthalmol. 2016, 94, e90–e97. [Google Scholar] [CrossRef] [PubMed]
- Lemp, M.A.; Foulks, G.N. The definition and classification of dry eye disease: Report of the Definition and Classification Subcommittee of the International Dry Eye WorkShop. Ocul. Surf. 2007, 5, 75–92. [Google Scholar]
- Nichols, K.K.; Nichols, J.J.; Mitchell, G.L. The lack of association between signs and symptoms in patients with dry eye disease. Cornea 2004, 23, 762–770. [Google Scholar] [CrossRef]
- Alves, M.; Reinach, P.S.; Paula, J.S.; Vellasco e Cruz, A.A.; Bachette, L.; Faustino, J.; Aranha, F.P.; Vigorito, A.; de Souza, C.A.; Rocha, E.M. Comparison of diagnostic tests in distinct well-defined conditions related to dry eye disease. PLoS ONE 2014, 9, e97921. [Google Scholar] [CrossRef]
- Moilanen, T.; Nikkari, T. The effect of storage on the fatty acid composition of human serum. Clin. Chim. Acta 1981, 114, 111–116. [Google Scholar] [CrossRef]
- Morrison, W.R.; Smith, L.M. Preparation of fatty acid methyl esters and dimethylacetals from lipids with boron fluoride--methanol. J. Lipid Res. 1964, 5, 600–608. [Google Scholar] [CrossRef]
- Bertrand, F.; Maumy, M.; Meyer, N. plsRglm, modèles linéaires généralisés PLS sous R. Chimiometrie 2009, 2009, 52–54. [Google Scholar]
- Hoffmann, K.; Schulze, M.B.; Schienkiewitz, A.; Nöthlings, U.; Boeing, H. Application of a new statistical method to derive dietary patterns in nutritional epidemiology. Am. J. Epidemiol. 2004, 159, 935–944. [Google Scholar] [CrossRef]
- Kabir, A.; Rahman, M.J.; Shamim, A.A.; Klemm, R.D.W.; Labrique, A.B.; Rashid, M.; Christian, P.; West, K.P., Jr. Identifying maternal and infant factors associated with newborn size in rural Bangladesh by partial least squares (PLS) regression analysis. PLoS ONE 2017, 12, e0189677. [Google Scholar] [CrossRef]
- Bastien, P.; Vinzi, V.E.; Tenenhaus, M. PLS generalised linear regression. Comput. Stat. Data Anal. 2005, 48, 17–46. [Google Scholar] [CrossRef]
- Lo, Y.-L.; Pan, W.-H.; Hsu, W.-L.; Chien, Y.-C.; Chen, J.-Y.; Hsu, M.-M.; Lou, P.J.; Chen, I.H.; Hildesheim, A.; Chen, C.J. Partial Least Square Discriminant Analysis Discovered a Dietary Pattern Inversely Associated with Nasopharyngeal Carcinoma Risk. PLoS ONE 2016, 11, e0155892. [Google Scholar] [CrossRef] [PubMed]
- Amadieu, C.; Lefèvre-Arbogast, S.; Delcourt, C.; Dartigues, J.-F.; Helmer, C.; Féart, C.; Samieri, C. Nutrient biomarker patterns and long-term risk of dementia in older adults. Alzheimers Dement. 2017, 13, 1125–1132. [Google Scholar] [CrossRef] [PubMed]
- Acar, N.; Merle, B.; Ajana, S.; He, Z.; Grégoire, S.; Hejblum, B.P.; Martine, L.; Buaud, B.; Bron, A.M.; Creuzot-Garcher, C.P.; et al. Predicting the Retinal Content in Omega-3 Fatty Acids for Age-Related Macular-Degeneration. Clin. Transl. Med. 2021, 11, e404. [Google Scholar] [CrossRef] [PubMed]
- Merle, B.; Delyfer, M.N.; Korobelnik, J.F.; Rougier, M.B.; Malet, F.; Féart, C.; Le Goff, M.; Peuchant, E.; Letenneur, L.; Dartigues, J.F.; et al. High Concentrations of Plasma N3 Fatty Acids Are Associated with Decreased Risk for Late Age-Related Macular Degeneration. J. Nutr. 2013, 4, 505–511. [Google Scholar] [CrossRef]
- Simon, E.; Bardet, B.; Grégoire, S.; Acar, N.; Bron, A.M.; Creuzot-Garcher, C.P.; Bretillon, L. Decreasing dietary linoleic acid promotes long chain omega-3 fatty acid incorporation into rat retina and modifies gene expression. Exp. Eye Res. 2011, 93, 628–635. [Google Scholar] [CrossRef]
- Van Leeuwen, E.M.; Emri, E.; Merle, B.M.J.; Colijn, J.M.; Kersten, E.; Cougnard-Gregoire, A.; Dammeier, S.; Meester-Smoor, M.; Pool, F.M.; de Jong, E.K.; et al. A new perspective on lipid research in age-related macular degeneration. Prog. Retin. Eye Res. 2018, 67, 56–86. [Google Scholar] [CrossRef]
- Schnebelen, C.; Grégoire, S.; Pasquis, B.; Joffre, C.; Creuzot-Garcher, C.P.; Bron, A.M.; Bretillon, L.; Acar, N. Dietary n-3 and n-6 PUFA enhance DHA incorporation in retinal phospholipids without affecting PGE(1) and PGE (2) levels. Lipids 2009, 44, 465–470. [Google Scholar] [CrossRef]
- Schnebelen, C.; Viau, S.; Grégoire, S.; Joffre, C.; Creuzot-Garcher, C.P.; Bron, A.M.; Bretillon, L.; Acar, N. Nutrition for the eye: Different susceptibility of the retina and the lacrimal gland to dietary omega-6 and omega-3 polyunsaturated fatty acid incorporation. Ophthalmic Res. 2009, 41, 216–224. [Google Scholar] [CrossRef]
- Baudouin, C.; Murat, I.; Messmer, E.; Benítez-Del-Castillo, J.M.; Bonini, S.; Figueiredo, F.C.; Geerling, G.; Labetoulle, M.; Lemp, M.; Rolando, M.; et al. Clinical Impact of Inflammation in Dry Eye Disease: Proceedings of the ODISSEY Group Meeting. Acta Ophthalmol. 2018, 96, 111–119. [Google Scholar] [CrossRef]
- Dry Eye Assessment and Management Study Research Group; Asbell, P.A.; Maguire, M.G.; Peskin, E.; Bunya, V.Y.; Kuklinksi, E.J. n-3 Fatty Acid Supplementation for the Treatment of Dry Eye Disease. N. Engl. J. Med. 2018, 378, 1681–1690. [Google Scholar] [CrossRef] [PubMed]
- Gorusupudi, A.; Nelson, K.; Bernstein, P.S. The Age-Related Eye Disease 2 Study: Micronutrients in the Treatment of Macular Degeneration. Adv. Nutr. 2017, 8, 40–53. [Google Scholar] [CrossRef] [PubMed]
- Creuzot, C.; Passemard, M.; Viau, S.; Joffre, C.; Pouliquen, P.; Elena, P.P.; Pouliquen, P.; Baudouin, C.; Bron, A.M. Improvement of dry eye symptoms with polyunsaturated fatty acids. J. Fr. Ophtalmol. 2006, 29, 868–873. [Google Scholar] [CrossRef]
- Viau, S.; Maire, M.-A.; Pasquis, B.; Grégoire, S.; Acar, N.; Bron, A.M.; Bretillon, L.; Creuzot-Garcher, C.P.; Joffre, C. Efficacy of a 2-month dietary supplementation with polyunsaturated fatty acids in dry eye induced by scopolamine in a rat model. Graefes Arch. Clin. Exp. Ophthalmol. 2009, 247, 1039–1050. [Google Scholar] [CrossRef] [PubMed]
- Barabino, S.; Rolando, M.; Camicione, P.; Ravera, G.; Zanardi, S.; Giuffrida, S.; Calabria, S. Systemic linoleic and gamma-linolenic acid therapy in dry eye syndrome with an inflammatory component. Cornea 2003, 22, 97–101. [Google Scholar] [CrossRef] [PubMed]
- Sheppard, J.D.; Singh, R.; McClellan, A.J.; Weikert, M.P.; Scoper, S.V.; Joly, T.J.; Whitley, W.O.; Kakkar, E.; Pflugfelder, S.C. Long-term Supplementation With n-6 and n-3 PUFAs Improves Moderate-to-Severe Keratoconjunctivitis Sicca: A Randomized Double-Blind Clinical Trial. Cornea 2013, 32, 1297–1304. [Google Scholar] [CrossRef] [PubMed]
- Sergeant, S.; Rahbar, E.; Chilton, F.H. Gamma-linolenic acid, Dihommo-gamma linolenic, Eicosanoids and Inflammatory Processes. Eur. J. Pharmacol. 2016, 785, 77–86. [Google Scholar] [CrossRef]
- Calder, P.C.; Ahluwalia, N.; Brouns, F.; Buetler, T.; Clement, K.; Cunningham, K.; Esposito, K.; Jönsson, L.S.; Kolb, H.; Lansink, M.; et al. Dietary factors and low-grade inflammation in relation to overweight and obesity. Br. J. Nutr. 2011, 106 (Suppl. 3), S5–S78. [Google Scholar] [CrossRef]
- Fernández-Real, J.-M.; Broch, M.; Vendrell, J.; Ricart, W. Insulin resistance, inflammation, and serum fatty acid composition. Diabetes Care 2003, 26, 1362–1368. [Google Scholar] [CrossRef]
- Perreault, M.; Roke, K.; Badawi, A.; Nielsen, D.E.; Abdelmagid, S.A.; El-Sohemy, A.; Ma, D.W.; Mutch, D.M. Plasma levels of 14:0, 16:0, 16:1n-7, and 20:3n-6 are positively associated, but 18:0 and 18:2n-6 are inversely associated with markers of inflammation in young healthy adults. Lipids 2014, 49, 255–263. [Google Scholar] [CrossRef]
- Baugé, C.; Lhuissier, E.; Girard, N.; Quesnelle, C.; Ewert, G.; Boumediene, K. Anti-inflammatory effects of an injectable copolymer of fatty acids (Ara 3000 beta®) in joint diseases. J. Inflamm. 2015, 12, 17. [Google Scholar] [CrossRef] [PubMed][Green Version]


| Non-Participants (n = 413) | Participants (n = 740) | ||
|---|---|---|---|
| p-Value | |||
| Age, years | |||
| <80 | 144 (34.9) | 256 (34.6) | 0.134 |
| 80–85 | 161 (39.0) | 325 (43.9) | |
| >85 | 108 (26.1) | 159 (21.5) | |
| Sex, female | 259 (62.7) | 464 (62.7) | 0.997 |
| Body Mass Index, ≥25 kg/m2 | 210 (50.8) | 345 (46.6) | 0.168 |
| Smoking status, former and current smokers | 129 (32.1) | 261 (35.7) | 0.220 |
| Alcohol consumption, yes | 21 (6.0) | 43 (6.5) | 0.755 |
| Education level | |||
| No education or primary school | 112 (27.2) | 212 (28.6) | 0.346 |
| Short secondary school | 63 (15.3) | 97 (13.1) | |
| Long secondary school | 65 (15.8) | 142 (19.3) | |
| Post-secondary or university | 172 (41.7) | 289 (39.0) | |
| Sun protection | |||
| Never | 32 (7.8) | 83 (11.2) | 0.075 |
| Occasionally | 103 (25.2) | 155 (20.9) | |
| Often | 274 (67.0) | 501 (67.9) | |
| Best-corrected visual acuity, <20/60 | 12 (2.9) | 18 (2.4) | 0.628 |
| Central corneal thickness, µm | 555.7 (35.6) | 554.0 (34.9) | 0.446 |
| Iris color | |||
| Blue/Gray | 161 (39.0) | 304 (41.1) | 0.413 |
| Green/Brown | 139 (33.7) | 221 (29.9) | |
| Dark Brown | 113 (27.3) | 215 (29.0) | |
| Medical history a | |||
| Systemic hypertension | 226 (54.7) | 448 (60.5) | 0.054 |
| Diabetes | 33 (9.4) | 60 (9.0) | 0.858 |
| Ocular history a | |||
| Age-related macular degeneration | 12 (3.2) | 28 (4.0) | 0.477 |
| Diabetic retinopathy | 2 (0.5) | 7 (0.9) | 0.393 |
| Glaucoma | 50 (12.1) | 87 (11.8) | 0.849 |
| Ocular hypertension | 16 (3.8) | 22 (3.0) | 0.411 |
| Cataract extraction | 206 (50.2) | 361 (48.8) | 0.635 |
| Systemic drugs | |||
| Antihypertensives | 210 (59.7) | 405 (60.9) | 0.699 |
| Diuretics | 59 (14.3) | 99 (13.4) | 0.667 |
| Beta-blockers | 95 (23.0) | 177 (23.9) | 0.725 |
| Calcium antagonists | 59 (14.3) | 103 (13.9) | 0.864 |
| Anxiolytics | 50 (12.1) | 88 (11.9) | 0.914 |
| Global psychotropics | 103 (24.9) | 184 (24.9) | 0.978 |
| Antihistamines | 21 (5.6) | 37 (5.0) | 0.949 |
| Decongestants and antiallergics agents | 3 (0.7) | 11 (1.5) | 0.258 |
| Lipid-lowering drugs | 133 (37.8) | 291 (43.7) | 0.066 |
| Topical treatment | |||
| Artificial tears | 55 (13.3) | 91 (12.3) | 0.617 |
| IOP-lowering agents | |||
| Preserved eye drops | 41 (9.9) | 62 (8.4) | 0.567 |
| Non-preserved eye drops | 7 (1.7) | 10 (1.3) | |
| Antihistamine eye drops | 55 (13.3) | 91 (12.3) | 0.617 |
| Other eye drops | 4 (1.0) | 7 (0.9) | 0.969 |
| Plasma lipids, mmol/L mean (SD) | |||
| Total cholesterol | 5.81 (0.9) | 5.79 (0.9) | 0.665 |
| LDL cholesterol | 3.60 (0.8) | 3.59 (0.8) | 0.910 |
| HDL cholesterol | 1.67 (0.4) | 1.66 (0.4) | 0.774 |
| Triglycerides | 1.19 (0.5) | 1.16 (0.5) | 0.779 |
| Dry Eye Disease | |||||||
|---|---|---|---|---|---|---|---|
| No (n = 481) | Yes (n = 259) | p-Value | OR (95% CI) b | p-Value | |||
| Age, y | |||||||
| <80 | 175 (36.4) | 81 (31.3) | 0.304 | 1.00 (reference) | |||
| 80–85 | 202 (42.0) | 123 (47.4) | 1.32 (0.93–1.86) c | 0.117 | |||
| >85 | 104 (21.6) | 55 (21.3) | 1.15 (0.76–1.75) c | 0.509 | |||
| Sex, female vs. male | 305 (63.4) | 159 (61.3) | 0.587 | 0.91 (0.67–1.25) d | 0.572 | ||
| Body Mass Index (≥25 kg/m2) | 220 (45.7) | 125 (48.3) | 0.511 | 1.12 (0.82-1.52) | 0.470 | ||
| Smoking status, former and current smokers | 167 (35.2) | 94 (36.7) | 0.674 | 1.06 (0.74–1.51) | 0.742 | ||
| Alcohol consumption, yes | 25 (5.2) | 18 (6.9) | 0.715 | 1.03 (0.53–2.00) | 0.920 | ||
| Education level | 0.157 | ||||||
| No education or primary school | 140 (29.1) | 72 (27.9) | 1.09 (0.75–1.60) | 0.651 | |||
| Short secondary school | 54 (11.2) | 43 (16.6) | 1.75 (1.09–2.8) | 0.020 | |||
| Long secondary school | 90 (18.7) | 52 (20.0) | 1.25 (0.81–1.91) | 0.310 | |||
| High school or university | 197 (41.0) | 92 (35.5) | 1.00 (reference) | ||||
| Sun protection | 0.584 | ||||||
| Never | 56 (11. 6) | 27 (10.4) | 0.85 (0.52–1.39) | 0.523 | |||
| Occasionally | 105 (21.9) | 50 (19.3) | 0.82 (0.58–1.25) | 0.408 | |||
| Often | 319 (66.5) | 182 (70.3) | 1.00 (reference) | ||||
| Best-corrected visual acuity, <20/60 | 12 (2.5) | 6 (2.3) | 0.881 | 0.84 (0.31–2.29) | 0.733 | ||
| Central corneal thickness, µm | 555.6 (32.7) | 551.2 (38.6) | 0.101 | 0.99 (0.99–1.00) | 0.136 | ||
| Iris color | <0.0001 | ||||||
| Green/Brown | 145 (31.1) | 76 (29.3) | 1.44 (0.98–2.09) | 0.059 | |||
| Dark brown | 114 (23.7) | 101 (39.0) | 2.45 (1.69–3.55) | <0.0001 | |||
| Blue | 222 (46.1) | 82 (31.7) | 1.00 (reference) | ||||
| Medical history a | |||||||
| Systemic hypertension | 280 (58.2) | 168 (64.9) | 0.077 | 1.29 (0.94–1.79) | 0.113 | ||
| Diabetes | 34 (7.8) | 26 (11.4) | 0.117 | 1.54 (0.89–2.64) | 0.119 | ||
| Ocular history a | |||||||
| Age-related macular degeneration | 23 (5.1) | 5 (2.1) | 0.051 | 0.35 (0.13–0.94) | 0.037 | ||
| Diabetic retinopathy | 4 (0.8) | 3 (1.2) | 0.661 | 1.41 (0.31–6.35) | 0.654 | ||
| Glaucoma | 46 (9.6) | 34 (13.1) | 0.136 | 1.21 (0.71–1.91) | 0.425 | ||
| Ocular hypertension | 9 (1.8) | 13 (5.0) | 0.016 | 1.43 (0.78–2.61) | 0.242 | ||
| Cataract extraction | 229 (47.6) | 132 (60.0) | 0.384 | 1.10 (0.80–1.50) | 0.559 | ||
| Systemic drugs | |||||||
| Antihypertensives | 254 (58.1) | 151 (66.2) | 0.042 | 1.39 (0.99–1.94) | 0.058 | ||
| Diuretics | 60 (12.5) | 39 (15.1) | 0.325 | 1.21 (1.78–1.88) | 0.395 | ||
| Beta-blockers | 108 (22.4) | 69 (26.6) | 0.203 | 1.22 (0.86–1.73) | 0.265 | ||
| Calcium antagonists | 61 (12.7) | 42 (16.2) | 0.185 | 1.29 (0.84–1.98) | 0.241 | ||
| Anxiolytics | 49 (10.2) | 39 (15.1) | 0.051 | 1.58 (1.00–2.49) | 0.049 | ||
| Global psychotropic | 114 (23.7) | 70 (27.0) | 0.318 | 1.22 (0.86–1.73) | 0.275 | ||
| Antihistamines | 23 (4.8) | 14 (4.4) | 0.710 | 1.15 (0.58–2.28) | 0.687 | ||
| Decongestants and anti-allergic agents | 7 (1.5) | 4 (1.5) | 0.710 | 0.97 (0.28–3.37) | 0.962 | ||
| Lipid-lowering drugs | 191 (43.7) | 100 (43.9) | 0.970 | 1.00 (0.73–1.39) | 0.976 | ||
| Topical treatment | |||||||
| Artificial tears | 50 (10.4) | 41 (15.8) | 0.032 | 1.64 (1.05–2.56) | 0.029 | ||
| IOP-lowering agents | |||||||
| Preserved eye drops | 41 (8.5) | 21 (8.1) | 0.598 | 0.94 (0.54–1.62) | 0.813 | ||
| Nonpreserved eye drops | 5 (1.0) | 5 (1.9) | 1.89 (0.54–6.61) | 0.320 | |||
| Antihistamines eye drops | 27 (5.6) | 15 (5.8) | 0.920 | 1.01 (0.53–1.95) | 0.969 | ||
| Other eye drops | 6 (1.2) | 1 (0.4) | 0.248 | 0.33 (0.04–2.75) | 0.305 | ||
| Plasma lipid, mmol/L, mean (SD) | |||||||
| Total cholesterol | 5.8 (0.9) | 5.8 (0.9) | 0.888 | 1.01 (0.85–1.19) | 0.932 | ||
| LDL cholesterol | 3.6 (0.8) | 3.6 (0.8) | 0.650 | 0.97 (0.81–1.17) | 0.750 | ||
| HDL cholesterol | 1.7 (0.4) | 1.6 (0.4) | 0.747 | 0.97 (0.64–1.48) | 0.905 | ||
| Triglycerides | 1.1 (0.5) | 1.2 (0.5) | 0.114 | 0.97 (0.95–1.72) | 0.108 | ||
| Dry Eye Disease | |||||
|---|---|---|---|---|---|
| Chemical Structure | Common Name | All FAs | No n = 481 | Yes n = 259 | p-Value |
| SFAs | |||||
| C12:0 | Lauric acid | 0.4 | 0.5 | 0.5 | 0.476 |
| C14:0 | Myristic acid | 1.5 | 1.2 | 1.4 | 0.640 |
| C15:0 | Pentadecanoic acid | 0.4 | 0.5 | 0.5 | 0.965 |
| C16:0 | Palmitic acid | 22.3 | 22.3 | 22.2 | 0.602 |
| C17:0 | Margaric acid | 0.5 | 0.3 | 0.3 | 0.654 |
| C18:0 | Stearic acid | 7.2 | 7.0 | 6.8 | 0.156 |
| C20:0 | Arachidic acid | 0.6 | 0.4 | 0.4 | 0.645 |
| C22:0 | Behenic acid | 0.2 | 0.5 | 0.4 | 0.134 |
| MUFAs | |||||
| C16:1 n-7 | Palmitoleic acid | 2.7 | 2.8 | 2.8 | 0.976 |
| C16:1 n-9 | Cis-7 hexadecenoic acid | 0.6 | 0.8 | 0.6 | 0.578 |
| C18:1 n-7 | Vaccenic acid | 2.1 | 2.1 | 2.2 | 0.396 |
| C18:1 n-9 | Oleic acid | 21.4 | 21.5 | 21.5 | 0.341 |
| C20:1 n-9 | Eicosenoic acid | 0.2 | 0.3 | 0.3 | 0.372 |
| C24:1 n-9 | Nervonic acid | 0.4 | 0.4 | 0.5 | 0.644 |
| PUFAs | |||||
| Omega-6 | |||||
| C18:2 n-6 | Linoleic acid (LA) | 25.2 | 25.0 | 25.2 | 0.212 |
| C18:3 n-6 | Gamma linoleic acid (GLA) | 0.6 | 0.5 | 0.6 | 0.831 |
| C20:2 n-6 | Eicosadienoic acid | 0.3 | 0.5 | 0.3 | 0.052 |
| C20:4 n-6 | Arachidonic acid (AA) | 7.7 | 7.4 | 7.5 | 0.265 |
| C22:4 n-6 | Docosatetraenoic Acid (DTA) | 0.3 | 0.4 | 0.3 | 0.089 |
| C22:5 n-6 | Docosapentaenoic n-6 (DPA) | 0.1 | 0.3 | 0.2 | 0.642 |
| Omega-3 | |||||
| C18:3 n-3 | Alpha linoleic acid (ALA) | 0.8 | 0.8 | 0.7 | 0.162 |
| C20:5 n-3 | Eicosapentaenoic acid (EPA) | 1.4 | 1.3 | 1.4 | 0.271 |
| C22:5 n-3 | Docosapentaenoic n-3 (DPA) | 0.7 | 0.7 | 0.8 | 0.630 |
| C22:6 n-3 | Docosahexaenoic acid (DHA) | 2.4 | 2.5 | 2.6 | 0.476 |
| Fatty Acids | Common Name | Component a |
|---|---|---|
| SFAs | ||
| C12:0 | Lauric acid | 0.13 |
| C14:0 | Myristic acid | 0.07 |
| C15:0 | Pentadecanoic acid | 0.01 |
| C16:0 | Palmitic acid | 0.11 |
| C17:0 | Margaric acid | 0.09 |
| C18:0 | Stearic acid | −0.32 |
| C20:0 | Arachidic acid | 0.09 |
| C22:0 | Behenic acid | 0.27 |
| MUFAs | ||
| C16:1 n-7 | Palmitoleic acid | 0.09 |
| C16:1 n-9 | Cis-7 hexadecenoic acid | −0.00 |
| C18:1 n-7 | Vaccenic acid | 0.39 |
| C18:1 n-9 | Oleic acid | 0.20 |
| C20:1 n-9 | Eicosenoic acid | 0.17 |
| C24:1 n-9 | Nervonic acid | 0.19 |
| PUFAs | ||
| Omega-6 | ||
| C18:2 n-6 | Linoleic acid (LA) | −0.10 |
| C18:3 n-6 | Gamma linoleic acid (GLA) | −0.27 |
| C20:2 n-6 | Eicosadienoic acid | 0.05 |
| C20:3 n-6 | Dihomo-gamma-linoleic acid (DGLA) | 0.29 |
| C20:4 n-6 | Arachidonic acid (AA) | −0.21 |
| C22:4 n-6 | Docosatetraenoic acid (DTA) | 0.22 |
| C22:5 n-6 | Docosapentaenoic acid n-6 (DPA) | 0.32 |
| Omega-3 | ||
| C18:3 n-3 | Alpha linoleic acid (ALA) | −0.08 |
| C20:5 n-3 | Eicosapentaenoic acid (EPA) | −0.27 |
| C22:5 n-3 | Docosapentaenoic acid n-3 (DPA) | 0.21 |
| C22:6 n-3 | Docosahexaenoic acid (DHA) | −0.07 |
| Quartiles of FAs Pattern Scores | |||||
|---|---|---|---|---|---|
| Q1 | Q2 | Q3 | Q4 | ||
| OR (95% CI) | OR (95% CI) | OR (95% CI) | OR (95% CI) | p-Trend | |
| Crude | 1.00 (Ref.) | 2.31 (1.46–3.65) | 2.26 (1.43–3.57) | 2.53 (1.60–3.99) | <0.001 |
| M1 a | 1.00 (Ref.) | 2.30 (1.45–3.64) | 2.22 (1.40–3.52) | 2.45 (1.55–3.88) | <0.001 |
| M2 b | 1.00 (Ref.) | 2.44 (1.50–3.95) | 2.26 (1.39–3.65) | 2.46 (1.51–4.01) | 0.001 |
Publisher’s Note: MDPI stays neutral with regard to jurisdictional claims in published maps and institutional affiliations. |
© 2022 by the authors. Licensee MDPI, Basel, Switzerland. This article is an open access article distributed under the terms and conditions of the Creative Commons Attribution (CC BY) license (https://creativecommons.org/licenses/by/4.0/).
Share and Cite
Seydou, A.; Arnould, L.; Gabrielle, P.-H.; Baudin, F.; Ghezala, I.B.; Bron, A.M.; Acar, N.; Creuzot-Garcher, C. Plasma Fatty Acids Pattern and Dry Eye Disease in the Elderly: The Montrachet Population-Based Study. Nutrients 2022, 14, 2290. https://doi.org/10.3390/nu14112290
Seydou A, Arnould L, Gabrielle P-H, Baudin F, Ghezala IB, Bron AM, Acar N, Creuzot-Garcher C. Plasma Fatty Acids Pattern and Dry Eye Disease in the Elderly: The Montrachet Population-Based Study. Nutrients. 2022; 14(11):2290. https://doi.org/10.3390/nu14112290
Chicago/Turabian StyleSeydou, Alassane, Louis Arnould, Pierre-Henry Gabrielle, Florian Baudin, Ines Ben Ghezala, Alain M. Bron, Niyazi Acar, and Catherine Creuzot-Garcher. 2022. "Plasma Fatty Acids Pattern and Dry Eye Disease in the Elderly: The Montrachet Population-Based Study" Nutrients 14, no. 11: 2290. https://doi.org/10.3390/nu14112290
APA StyleSeydou, A., Arnould, L., Gabrielle, P.-H., Baudin, F., Ghezala, I. B., Bron, A. M., Acar, N., & Creuzot-Garcher, C. (2022). Plasma Fatty Acids Pattern and Dry Eye Disease in the Elderly: The Montrachet Population-Based Study. Nutrients, 14(11), 2290. https://doi.org/10.3390/nu14112290