
Ultra-Processed Food Consumption and Adult Mortality Risk: A Systematic Review and Dose–Response Meta-Analysis of 207,291 Participants

 ,
, 
 ,
, 
Abstract
:1. Introduction
2. Materials and Methods
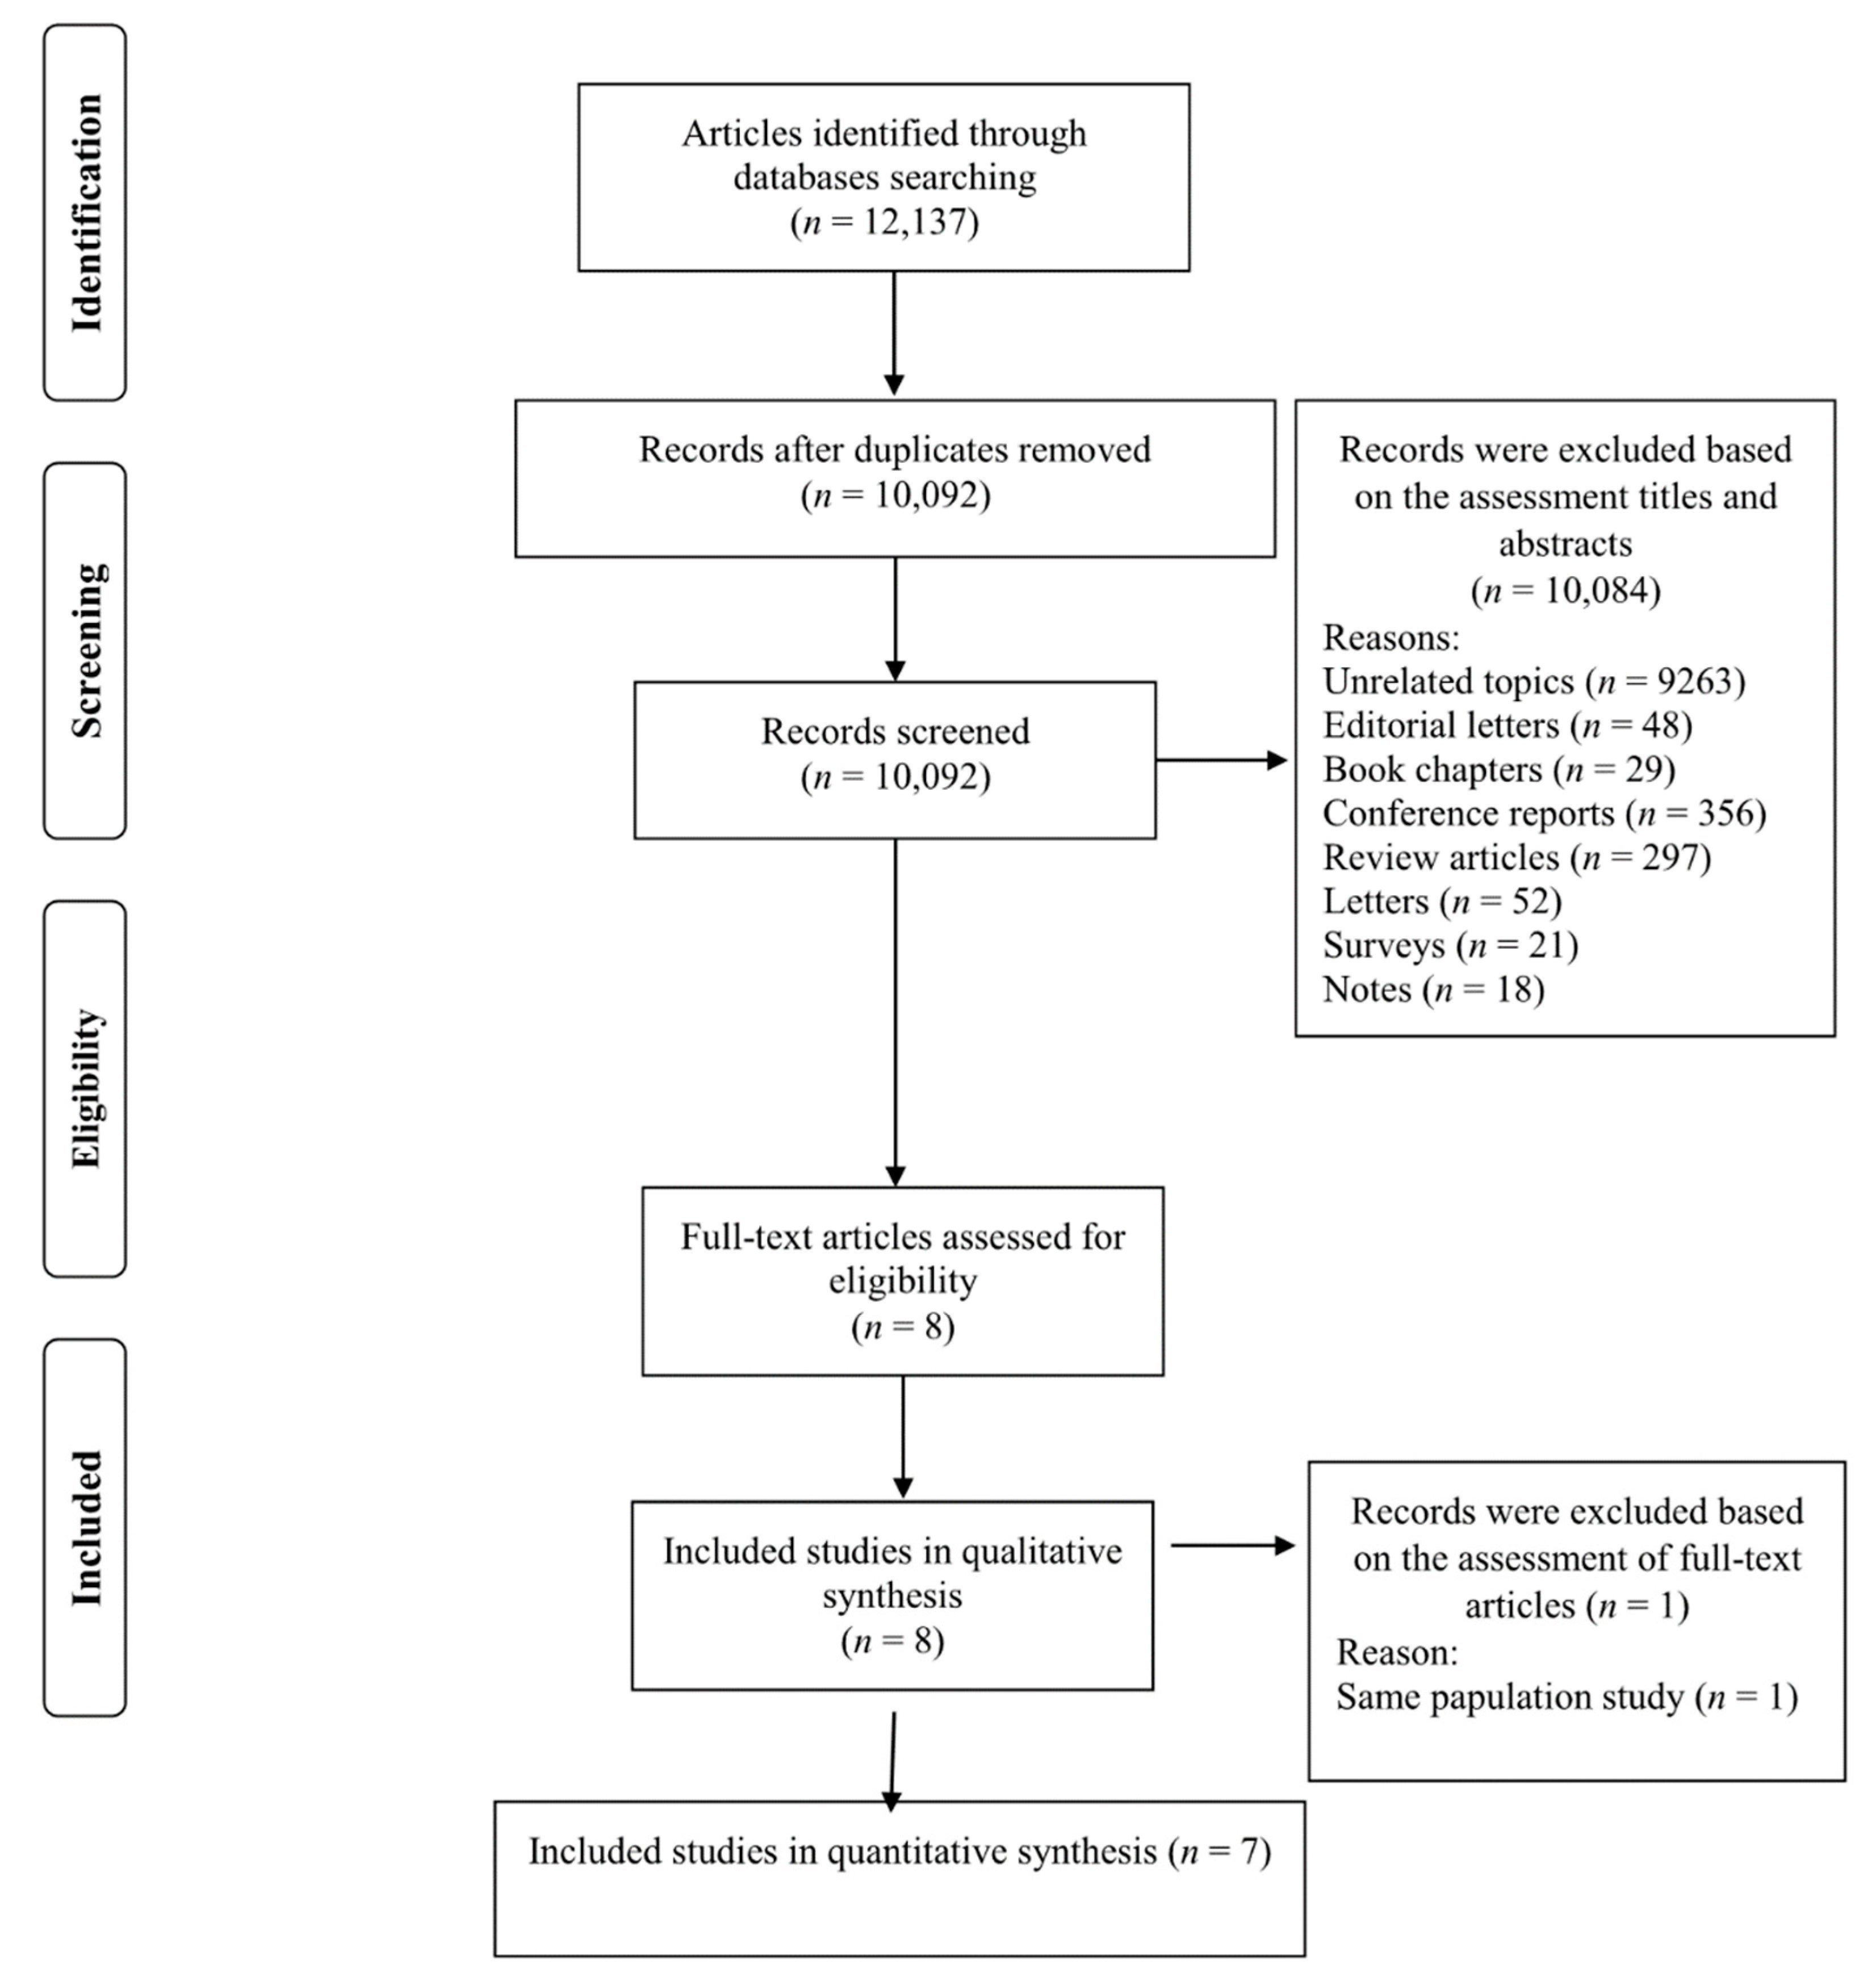
2.1. Literature Search and Selection
2.2. Inclusion and Exclusion Criteria
2.3. Study Selection
2.4. Data Extraction
2.5. Quality Assessment
2.6. Data Synthesis and Statistical Analyses
3. Results
3.1. Study Characteristics
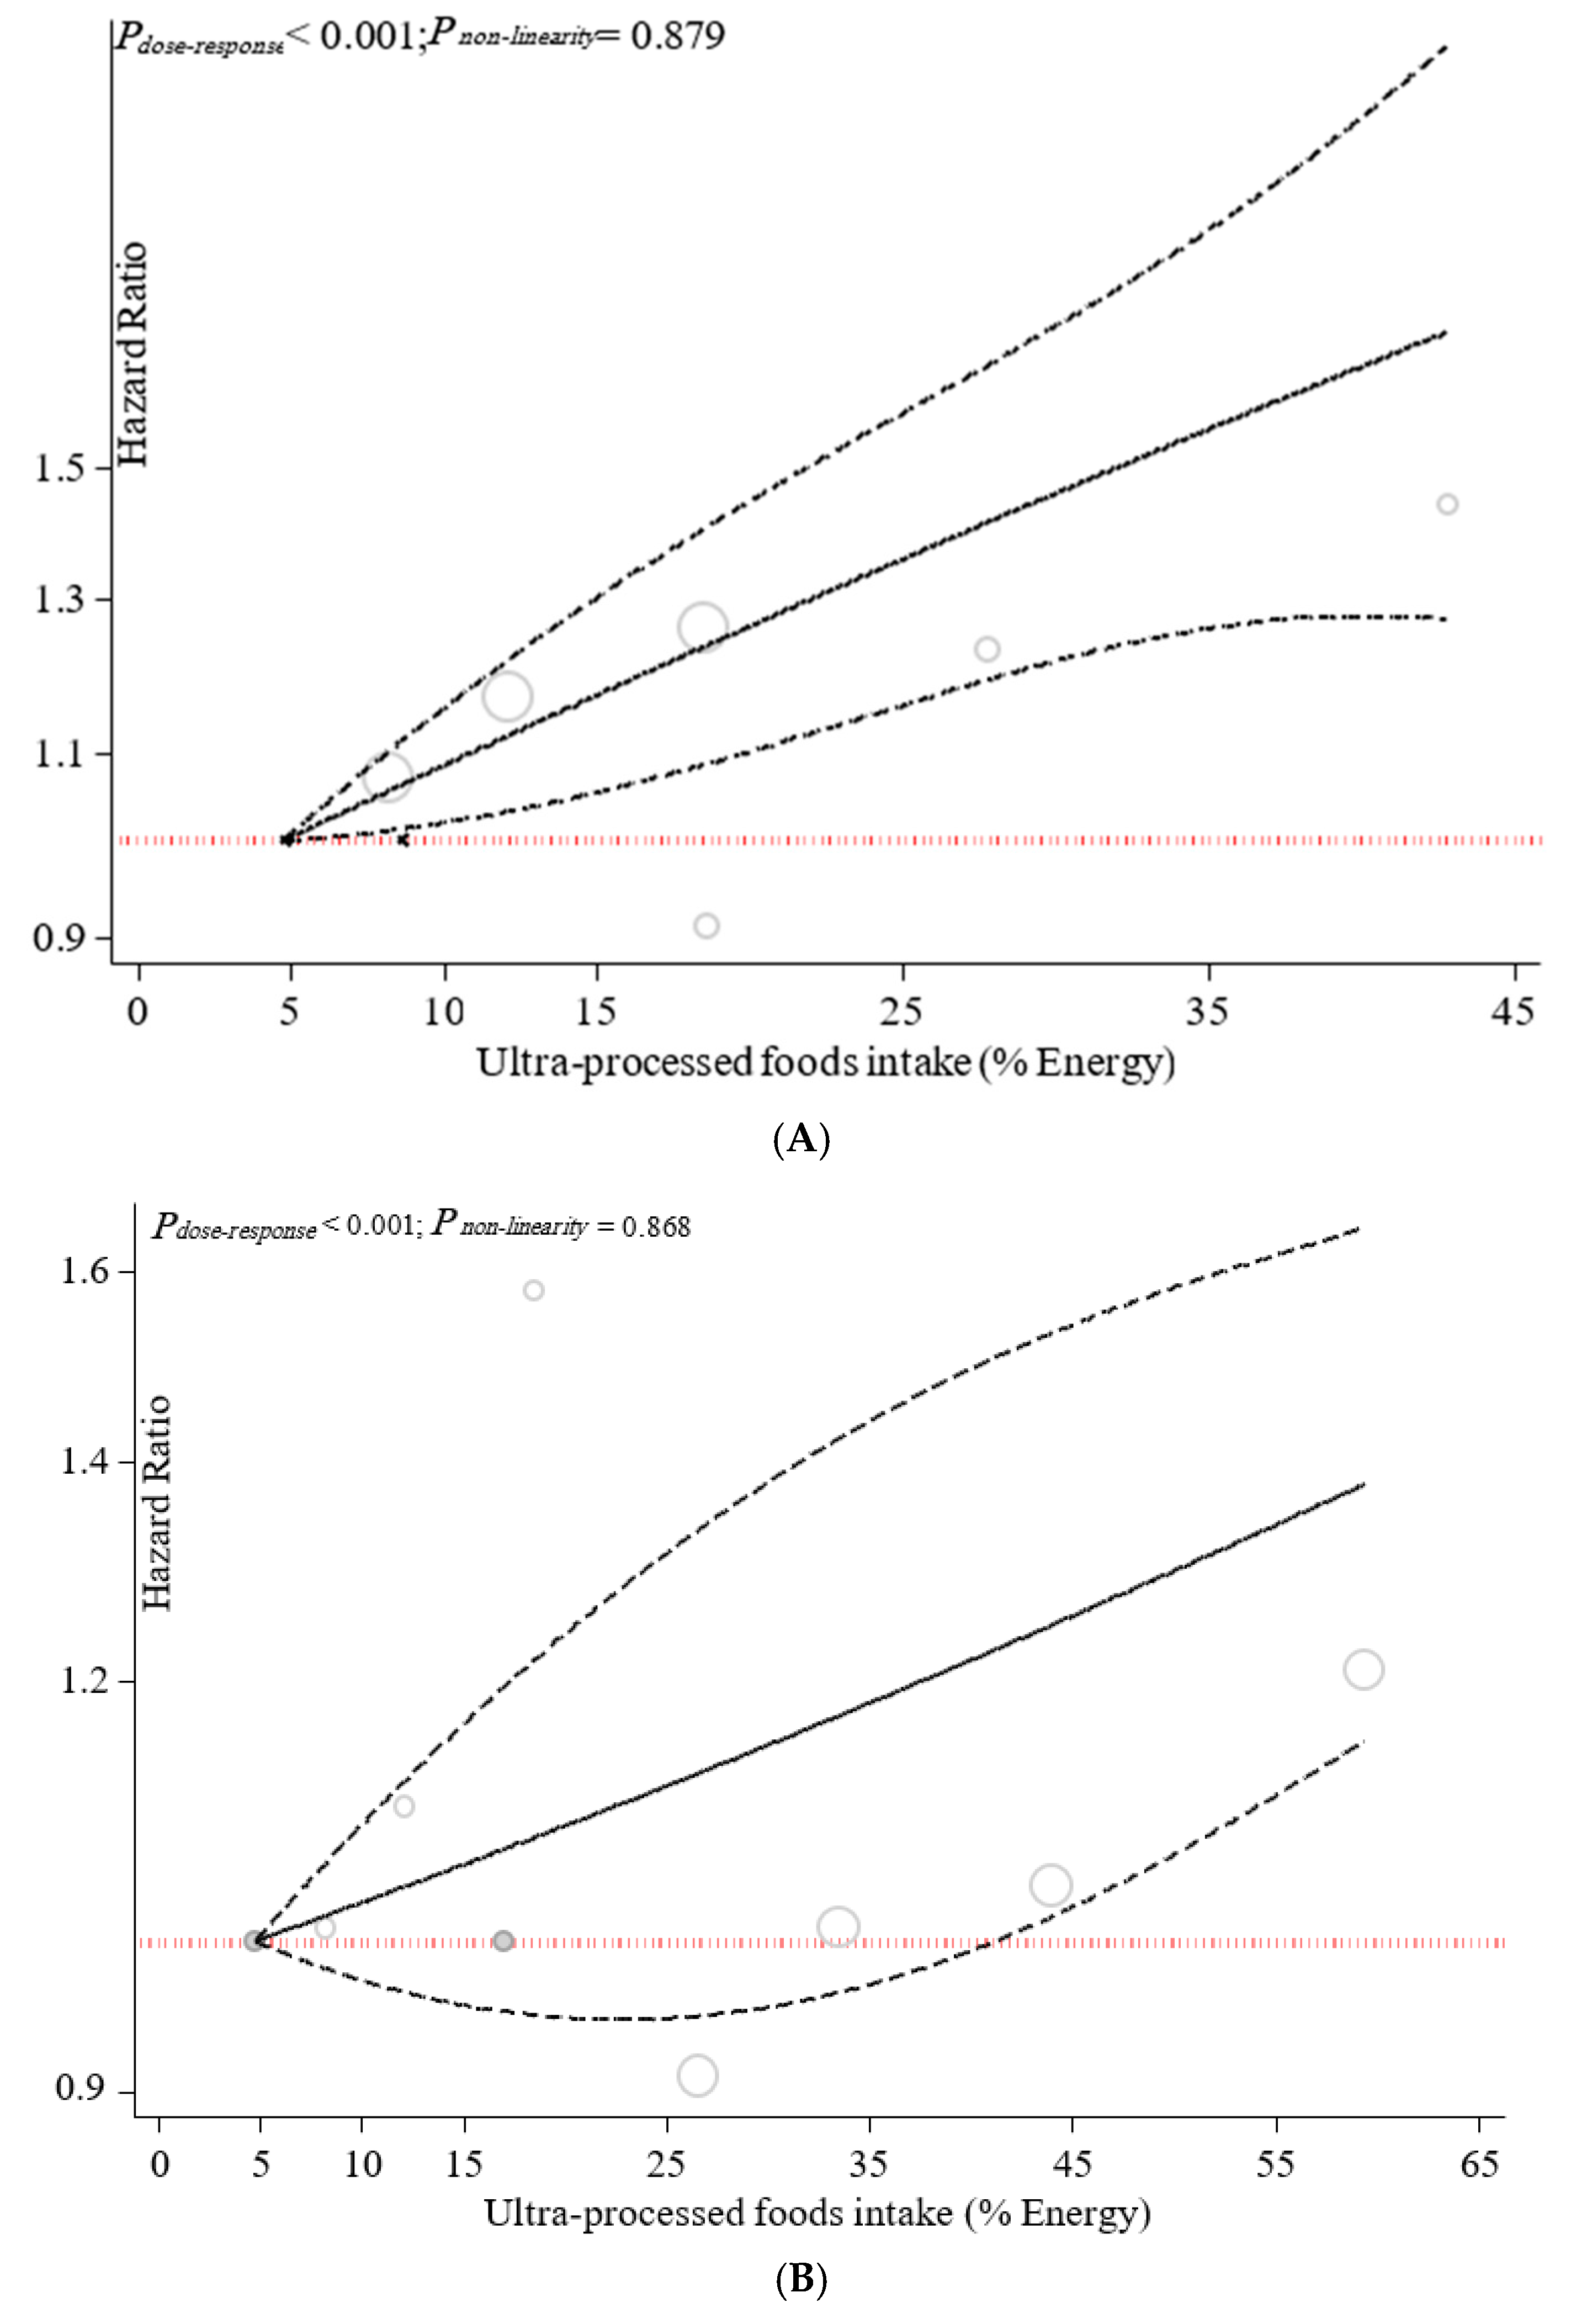
3.2. Ultra-Processed Food Consumption and Mortality Risk
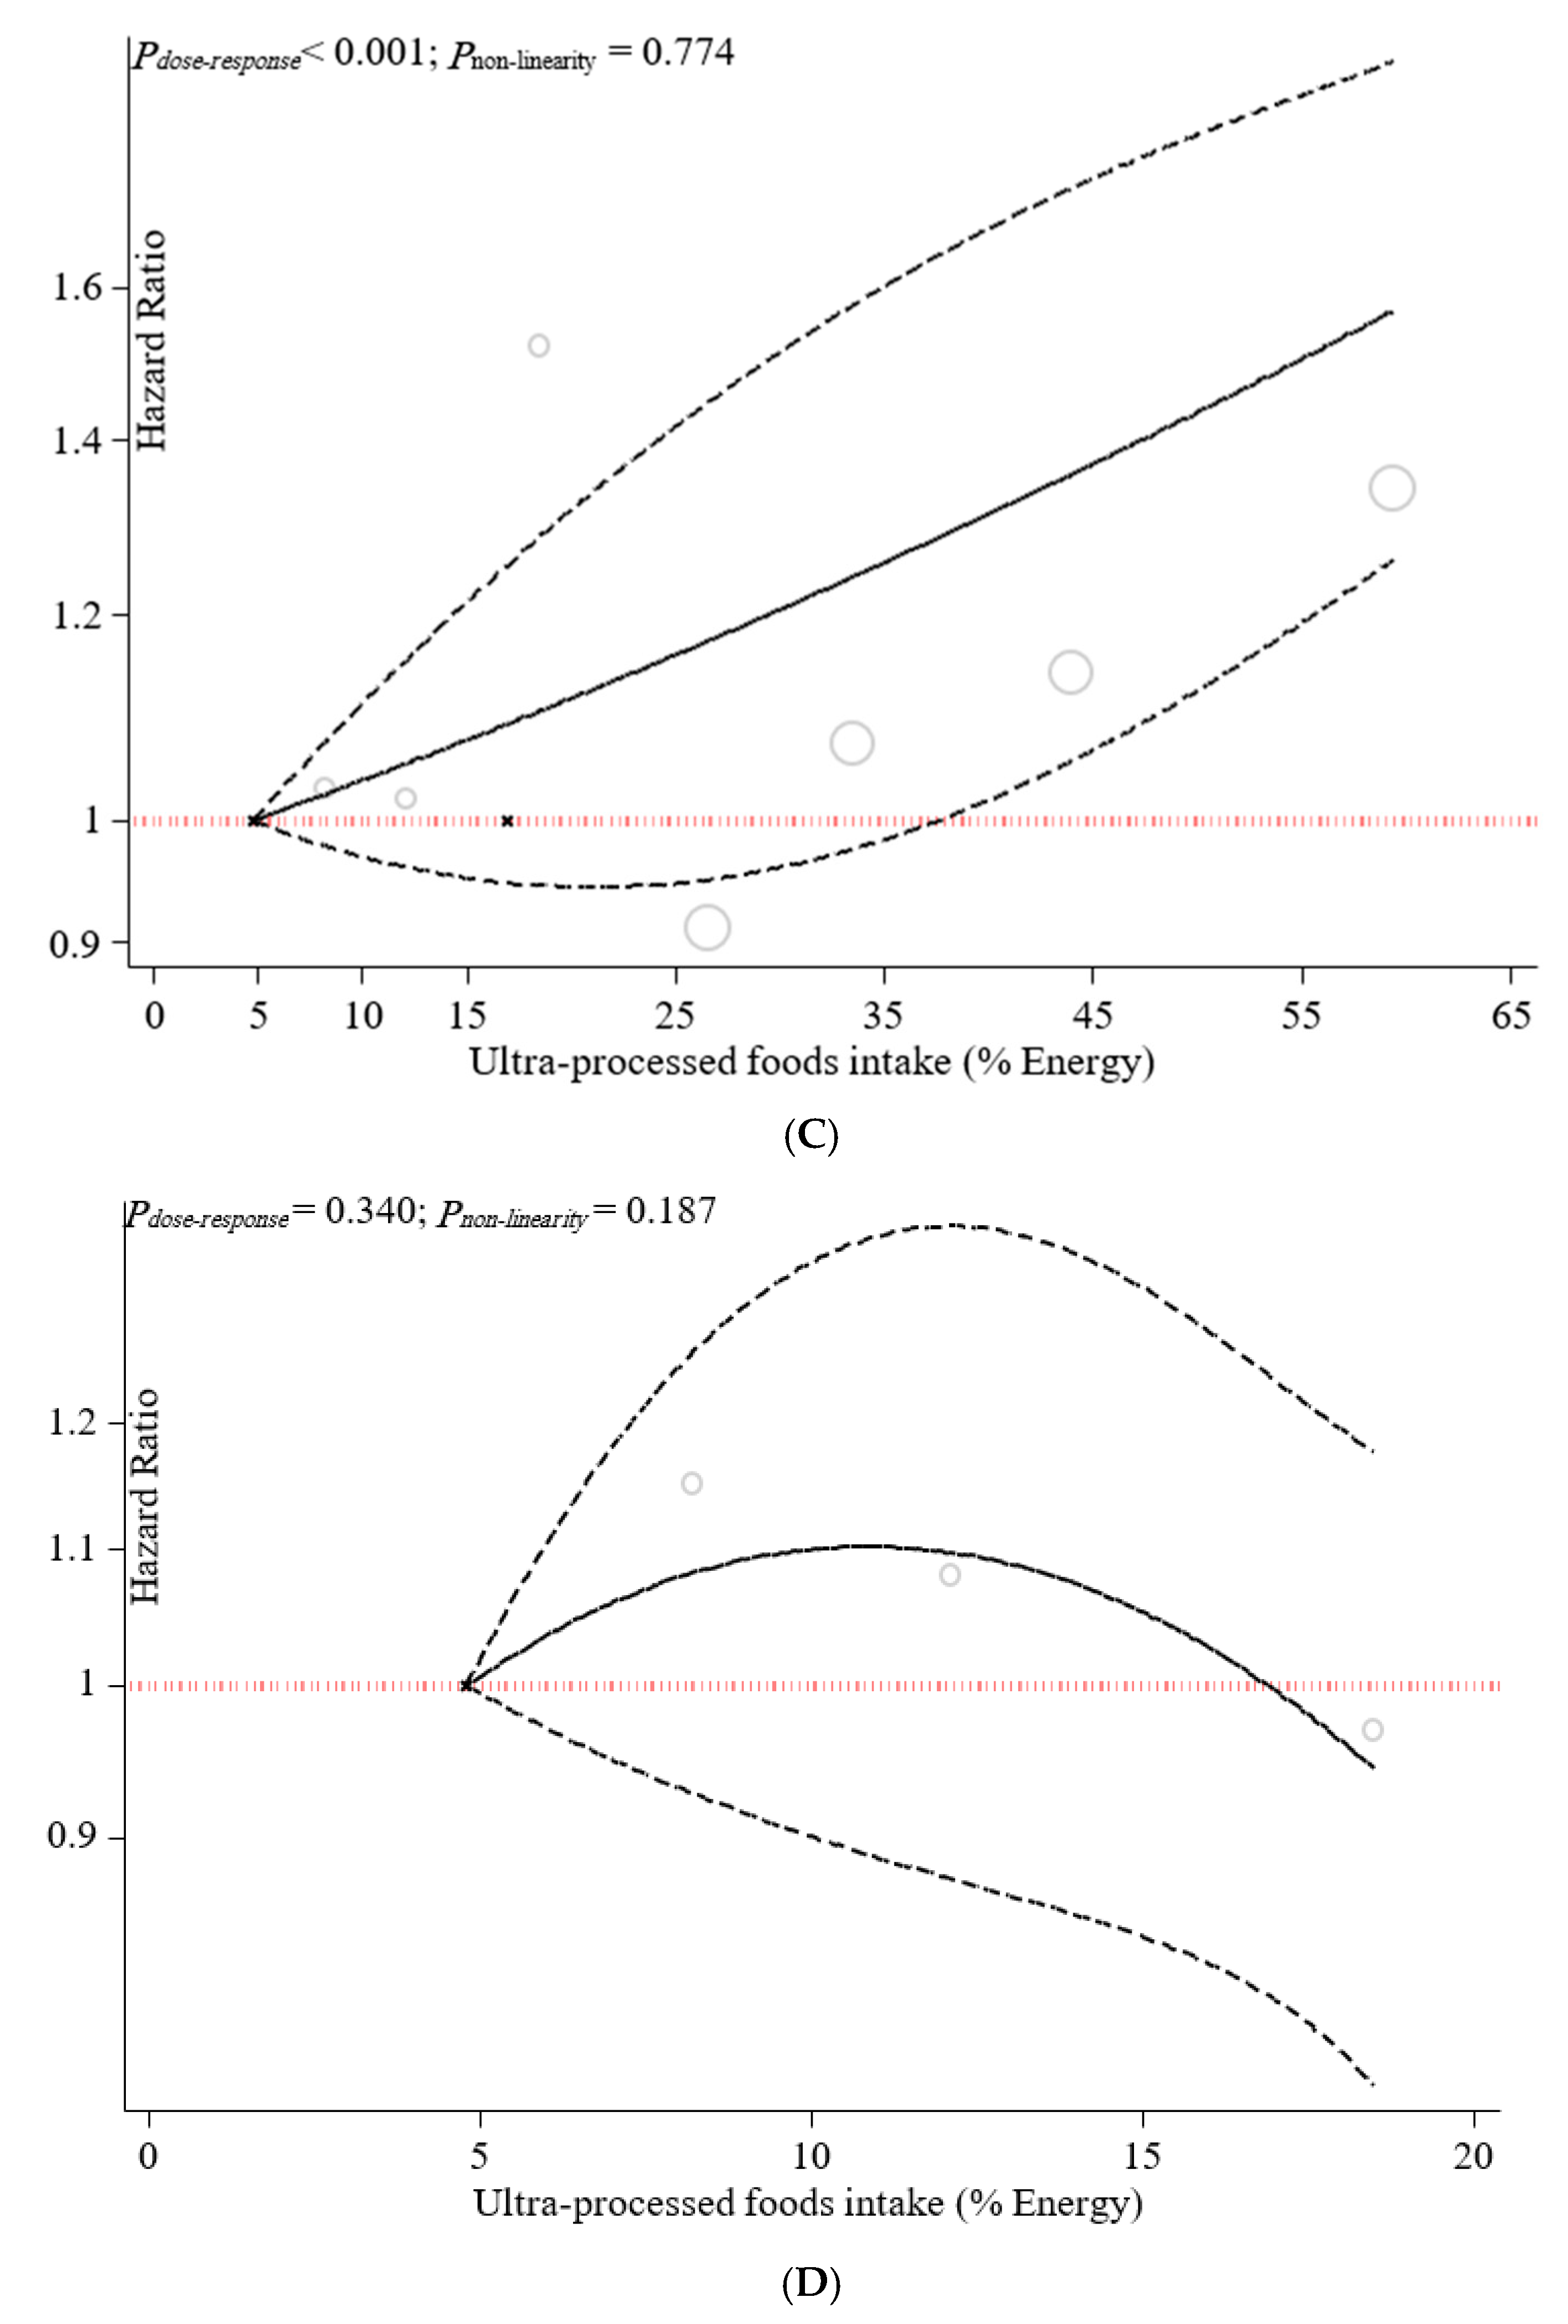
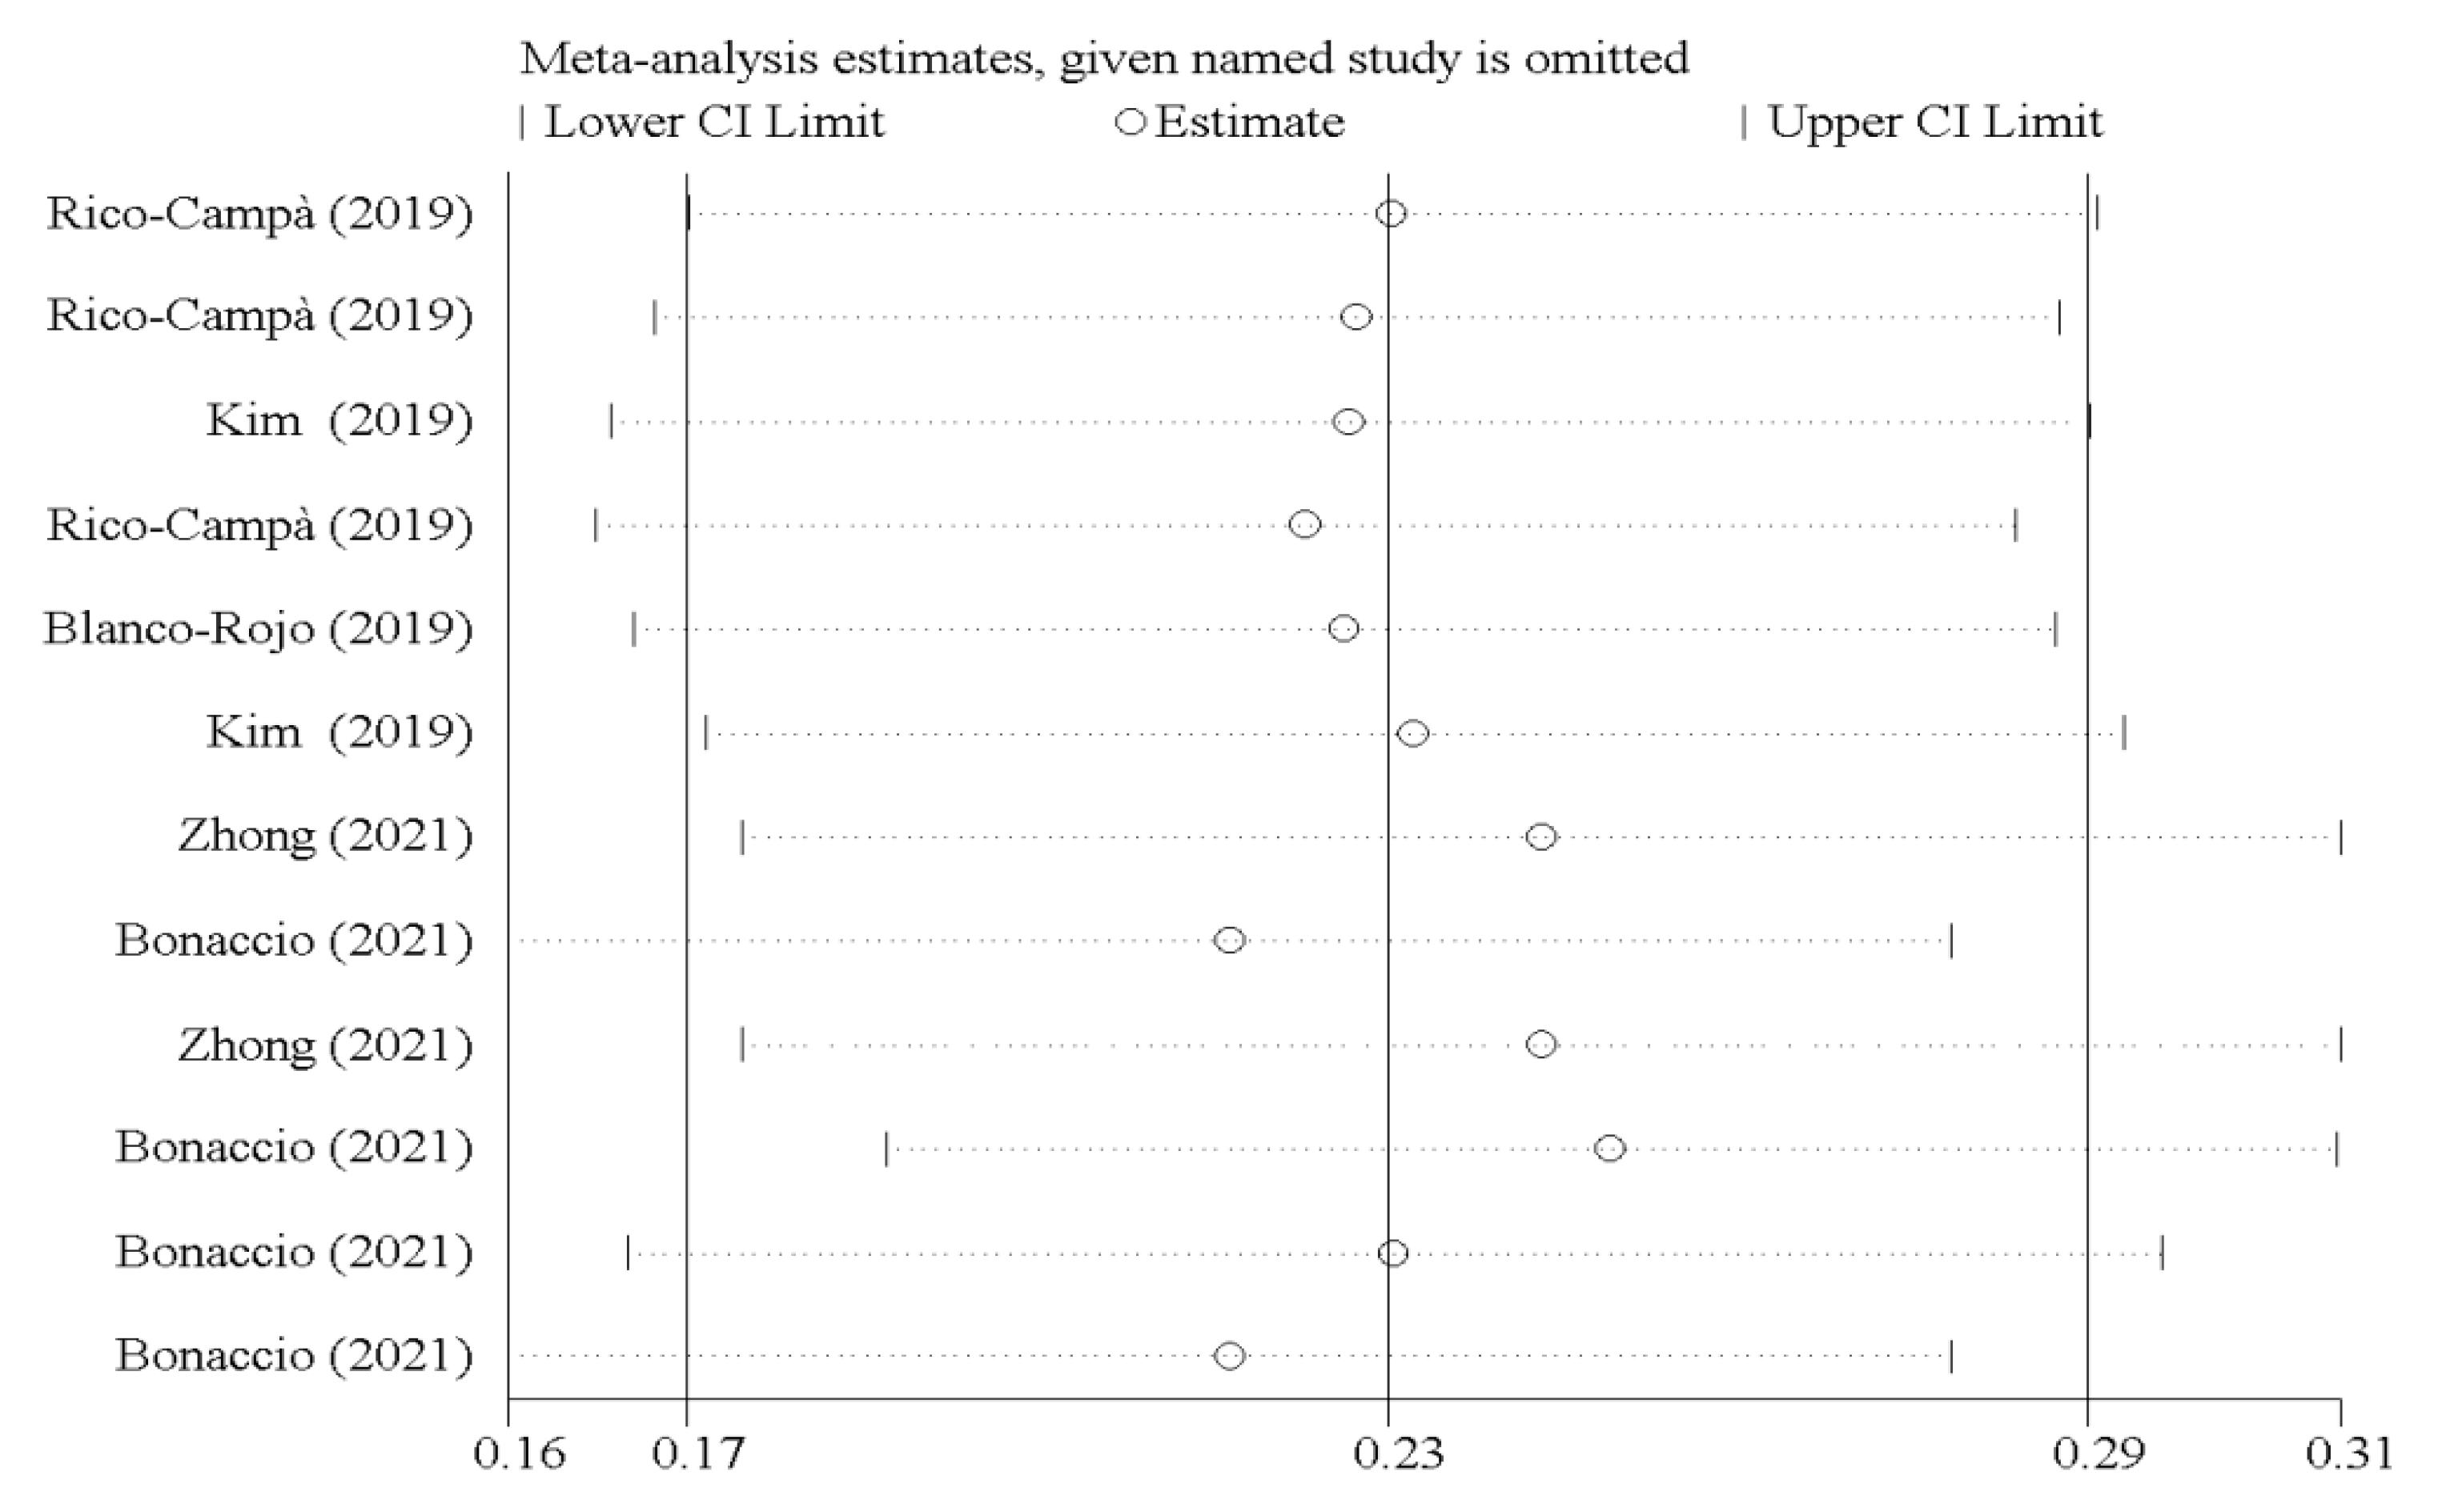
3.3. Sensitivity Analyses
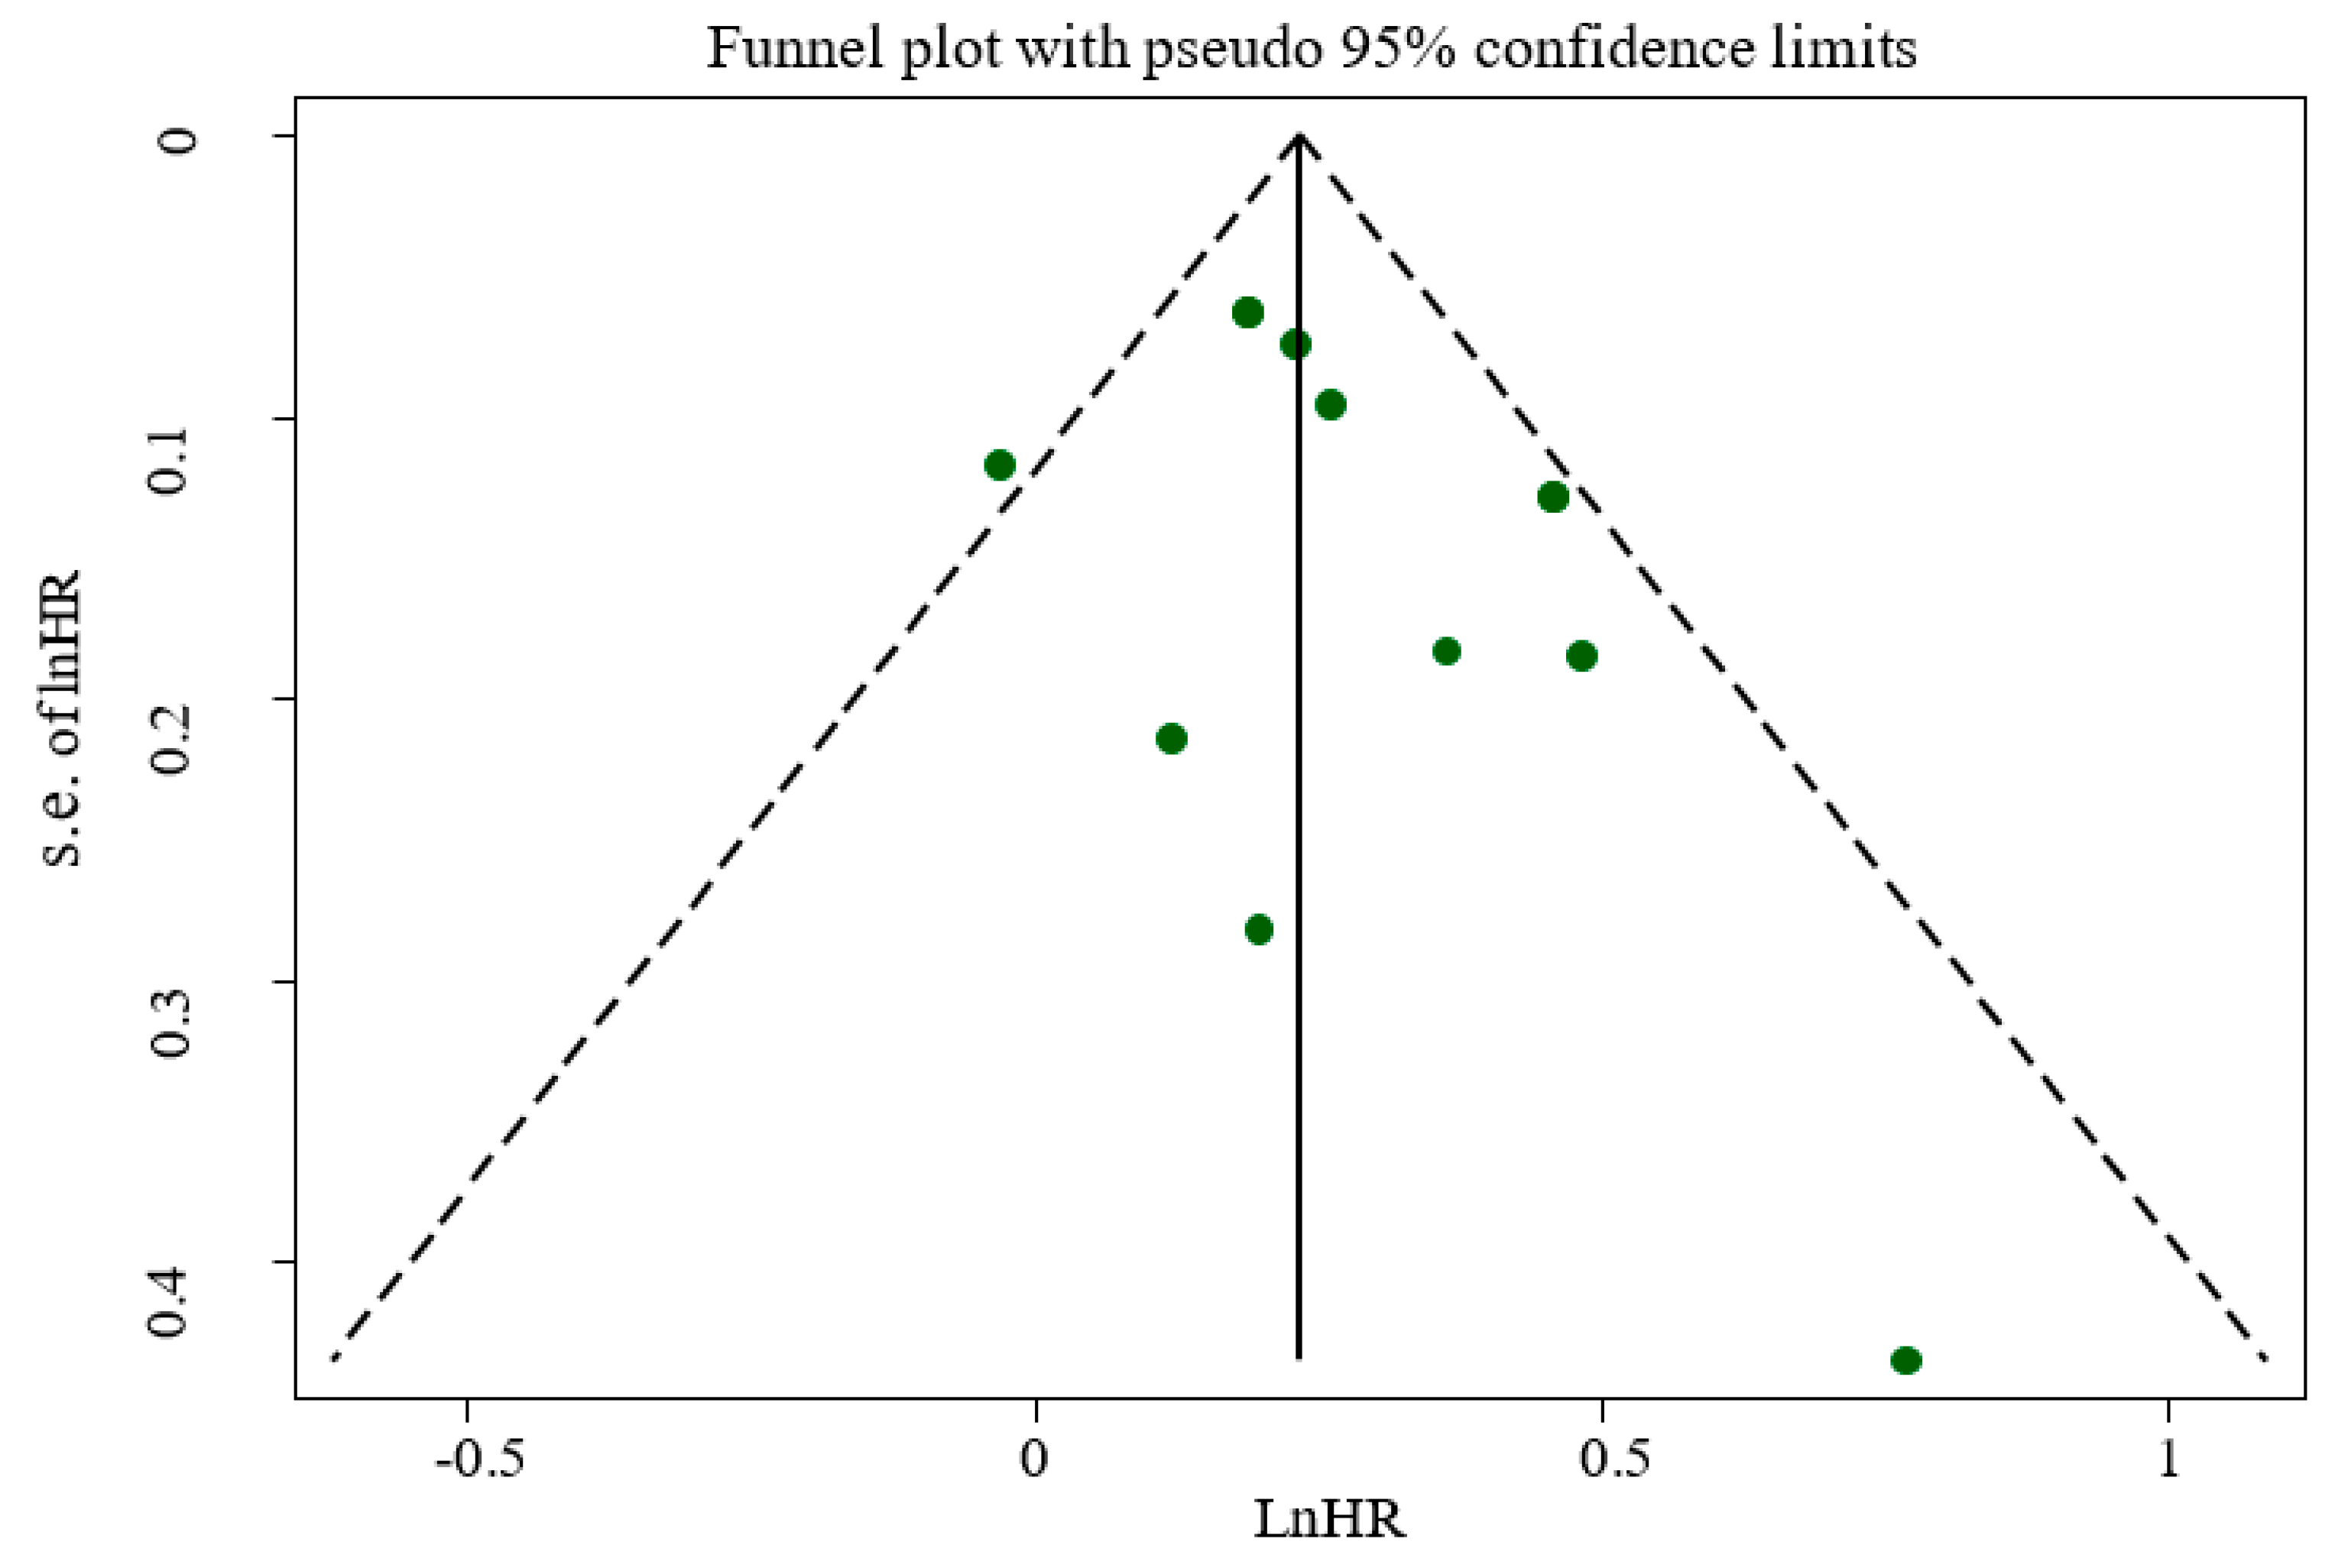
3.4. Publication Bias
4. Discussion
Supplementary Materials
Author Contributions
Funding
Conflicts of Interest
References
- Baker, P.; Friel, S. Food systems transformations, ultra-processed food markets and the nutrition transition in Asia. Glob. Health 2016, 12, 80. [Google Scholar] [CrossRef] [Green Version]
- Beslay, M.; Srour, B.; Méjean, C.; Allès, B.; Fiolet, T.; Debras, C.; Chazelas, E.; Deschasaux, M.; Wendeu-Foyet, M.G.; Hercberg, S. Ultra-processed food intake in association with BMI change and risk of overweight and obesity: A prospective analysis of the French NutriNet-Santé cohort. PLoS Med. 2020, 17, e1003256. [Google Scholar] [CrossRef] [PubMed]
- Moubarac, J.-C.; Batal, M.; Louzada, M.L.; Martinez Steele, E.; Monteiro, C.A. Consumption of Ultra-Processed Foods Predicts Diet Quality in Canada. Appetite 2017, 108, 512–520. [Google Scholar] [CrossRef]
- Levy, R.B.; Rauber, F.; Chang, K.; da Costa Louzada, M.L.; Monteiro, C.A.; Millett, C.; Vamos, E.P. Ultra-Processed Food Consumption and Type 2 Diabetes Incidence: A Prospective Cohort Study. Clin. Nutr. 2020, 40, 3608–3614. [Google Scholar] [CrossRef]
- Costa Louzada, M.L.; Martins, A.P.; Canella, D.S.; Baraldi, L.G.; Levy, R.B.; Claro, R.M.; Moubarac, J.-C.; Cannon, G.; Monteiro, C.A. Ultra-processed foods and the nutritional dietary profile in Brazil. Rev. Saude Publica 2015, 49, 38. [Google Scholar] [PubMed]
- Monteiro, C.A.; Cannon, G.; Levy, R.B.; Moubarac, J.-C.; Louzada, M.L.C.; Rauber, F.; Khandpur, N.; Cediel, G.; Neri, D.; Martinez-Steele, E.; et al. Ultra-Processed Foods: What They Are and How to Identify Them. Public Health Nutr. 2019, 22, 936–941. [Google Scholar] [CrossRef] [PubMed]
- Adams, J.M.; White, M. Characterisation of UK diets according to degree of food processing and associations with socio-demographics and obesity: Cross-sectional analysis of UK National Diet and Nutrition Survey (2008–12). Int. J. Behav. Nutr. Phys. Act. 2015, 12, 160. [Google Scholar] [CrossRef] [PubMed] [Green Version]
- Gupta, S.; Rose, C.M.; Buszkiewicz, J.; Ko, L.K.; Mou, J.; Cook, A.; Aggarwal, A.; Drewnowski, A. Characterising percentage energy from ultra-processed foods by participant demographics, diet quality and diet cost: Findings from the Seattle Obesity Study (SOS) III. Br. J. Nutr. 2021, 126, 773–781. [Google Scholar] [CrossRef] [PubMed]
- Shim, J.-S.; Shim, S.-Y.; Cha, H.-J.; Kim, J.; Kim, H. Socioeconomic Characteristics and Trends in the Consumption of Ultra-Processed Foods in Korea from 2010 to 2018. Nutrients 2021, 13, 1120. [Google Scholar] [CrossRef]
- Da Rocha, B.R.S.; Rico-Campà, A.; Romanos-Nanclares, A.; Ciriza, E.; Barbosa, K.B.F.; Martínez-González, M.Á.; Martín-Calvo, N. Adherence to Mediterranean diet is inversely associated with the consumption of ultra-processed foods among Spanish children: The SENDO project. Public Health Nutr. 2021, 24, 3294–3303. [Google Scholar] [CrossRef]
- Marino, M.; Puppo, F.; Del Bo’, C.; Vinelli, V.; Riso, P.; Porrini, M.; Martini, D. A Systematic Review of Worldwide Consumption of Ultra-Processed Foods: Findings and Criticisms. Nutrients 2021, 13, 2778. [Google Scholar] [CrossRef]
- Monteiro, C.A.; Moubarac, J.-C.; Cannon, G.; Ng, S.W.; Popkin, B. Ultra-Processed Products Are Becoming Dominant in the Global Food System. Obes. Rev. 2013, 14 (Suppl. S2), 21–28. [Google Scholar] [CrossRef]
- WHO. Prevention and Control of Noncommunicable Diseases in the European Region: A Progress Report; World Health Organization. Regional Office for Europe: Geneva, Switzerland, 2014. [Google Scholar]
- Schulte, E.M.; Avena, N.M.; Gearhardt, A.N. Which foods may be addictive? The roles of processing, fat content, and glycemic load. PLoS ONE 2015, 10, e0117959. [Google Scholar] [CrossRef]
- Chen, X.; Zhang, Z.; Yang, H.; Qiu, P.; Wang, H.; Wang, F.; Zhao, Q.; Fang, J.; Nie, J. Consumption of ultra-processed foods and health outcomes: A systematic review of epidemiological studies. Nutr. J. 2020, 19, 1–10. [Google Scholar] [CrossRef]
- Fiolet, T.; Srour, B.; Sellem, L.; Kesse-Guyot, E.; Allès, B.; Méjean, C.; Deschasaux, M.; Fassier, P.; Latino-Martel, P.; Beslay, M. Consumption of ultra-processed foods and cancer risk: Results from NutriNet-Santé prospective cohort. BMJ 2018, 360, k322. [Google Scholar] [CrossRef] [PubMed] [Green Version]
- Zhong, G.-C.; Gu, H.-T.; Peng, Y.; Wang, K.; Wu, Y.-Q.-L.; Hu, T.-Y.; Jing, F.-C.; Hao, F.-B. Association of ultra-processed food consumption with cardiovascular mortality in the US population: Long-term results from a large prospective multicenter study. Int. J. Behav. Nutr. Phys. Act. 2021, 18, 1–14. [Google Scholar] [CrossRef]
- Buckley, J.P.; Kim, H.; Wong, E.; Rebholz, C.M. Ultra-processed food consumption and exposure to phthalates and bisphenols in the US National Health and Nutrition Examination Survey, 2013–2014. Environ. Int. 2019, 131, 105057. [Google Scholar] [CrossRef] [PubMed]
- Rico-Campà, A.; Martínez-González, M.A.; Alvarez-Alvarez, I.; de Deus Mendonça, R.; De La Fuente-Arrillaga, C.; Gómez-Donoso, C.; Bes-Rastrollo, M. Association between consumption of ultra-processed foods and all cause mortality: SUN prospective cohort study. BMJ 2019, 365, l1949. [Google Scholar] [CrossRef] [PubMed] [Green Version]
- Blanco-Rojo, R.; Sandoval-Insausti, H.; López-Garcia, E.; Graciani, A.; Ordovás, J.M.; Banegas, J.R.; Rodríguez-Artalejo, F.; Guallar-Castillón, P. Consumption of ultra-processed foods and mortality: A national prospective cohort in Spain. Mayo Clin. Proc. 2019, 94, 2178–2188. [Google Scholar] [CrossRef] [PubMed] [Green Version]
- Ferreiro, C.R.; Arroba, C.M.-A.; Navia, P.C.; Pablos, D.L.; de la Cámara, A.G. Ultra-processed food intake and all-cause mortality: DRECE cohort study. Public Health Nutr. 2021, 1–28. [Google Scholar] [CrossRef]
- Schnabel, L.; Kesse-Guyot, E.; Allès, B.; Touvier, M.; Srour, B.; Hercberg, S.; Buscail, C.; Julia, C. Association Between Ultraprocessed Food Consumption and Risk of Mortality Among Middle-aged Adults in France. JAMA Intern. Med. 2019, 179, 490–498. [Google Scholar] [CrossRef] [PubMed]
- Martínez Steele, E.; Baraldi, L.G.; da Costa Louzada, M.L.; Moubarac, J.-C.; Mozaffarian, D.; Monteiro, C.A. Ultra-Processed Foods and Added Sugars in the US Diet: Evidence from a Nationally Representative Cross-Sectional Study. BMJ Open 2016, 6, e009892. [Google Scholar] [CrossRef] [Green Version]
- Martínez Steele, E.; Khandpur, N.; da Costa Louzada, M.L.; Monteiro, C.A. Association between dietary contribution of ultra-processed foods and urinary concentrations of phthalates and bisphenol in a nationally representative sample of the US population aged 6 years and older. PLoS ONE 2020, 15, e0236738. [Google Scholar] [CrossRef] [PubMed]
- Nerín, C.; Aznar, M.; Carrizo, D. Food contamination during food process. Trends Food Sci. Technol. 2016, 48, 63–68. [Google Scholar] [CrossRef]
- Birlouez-Aragon, I.; Morales, F.; Fogliano, V.; Pain, J.-P. The health and technological implications of a better control of neoformed contaminants by the food industry. Pathol. Biol. 2010, 58, 232–238. [Google Scholar] [CrossRef]
- Page, M.J.; McKenzie, J.E.; Bossuyt, P.M.; Boutron, I.; Hoffmann, T.C.; Mulrow, C.D.; Shamseer, L.; Tetzlaff, J.M.; Akl, E.A.; Brennan, S.E. The PRISMA 2020 statement: An updated guideline for reporting systematic reviews. BMJ 2021, 372, n71. [Google Scholar] [CrossRef]
- Modesti, P.A.; Reboldi, G.; Cappuccio, F.P.; Agyemang, C.; Remuzzi, G.; Rapi, S.; Perruolo, E.; Parati, G.; ESH Working Group on CV Risk in Low Resource Settings. Panethnic Differences in Blood Pressure in Europe: A Systematic Review and Meta-Analysis. PLoS ONE 2016, 11, e0147601. [Google Scholar] [CrossRef] [Green Version]
- Symons, M.; Moore, D. Hazard rate ratio and prospective epidemiological studies. J. Clin. Epidemiol. 2002, 55, 893–899. [Google Scholar] [CrossRef]
- DerSimonian, R.; Laird, N. Meta-analysis in clinical trials. Control. Clin. Trials 1986, 7, 177–188. [Google Scholar] [CrossRef]
- Begg, C.B.; Mazumdar, M. Operating characteristics of a rank correlation test for publication bias. Biometrics 1994, 50, 1088–1101. [Google Scholar] [CrossRef] [PubMed]
- Egger, M.; Smith, G.D.; Schneider, M.; Minder, C. Bias in meta-analysis detected by a simple, graphical test. BMJ 1997, 315, 629–634. [Google Scholar] [CrossRef] [Green Version]
- Greenland, S.; Longnecker, M. Methods for Trend Estimation from Summarized Dose-Response Data, with Applications to Meta-Analysis. Am. J. Epidemiol. 1992, 135, 1301–1309. [Google Scholar] [CrossRef]
- Orsini, N.; Bellocco, R.; Greenland, S. Generalized Least Squares for Trend Estimation of Summarized Dose–response Data. Stata J. 2006, 6, 40–57. [Google Scholar] [CrossRef] [Green Version]
- Crippa, A.; Discacciati, A.; Bottai, M.; Spiegelman, D.; Orsini, N. One-stage dose–response meta-analysis for aggregated data. Stat. Methods Med. Res. 2019, 28, 1579–1596. [Google Scholar] [CrossRef]
- Bonaccio, M.; Di Castelnuovo, A.F.; Costanzo, S.; De Curtis, A.; Persichillo, M.; Cerletti, C.; Donati, M.B.; de Gaetano, G.; Iacoviello, L.; Moli-sani Study Investigators. Consumption of ul-tra-processed foods and beverages is associated with increased risk of cardiovascular mortality in the Moli-sani Study cohort. Circulation 2020, 141 (Suppl. S1), A49. [Google Scholar] [CrossRef]
- Bonaccio, M.; Di Castelnuovo, A.; Costanzo, S.; De Curtis, A.; Persichillo, M.; Sofi, F.; Cerletti, C.; Donati, M.B.; de Gaetano, G.; Iacoviello, L. Ultra-processed food con-sumption is associated with increased risk of all-cause and cardiovascular mortality in the Moli-sani Study. Am. J. Clin. Nutr. 2021, 113, 446–455. [Google Scholar] [CrossRef]
- Kim, H.; Hu, E.A.; Rebholz, C.M. Ultra-processed food intake and mortality in the USA: Results from the Third National Health and Nutrition Examination Survey (NHANES III, 1988–1994). Public Health Nutr. 2019, 22, 1777–1785. [Google Scholar] [CrossRef] [PubMed]
- Roth, G.; Abate, K.; Abay, S.; Cristiana, A.; Abbasi, N.; Abbastabar, H.; Abd-Allah, F.; Abdela, J.; Abdelalim, A.; Abdollahpour, I. Global, regional, and national age-sex-specific mortality for 282 causes of death in 195 countries and territories, 1980–2017: A systematic analysis for the Global Burden of Disease Study 2017. Lancet 2018, 392, 1736–1788. [Google Scholar] [CrossRef] [Green Version]
- English, L.K.; Ard, J.D.; Bailey, R.L.; Bates, M.; Bazzano, L.A.; Boushey, C.J.; Brown, C.; Butera, G.; Callahan, E.H.; de Jesus, J. Evaluation of Dietary Patterns and All-Cause Mortality: A Systematic Review. JAMA Netw. Open 2021, 4, e2122277. [Google Scholar] [CrossRef]
- Matos, R.A.; Adams, M.; Sabaté, J. Review: The Consumption of Ultra-Processed Foods and Non-communicable Diseases in Latin America. Front. Nutr. 2021, 8, 2714. [Google Scholar] [CrossRef] [PubMed]
- Cena, H.; Calder, P.C. Defining a Healthy Diet: Evidence for the Role of Contemporary Dietary Patterns in Health and Disease. Nutrients 2020, 12, 334. [Google Scholar] [CrossRef] [PubMed] [Green Version]
- Martino, J.V.; Van Limbergen, J.; Cahill, L.E. The Role of Carrageenan and Carboxymethylcellulose in the Develop-ment of Intestinal Inflammation. Front. Pediatrics 2017, 5, 96. [Google Scholar] [CrossRef] [PubMed] [Green Version]
- Suez, J.; Korem, T.; Zilberman-Schapira, G.; Segal, E.; Elinav, E. Non-caloric artificial sweeteners and the microbiome: Findings and challenges. Gut Microbes 2015, 6, 149–155. [Google Scholar] [CrossRef] [Green Version]
- Chassaing, B.; Koren, O.; Goodrich, J.K.; Poole, A.C.; Srinivasan, S.; Ley, R.E.; Gewirtz, A.T. Erratum: Corrigendum: Dietary emulsifiers impact the mouse gut microbiota promoting colitis and metabolic syndrome. Nat. Cell Biol. 2016, 536, 238. [Google Scholar] [CrossRef] [PubMed] [Green Version]
- Cimmino, I.; Fiory, F.; Perruolo, G.; Miele, C.; Beguinot, F.; Formisano, P.; Oriente, F. Potential Mechanisms of Bisphenol A (BPA) Contributing to Human Disease. Int. J. Mol. Sci. 2020, 21, 5761. [Google Scholar] [CrossRef]


| Author (Year, Location) | Study Design/Follow-Up (Years)/Source of Data/Health Status | Population/Age/BMI/(Women/Men) | Ultra-Processed Food Assessment Method | Outcomes | Adjusted Variables | Quality Score |
|---|---|---|---|---|---|---|
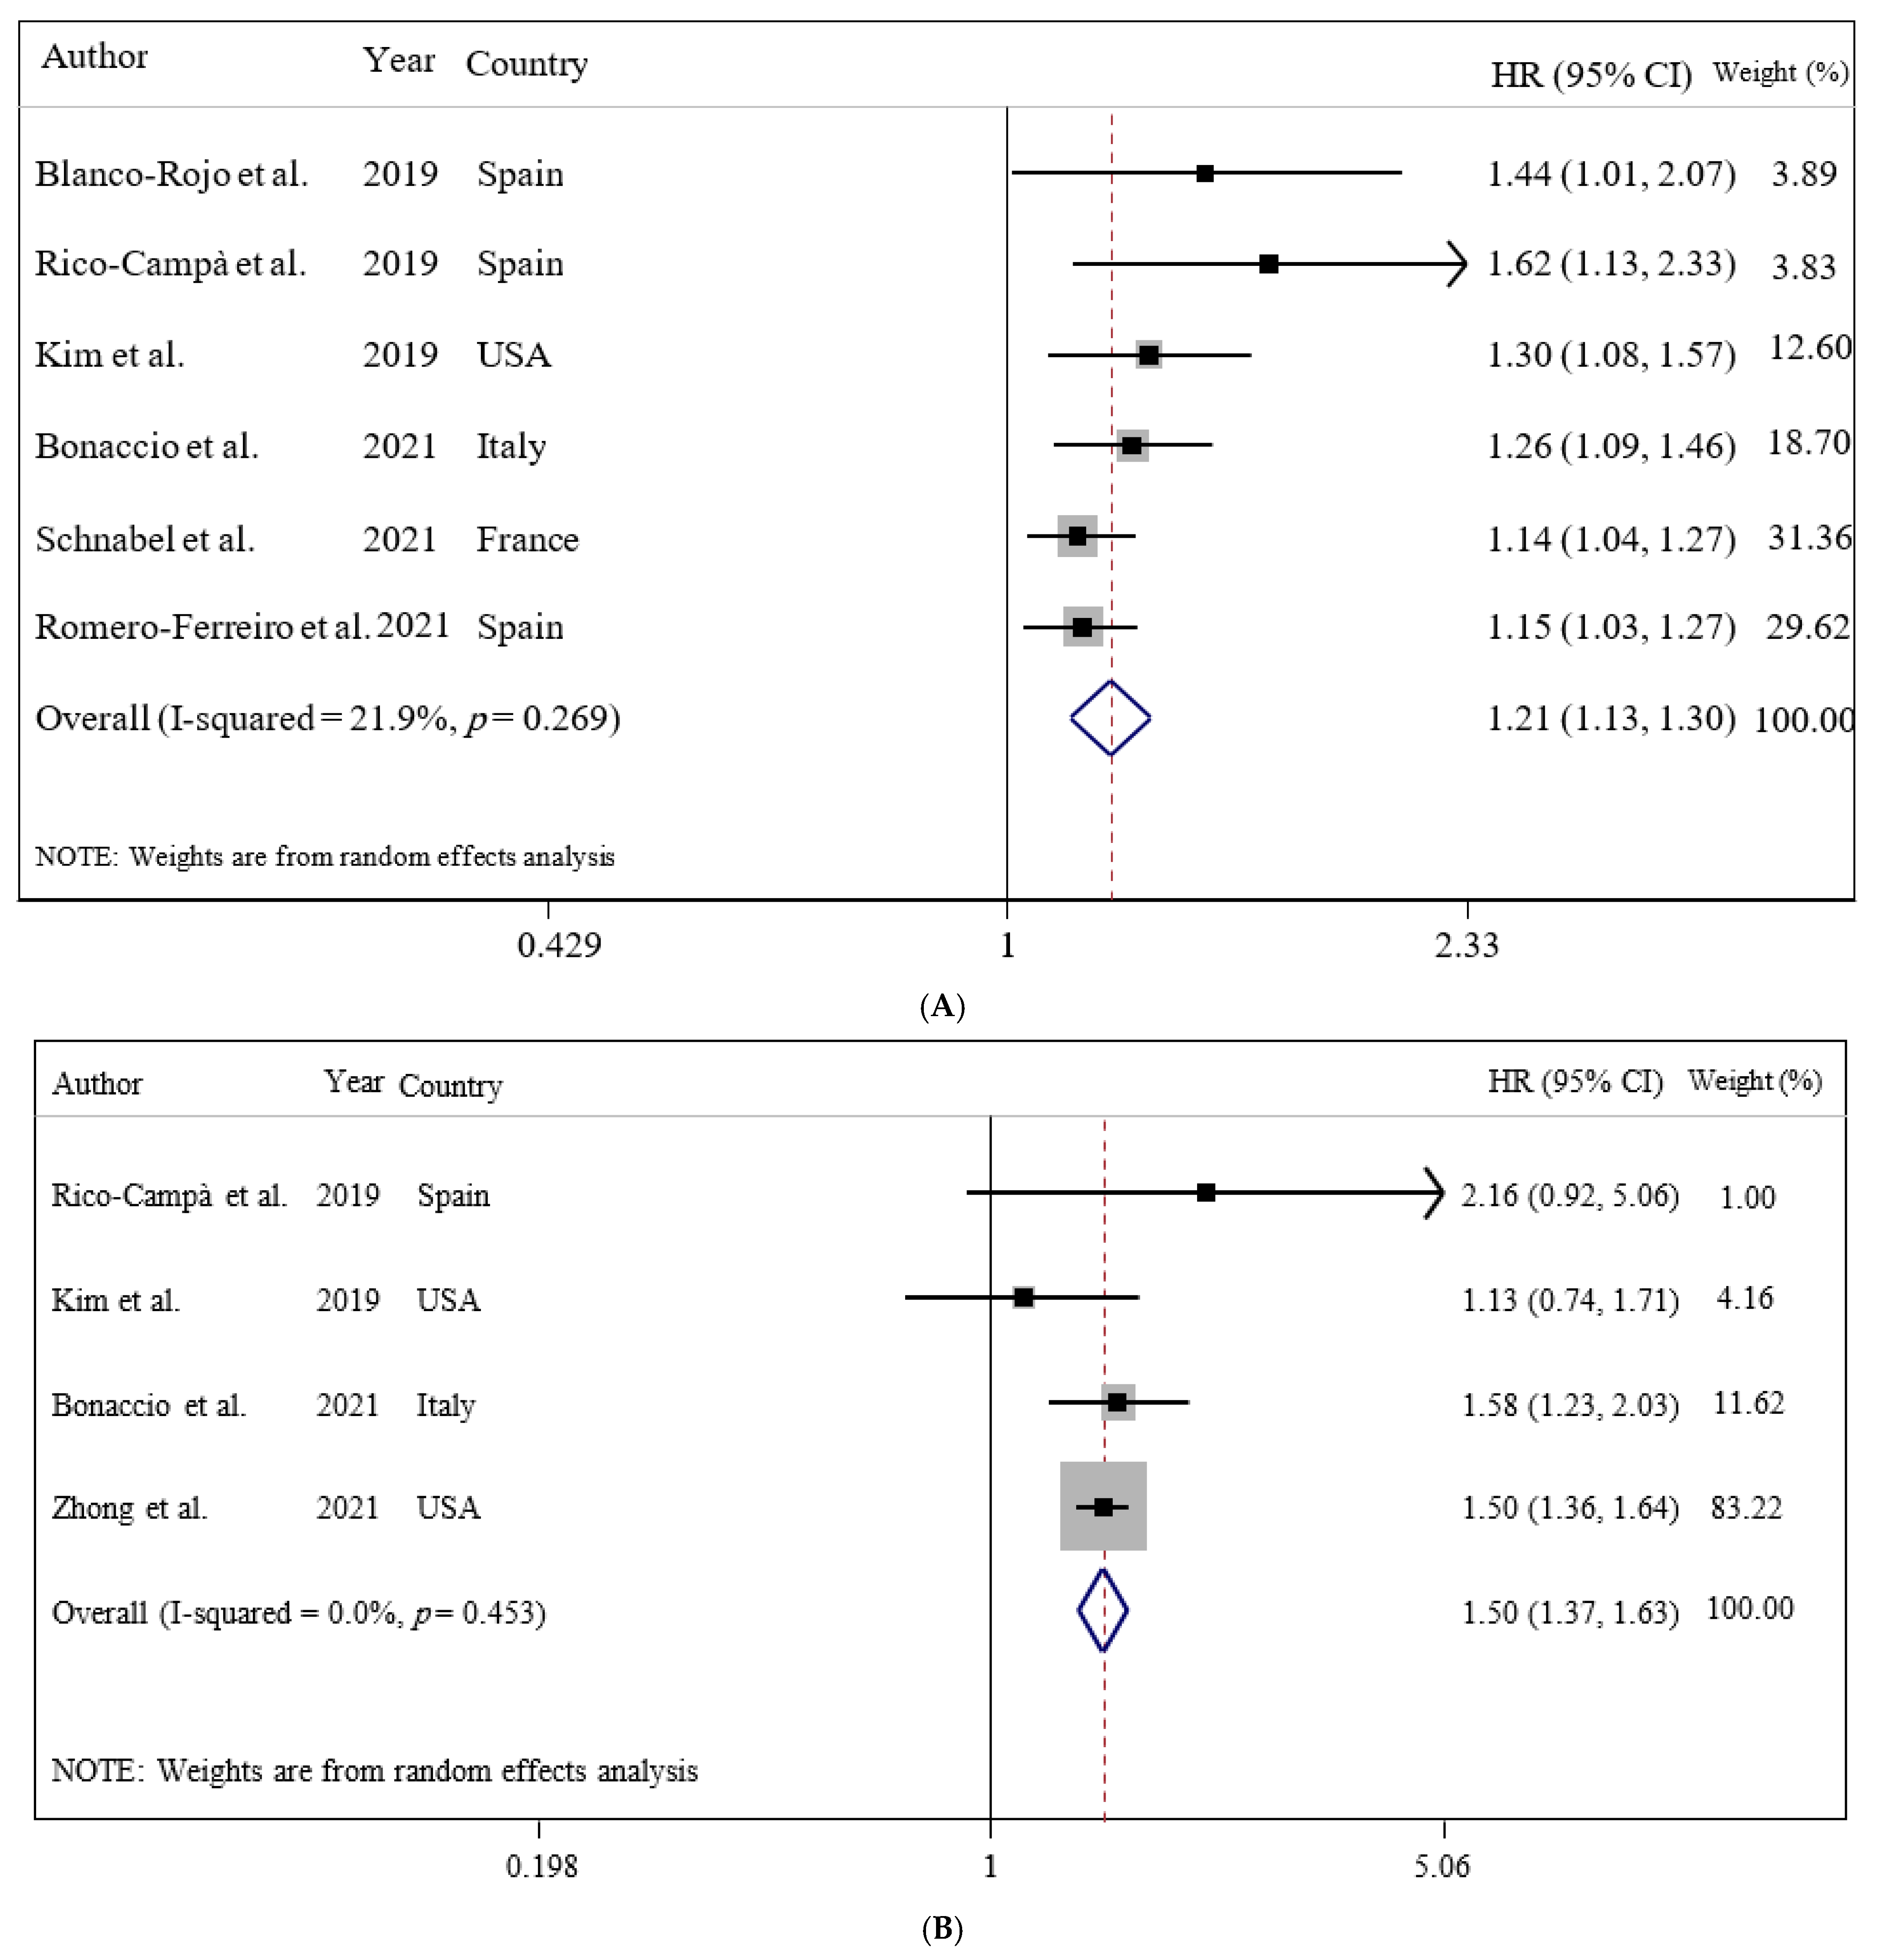
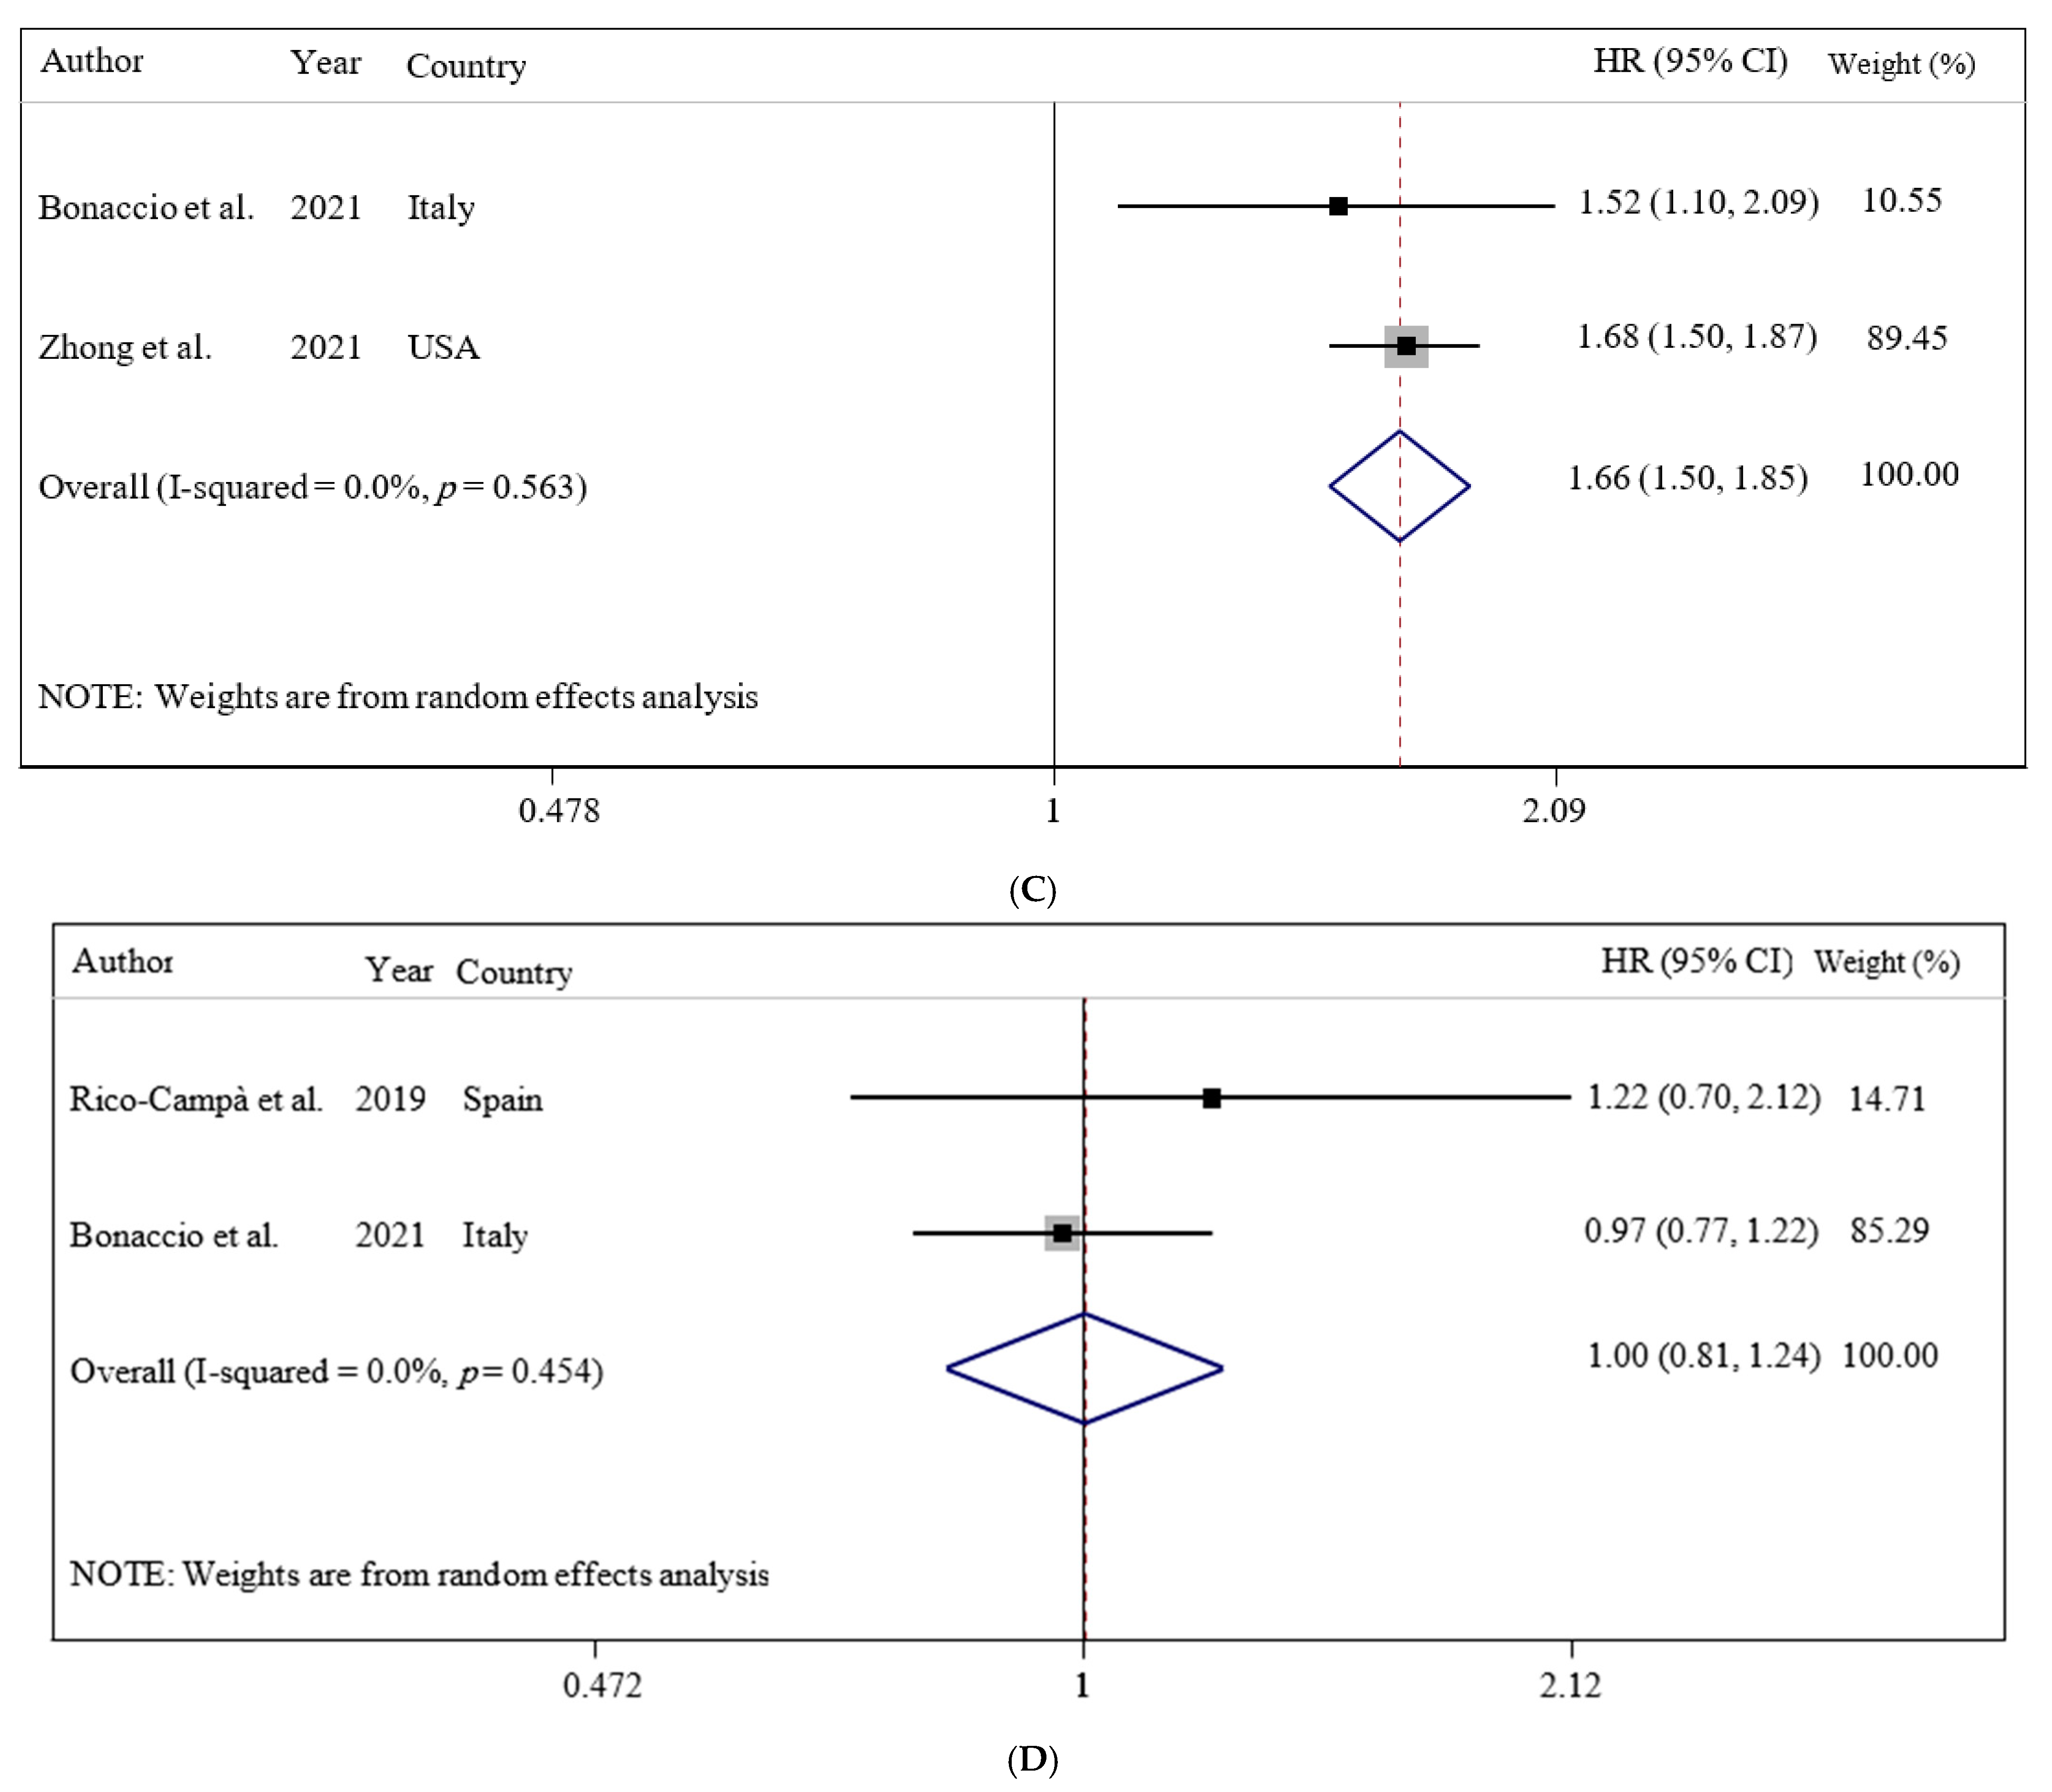
| Blanco-Rojo et al. (2019, Spain) | Prospective cohort/7.7 years/the Study on Nutrition and Cardiovascular Risk in Spain (ENRICA)/healthy subjects | N = 11,898/age 55 ± 12 years/BMI = NR (6008/5890) | 24 h recalls/NOVA food classification/frequency of ultra-processed food intake | Adults in the highest quartile versus the lowest of UPF consumption had higher risk of mortality (HR: 1.44; 95% CI: 1.01, 2.07). | Sex and age, educational level, living alone, smoking status, former drinker, physical activity index, time watching television, time devoted to other sedentary activities, the number of medications per day, and specific chronic conditions diagnosed by a physician | +8/10 |
| Rico-Campà et al. (2019, Spain) | Prospective cohort/15 years/the Seguimiento Universidad de Navarra (SUN) project/healthy subjects | N = 19,899/age = 37.6 ± 12.3 years/BMI = 23.5 ± 3.5/(12,113/7786) | FFQ/NOVA food classification/frequency of ultra-processed food intake | UPF consumption had a higher hazard for all-cause mortality compared with those in the lowest quarter (HR = 1.62: 95% CI: 1.13 to 2.33). | Age, sex, marital status, physical activity, smoking status, snacking, special diet at baseline, body mass index, total energy intake, alcohol consumption, family history of cardiovascular disease, diabetes at baseline, hypertension at baseline, self-reported hypercholesterolemia at baseline, CVD at baseline, cancer at baseline, depression at baseline, education level and lifelong smoking stratified by recruitment period, deciles of age, sedentary index, and television viewing | +9/10 |
| Kim et al. (2019, USA) | Prospective cohort/19 years/the Third National Health and Nutrition Examination Survey (NHANES III, 1988–1994)/healthy subjects | N = 11,898/age = 42 ± 0.5 years/BMI = 26.2 ± 0.2/(6067/5830) | FFQ/NOVA food classification/frequency of ultra-processed food intake | Higher frequency of ultra-processed food intake was associated with higher risk of all-cause mortality in a representative sample of US adults (HR = 1.31: 95% CI: 1.09 to 1.58). | Age, sex, race/ethnicity, total energy intake, poverty level, education level, smoking status, physical activity, alcohol intake, BMI, hypertension status, total cholesterol, and estimated glomerular filtration rate | +9/10 |
| Bonaccio et al. (2021, Italy) | Prospective cohort/8.2 years/Moli-sani Study (2005–2010, Italy)/healthy subjects | N = 22,475/age = 55 ± 12/BMI = 28.2 ± 4.7/years/(10,702/11,733) | FFQ/NOVA food classification/proportion of UPF in the total weight of food and beverages consumed (g/day) | Adults in the highest quartile of UPF consumption had higher risk of CVD mortality (HR: 1.58; 95% CI: 1.23, 2.03). | Sex, age, energy intake, educational level, housing tenure, smoking, BMI, leisure time physical activity, history of cancer, CVDs, diabetes, hypertension, hyperlipidemia, and residence Mediterranean Diet Score | +9/10 |
| Zhong et al. (2021, USA) | Prospective cohort/13.5 years/the Prostate, Lung, Colorectal, and Ovarian (PLCO)/healthy subjects | N = 91,891/age = >35 years/BMI = NR/(NR/NR) | FFQ/NOVA food classification/frequency of ultra-processed food intake | Participants in the highest vs. the lowest quintiles of ultra-processed food consumption had higher risks of death from cardiovascular disease (HR = 1.50; 95% CI: 1.36, 1.64) and heart disease (HR: 1.68; 95% CI: 1.50, 1.87) but not cerebrovascular disease (HR = 0.94; 95% CI: 0.76, 1.17). | Age, sex, race, educational, marital status, study center, aspirin use, history of hypertension, history of diabetes, smoking status, alcohol consumption, body mass index, physical activity, and energy intake from diet | +9/10 |
| Schnabel et al. (2021, France) | Prospective cohort/2 years/the NutriNet-Santé Study/healthy subjects | N = 44 551/age = 56.7 ± 7.5 years/BMI = NR/(32,459/12,092) | 24-h recalls/NOVA food classification/proportion of total energy | An increase in the proportion of UPF consumed was associated with a higher risk of all-cause mortality (HR = 1.14; 95% CI: 1.04, 1.27). | Sex, age, income level, education level, marital status, residence, BMI, physical activity level, smoking status, energy intake, alcohol intake, season of food records, first-degree family history of cancer or cardiovascular diseases, and number of food records | +8/10 |
| Romero Ferreiro et al. (2021, Spain) | Prospective cohort/27 years/the multicenter study Diet and Risk of Cardiovascular Diseases (CVDs) in Spain (DRECE)/healthy subjects | N = 4679/age = 35.5 ± 15.6 years/BMI = 24.2 ± 5/(2391/2288) | FFQ/NOVA food classification/proportion of total energy | For every 10% of the energy intake from UPF consumption, an increase of 15% in the hazard of all-cause mortality was observed (HR, 1.15; 95% CI, 1.03–1.27). | Age, sex, BMI, physical activity, alcohol intake, smoking status and total energy intake, family history of CVDs, history of diabetes, hypertension, anger, myocardial infarction, and atherosclerosis | +9/10 |
| Subgrouped by | No. of Effect Size | HR 1 | 95% CI | p-Value | Heterogeneity | ||
|---|---|---|---|---|---|---|---|
| p-Values for within Groups | I2 (%) | p-Values for between Groups | |||||
| All-cause mortality | |||||||
| Body mass index | |||||||
| Less than 25 | 1 | 1.62 | 1.13 to 2.33 | 0.009 | <0.001 | 0.0 | 0.407 |
| More than 25 | 2 | 1.28 | 1.14 to 1.43 | <0.001 | 0.790 | 0.0 | |
| Assessment tools | |||||||
| Food record | 1 | 1.44 | 1.01 to 2.07 | 0.046 | <0.001 | 0.0 | 0.603 |
| Food frequency | 3 | 1.30 | 1.17 to 1.45 | <0.001 | 0.454 | 0.0 | |
| Follow-up duration | |||||||
| Less than 10 years | 2 | 1.28 | 1.12 to 1.47 | <0.001 | 0.493 | 0.0 | 0.592 |
| More than 10 years | 2 | 1.37 | 1.14 to 1.65 | 0.001 | 0.295 | 10.8 | |
| Region | |||||||
| America | 1 | 1.30 | 1.08 to 1.57 | 0.006 | <0.001 | 0.0 | 0.888 |
| Europe | 3 | 1.32 | 1.16 to 1.50 | <0.001 | 0.391 | 0.0 | |
| CVDs-cause mortality | |||||||
| Body mass index | |||||||
| Less than 25 | 1 | 2.16 | 0.92 to 5.07 | 0.077 | <0.001 | 0.0 | 0.175 |
| More than 25 | 2 | 1.40 | 1.02 to 1.92 | 0.039 | 0.175 | 44.8 | |
| Follow-up duration | |||||||
| Less than 10 years | 1 | 1.58 | 1.23 to 2.03 | <0.001 | <0.001 | 0.0 | 0.064 |
| More than 10 years | 3 | 1.22 | 1.08 to 1.37 | 0.001 | 0.397 | 0.0 | |
| Region | |||||||
| America | 2 | 1.20 | 1.07 to 1.35 | 0.002 | 0.753 | 0.0 | 0.030 |
| Europe | 2 | 1.62 | 1.27 to 2.06 | <0.001 | 0.496 | 0.0 | |
Publisher’s Note: MDPI stays neutral with regard to jurisdictional claims in published maps and institutional affiliations. |
© 2021 by the authors. Licensee MDPI, Basel, Switzerland. This article is an open access article distributed under the terms and conditions of the Creative Commons Attribution (CC BY) license (https://creativecommons.org/licenses/by/4.0/).
Share and Cite
Suksatan, W.; Moradi, S.; Naeini, F.; Bagheri, R.; Mohammadi, H.; Talebi, S.; Mehrabani, S.; Hojjati Kermani, M.a.; Suzuki, K. Ultra-Processed Food Consumption and Adult Mortality Risk: A Systematic Review and Dose–Response Meta-Analysis of 207,291 Participants. Nutrients 2022, 14, 174. https://doi.org/10.3390/nu14010174
Suksatan W, Moradi S, Naeini F, Bagheri R, Mohammadi H, Talebi S, Mehrabani S, Hojjati Kermani Ma, Suzuki K. Ultra-Processed Food Consumption and Adult Mortality Risk: A Systematic Review and Dose–Response Meta-Analysis of 207,291 Participants. Nutrients. 2022; 14(1):174. https://doi.org/10.3390/nu14010174
Chicago/Turabian StyleSuksatan, Wanich, Sajjad Moradi, Fatemeh Naeini, Reza Bagheri, Hamed Mohammadi, Sepide Talebi, Sanaz Mehrabani, Mohammad ali Hojjati Kermani, and Katsuhiko Suzuki. 2022. "Ultra-Processed Food Consumption and Adult Mortality Risk: A Systematic Review and Dose–Response Meta-Analysis of 207,291 Participants" Nutrients 14, no. 1: 174. https://doi.org/10.3390/nu14010174
APA StyleSuksatan, W., Moradi, S., Naeini, F., Bagheri, R., Mohammadi, H., Talebi, S., Mehrabani, S., Hojjati Kermani, M. a., & Suzuki, K. (2022). Ultra-Processed Food Consumption and Adult Mortality Risk: A Systematic Review and Dose–Response Meta-Analysis of 207,291 Participants. Nutrients, 14(1), 174. https://doi.org/10.3390/nu14010174