
Review of the Nutrition Situation in Jordan: Trends and Way Forward

 , , , , , and
Abstract

1. Introduction
2. Methods
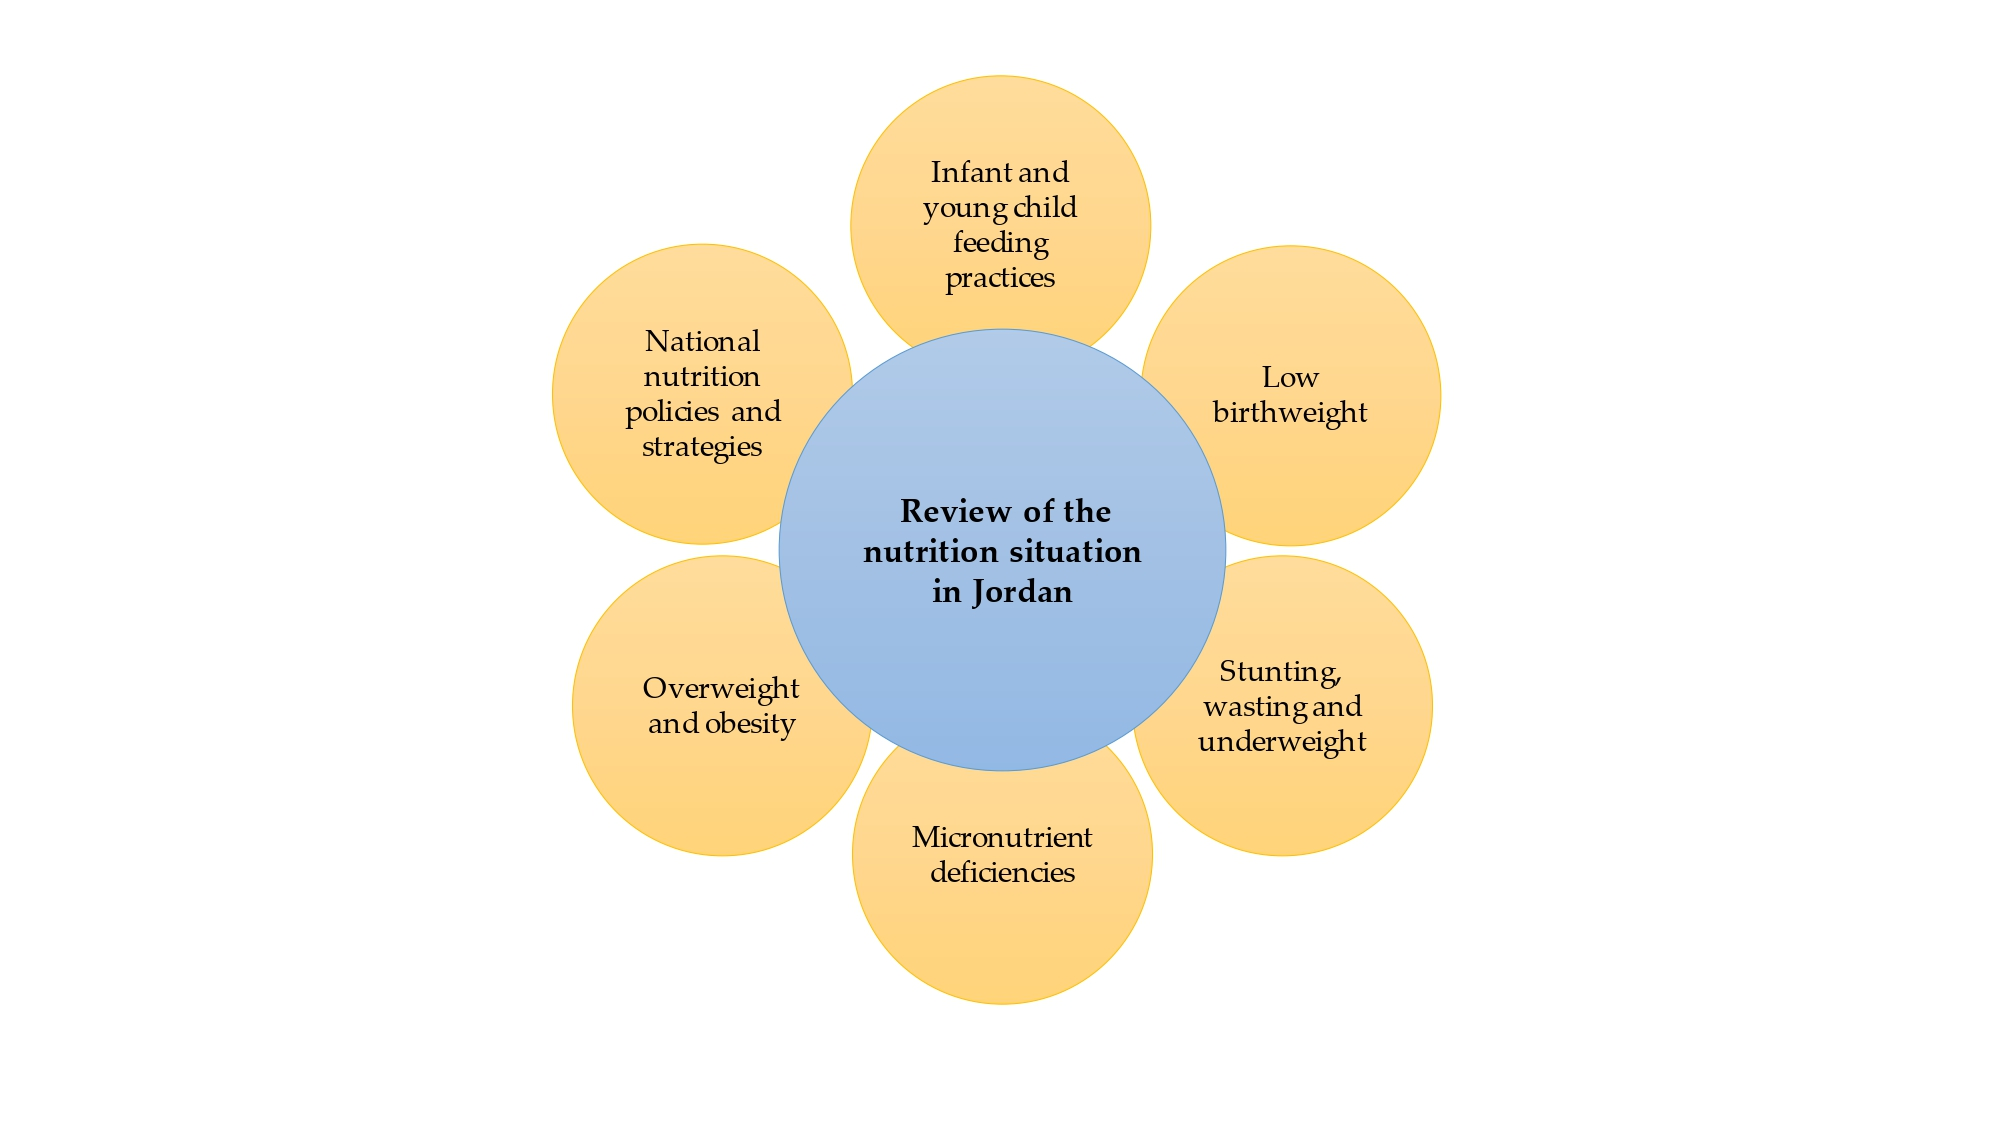
3. Results
3.1. Infant and Young Child Feeding Practices
3.1.1. Breastfeeding Indicators
3.1.2. Complementary Feeding Indicators
3.2. Low Birthweight
3.3. Stunting, Wasting and Underweight among Children under 5 Years
3.4. Micronutrient Deficiencies
3.4.1. Anemia
Children under 5 Years
Women of Reproductive Age
3.4.2. Vitamin A Deficiency
Children under 5 Years
Women of Reproductive Age
3.4.3. Vitamin D Deficiency
Children under 5 Years
Adults and Women of Reproductive Age
3.4.4. Iodine Deficiency
3.5. Overweight and Obesity
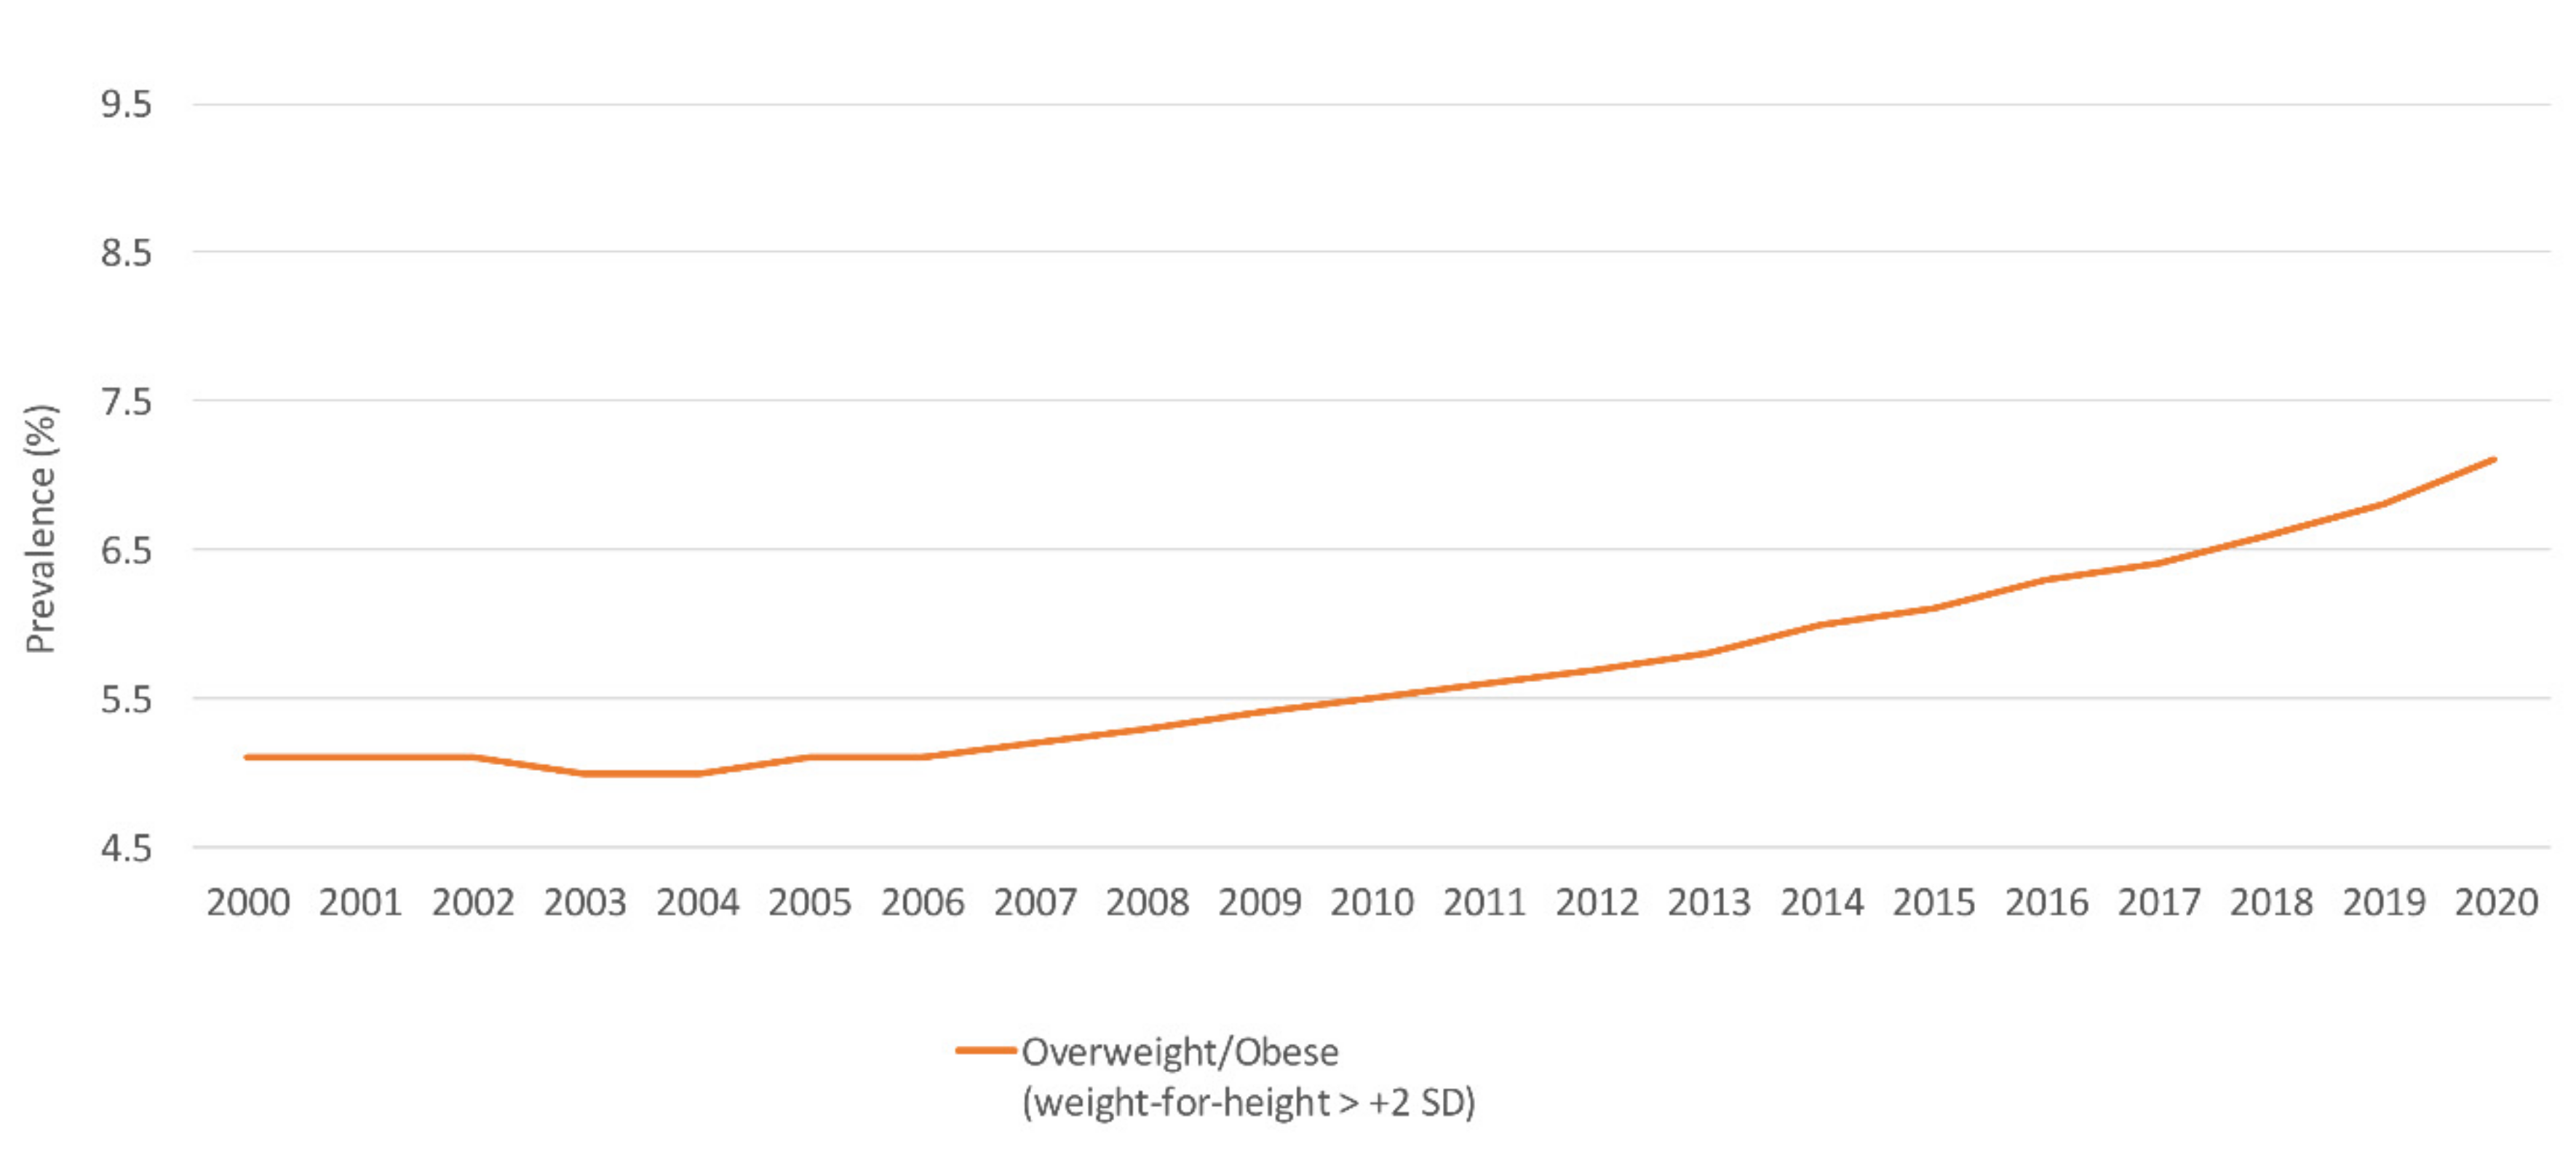
3.5.1. Children under 5 Years
3.5.2. School-Aged Children and Adolescents
3.5.3. Adults and Women of Reproductive Age
3.6. Food Consumption Patterns
3.6.1. Children under 5 Years and Adolescents
3.6.2. Adults and Women of Reproductive Age
3.7. National Nutrition Policies and Strategies in Jordan
3.7.1. The Baby Friendly Hospital Initiative (BFHI) and the International Code of Marketing of Breast-Milk Substitutes
3.7.2. Food Fortification and Micronutrient Supplementation
3.7.3. Multisectoral Coordination to Tackle Obesity
4. Discussion
5. Recommendations
Author Contributions
Funding
Institutional Review Board Statement
Informed Consent Statement
Data Availability Statement
Conflicts of Interest
References
- World Health Organization. Malnutrition. 2021. Available online: https://www.who.int/news-room/fact-sheets/detail/malnutrition (accessed on 2 October 2021).
- Global Nutrition Report. 2020 Global Nutrition Report: Action on Equity to End Malnutrition; Development Initiatives: Bristol, UK, 2020; Available online: https://globalnutritionreport.org/reports/2020-global-nutrition-report/ (accessed on 4 October 2021).
- Nasreddine, L.; Ayoub, J.; Al Jawaldeh, A. Review of the nutrition situation in the Eastern Mediterranean Region. East. Mediterr. Health J. 2018, 24, 77–92. [Google Scholar] [CrossRef] [PubMed]
- World Health Organization Regional Office for the Eastern Mediterranean. Strategy on Nutrition for the Eastern Mediterranean Region 2020–2030. World Health Organization. Regional Office for the Eastern Mediterranean. License: CC BY-NC-SA 3.0 IGO. 2019. Available online: https://apps.who.int/iris/handle/10665/330059 (accessed on 3 October 2021).
- World Health Organization Regional Office for the Eastern Mediterranean. Nutrition: Malnutrition. Malnutrition in All Its Forms. 2021. Available online: http://www.emro.who.int/nutrition/double-burden-of-nutrition/index.html (accessed on 5 October 2021).
- Groce, N.; Challenger, E.; Berman-Bieler, R.; Farkas, A.; Yilmaz, N.; Schultink, W.; Clark, D.; Kaplan, C.; Kerac, M. Malnutrition and disability: Unexplored opportunities for collaboration. Paediatr. Int. Child. Health 2014, 34, 308–314. [Google Scholar] [CrossRef] [PubMed]
- Black, R.E.; Victora, C.G.; Walker, S.P.; Bhutta, Z.A.; Christian, P.; De Onis, M.; Ezzati, M.; Grantham-McGregor, S.; Katz, J.; Martorell, R. Maternal and child undernutrition and overweight in low-income and middle-income countries. Lancet 2013, 382, 427–451. [Google Scholar] [CrossRef]
- Itoh, H.; Kanayama, N. Nutritional conditions in early life and risk of non-communicable diseases (NCDs) from the perspective of preemptive medicine in perinatal care. Hypertens Res. Pregnancy 2015, 3, 1–12. [Google Scholar] [CrossRef]
- World Health Organization. Comprehensive Implementation Plan on Maternal, Infant and Young Child Nutrition. 2014. Available online: https://apps.who.int/iris/bitstream/handle/10665/113048/WHO_NMH_NHD_14.1_eng.pdf (accessed on 27 September 2021).
- World Health Organization. Obesity and Overweight. 2021. Available online: https://www.who.int/news-room/fact-sheets/detail/obesity-and-overweight (accessed on 1 October 2021).
- Di Cesare, M.; Sorić, M.; Bovet, P.; Miranda, J.J.; Bhutta, Z.; Stevens, G.A.; Laxmaiah, A.; Kengne, A.-P.; Bentham, J. The epidemiological burden of obesity in childhood: A worldwide epidemic requiring urgent action. BMC Med. 2019, 17, 212. [Google Scholar] [CrossRef] [PubMed]
- Hu, F.B. Overweight and obesity in women: Health risks and consequences. J. Women’s Health 2003, 12, 163–172. [Google Scholar] [CrossRef] [PubMed]
- The World Bank. World Bank Country and Lending Groups. 2021. Available online: https://datahelpdesk.worldbank.org/knowledgebase/articles/906519 (accessed on 5 October 2021).
- Nasreddine, L.M.; Kassis, A.N.; Ayoub, J.J.; Naja, F.A.; Hwalla, N.C. Nutritional status and dietary intakes of children amid the nutrition transition: The case of the Eastern Mediterranean Region. Nutr. Res. 2018, 57, 12–27. [Google Scholar] [CrossRef] [PubMed]
- UNICEF. Infant and Young Child Feeding. 2021. Available online: https://data.unicef.org/topic/nutrition/infant-and-young-child-feeding/ (accessed on 7 August 2021).
- UNICEF. Malnutrition. 2021. Available online: https://data.unicef.org/topic/nutrition/malnutrition/ (accessed on 10 August 2021).
- UNICEF. Malnutrition Data. 2021. Available online: https://data.unicef.org/resources/dataset/malnutrition-data/ (accessed on 10 August 2021).
- World Health Organization. The Global Health Observatory: Explore a World of Health Data. 2021. Available online: https://www.who.int/data/gho/data/indicators (accessed on 17 August 2021).
- World Health Organization. Global School-Based Student Health Survey. 2021. Available online: https://www.who.int/teams/noncommunicable-diseases/surveillance/systems-tools/global-school-based-student-health-survey (accessed on 27 August 2021).
- World Health Organization. STEPwise Approach to NCD Risk Factor Surveillance (STEPS). 2021. Available online: https://www.who.int/teams/noncommunicable-diseases/surveillance/systems-tools/steps (accessed on 15 August 2021).
- World Health Organization. Global Nutrition Monitoring Framework: Operational Guidance for Tracking Progress in Meeting targets for 2025; World Health Organization: Geneva, Switzerland, 2017; License: CC BY-NC-SA 3.0 IGO. [Google Scholar]
- Geneva: World Health Organization and the United Nations Children’s Fund (UNICEF). Indicators for Assessing Infant and Young Child Feeding Practices: Definitions and Measurement Methods. License: CC BYNC-SA 3.0 IGO. 2021. Available online: https://creativecommons.org/licenses/by-nc-sa/3.0/igo (accessed on 10 August 2021).
- UNICEF. Low Birthweight. A Good Start in Life Begins in the Womb. 2019. Available online: https://data.unicef.org/topic/nutrition/low-birthweight/ (accessed on 17 September 2021).
- WHO Multicentre Growth Reference Study Group. WHO Child Growth Standards Based on Length/Height, Weight and Age. Acta Paediatr. Suppl. 2006, 450, 76–85. [Google Scholar]
- UNICEF/WHO/The World Bank Group. UNICEF/WHO/The World Bank Group Joint Child Malnutrition Estimates: Levels and Trends in Child Malnutrition: Key Findings of the 2021 Edition. 2021. Available online: https://www.who.int/publications/i/item/9789240025257 (accessed on 16 September 2021).
- World Health Organization. Haemoglobin Concentrations for the Diagnosis of Anaemia and Assessment of Severity. Vitamin and Mineral Nutrition Information System. Geneva, World Health Organization (WHO/NMH/NHD/MNM/11.1). 2011. Available online: https://www.who.int/vmnis/indicators/haemoglobin.pdf (accessed on 4 October 2021).
- World Health Organization. WHO Guideline on Use of Ferritin Concentrations to Assess Iron Status in Individuals and Populations; World Health Organization: Geneva, Switzerland, License: CC BY-NC-SA 3.0 IGO; 2020; Available online: https://apps.who.int/iris/handle/10665/331505 (accessed on 5 October 2021).
- Al-Jawaldeh, A.; Taktouk, M.; Doggui, R.; Abdollahi, Z.; Achakzai, B.; Aguenaou, H.; Al-Halaika, M.; Almamary, S.; Barham, R.; Coulibaly-Zerbo, F. Are Countries of the Eastern Mediterranean Region on Track towards Meeting the World Health Assembly Target for Anemia? A Review of Evidence. Int. J. Environ. Res. Public Health 2021, 18, 2449. [Google Scholar] [CrossRef] [PubMed]
- World Health Organization. Serum Retinol Concentrations for Determining the Prevalence of Vitamin A Deficiency in Populations. Vitamin and Mineral Nutrition Information System. Geneva, World Health Organization (WHO/NMH/NHD/MNM/11.3). 2011. Available online: http://www.who.int/vmnis/indicators/retinol.pdf (accessed on 25 September 2021).
- Amrein, K.; Scherkl, M.; Hoffmann, M.; Neuwersch-Sommeregger, S.; Köstenberger, M.; Berisha, A.T.; Martucci, G.; Pilz, S.; Malle, O. Vitamin D deficiency 2.0: An update on the current status worldwide. Eur. J. Clin. Nutr. 2020, 74, 1498–1513. [Google Scholar] [CrossRef] [PubMed]
- Institute of Medicine. Dietary Reference Intake for Calcium and Vitamin D; Institute of Medicine: Washington, DC, USA, 2011. [Google Scholar]
- Gallagher, J.C.; Sai, A.J. Vitamin D Insufficiency, Deficiency, and Bone Health; Oxford University Press: Oxford, UK, 2010; Volume 95, pp. 2630–2633. [Google Scholar]
- World Health Organization. Urinary Iodine Concentrations for Determining Iodine Status Deficiency in Populations. Vitamin and Mineral Nutrition Information System. Geneva: World Health Organization. 2013. Available online: https://www.who.int/publications/i/item/WHO-NMH-NHD-EPG-13.1 (accessed on 21 September 2021).
- World Health Organization. Goitre as a Determinant of the Prevalence and Severity of Iodine Deficiency Disorders in Populations. Vitamin and Mineral Nutrition Information System. Geneva: World Health Organization (WHO/NMH/NHD/MNM/14.5). 2014. Available online: http://apps.who.int/iris/bitstream/handle/10665/133706/WHO_NMH_NHD_EPG_14.5_eng.pdf?sequence=1 (accessed on 25 September 2021).
- Center for Disease Control and Prevention. Defining Childhood Weight Status. 2021. Available online: https://www.cdc.gov/obesity/childhood/defining.html (accessed on 4 October 2021).
- Department of Statistics (DOS) and ICF. Jordan Population and Family Health Survey 2017–2018; DOS and ICF: Amman, Jordan; Rockville, MD, USA, 2019. [Google Scholar]
- Neves, P.A.; Vaz, J.S.; Maia, F.S.; Baker, P.; Gatica-Domínguez, G.; Piwoz, E.; Rollins, N.; Victora, C.G. Rates and time trends in the consumption of breastmilk, formula, and animal milk by children younger than 2 years from 2000 to 2019: Analysis of 113 countries. Lancet Child. Adolesc. Health 2021, 5, 619–630. [Google Scholar] [CrossRef]
- Islam, M.M.; Ababneh, F.; Akter, T.; Khan, H.R. Prevalence and risk factors for low birth weight in Jordan and its association with under-five mortality: A population-based analysis. East. Mediterr. Health J. 2020, 26, 1273–1284. [Google Scholar] [CrossRef]
- Department of Statistics (DOS) [Jordan] and ICF International. Jordan Population and Family Health Survey 2012; Department of Statistics and ICF International: Calverton, MD, USA, 2013. [Google Scholar]
- Department of Statistics (DOS) [Jordan] and Macro International Inc. Jordan Population and Family Health Survey 2007; Department of Statistics and Macro International Inc.: Calverton, MD, USA, 2008. [Google Scholar]
- Department of Statistics (DOS) [Jordan] and ORC Macro. Jordan Population and Family Health Survey 2002; Department of Statistics & ORC Macro: Calverton, MD, USA, 2003. [Google Scholar]
- Department of Statistics (DOS) [Jordan] and Macro International Inc. Jordan Population and Family Health Survey 1997; Department of Statistics & Macro International: Calverton, MD, USA, 1998. [Google Scholar]
- Department of Statistics (DOS) [Jordan] and IRD/Macro International. Jordan Population and Family Health Survey 1990; Department of Statistics & IRD/Macro International: Calverton, MD, USA, 1992. [Google Scholar]
- World Health Organization. Global Health Observatory Data Repository. Child Malnutrition by Country. Available online: https://apps.who.int/gho/data/node.main.CHILDMALNUTRITION?lang=en (accessed on 14 August 2021).
- FAO. Food and Nutrition Profile, Jordan. 2011. Available online: http://www.fao.org/3/aq039e/aq039e.pdf (accessed on 18 September 2021).
- Ministry of Health-Jordan; Global Alliance for Improved Nutrition (GAIN); United States Center for Disease Control and Prevention (CDC); United Nation Children’s Fund (UNICEF). National Micronutrient Survey-Jordan 2010; Ministry of Health: Amman, Jordan, 2011. [Google Scholar]
- Serdula, M.; Nichols, E.; Aburto, N.; Masa’d, H.; Obaid, B.; Wirth, J.; Tarawneh, M.; Barham, R.; Hijawi, B.; Sullivan, K. Micronutrient status in Jordan: 2002 and 2010. Eur. J. Clin. Nutr. 2014, 68, 1124–1128. [Google Scholar] [CrossRef]
- World Health Organization. Global Health Observatory Data Repository. Anaemia in Children <5 Years: Estimates by Country. 2021. Available online: https://apps.who.int/gho/data/view.main.ANEMIACHILDRENv?lang=en (accessed on 18 August 2021).
- World Health Organization. Vitamin and Mineral Nutrition Information System (VMNIS). WHO Global Database on Vitamin A Deficiency. The Vitamin A Deficiency Database Includes Data by Country Based on Xerophthalmia and/or Serum or Plasma retinol Concentration. 2006. Available online: https://www.who.int/vmnis/vitamina/data/database/countries/jor_vita.pdf (accessed on 4 September 2021).
- Nichols, E.K.; Khatib, I.M.D.; Aburto, N.J.; Serdula, M.K.; Scanlon, K.S.; Wirth, J.P.; Sullivan, K.M. Vitamin D status and associated factors of deficiency among Jordanian children of preschool age. Eur. J. Clin. Nutr. 2015, 69, 90–95. [Google Scholar] [CrossRef]
- El-Khateeb, M.; Khader, Y.; Batieha, A.; Jaddou, H.; Hyassat, D.; Khawaja, N.; Abujbara, M.; Ajlouni, K. Vitamin D deficiency and associated factors in Jordan. SAGE Open Med. 2019, 7, 2050312119876151. [Google Scholar] [CrossRef]
- Batieha, A.; Khader, Y.; Jaddou, H.; Hyassat, D.; Batieha, Z.; Khateeb, M.; Belbisi, A.; Ajlouni, K. Vitamin D status in Jordan: Dress style and gender discrepancies. Annu. Nutr. Metab. 2011, 58, 10–18. [Google Scholar] [CrossRef]
- Nichols, E.; Khatib, I.; Aburto, N.; Sullivan, K.; Scanlon, K.; Wirth, J.; Serdula, M. Vitamin D status and determinants of deficiency among non-pregnant Jordanian women of reproductive age. Eur. J. Clin. Nutr. 2012, 66, 751–756. [Google Scholar] [CrossRef]
- WHO Regional Office for the Eastern Mediterranean. Wheat Flour Fortification in the Eastern Mediterranean Region. License: CC BY-NC-SA 3.0 IGO. 2019. Available online: https://apps.who.int/iris/handle/10665/311730?locale-attribute=fr& (accessed on 18 September 2021).
- Massa’d, H.; Barham, R. National Survey to Assess Iodine Deficiency Disorders (IDD) among Jordanian Children—2010; Jordan Ministry of Health Nutrition Department, World Health Organization Non-Communicable Disease Department: Amman, Jordan, 2011. [Google Scholar]
- World Health Organization. Vitamin and Mineral Nutrition Information System (VMNIS). WHO Global Database on Iodine Deficiency: The Database on Iodine Deficiency Includes Data by Country on Goitre Prevalence and/or Urinary Iodine Concentration. 2006. Available online: https://www.who.int/vmnis/iodine/data/database/countries/per_idd.pdf (accessed on 4 September 2021).
- Zayed, A.A.; Beano, A.M.; Haddadin, F.I.; Radwan, S.S.; Allauzy, S.A.; Alkhayyat, M.M.; Al-Dahabrah, Z.A.; Al-Hasan, Y.G.; Yousef, A.-M.F. Prevalence of short stature, underweight, overweight, and obesity among school children in Jordan. BMC Public Health 2016, 16, 1040. [Google Scholar] [CrossRef]
- Al Qaseer, B.M.; Batarseh, S.; Asaad, A. Global School-Based Student Health Survey; MoH Jordan, CDC and WHO: Amman, Jordan, 2007; Available online: https://www.who.int/ncds/surveillance/gshs/GSHS_Country_Report_Jordan_2007.pdf (accessed on 17 August 2021).
- Al Qaseer, B.M.; Al Jawhari, N.M.; Kharabsheh, S.H. Global School-Based Student Health Survey; MoH Jordan, CDC and WHO: Amman, Jordan, 2004; Available online: https://www.who.int/ncds/surveillance/gshs/final%20copy%20of%20GSHS%20Country%20Report%20of%20Jordan.pdf (accessed on 17 August 2021).
- World Health Organization. The Global Health Observatory: Explore a World of Health Data. Prevalence of Overweight among Children and Adolescents, BMI > +1 Standard Deviations above the Median (Crude Estimate) (%). 2021. Available online: https://www.who.int/data/gho/data/indicators/indicator-details/GHO/prevalence-of-overweight-among-children-and-adolescents-bmi-1-standard-deviations-above-the-median-(crude-estimate)-(-) (accessed on 14 August 2021).
- MOH. Jordan National Stepwise Survey (STEPs) for Noncommunicable Diseases Risk Factors 2019. The Ministry of Health, Jordan, WHO. 2020. Available online: https://www.who.int/publications/m/item/2019-steps-country-report-jordan (accessed on 15 August 2021).
- MOH. Jordan National Stepwise Survey (STEPs) for Noncommunicable Diseases Risk Factors 2004. The Ministry of Health, Jordan, WHO. 2004. Available online: https://www.who.int/publications/m/item/2004-steps-country-report-jordan (accessed on 18 August 2021).
- MOH. Jordan National Stepwise Survey (STEPs) for Noncommunicable Diseases Risk Factors 2007. The Ministry of Health, Jordan, WHO. 2007. Available online: https://www.who.int/publications/m/item/2007-steps-country-report-jordan (accessed on 21 August 2021).
- World Health Organization. Growth Reference Data for 5–19 Years. Indicators: BMI-for-Age (5–19 Years). 2021. Available online: https://www.who.int/toolkits/growth-reference-data-for-5to19-years/indicators/bmi-for-age (accessed on 17 August 2021).
- World Health Organization. The Global Health Observatory: Explore a World of Health Data. Prevalence of Anaemia in Children Aged 6–59 Months (%). 2021. Available online: https://www.who.int/data/gho/data/indicators/indicator-details/GHO/prevalence-of-anaemia-in-children-under-5-years-(-) (accessed on 25 August 2021).
- Hasan, M.M.; Ahmed, S.; Magalhaes, R.J.S.; Fatima, Y.; Biswas, T.; Mamun, A.A. Double burden of malnutrition among women of reproductive age in 55 low-and middle-income countries: Progress achieved and opportunities for meeting the global target. Eur. J. Clin. Nutr. 2021. [Google Scholar] [CrossRef]
- World Health Organization. Jordan STEPS Survey 2007 Fact Sheet. 2007. Available online: https://cdn.who.int/media/docs/default-source/ncds/ncd-surveillance/data-reporting/jordan/steps/2007-fact-sheet-jordan.pdf?sfvrsn=df1a70ea_2&download=true (accessed on 4 October 2021).
- World Health Organization. Policy-Nutrition in Jordan Update and Plan of Action. 2006. Available online: https://extranet.who.int/nutrition/gina/en/node/23541 (accessed on 22 October 2021).
- World Health Organization. Implementation Guidance: Protecting, Promoting and Supporting Breastfeeding in Facilities Providing Maternity and Newborn Services-the Revised Baby-Friendly Hospital Initiative; License: CC BY-NC-SA 3.0 IGO; World Health Organization: Geneva, Switzerland, 2018. [Google Scholar]
- Abul-Fadl, A.; Farghaly, N.F.; Alsumaie, M.A.; Bozo, M.; Al-Jawaldeh, A. Satisfaction with code implementation and Baby-friendly practices in the Eastern Mediterranean region: Health professional perspectives from 15 countries. Indian J. Child. Health 2021, 8, 60–69. [Google Scholar] [CrossRef]
- Al-Jawaldeh, A.; Abul-Fadl, A.; Farghaly, N.F. Enacting the Code by effective national laws influence trends in exclusive breastfeeding: An analytical study from the Eastern Mediterranean Region. Indian J. Child. Health 2021, 8, 12–19. [Google Scholar] [CrossRef]
- Al-Jawaldeh, A.; Abul-Fadl, A. Assessment of the baby friendly hospital initiative implementation in the Eastern Mediterranean Region. Children 2018, 5, 41. [Google Scholar] [CrossRef] [PubMed]
- World Health Organization Regional Office for the Eastern Mediterranean. Nutrition: Publications. Success Stories. 2021. Available online: http://www.emro.who.int/nutrition/resources/success-stories.html (accessed on 5 October 2021).
- Al-Jawaldeh, A.; Abul-Fadl, A. Trends in Infant Feeding in Countries of the Eastern Mediterranean region 1995 to 2020: Time for action. MCFC-EJB 2020, 17, 25. [Google Scholar] [CrossRef]
- Balbus, J.M.; Barouki, R.; Birnbaum, L.S.; Etzel, R.A.; Gluckman, P.D.; Grandjean, P.; Hancock, C.; Hanson, M.A.; Heindel, J.J.; Hoffman, K. Early-life prevention of non-communicable diseases. Lancet 2013, 381, 9860. [Google Scholar] [CrossRef]
- Guilloteau, P.; Zabielski, R.; Hammon, H.; Metges, C. Adverse effects of nutritional programming during prenatal and early postnatal life, some aspects of regulation and potential prevention and treatments. J. Physiol. Pharmacol. 2009, 60 (Suppl. 3), 17–35. [Google Scholar] [PubMed]
- Baker, P.; Santos, T.; Neves, P.A.; Machado, P.; Smith, J.; Piwoz, E.; Barros, A.J.; Victora, C.G.; McCoy, D. First-food systems transformations and the ultra-processing of infant and young child diets: The determinants, dynamics and consequences of the global rise in commercial milk formula consumption. Matern. Child. Nutr. 2021, 17, e13097. [Google Scholar] [CrossRef]
- UNICEF. United Nations Children’s Fund, Division of Data Research and Policy. Global UNICEF Global Databases: Infant and Young Child Feeding: Area Graphs, New York. Infant Feeding Practices. 2018. Available online: https://data.unicef.org/topic/nutrition/infant-and-young-child-feeding/ (accessed on 12 September 2021).
- Francis, J.; Mildon, A.; Stewart, S.; Underhill, B.; Tarasuk, V.; Di Ruggiero, E.; Sellen, D.; O’Connor, D.L. Vulnerable mothers’ experiences breastfeeding with an enhanced community lactation support program. Matern. Child Nutr. 2020, 16, e12957. [Google Scholar] [CrossRef]
- Witten, C.; Claasen, N.; Kruger, H.S.; Coutsoudis, A.; Grobler, H. Psychosocial barriers and enablers of exclusive breastfeeding: Lived experiences of mothers in low-income townships, North West Province, South Africa. Int. Breastfeed. J. 2020, 15, 76. [Google Scholar] [CrossRef] [PubMed]
- Shaker-Berbari, L.; Qahoush Tyler, V.; Akik, C.; Jamaluddine, Z.; Ghattas, H. Predictors of complementary feeding practices among children aged 6–23 months in five countries in the Middle East and North Africa region. Matern. Child. Nutr. 2021, 17, e13223. [Google Scholar] [CrossRef] [PubMed]
- Bortolini, G.A.; Giugliani, E.R.J.; Gubert, M.B.; Santos, L.M.P. Breastfeeding is associated with children’s dietary diversity in Brazil. Ciênc Saúde Coletiva 2019, 24, 4345–4354. [Google Scholar] [CrossRef]
- De Cosmi, V.; Scaglioni, S.; Agostoni, C. Early taste experiences and later food choices. Nutrients 2017, 9, 107. [Google Scholar] [CrossRef]
- Bimpong, K.A.; Cheyuo, E.K.-E.; Abdul-Mumin, A.; Ayanore, M.A.; Kubuga, C.K.; Mogre, V. Mothers’ knowledge and attitudes regarding child feeding recommendations, complementary feeding practices and determinants of adequate diet. BMC Nutr. 2020, 6, 67. [Google Scholar] [CrossRef]
- Kostecka, M.; Jackowska, I.; Kostecka, J. Factors Affecting Complementary Feeding of Infants. A Pilot Study Conducted after the Introduction of New Infant Feeding Guidelines in Poland. Nutrients 2021, 13, 61. [Google Scholar] [CrossRef]
- UNICEF. Improving Young Children’s Diets during the Complementary Feeding Period. UNICEF Programming Guidance. New York: UNICEF. 2020. Available online: https://www.unicef.org/media/93981/file/Complementary-Feeding-Guidance-2020.pdf (accessed on 16 September 2021).
- Abdurahman, A.A.; Chaka, E.E.; Bule, M.H.; Niaz, K. Magnitude and determinants of complementary feeding practices in Ethiopia: A systematic review and meta-analysis. Heliyon 2019, 5, e01865. [Google Scholar] [CrossRef] [PubMed]
- Dhami, M.V.; Ogbo, F.A.; Osuagwu, U.L.; Agho, K.E. Prevalence and factors associated with complementary feeding practices among children aged 6–23 months in India: A regional analysis. BMC Public Health 2019, 19, 1034. [Google Scholar] [CrossRef] [PubMed]
- Manikam, L.; Sharmila, A.; Dharmaratnam, A.; Alexander, E.C.; Kuah, J.Y.; Prasad, A.; Ahmed, S.; Lingam, R.; Lakhanpaul, M. Systematic review of infant and young child complementary feeding practices in South Asian families: The Pakistan perspective. Public Health Nutr. 2018, 21, 655–668. [Google Scholar] [CrossRef] [PubMed]
- Reinbott, A.; Jordan, I. Determinants of child malnutrition and infant and young child feeding approaches in Cambodia. Hidden Hunger 2016, 115, 61–67. [Google Scholar] [CrossRef]
- Al-Sagarat, A.Y.; Al-Kharabsheh, A. Traditional practices adopted by Jordanian mothers when caring for their infants in rural areas. Afr. J. Tradit. Complement. Altern. Med. 2017, 14, 1–9. [Google Scholar] [CrossRef] [PubMed]
- United Nations Children’s Fund (UNICEF) and World Health Organization (WHO). UNICEF-WHO Low Birthweight Estimates: Levels and Trends 2000–2015; World Health Organization: Geneva, Switzerland, 2019; License: CC BY-NC-SA 3.0 IGO./; Available online: https://www.unicef.org/reports/UNICEF-WHO-low-birthweight-estimates-2019 (accessed on 5 August 2021).
- Blencowe, H.; Krasevec, J.; de Onis, M.; Black, R.E.; An, X.; Stevens, G.A.; Borghi, E.; Hayashi, C.; Estevez, D.; Cegolon, L. National, regional, and worldwide estimates of low birthweight in 2015, with trends from 2000: A systematic analysis. Lancet Glob. Health 2019, 7, e849–e860. [Google Scholar] [CrossRef]
- World Health Organization. Nutrition Landscape Information System (NLIS): Country Profile Indicators Interpretation Guide. 2010. Available online: https://www.who.int/nutrition/nlis_interpretation_guide.pdf (accessed on 16 September 2021).
- UNICEF. Jordan: Health and Nutrition. Healthy Growth and Development for Every Child. 2021. Available online: https://www.unicef.org/jordan/health-and-nutrition (accessed on 17 September 2021).
- World Health Organization. The Global Health Observatory: Explore a World of Health Data. Underweight Prevalence among Children under 5 Years of Age (%) (JME). 2021. Available online: https://www.who.int/data/gho/data/indicators/indicator-details/GHO/gho-jme-underweight-prevalence (accessed on 17 September 2021).
- The Hashemite Kingdom of Jordan High Health Council. The National Strategy for Health Sector in Jordan 2016–2020. Available online: https://extranet.who.int/countryplanningcycles/sites/default/files/planning_cycle_repository/jordan/national_strategy_for_health_sector_2016-2020_jordan.pdf (accessed on 20 December 2021).
- Vaivada, T.; Akseer, N.; Akseer, S.; Somaskandan, A.; Stefopulos, M.; Bhutta, Z.A. Stunting in childhood: An overview of global burden, trends, determinants, and drivers of decline. Am. J. Clin. Nutr. 2020, 112, 777S–791S. [Google Scholar] [CrossRef]
- Sewnet, S.S.; Derseh, H.A.; Desyibelew, H.D.; Fentahun, N. Undernutrition and Associated Factors among Under-Five Orphan Children in Addis Ababa, Ethiopia, 2020: A Cross-Sectional Study. J. Nutr. Metab. 2021, 2021, 6728497. [Google Scholar] [CrossRef] [PubMed]
- World Health Organization. Reducing Stunting in Children: Equity Considerations for Achieving the Global Nutrition Targets 2025; World Health Organization: Geneva, Switzerland, 2018; License: CC BY-NC-SA 3.0 IGO. [Google Scholar]
- Benavides, J.A.; Valderrama, W.; Recuenco, S.; Uieda, W.; Suzán, G.; Avila-Flores, R.; Velasco-Villa, A.; Almeida, M.; de Andrade, F.A.; Molina-Flores, B. Defining new pathways to manage the ongoing emergence of bat rabies in Latin America. Viruses 2020, 12, 1002. [Google Scholar] [CrossRef] [PubMed]
- Arabyat, R.; Arabyat, G.; Al-Taani, G. Prevalence and risk factors of anaemia among ever-married women in Jordan. East. Mediterr. Health J. 2019, 25, 543–552. [Google Scholar] [CrossRef] [PubMed]
- Hausmann, R.; O’Brien, T.; Santos, M.A.; Grisanti, A.; Kasoolu, S.; Taniparti, N.; Tapia, J.A.; Villasmil, R. Jordan: The elements of a growth strategy. CID Work. Pap. Ser. 2019. [Google Scholar]
- Fan, F.S. Iron deficiency anemia due to excessive green tea drinking. Clin. Case Rep. 2016, 4, 1053. [Google Scholar] [CrossRef]
- Coad, J.; Conlon, C. Iron deficiency in women: Assessment, causes and consequences. Curr. Opin. Clin. Nutr. Metab. Care 2011, 14, 625–634. [Google Scholar] [CrossRef]
- Ma, Q.; Zhang, S.; Liu, J.; Wang, Q.; Shen, H.; Zhang, Y.; Liu, M. Study on the prevalence of severe anemia among non-pregnant women of reproductive age in rural China: A large population-based cross-sectional study. Nutrients 2017, 9, 1298. [Google Scholar] [CrossRef]
- World Health Organization. Nutrition Landscape Information System (NLiS). Nutrition and Nutrition-Related Health and Development Data. Vitamin A Deficiency. 2021. Available online: https://www.who.int/data/nutrition/nlis/info/vitamin-a-deficiency (accessed on 20 August 2021).
- Boxberger, K.; Reimers, A.K. Parental correlates of outdoor play in boys and girls aged 0 to 12—A systematic review. Int. J. Environ. Res. Public Health 2019, 16, 190. [Google Scholar] [CrossRef]
- Carver, A.; Timperio, A.; Hesketh, K.; Crawford, D. Are children and adolescents less active if parents restrict their physical activity and active transport due to perceived risk? Soc. Sci. Med. 2010, 70, 1799–1805. [Google Scholar] [CrossRef]
- World Health Organization. Global Health Observatory Data Repository: Prevalence of Overweight among Adults, BMI ≥ 25, Crude Estimates by WHO Region. 2017. Available online: https://apps.who.int/gho/data/view.main.BMI25CREGv (accessed on 20 September 2021).
- World Health Organization. Global Health Observatory Data Repository: Prevalence of Obesity among Adults, BMI ≥ 30, Age-Standardized Estimates by WHO Region. 2017. Available online: https://apps.who.int/gho/data/view.main.REGION2480A?lang=en (accessed on 22 September 2021).
- Tang, H.K.; Dibley, M.J.; Sibbritt, D.; Tran, H.M. Gender and socio-economic differences in BMI of secondary high school students in Ho Chi Minh city. Asia Pac. J. Clin. Nutr. 2007, 16, 74–83. [Google Scholar]
- Hamad, H.J.; Abu-Hassouneh, D.T.; Ibrahim, M.O.; Al-Islam, M.e.; Faris, E. Prevalence of obesity among Jordanian school-aged adolescents in greater Amman. J. Health Med. Nurs. 2016, 33, 91–96. [Google Scholar]
- Musaiger, A.O.; Al-Hazzaa, H.M.; Takruri, H.R.; Mokhatar, N. Change in nutrition and lifestyle in the Eastern Mediterranean Region: Health impact. J. Nutr. Metab. 2012, 2012, 436762. [Google Scholar] [CrossRef]
- Mokdad, A.H.; Forouzanfar, M.H.; Daoud, F.; El Bcheraoui, C.; Moradi-Lakeh, M.; Khalil, I.; Afshin, A.; Tuffaha, M.; Charara, R.; Barber, R.M. Health in times of uncertainty in the eastern Mediterranean region, 1990–2013: A systematic analysis for the Global Burden of Disease Study 2013. Lancet Glob. Health 2016, 4, e704–e713. [Google Scholar] [CrossRef]
- Musaiger, A.O.; Al-Hazzaa, H.M. Prevalence and risk factors associated with nutrition-related noncommunicable diseases in the Eastern Mediterranean Region. Int. J. Gen. Med. 2012, 5, 199. [Google Scholar] [CrossRef] [PubMed]
- Musaiger, A.O. Overweight and obesity in Eastern Mediterranean Region: Prevalence and possible causes. J. Obes. 2011, 2011, 407237. [Google Scholar] [CrossRef] [PubMed]
- Ajlouni, K.; Khader, Y.; Batieha, A.; Jaddou, H.; El-Khateeb, M. An alarmingly high and increasing prevalence of obesity in Jordan. Epidemiol. Health 2020, 42, e2020040. [Google Scholar] [CrossRef] [PubMed]
- Al Nsour, M.; Al Kayyali, G.; Naffa, S. Overweight and obesity among Jordanian women and their social determinants. East Mediterr. Health J. 2013, 19, 1014–1019. [Google Scholar] [CrossRef]
- World Health Organization Regional Office for the Eastern Mediterranean. Promoting Physical Activity in the Eastern Mediterranean Region through a Life-course Approach. 2014. Available online: https://applications.emro.who.int/dsaf/EMROPUB_2014_EN_1603.pdf?ua=1 (accessed on 21 December 2021).
- Nasreddine, L.; Naja, F.; Chamieh, M.C.; Adra, N.; Sibai, A.-M.; Hwalla, N. Trends in overweight and obesity in Lebanon: Evidence from two national cross-sectional surveys (1997 and 2009). BMC Public Health 2012, 12, 798. [Google Scholar] [CrossRef]
- Prospective Studies Collaboration. Body-mass index and cause-specific mortality in 900 000 adults: Collaborative analyses of 57 prospective studies. Lancet 2009, 373, 1083–1096. [Google Scholar] [CrossRef]
- World Health Organization. The Global Burden of Disease: 2004 Update. Geneva, Switzerland, 2008. Available online: https://apps.who.int/iris/handle/10665/43942 (accessed on 22 December 2021).
- World Health Organization. Healthy Diet. 2020. Available online: https://www.who.int/news-room/fact-sheets/detail/healthy-diet (accessed on 25 September 2021).
- U.S. Department of Agriculture and U.S. Department of Health and Human Services. Dietary Guidelines for Americans, 2020–2025. 9th Edition. 2020. Available online: https://www.dietaryguidelines.gov/sites/default/files/2020-12/Dietary_Guidelines_for_Americans_2020-2025.pdf (accessed on 25 September 2021).
- Abu-Mweis, S.S.; Tayyem, R.F.; Bawadi, H.A.; Musaiger, A.O.; Al-Hazzaa, H.M. Eating habits, physical activity, and sedentary behaviors of Jordanian adolescents’ residents of Amman. Med. J. Nutr. Metab. 2014, 7, 67–74. [Google Scholar] [CrossRef]
- Dalky, H.F.; Al Momani, M.H.; Al-Drabaah, T.K.; Jarrah, S. Eating habits and associated factors among adolescent students in Jordan. Clin. Nurs. Res. 2017, 26, 538–552. [Google Scholar] [CrossRef] [PubMed]
- Al-Sheyab, N.A.; Alomari, M.A. Unhealthy eating habits among adolescent waterpipe smokers in Jordan: The Irbid-TRY study. Tob. Induc. Dis. 2018, 16, 19. [Google Scholar] [CrossRef]
- Al-Jawaldeh, A.; Taktouk, M.; Nasreddine, L. Food consumption patterns and nutrient intakes of children and adolescents in the Eastern Mediterranean Region: A call for policy action. Nutrients 2020, 12, 3345. [Google Scholar] [CrossRef]
- Akseer, N.; Mehta, S.; Wigle, J.; Chera, R.; Brickman, Z.; Al-Gashm, S.; Sorichetti, B.; Vandermorris, A.; Hipgrave, D.; Schwalbe, N. Non-communicable diseases among adolescents: Current status, determinants, interventions and policies. BMC Public Health 2020, 20, 1908. [Google Scholar] [CrossRef] [PubMed]
- Madanat, H.N.; Troutman, K.P.; Al-Madi, B. The nutrition transition in Jordan: The political, economic and food consumption contexts. Promot. Educ. 2008, 15, 6–10. [Google Scholar] [CrossRef]
- World Health Organization. National Implementation of the Baby-Friendly Hospital Initiative; License CC BY-NC-SA 3.0 IGO; WHO: Geneva, Switzerland, 2017. [Google Scholar]
- Dinga, L.; Kiage, B.; Kyallo, F. Effect of paternal education about complementary feeding of infants in Kisumu County, Kenya. Afr. J. Food Agric. Nutr. Dev. 2018, 18, 13702–13716. [Google Scholar] [CrossRef]
- Food and Agriculture Organization of the United Nations (FAO-UN). Policy Support and Governance Gateway. 2021. Available online: https://www.fao.org/policy-support/policy-themes/nutrition-food-systems/en/ (accessed on 21 December 2021).
- United Nations Jordan. Policy Brief Healthy Diets for All in Jordan. 2021. Available online: https://jordan.un.org/sites/default/files/2021-09/Policy%20Brief%20Healthy%20Diet%20for%20all%20in%20Jordan_2.pdf (accessed on 22 October 2021).


Publisher’s Note: MDPI stays neutral with regard to jurisdictional claims in published maps and institutional affiliations. |
© 2021 by the authors. Licensee MDPI, Basel, Switzerland. This article is an open access article distributed under the terms and conditions of the Creative Commons Attribution (CC BY) license (https://creativecommons.org/licenses/by/4.0/).
Share and Cite
Al-Awwad, N.J.; Ayoub, J.; Barham, R.; Sarhan, W.; Al-Holy, M.; Abughoush, M.; Al-Hourani, H.; Olaimat, A.; Al-Jawaldeh, A. Review of the Nutrition Situation in Jordan: Trends and Way Forward. Nutrients 2022, 14, 135. https://doi.org/10.3390/nu14010135
Al-Awwad NJ, Ayoub J, Barham R, Sarhan W, Al-Holy M, Abughoush M, Al-Hourani H, Olaimat A, Al-Jawaldeh A. Review of the Nutrition Situation in Jordan: Trends and Way Forward. Nutrients. 2022; 14(1):135. https://doi.org/10.3390/nu14010135
Chicago/Turabian StyleAl-Awwad, Narmeen Jamal, Jennifer Ayoub, Rawhieh Barham, Wafaa Sarhan, Murad Al-Holy, Mahmoud Abughoush, Huda Al-Hourani, Amin Olaimat, and Ayoub Al-Jawaldeh. 2022. "Review of the Nutrition Situation in Jordan: Trends and Way Forward" Nutrients 14, no. 1: 135. https://doi.org/10.3390/nu14010135
APA StyleAl-Awwad, N. J., Ayoub, J., Barham, R., Sarhan, W., Al-Holy, M., Abughoush, M., Al-Hourani, H., Olaimat, A., & Al-Jawaldeh, A. (2022). Review of the Nutrition Situation in Jordan: Trends and Way Forward. Nutrients, 14(1), 135. https://doi.org/10.3390/nu14010135