
The Global Impact of Alcohol Consumption on Premature Mortality and Health in 2016

 and
and
Abstract
1. Introduction
2. Materials and Methods
2.1. Relative Risk Estimates
2.2. Mortality, Morbidity, and Population Data
3. Results
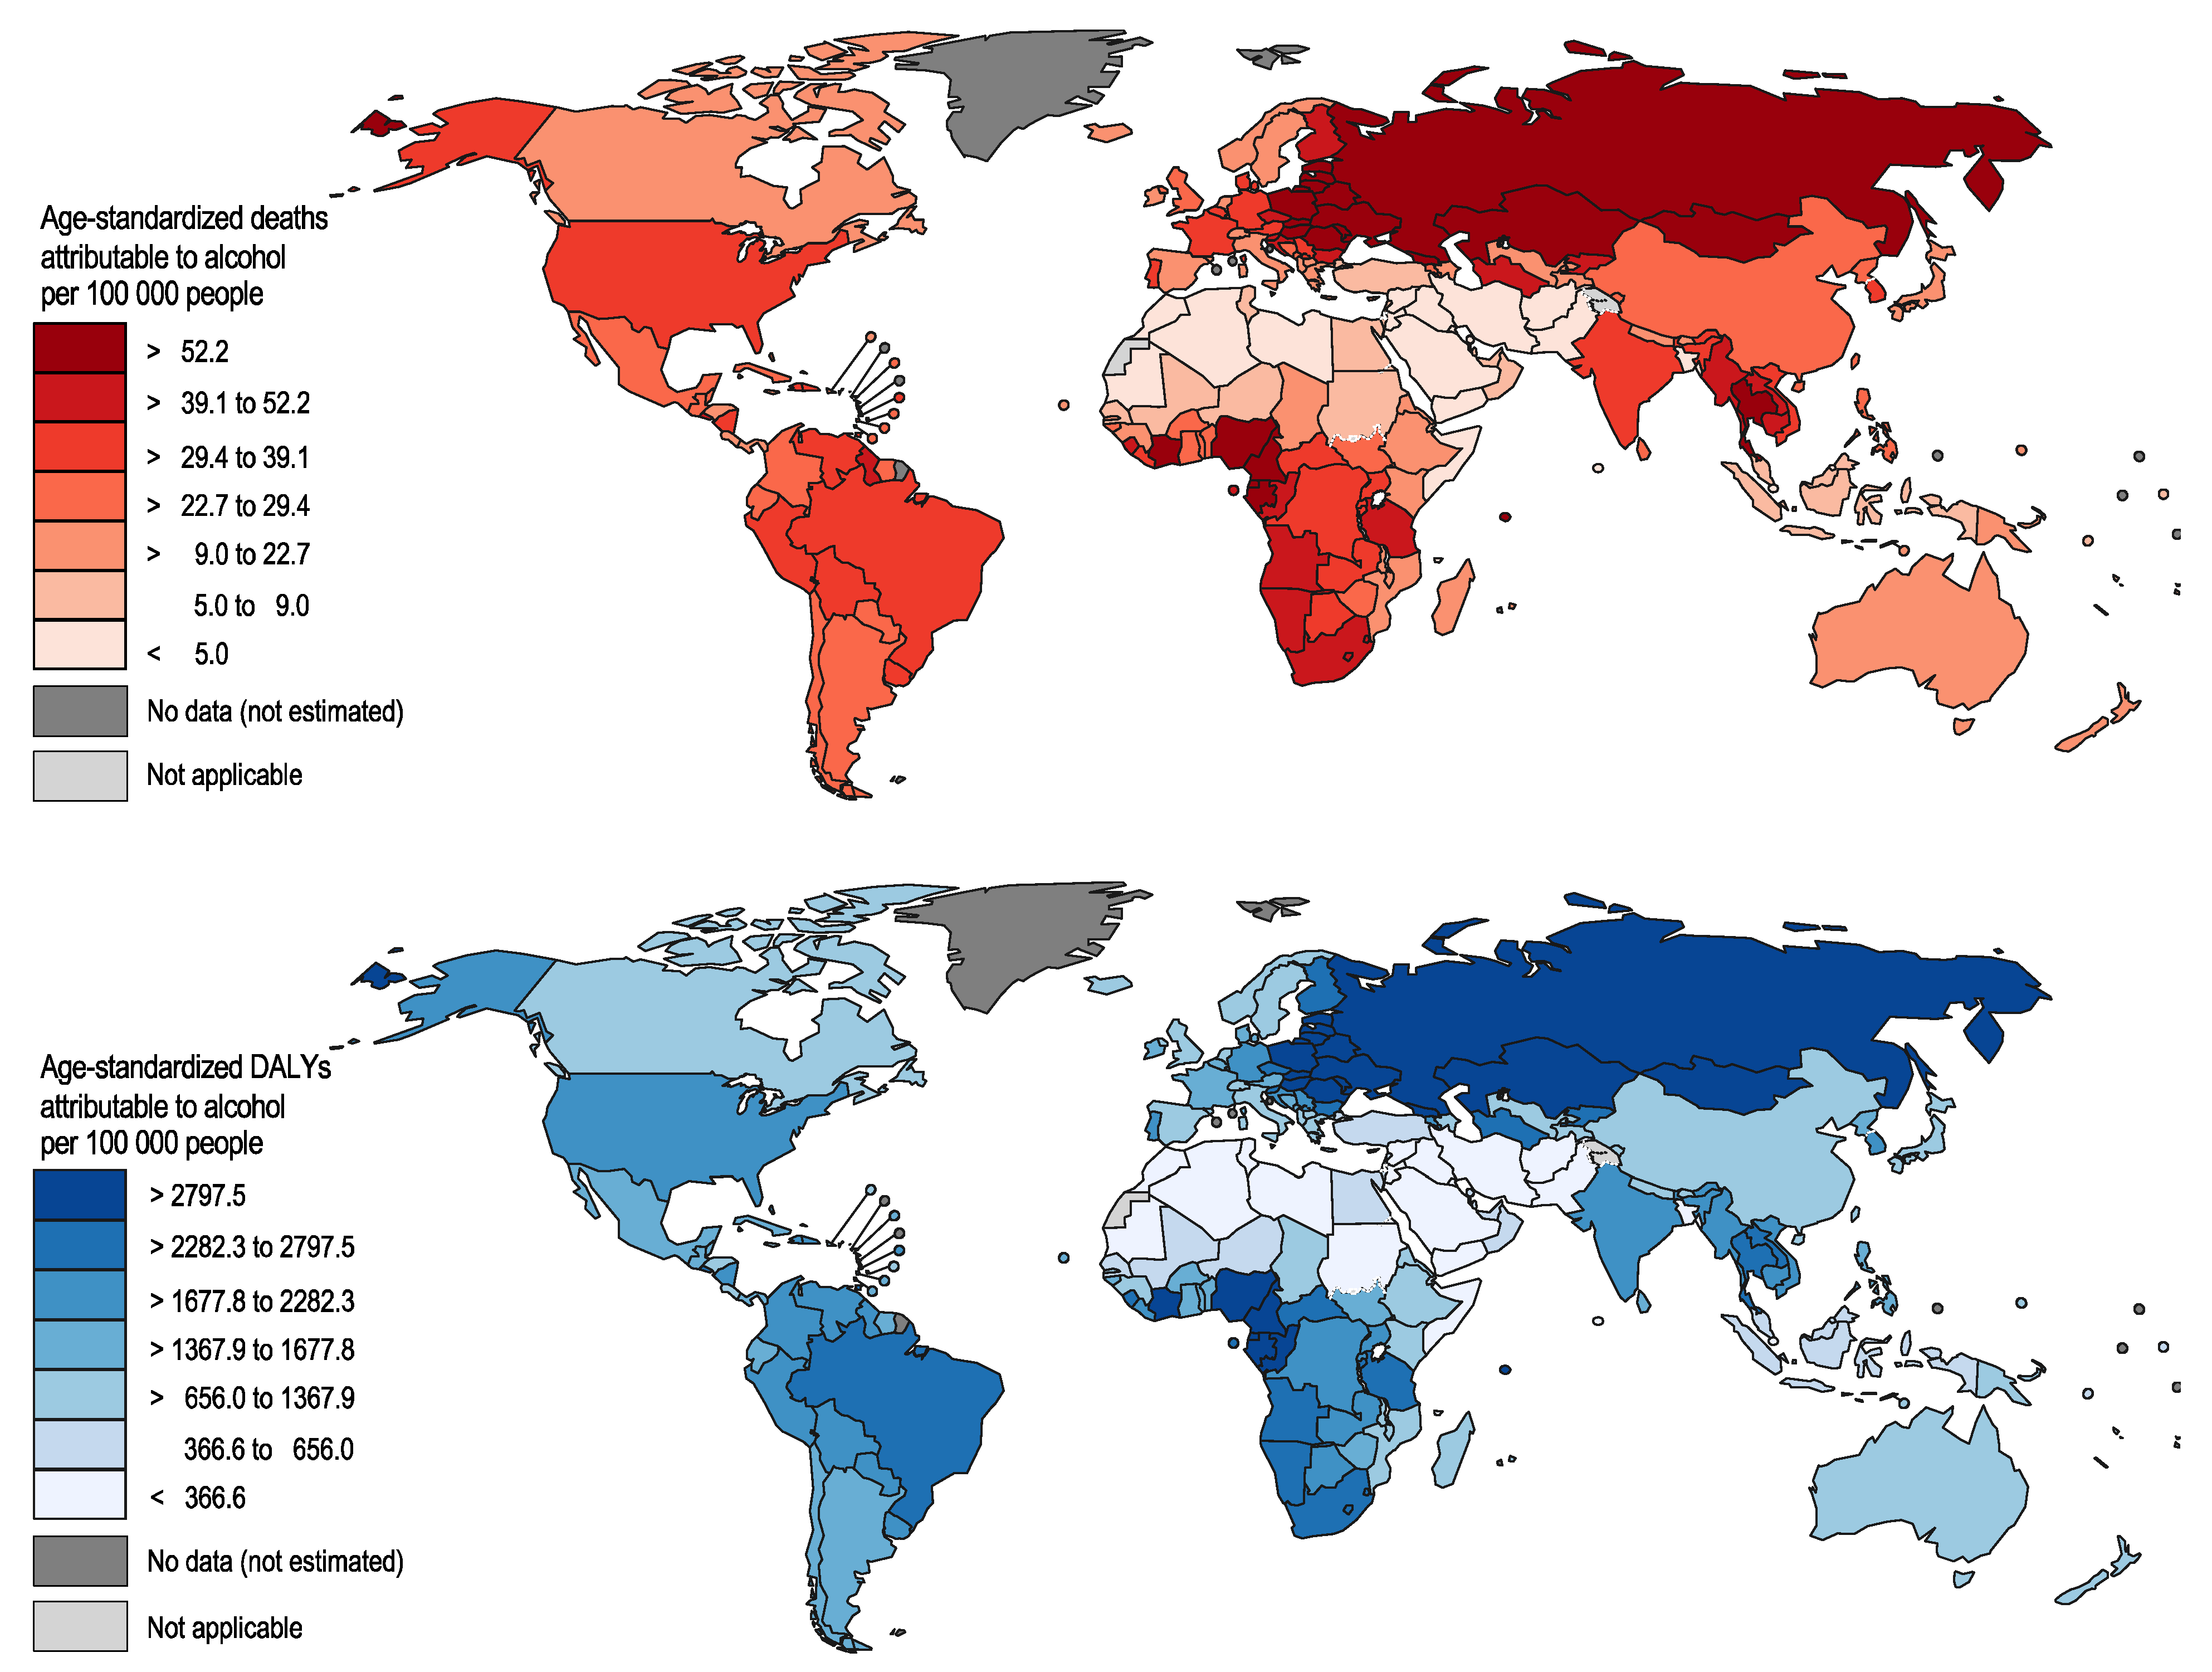
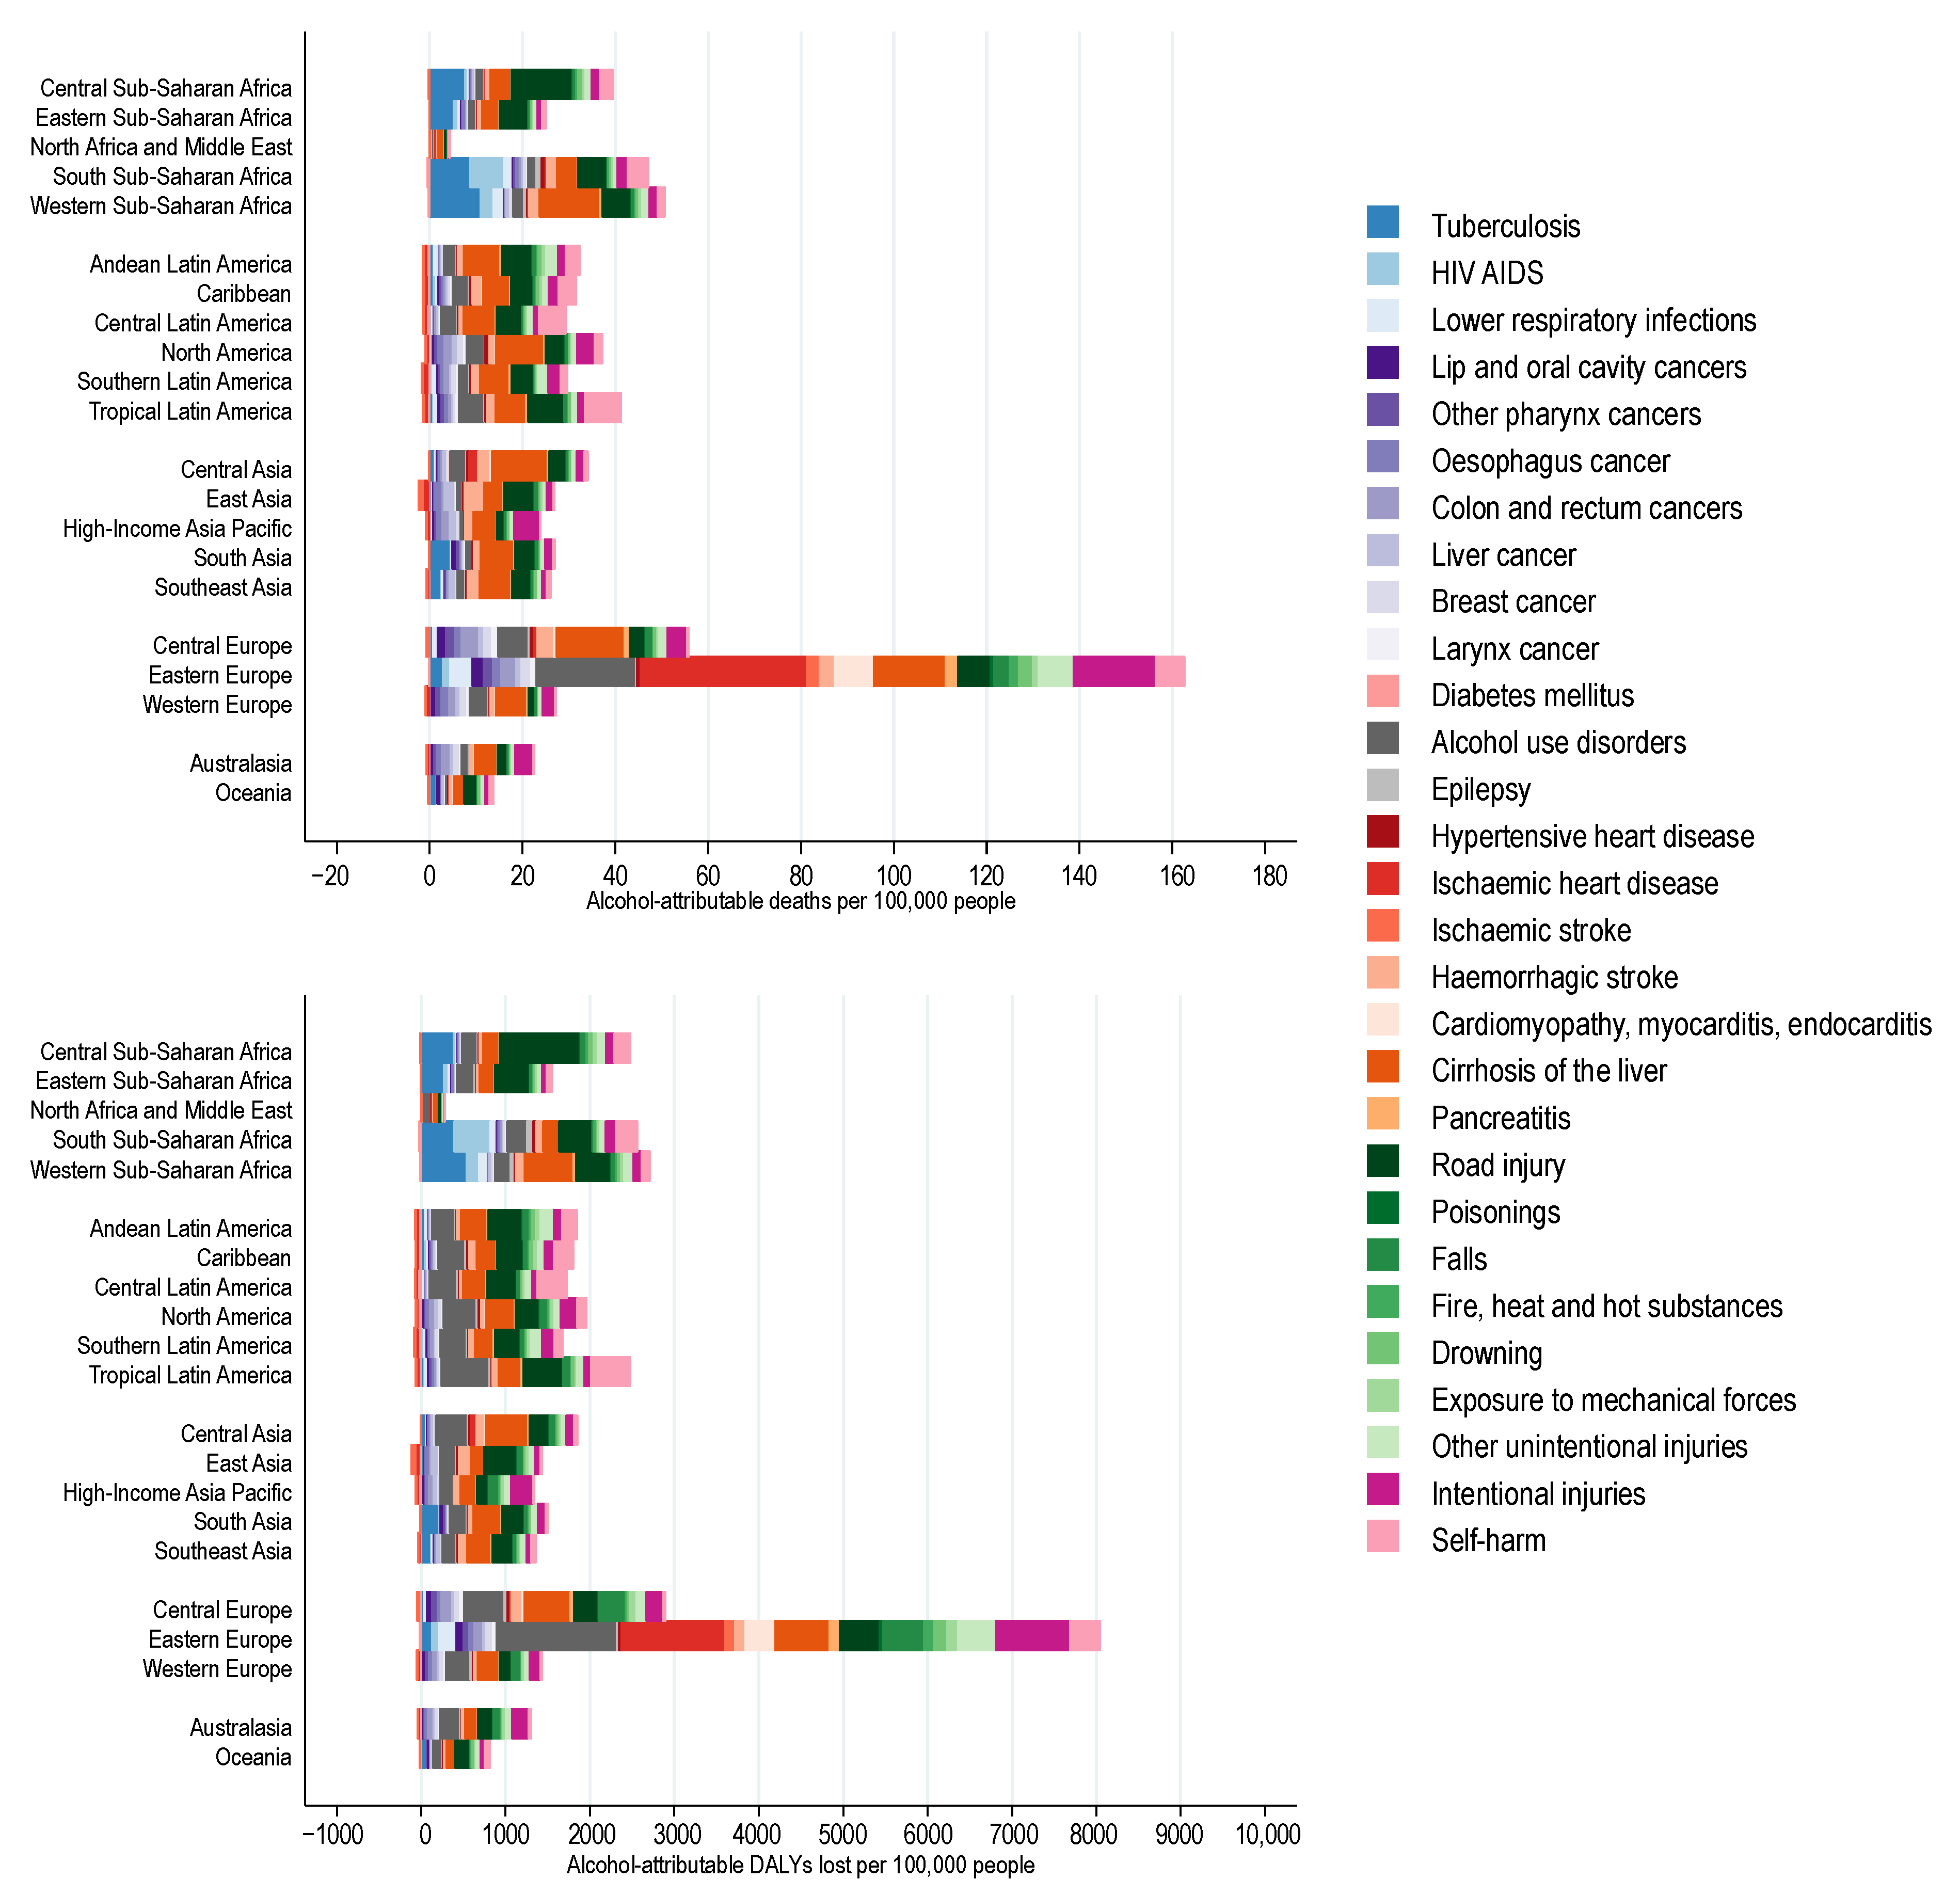
3.1. Alcohol-Attributable Burden of Disease by Region
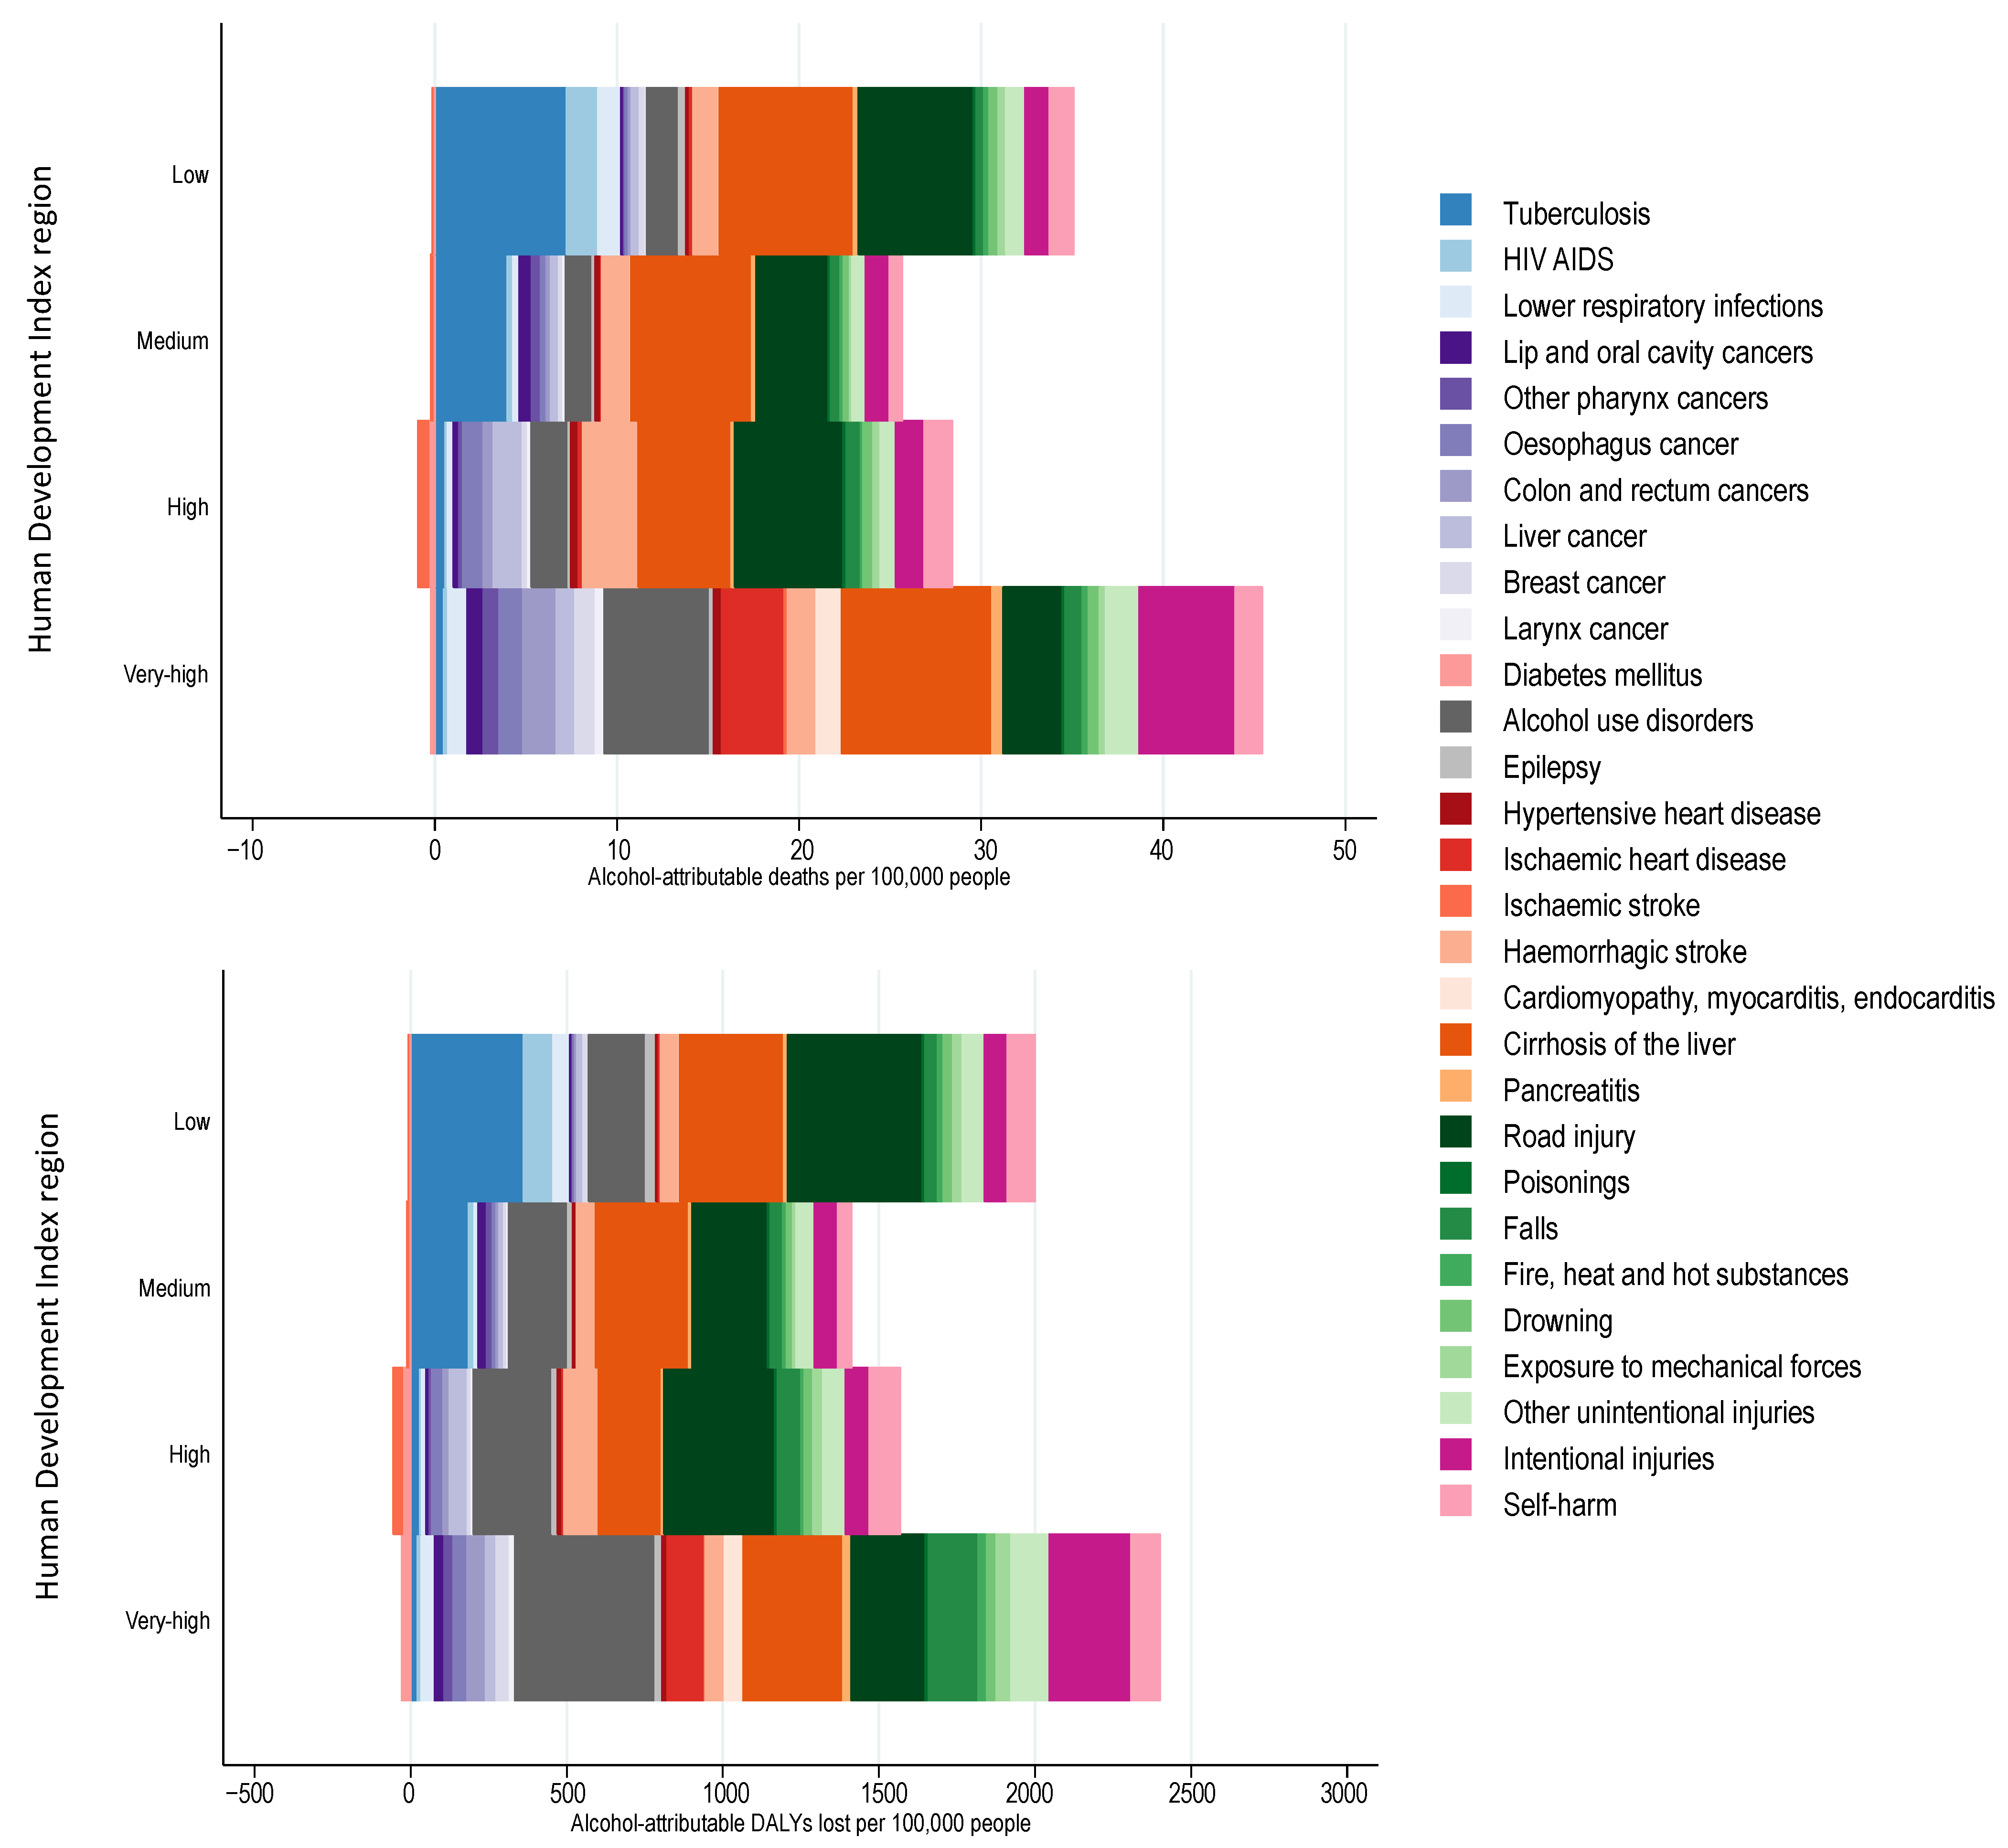
3.2. Alcohol-Attributable Burden of Disease by Human Development Index
4. Discussion
4.1. Limitations
4.2. Health Policies
5. Conclusions
Supplementary Materials
Author Contributions
Funding
Institutional Review Board Statement
Informed Consent Statement
Data Availability Statement
Acknowledgments
Conflicts of Interest
References
- Shield, K.; Manthey, J.; Rylett, M.; Probst, C.; Wettlaufer, A.; Parry, C.D.; Rehm, J. National, regional, and global burdens of disease from 2000 to 2016 attributable to alcohol use: A comparative risk assessment study. Lancet Public Health 2020, 5, e51–e61. [Google Scholar] [CrossRef]
- Shield, K.D.; Rehm, J. Global risk factor rankings: The importance of age-based health loss inequities caused by alcohol and other risk factors. BMC Res. Notes 2015, 8, 1–4. [Google Scholar] [CrossRef]
- Murray, C.J.; Aravkin, A.Y.; Zheng, P.; Abbafati, C.; Abbas, K.M.; Abbasi-Kangevari, M.; Abd-Allah, F.; Abdelalim, A.; Abdollahi, M.; Abdollahpour, I. Global burden of 87 risk factors in 204 countries and territories, 1990–2019: A systematic analysis for the Global Burden of Disease Study 2019. Lancet 2020, 396, 1223–1249. [Google Scholar] [CrossRef]
- Shield, K.; Rehm, J. Substance use and the objectives of current global health frameworks: Measurement matters. Addiction 2018, 114, 771–773. [Google Scholar] [CrossRef]
- Manthey, J.; Shield, K.D.; Rylett, M.; Hasan, O.S.; Probst, C.; Rehm, J. Global alcohol exposure between 1990 and 2017 and forecasts until 2030: A modelling study. Lancet 2019, 393, 2493–2502. [Google Scholar] [CrossRef]
- World Health Organization. Global Status Report on Alcohol and Health 2018; World Health Organization: Geneva, Switzerland, 2018. [Google Scholar]
- Jiang, H.; Xiang, X.; Room, R.; Hao, W. Alcohol and the Sustainable Development Goals. Lancet 2016, 388, 1279–1280. [Google Scholar] [CrossRef][Green Version]
- Flor, L.S.; Gakidou, E. The burden of alcohol use: Better data and strong policies towards a sustainable development. Lancet Public Health 2020, 5, e10–e11. [Google Scholar] [CrossRef]
- LoConte, N.K.; Brewster, A.M.; Kaur, J.S.; Merrill, J.K.; Alberg, A.J. Alcohol and cancer: A statement of the American Society of Clinical Oncology. J. Clin. Oncol. 2018, 36, 83–93. [Google Scholar] [CrossRef]
- GBD 2016 Alcohol Collaborators. Alcohol use and burden for 195 countries and territories, 1990–2016: A systematic analysis for the Global Burden of Disease Study 2016. Lancet 2018, 392, 1015–1035. [Google Scholar] [CrossRef]
- Levin, M.L. The occurence of lung cancer in man. Acta Unio Int. Contra Cancrum 1953, 9, 531–541. [Google Scholar]
- Rehm, J.; Irving, H.; Ye, Y.; Kerr, W.C.; Bond, J.; Greenfield, T.K. Are lifetime abstainers the best control group in alcohol epidemiology? On the stability and validity of reported lifetime abstention. Am. J. Epidemiol. 2008, 168, 866–871. [Google Scholar] [CrossRef]
- Rehm, J.; Gmel Sr, G.E.; Gmel, G.; Hasan, O.S.M.; Imtiaz, S.; Popova, S.; Probst, C.; Roerecke, M.; Room, R.; Samokhvalov, A.V.; et al. The relationship between different dimensions of alcohol use and the burden of disease—An update. Addiction 2017, 112, 968–1001. [Google Scholar] [CrossRef]
- Grundy, A.; Poirier, A.E.; Khandwala, F.; McFadden, A.; Friedernreich, C.M.; Brenner, D.R. Cancer inicidence attributable to alcohol consumption in Alberta in 2012. CMAJ Open 2016, 4, E507. [Google Scholar] [CrossRef][Green Version]
- World Health Organization. WHO Methods and Data Sources for Country-Level Casues of Death 2000–2016; WHO: Geneva, Switzerland, 2018. [Google Scholar]
- Byass, P. Correlation between noncommunicable disease mortality in people aged 30–69 years and those aged 70–89 years. Bull. World Health Organ. 2019, 97, 589. [Google Scholar] [CrossRef]
- Manthey, J.; Probst, C.; Rylett, M.; Rehm, J. National, regional, and global mortality due to alcoholic cardiomyopathy in 2015. Heart 2018, 104, 1663–1669. [Google Scholar] [CrossRef] [PubMed]
- World Health Organization. WHO Road Traffic Death Database; World Health Organization: Geneva, Switzerland, 2018. [Google Scholar]
- United Nations. World Population Prospects: The 2017 Revision; United Nations: New York, NY, USA, 2017. [Google Scholar]
- United Nations Development Programme. Human Development Report 2018. Available online: http://www.webcitation.org/6eYKeeF6z (accessed on 1 January 2021).
- R Core Team. R: A Language and Environment for Statistical Computing; R Core Team: Vienna, Austria, 2013. [Google Scholar]
- Kyu, H.H.; Maddison, E.R.; Henry, N.J.; Mumford, J.E.; Barber, R.; Shields, C.; Brown, J.C.; Nguyen, G.; Carter, A.; Wolock, T.M. The global burden of tuberculosis: Results from the Global Burden of Disease Study 2015. Lancet Infect. Dis. 2018, 18, 261–284. [Google Scholar] [CrossRef]
- Corbett, E.L.; Watt, C.J.; Walker, N.; Maher, D.; Williams, B.G.; Raviglione, M.C.; Dye, C. The growing burden of tuberculosis: Global trends and interactions with the HIV epidemic. Arch. Intern. Med. 2003, 163, 1009–1021. [Google Scholar] [CrossRef]
- Rehm, J.; Patra, J.; Brennan, A.; Buckley, C.; Greenfield, T.K.; Kerr, W.C.; Manthey, J.; Purshouse, R.C.; Rovira, P.; Shuper, P.A. The role of alcohol use in the aetiology and progression of liver disease: A narrative review and a quantification. Drug Alcohol Rev. 2021. [Google Scholar] [CrossRef]
- NCD Countdown 2030 collaborators. NCD Countdown 2030: Worldwide trends in non-communicable disease mortality and progress towards Sustainable Development Goal target 3.4. Lancet 2018, 392, 1072–1088. [Google Scholar] [CrossRef]
- Mokdad, A.A.; Lopez, A.D.; Shahraz, S.; Lozano, R.; Mokdad, A.H.; Stanaway, J.; Murray, C.J.; Naghavi, M. Liver cirrhosis mortality in 187 countries between 1980 and 2010: A systematic analysis. BMC Med. 2014, 12, 1–24. [Google Scholar] [CrossRef]
- Vento, S.; Dzudzor, B.; Cainelli, F.; Tachi, K. Liver cirrhosis in sub-Saharan Africa: Neglected, yet important. Lancet Global Health 2018, 6, e1060–e1061. [Google Scholar] [CrossRef]
- Voltzke, K.J.; Lee, Y.-C.A.; Zhang, Z.-F.; Zevallos, J.P.; Yu, G.-P.; Winn, D.M.; Vaughan, T.L.; Sturgis, E.M.; Smith, E.; Schwartz, S.M. Racial differences in the relationship between tobacco, alcohol, and the risk of head and neck cancer: Pooled analysis of US studies in the INHANCE Consortium. Cancer Causes Control 2018, 29, 619–630. [Google Scholar] [CrossRef]
- Llamosas-Falcón, L.; Shield, K.D.; Gelovany, M.; Hasan, O.S.; Manthey, J.; Monteiro, M.; Walsh, N.; Rehm, J. Impact of alcohol on the progression of HCV-related liver disease: A systematic review and meta-analysis. J. Hepatol. 2021, 75, 536–546. [Google Scholar] [CrossRef]
- Patra, J.; Buckley, C.; Kerr, W.C.; Brennan, A.; Purshouse, R.C.; Rehm, J. Impact of body mass and alcohol consumption on all-cause and liver mortality in 240 000 adults in the United States. Drug Alcohol Rev. 2021. [Google Scholar] [CrossRef]
- Leonard, K. Domestic violence and alcohol: What is known and what do we need to know to encourage environmental interventions? J. Subst. Use 2001, 6, 235–247. [Google Scholar] [CrossRef]
- Watts, C.; Zimmerman, C. Violence against women: Global scope and magnitude. Lancet 2002, 359, 1232–1237. [Google Scholar] [CrossRef]
- Devries, K.M.; Mak, J.Y.; Garcia-Moreno, C.; Petzold, M.; Child, J.C.; Falder, G.; Lim, S.; Bacchus, L.J.; Engell, R.E.; Rosenfeld, L. The global prevalence of intimate partner violence against women. Science 2013, 340, 1527–1528. [Google Scholar] [CrossRef]
- Sinha, M. Measuring Violence against Women: Statistical Trends. Juristat: Canadian Centre for Justice Statistics; Minister of Industry: Ottawa, ON, Canada, 2013. [Google Scholar]
- World Health Organization. Violence against Women: Intimate Partner and Sexual Violence against Women; World Health Organization: Geneva Switzerland, 2016. [Google Scholar]
- Kyriacou, D.N.; Anglin, D.; Taliaferro, E.; Stone, S.; Tubb, T.; Linden, J.A.; Muelleman, R.; Barton, E.; Kraus, J.F. Risk factors for injury to women from domestic violence. N. Engl. J. Med. 1999, 341, 1892–1898. [Google Scholar] [CrossRef]
- Coker, A.; Davis, K.; Arias, I.; Desai, S.; Sanderson, M.; Brandt, H.; Smith, P. Physical and mental health effects of intimate partner violence for men and women. Am. J. Prev. Med. 2002, 23, 260–268. [Google Scholar] [CrossRef]
- World Health Organization. Equity, Social Determinants and Public Health Programmes; Blas, E., Kurup, A.S., Eds.; World Health Organization,: Geneva, Switzerland, 2010. [Google Scholar]
- Chisholm, D.; Moro, D.; Bertram, M.; Pretorius, C.; Gmel, G.; Shield, K.; Rehm, J. Are the “best buys” for alcohol control still valid? An update on the comparative cost-effectiveness of alcohol control strategies at the global level. JSAD 2018, 79, 514–522. [Google Scholar] [CrossRef]
- Pan American Health Organization. Regional Status Report on Alcohol and Health in the Americas; PAHO: Washingon, DC, USA, 2015. [Google Scholar]
- Harris, J. The Value of Life: An Introduction to Medical Ethics; Routledge: London, UK, 1985. [Google Scholar]
- Tsuchiya, A. QALYs and ageism: Philosophical theories and age weighting. Health Econ. 2000, 9, 57–68. [Google Scholar] [CrossRef]


| Cause of Disease or Injury | Alcohol-Attributable Deaths | Population Attributable Fraction (%) | ||||||||||||||
|---|---|---|---|---|---|---|---|---|---|---|---|---|---|---|---|---|
| 0 to 14 | 15 to 19 | 20 to 29 | 30 to 39 | 40 to 49 | 50 to 59 | 60 to 69 | ≥70 | 0 to 14 | 15 to 19 | 20 to 29 | 30 to 39 | 40 to 49 | 50 to 59 | 60 to 69 | ≥70 | |
| All Causes | 33,939 | 47,719 | 248,762 | 317,457 | 396,552 | 510,448 | 542,012 | 870,937 | 0.5 | 6.9 | 13.0 | 13.3 | 12.0 | 9.2 | 5.9 | 3.2 |
| Communicable, maternal, perinatal and nutritional conditions | 0 | 3073 | 30,471 | 50,497 | 58,869 | 60,646 | 55,847 | 102,481 | 0.0 | 1.5 | 5.4 | 6.8 | 8.5 | 9.1 | 6.5 | 4.0 |
| Tuberculosis | 0 | 2299 | 23,738 | 34,975 | 42,291 | 46,097 | 40,121 | 46,762 | 0.0 | 8.5 | 22.0 | 24.7 | 25.4 | 22.0 | 17.5 | 12.7 |
| HIV AIDS | 0 | 269 | 3444 | 10,566 | 10,220 | 4352 | 1284 | 302 | 0.0 | 1.0 | 3.0 | 3.5 | 3.8 | 3.5 | 3.1 | 2.3 |
| Lower respiratory infections | 0 | 505 | 3289 | 4956 | 6358 | 10,197 | 14,442 | 55,417 | 0.0 | 2.2 | 6.2 | 8.4 | 8.5 | 7.4 | 5.1 | 4.1 |
| Noncommunicable diseases | 0 | 5997 | 42,304 | 111,176 | 203,371 | 330,932 | 392,643 | 656,706 | 0.0 | 3.2 | 7.7 | 11.2 | 9.8 | 7.6 | 5.0 | 2.8 |
| Malignant neoplasms | 0 | 0 | 1094 | 9183 | 30,653 | 73,936 | 102,619 | 150,215 | 0.0 | 0.0 | 0.9 | 3.4 | 4.5 | 5.2 | 4.8 | 3.6 |
| Lip and oral cavity cancer | 0 | 0 | 224 | 2542 | 6678 | 13,732 | 14,915 | 14,085 | 0.0 | 0.0 | 7.9 | 30.2 | 32.2 | 35.4 | 33.7 | 27.8 |
| Other pharynx cancers | 0 | 0 | 63 | 975 | 4250 | 11,026 | 12,356 | 9922 | 0.0 | 0.0 | 7.3 | 28.5 | 34.6 | 39.9 | 38.1 | 29.6 |
| Oesophagus cancer | 0 | 0 | 53 | 712 | 4519 | 16,516 | 27,076 | 34,070 | 0.0 | 0.0 | 3.5 | 12.8 | 18.6 | 22.4 | 21.7 | 17.2 |
| Colon and rectum cancers | 0 | 0 | 248 | 1754 | 4823 | 12,582 | 22,287 | 50,866 | 0.0 | 0.0 | 3.9 | 9.6 | 10.8 | 12.4 | 12.8 | 11.4 |
| Liver cancer | 0 | 0 | 507 | 3199 | 10,383 | 20,080 | 25,985 | 41,273 | 0.0 | 0.0 | 5.6 | 11.5 | 11.8 | 12.4 | 12.6 | 12.4 |
| Breast cancer | 0 | 0 | 178 | 3003 | 6743 | 10,445 | 9238 | 12,415 | 0.0 | 0.0 | 2.4 | 7.1 | 7.4 | 8.1 | 7.4 | 6.5 |
| Larynx cancer | 0 | 0 | 13 | 210 | 1418 | 4753 | 6849 | 7283 | 0.0 | 0.0 | 4.2 | 17.9 | 21.7 | 24.6 | 24.0 | 20.3 |
| Diabetes mellitus | 0 | −41 | −362 | −681 | −1958 | −4474 | −7816 | −19,753 | 0.0 | −1.1 | −2.8 | −2.7 | −2.6 | −2.3 | −2.0 | −2.2 |
| Alcohol use disorders | 0 | 967 | 7748 | 21,406 | 31,222 | 38,315 | 28,103 | 17,804 | 100.0 | 100.0 | 100.0 | 100.0 | 100.0 | 100.0 | 100.0 | 100.0 |
| Epilepsy | 0 | 694 | 3278 | 3019 | 2651 | 2177 | 1844 | 2751 | 0.0 | 5.9 | 15.2 | 17.3 | 18.7 | 16.9 | 14.4 | 11.7 |
| Cardiovascular diseases | 0 | 680 | 4328 | 13,070 | 30,099 | 65,934 | 107,708 | 347,811 | 0.0 | 1.8 | 3.2 | 4.2 | 4.1 | 3.8 | 3.1 | 3.0 |
| Hypertensive heart disease | 0 | 40 | 457 | 1260 | 3204 | 7079 | 12,846 | 41,571 | 0.0 | 3.1 | 9.1 | 10.2 | 10.4 | 9.4 | 8.2 | 6.8 |
| Ischaemic heart disease | 0 | 85 | 139 | 1195 | 3027 | 12,654 | 32,002 | 201,657 | 0.0 | 0.8 | 0.3 | 0.8 | 0.8 | 1.3 | 1.8 | 3.3 |
| Ischaemic stroke | 0 | −11 | −75 | −174 | −838 | −2823 | −10,280 | −45,068 | 0.0 | −0.7 | −1.3 | −1.5 | −2.2 | −2.1 | −2.0 | −2.1 |
| Haemorrhagic stroke | 0 | 476 | 3044 | 7768 | 20,968 | 43,205 | 68,579 | 142,988 | 0.0 | 5.7 | 10.4 | 11.3 | 11.8 | 10.8 | 9.7 | 9.2 |
| Cardiomyopathy, myocarditis, endocarditis | 0 | 89 | 763 | 3021 | 3738 | 5819 | 4562 | 6662 | 0.0 | 1.9 | 5.0 | 12.3 | 11.5 | 12.3 | 7.5 | 3.8 |
| Digestive diseases | 0 | 3697 | 26,027 | 61,967 | 102,541 | 139,846 | 144,097 | 138,180 | 0.0 | 12.8 | 28.4 | 37.8 | 39.9 | 35.6 | 27.9 | 13.9 |
| Cirrhosis of the liver | 0 | 3593 | 24,369 | 58,145 | 97,529 | 134,702 | 139,105 | 130,695 | 0.0 | 28.8 | 49.6 | 54.0 | 55.3 | 52.5 | 47.8 | 38.9 |
| Pancreatitis | 0 | 104 | 1658 | 3822 | 5012 | 5144 | 4993 | 7485 | 0.0 | 11.0 | 27.3 | 32.2 | 31.6 | 28.3 | 23.2 | 18.5 |
| Injuries | 33,939 | 38,649 | 175,987 | 155,784 | 134,313 | 118,870 | 93,522 | 111,750 | 5.3 | 12.8 | 21.9 | 24.0 | 25.2 | 23.2 | 18.4 | 12.1 |
| Unintentional injuries | 33,939 | 28,303 | 116,260 | 101,421 | 94,461 | 87,006 | 73,167 | 94,404 | 5.9 | 16.0 | 26.1 | 27.3 | 27.6 | 24.6 | 19.1 | 12.0 |
| Road injury | 33,939 | 20,533 | 78,740 | 62,508 | 56,129 | 48,048 | 37,797 | 33,073 | 23.1 | 20.2 | 29.1 | 30.0 | 30.0 | 27.5 | 24.7 | 20.8 |
| Poisonings | 0 | 409 | 2543 | 2273 | 2342 | 1969 | 1718 | 1480 | 0.0 | 10.0 | 20.7 | 22.9 | 21.8 | 19.3 | 13.9 | 9.5 |
| Falls | 0 | 809 | 5398 | 7347 | 9340 | 11,524 | 12,814 | 32,138 | 0.0 | 10.3 | 22.4 | 24.6 | 25.4 | 20.9 | 13.5 | 8.8 |
| Fire, heat and hot substances | 0 | 531 | 2813 | 3106 | 2614 | 2773 | 2362 | 2960 | 0.0 | 6.7 | 14.7 | 17.5 | 20.9 | 20.1 | 15.5 | 10.4 |
| Drowning | 0 | 2708 | 8553 | 7214 | 5983 | 5109 | 4223 | 4320 | 0.0 | 11.6 | 23.4 | 26.0 | 26.1 | 22.6 | 17.3 | 11.5 |
| Exposure to mechanical forces | 0 | 786 | 4655 | 4573 | 4114 | 3443 | 2311 | 1635 | 0.0 | 10.8 | 23.0 | 24.9 | 25.8 | 23.1 | 17.7 | 10.5 |
| Other unintentional injuries | 0 | 2526 | 13,558 | 14,400 | 13,940 | 14,141 | 11,942 | 18,798 | 0.0 | 10.4 | 22.0 | 24.4 | 25.1 | 22.9 | 16.8 | 11.3 |
| Intentional injuries | 0 | 10,346 | 59,726 | 54,363 | 39,851 | 31,863 | 20,355 | 17,346 | 0.0 | 8.2 | 16.6 | 19.7 | 20.8 | 20.0 | 16.2 | 12.3 |
| Self-harm | 0 | 4491 | 29,477 | 31,085 | 26,207 | 23,767 | 16,508 | 15,484 | 0.0 | 8.5 | 18.4 | 23.0 | 23.8 | 21.9 | 17.1 | 12.8 |
| Interpersonal violence | 0 | 5855 | 30,249 | 23,278 | 13,645 | 8096 | 3847 | 1862 | 0.0 | 11.1 | 20.7 | 22.4 | 22.0 | 20.1 | 16.6 | 11.1 |
| Cause of Disease or Injury | Alcohol-Attributable DALYs (100,000 s) | Population Attributable Fraction (%) | ||||||||||||||
|---|---|---|---|---|---|---|---|---|---|---|---|---|---|---|---|---|
| 0 to 14 | 15 to 19 | 20 to 29 | 30 to 39 | 40 to 49 | 50 to 59 | 60 to 69 | ≥70 | 0 to 14 | 15 to 19 | 20 to 29 | 30 to 39 | 40 to 49 | 50 to 59 | 60 to 69 | ≥70 | |
| All Causes | 302.5 | 451.5 | 2189.8 | 2348.6 | 2349.6 | 2297.1 | 1783.2 | 1419.4 | 0.5 | 5.0 | 9.8 | 9.9 | 9.0 | 7.4 | 5.1 | 3.0 |
| Communicable, maternal, perinatal and nutritional conditions | 0.0 | 24.4 | 215.6 | 302.8 | 293.1 | 238.9 | 167.2 | 148.9 | 0.0 | 1.1 | 4.0 | 5.4 | 6.7 | 7.4 | 5.9 | 3.9 |
| Tuberculosis | 0.0 | 18.5 | 168.5 | 210.4 | 210.8 | 182.6 | 122.0 | 78.6 | 0.0 | 8.5 | 22.0 | 24.6 | 25.4 | 22.1 | 18.0 | 13.0 |
| HIV AIDS | 0.0 | 2.1 | 24.9 | 64.0 | 52.1 | 18.1 | 4.2 | 0.7 | 0.0 | 1.0 | 3.0 | 3.5 | 3.8 | 3.5 | 3.1 | 2.2 |
| Lower respiratory infections | 0.0 | 3.8 | 22.1 | 28.5 | 30.2 | 38.2 | 41.0 | 69.6 | 0.0 | 2.2 | 6.2 | 8.4 | 8.5 | 7.4 | 5.3 | 4.0 |
| Noncommunicable diseases | 6.3 | 111.5 | 657.4 | 975.5 | 1208.1 | 1405.3 | 1191.1 | 982.8 | 0.0 | 2.6 | 6.0 | 7.2 | 6.6 | 5.6 | 4.0 | 2.4 |
| Malignant neoplasms | 0.0 | 0.0 | 8.4 | 70.9 | 184.2 | 337.5 | 338.7 | 263.9 | 0.0 | 0.0 | 1.1 | 4.6 | 5.7 | 6.3 | 5.5 | 4.2 |
| Lip and oral cavity cancer | 0.0 | 0.0 | 1.5 | 14.5 | 31.8 | 52.2 | 43.1 | 22.8 | 0.0 | 0.0 | 7.7 | 30.0 | 32.2 | 35.4 | 33.8 | 28.7 |
| Other pharynx cancers | 0.0 | 0.0 | 0.4 | 5.5 | 20.0 | 41.6 | 35.4 | 16.6 | 0.0 | 0.0 | 7.1 | 28.4 | 34.6 | 39.9 | 38.2 | 30.9 |
| Oesophagus cancer | 0.0 | 0.0 | 0.3 | 4.0 | 21.0 | 61.6 | 76.1 | 53.9 | 0.0 | 0.0 | 3.4 | 12.8 | 18.5 | 22.4 | 21.7 | 17.8 |
| Colon and rectum cancers | 0.0 | 0.0 | 1.6 | 10.1 | 23.0 | 47.9 | 63.9 | 75.8 | 0.0 | 0.0 | 3.8 | 9.6 | 10.8 | 12.4 | 12.8 | 11.7 |
| Liver cancer | 0.0 | 0.0 | 3.3 | 18.2 | 48.8 | 75.4 | 73.3 | 63.5 | 0.0 | 0.0 | 5.5 | 11.5 | 11.8 | 12.4 | 12.6 | 12.4 |
| Breast cancer | 0.0 | 0.0 | 1.2 | 17.4 | 32.9 | 40.8 | 27.3 | 19.2 | 0.0 | 0.0 | 2.4 | 7.1 | 7.5 | 8.2 | 7.4 | 6.7 |
| Larynx cancer | 0.0 | 0.0 | 0.1 | 1.2 | 6.7 | 18.1 | 19.7 | 12.0 | 0.0 | 0.0 | 4.1 | 17.9 | 21.7 | 24.6 | 24.1 | 20.8 |
| Diabetes mellitus | 0.0 | −0.7 | −7.4 | −13.2 | −27.2 | −37.3 | −40.7 | −40.2 | 0.0 | −1.3 | −3.1 | −3.0 | −3.1 | −2.6 | −2.4 | −2.2 |
| Alcohol use disorders | 6.3 | 68.0 | 407.7 | 451.8 | 389.3 | 304.5 | 157.4 | 60.6 | 100.0 | 100.0 | 100.0 | 100.0 | 100.0 | 100.0 | 100.0 | 100.0 |
| Epilepsy | 0.0 | 9.2 | 39.3 | 30.9 | 24.5 | 17.7 | 12.1 | 9.5 | 0.0 | 5.8 | 14.4 | 16.0 | 17.1 | 15.6 | 13.9 | 11.4 |
| Cardiovascular diseases | 0.0 | 5.2 | 29.2 | 75.1 | 142.0 | 244.7 | 303.4 | 462.0 | 0.0 | 1.6 | 2.8 | 3.9 | 3.8 | 3.6 | 2.9 | 2.8 |
| Hypertensive heart disease | 0.0 | 0.3 | 3.0 | 7.5 | 16.2 | 28.1 | 38.4 | 58.5 | 0.0 | 3.1 | 9.1 | 10.0 | 10.2 | 9.3 | 8.3 | 6.8 |
| Ischaemic heart disease | 0.0 | 0.7 | 1.1 | 7.1 | 14.7 | 47.5 | 91.8 | 252.0 | 0.0 | 0.8 | 0.3 | 0.8 | 0.7 | 1.3 | 1.8 | 3.1 |
| Ischaemic stroke | 0.0 | −0.2 | −1.2 | −2.4 | −8.3 | −19.5 | −40.0 | −71.5 | 0.0 | −1.1 | −2.0 | −2.3 | −3.1 | −2.8 | −2.3 | −2.2 |
| Haemorrhagic stroke | 0.0 | 3.7 | 21.2 | 45.5 | 101.5 | 166.5 | 199.6 | 213.7 | 0.0 | 5.8 | 10.5 | 11.3 | 11.9 | 10.8 | 9.9 | 9.0 |
| Cardiomyopathy, myocarditis, endocarditis | 0.0 | 0.7 | 5.1 | 17.4 | 17.9 | 22.1 | 13.4 | 9.3 | 0.0 | 1.8 | 4.7 | 11.9 | 11.3 | 11.9 | 7.5 | 3.8 |
| Digestive diseases | 0.0 | 29.8 | 180.2 | 360.1 | 495.3 | 538.1 | 420.2 | 227.0 | 0.0 | 12.4 | 26.6 | 34.7 | 36.1 | 33.2 | 26.6 | 14.6 |
| Cirrhosis of the liver | 0.0 | 29.0 | 169.1 | 338.1 | 471.3 | 518.6 | 405.8 | 215.7 | 0.0 | 28.9 | 49.5 | 53.9 | 55.3 | 52.5 | 48.3 | 39.5 |
| Pancreatitis | 0.0 | 0.8 | 11.1 | 22.0 | 23.9 | 19.5 | 14.4 | 11.3 | 0.0 | 11.1 | 27.2 | 32.1 | 31.5 | 28.2 | 23.5 | 18.8 |
| Injuries | 296.2 | 315.7 | 1316.8 | 1070.3 | 848.4 | 652.9 | 425.0 | 287.7 | 4.9 | 12.7 | 21.8 | 23.7 | 24.8 | 22.8 | 19.0 | 13.2 |
| Unintentional injuries | 296.2 | 236.1 | 904.5 | 744.6 | 645.8 | 522.1 | 359.6 | 256.8 | 5.6 | 15.6 | 25.6 | 26.5 | 26.8 | 24.0 | 19.7 | 13.4 |
| Road injury | 296.2 | 158.6 | 557.9 | 403.0 | 325.7 | 241.0 | 153.7 | 88.0 | 23.1 | 20.3 | 29.1 | 30.0 | 30.2 | 28.0 | 25.8 | 22.4 |
| Poisonings | 0.0 | 3.3 | 18.2 | 14.1 | 12.2 | 8.2 | 5.5 | 2.6 | 0.0 | 10.2 | 20.7 | 22.9 | 21.9 | 19.5 | 14.6 | 9.8 |
| Falls | 0.0 | 14.4 | 76.6 | 95.2 | 109.1 | 113.2 | 95.6 | 97.9 | 0.0 | 11.9 | 23.0 | 24.6 | 25.2 | 21.8 | 16.4 | 10.7 |
| Fire, heat and hot substances | 0.0 | 5.5 | 25.9 | 26.7 | 21.5 | 18.1 | 11.7 | 7.4 | 0.0 | 7.6 | 15.8 | 18.4 | 21.2 | 20.0 | 16.7 | 11.6 |
| Drowning | 0.0 | 20.3 | 58.0 | 42.0 | 29.1 | 19.8 | 12.6 | 7.1 | 0.0 | 11.6 | 23.3 | 25.9 | 26.0 | 22.4 | 17.6 | 11.6 |
| Exposure to mechanical forces | 0.0 | 8.1 | 43.6 | 43.0 | 40.1 | 32.2 | 20.2 | 11.0 | 0.0 | 11.5 | 23.4 | 25.1 | 26.0 | 23.6 | 19.8 | 13.9 |
| Other unintentional injuries | 0.0 | 25.9 | 124.3 | 120.5 | 108.2 | 89.6 | 60.4 | 42.9 | 0.0 | 10.2 | 21.0 | 22.5 | 23.0 | 20.7 | 16.5 | 11.3 |
| Intentional injuries | 0.0 | 79.5 | 412.3 | 325.7 | 202.7 | 130.8 | 65.3 | 30.9 | 0.0 | 8.2 | 16.4 | 19.1 | 20.0 | 19.0 | 16.0 | 12.0 |
| Self-harm | 0.0 | 33.7 | 198.1 | 180.0 | 125.9 | 90.9 | 48.6 | 24.7 | 0.0 | 8.5 | 18.4 | 23.0 | 23.7 | 21.9 | 17.5 | 12.8 |
| Interpersonal violence | 0.0 | 45.9 | 214.2 | 145.7 | 76.8 | 39.9 | 16.7 | 6.2 | 0.0 | 10.9 | 20.5 | 22.1 | 21.8 | 20.2 | 17.3 | 12.0 |
Publisher’s Note: MDPI stays neutral with regard to jurisdictional claims in published maps and institutional affiliations. |
© 2021 by the authors. Licensee MDPI, Basel, Switzerland. This article is an open access article distributed under the terms and conditions of the Creative Commons Attribution (CC BY) license (https://creativecommons.org/licenses/by/4.0/).
Share and Cite
Sohi, I.; Franklin, A.; Chrystoja, B.; Wettlaufer, A.; Rehm, J.; Shield, K. The Global Impact of Alcohol Consumption on Premature Mortality and Health in 2016. Nutrients 2021, 13, 3145. https://doi.org/10.3390/nu13093145
Sohi I, Franklin A, Chrystoja B, Wettlaufer A, Rehm J, Shield K. The Global Impact of Alcohol Consumption on Premature Mortality and Health in 2016. Nutrients. 2021; 13(9):3145. https://doi.org/10.3390/nu13093145
Chicago/Turabian StyleSohi, Ivneet, Ari Franklin, Bethany Chrystoja, Ashley Wettlaufer, Jürgen Rehm, and Kevin Shield. 2021. "The Global Impact of Alcohol Consumption on Premature Mortality and Health in 2016" Nutrients 13, no. 9: 3145. https://doi.org/10.3390/nu13093145
APA StyleSohi, I., Franklin, A., Chrystoja, B., Wettlaufer, A., Rehm, J., & Shield, K. (2021). The Global Impact of Alcohol Consumption on Premature Mortality and Health in 2016. Nutrients, 13(9), 3145. https://doi.org/10.3390/nu13093145