
Association between Carbohydrate Intake and the Prevalence of Metabolic Syndrome in Korean Women


Abstract
1. Introduction
2. Materials and Methods
2.1. Study Population
2.2. Data Collection
2.3. Diagnostic Criteria for Metabolic Syndrome
2.4. Statistical Analysis
3. Results
3.1. Association of Carbohydrate Intake with Metabolic Syndrome and Its Components
3.2. Carbohydrate Intake, Socioeconomic Status, and Diet Quality
3.3. Association between Carbohydrate Intake and Metabolic Syndrome According to CRP Level and Other Food Intake
4. Discussion
4.1. Carbohydrate Intake and Metabolic Syndrome
4.2. Carbohydrate Intake and Socioeconomic Status
4.3. Carbohydrate Intake and Diet Quality
4.4. Metabolic Syndrome and Inflammation
4.5. Study Limitation
5. Conclusions
Supplementary Materials
Author Contributions
Funding
Institutional Review Board Statement
Informed Consent Statement
Acknowledgments
Conflicts of Interest
References
- Liu, J.; Grundy, S.M.; Wang, W.; Smith, S.C.; Vega, G.L.; Wu, Z.; Zeng, Z.; Wang, W.; Zhao, D. Ethnic-specific criteria for the metabolic syndrome: Evidence from China. Diabetes Care 2006, 29, 1414–1416. [Google Scholar] [CrossRef] [PubMed]
- Cornier, M.A.; Dabelea, D.; Hernandez, T.L.; Lindstrom, R.C.; Steig, A.J.; Stob, N.R.; Van Pelt, R.E.; Wang, H.; Eckel, R.H. The metabolic syndrome. Endocr. Rev. 2008, 29, 777–822. [Google Scholar] [CrossRef]
- Ridker, P.M.; Bruing, J.E.; Cook, N.R.; Rifai, N. C-reactive protein, the metabolic syndrome, and risk of incident cardiovascular event. Circulation 2003, 107, 391–397. [Google Scholar] [CrossRef]
- Devaraj, S.; Singh, U.; Jialal, I. Human C-reactive protein and the metabolic syndrome. Curr. Opin. Lipidol. 2009, 20, 182–189. [Google Scholar] [CrossRef]
- Pitsavos, C.; Panagiotakos, D.; Weinem, M.; Stefanadis, C. Diet, exercise and the metabolic syndrome. Rev. Diabet. Stud. 2006, 3, 118–126. [Google Scholar] [CrossRef]
- Schulze, M.B.; Hu, F.B. Dietary approaches to prevent the metabolic syndrome: Quality versus quantity of carbohydrates. Diabetes Care 2004, 27, 613–614. [Google Scholar] [CrossRef] [PubMed][Green Version]
- Ha, K.; Kim, K.; Chun, O.K.; Joung, H.; Song, Y. Differential association of dietary carbohydrate intake with metabolic syndrome in the US and Korean adults: Data from the 2007–2012 NHANES and KNHANES. Eur. J. Clin. Nutr. 2018, 72, 848–860. [Google Scholar] [CrossRef] [PubMed]
- Liu, Y.; Wu, Q.; Xia, Y.; Zhang, J.; Jiang, Y.; Chang, Q.; Zhao, Y. Carbohydrate intake and risk of metabolic syndrome: A dose-response meta-analysis of observational studies. Nutr. Metab. Cardiovasc. Dis. 2019, 29, 1288–1298. [Google Scholar] [CrossRef]
- McKeown, N.M.; Meigs, J.B.; Liu, S.; Saltzman, E.; Wilson, P.W.F.; Jacques, P.F. Carbohydrate nutrition, insulin resistance, and the prevalence of the metabolic syndrome in the Framingham Offspring Cohort. Diabetes Care 2004, 27, 538–546. [Google Scholar] [CrossRef]
- Song, S.; Lee, J.E.; Song, W.O.; Paik, H.; Song, Y. Carbohydrate intake and refined-grain consumption are associated with metabolic syndrome in the Korean adult population. J. Acad. Nutr. Diet. 2014, 114, 54–62. [Google Scholar] [CrossRef] [PubMed]
- Sakurai, M.; Nakagawa, H.; Kadota, A.; Yoshita, K.; Nakamura, Y.; Okuda, N.; Nishi, N.; Miyamoto, Y.; Arima, H.; Ohkubo, T.; et al. Macronutrient intake and socioeconomic status: NIPPON DATA2010. J. Epidemiol. 2018, 28 (Suppl. 3), S17–S22. [Google Scholar] [CrossRef]
- Irala-Estevez, J.D.; Groth, M.; Johansson, L.; Oltersdorf, U.; Prattala, R.; Martinez-Gonzalez, M.A. A systematic review of socio-economic differences in food habits in Europe: Consumption of fruit and vegetables. Eur. J. Clin. Nutr. 2000, 54, 706–714. [Google Scholar] [CrossRef] [PubMed]
- Park, S.H.; Lee, K.S.; Park, H.Y. Dietary carbohydrate intake is associated with cardiovascular disease risk in Korean: Analysis of the third Korean National Health and Nutrition Examination Survey (KNHANES III). Int. J. Cardiol. 2010, 139, 234–240. [Google Scholar] [CrossRef] [PubMed]
- Kim, Y.; Han, B.G.; KoGES Group. Cohort Profile: The Korean Genome and Epidemiology Study (KoGES) Consortium. Int. J. Epidemiol. 2017, 46, 1350. [Google Scholar] [CrossRef]
- Cho, Y.S.; Go, M.J.; Kim, Y.J.; Heo, J.Y.; Oh, J.H.; Ban, H.; Yoon, D.; Lee, M.H.; Kim, D.; Park, M.; et al. A large-scale genome-wide association study of Asian populations uncovers genetic factors influencing eight quantitative traits. Nat. Genet. 2009, 41, 527–534. [Google Scholar] [CrossRef]
- Ainsworth, B.E.; Haskell, W.L.; Whitt, M.C.; Irwin, L.; Swartz, A.M.; Strath, S.J.; O’BRIEN, W.L.; Bassett, D.R.; Schmitz, K.H.; Emplaincourt, R.O.; et al. Compendium of physical activities: An update of activity codes and MET intensities. Med. Sci. Sports Exerc. 2000, 32 (Suppl. 9), S498–S504. [Google Scholar] [CrossRef]
- Ahn, Y.; Kwon, E.; Shim, J.E.; Park, M.K.; Joo, Y.; Kimm, K.; Park, C.; Kim, D.H. Validation and reproducibility of food frequency questionnaire for Korean genome epidemiologic study. Eur. J. Clin. Nutr. 2007, 61, 1435–1441. [Google Scholar] [CrossRef] [PubMed]
- Lee, S.; Park, H.S.; Kim, S.M.; Kwon, H.S.; Kim, D.Y.; Kim, D.J.; Cho, G.J.; Han, J.H.; Kim, S.R.; Park, C.Y.; et al. Cut-off points of waist circumference for defining abdominal obesity in the Korean population. Korean J. Obes. 2006, 15, 1–9. [Google Scholar]
- Bursac, Z.; Gauss, C.H.; Williams, D.K.; Hosmer, D.W. Purposeful selection of variables in logistic regression. Source Code Biol. Med. 2008, 3, 17. [Google Scholar] [CrossRef]
- Willet, W.C.; Howe, G.R.; Kushi, L.H. Adjustment for total energy intake in epidemiologic studies. Am. J. Clin. Nutr. 1997, 65 (Suppl. 4), 1220S–1228S. [Google Scholar] [CrossRef]
- Merchant, A.T.; Anand, S.S.; Vuksan, V.; Jacobs, R.; Davis, B.; Teo, K.; Yusuf, S. Protein intake is inversely associated with abdominal obesity in a multi-ethnic population. J. Nutr. 2005, 135, 1196–1201. [Google Scholar] [PubMed]
- Kadowaki, T.; Sekikawa, A.; Murata, K.; Maegawa, H.; Takamiya, T.; Okamura, T.; EI-Saed, A.; Miyamatsu, N.; Edmundowicz, D.; Kita, Y.; et al. Japanese men have larger areas of visceral adipose tissue than Caucasian men in the same levels of waist circumference in a population-based study. Int. J. Obes. (Lond.) 2006, 30, 1163–1165. [Google Scholar] [CrossRef] [PubMed]
- Tan, C.E.; Ma, S.; Wai, D.; Chew, S.; Tai, E. Can we apply the National Cholesterol Education Program Adult Treatment Panel definition of the metabolic syndrome to Asians? Diabetes Care 2004, 27, 1182–1186. [Google Scholar] [CrossRef]
- Miyashita, Y.; Koide, N.; Ohtsuka, M.; Ozaki, H.; Itoh, Y.; Oyama, T.; Uetake, T.; Ariga, K.; Shirai, K. Beneficial effect of low carbohydrate in low calorie diets on visceral fat reduction in type 2 diabetic patients with obesity. Diabetes Res. Clin. Pract. 2004, 65, 235–241. [Google Scholar] [CrossRef]
- Wamala, S.P.; Lynch, J.; Horsten, M.; Mittleman, M.A.; Schenck-Gustafsson, K.; Orth-Gomer, K. Education and the metabolic syndrome in women. Diabetes Care 1999, 22, 1999–2003. [Google Scholar] [CrossRef]
- Roos, E.; Prattala, R.; Lahelma, E.; Kleemola, P.; Pietinen, P. Modern and healthy? Socioeconomic differences in the quality of diet. Eur. J. Clin. Nutr. 1996, 50, 753–760. [Google Scholar]
- Lee, S.; Shin, Y.; Kim, Y. Risk of metabolic syndrome among middle-aged Koreans from rural and urban areas. Nutrients 2018, 10, 859. [Google Scholar] [CrossRef] [PubMed]
- Shin, S.; Lee, H.W.; Kim, C.E.; Kim, J.; Lee, J.; Kang, D. Association between milk consumption and metabolic syndrome among Korean adults: Results from the Health Examinees Study. Nutrients 2017, 9, 1102. [Google Scholar] [CrossRef] [PubMed]
- Chen, G.C.; Szeto, I.M.Y.; Chen, L.H.; Han, S.; Li, Y.; Hekezen, R.; Qin, L. Dairy products consumption and metabolic syndrome in adults: Systematic review and metabolic analysis of observational studies. Sci. Rep. 2015, 5, 14606. [Google Scholar] [CrossRef]
- Boon, N.; Hul, G.B.J.; Stegen, J.H.C.H.; Sluijsmans, W.E.M.; Valle, C.; Langin, D.; Viguerie, N.; Saris, W.H.M. An intervention study of the effects of calcium intake on faecal fat excretion, energy metabolism and adipose tissue mRNA expression of lipid-metabolism related proteins. Int. J. Obes. 2007, 31, 1704–1712. [Google Scholar] [CrossRef]
- Zhang, F.; Ye, J.; Zhu, X.; Wang, L.; Gao, P.; Shu, G.; Jiang, Q.; Wang, S. Anti-obesity effects of dietary calcium: The evidence and possible mechanisms. Int. J. Mol. Sci. 2019, 20, 307. [Google Scholar]
- McGregor, R.A.; Poppitt, S.D. Milk protein for improved metabolic health: A review of evidence. Nutr. Metab. 2013, 10, 46. [Google Scholar] [CrossRef] [PubMed]
- So, E.; Choi, S.K.; Joung, H. Impact of dietary protein intake and obesity on lean mass in middle-aged individuals after a 12-year follow-up: The Korean Genome and Epidemiology Study (KoGES). Br. J. Nutr. 2019, 122, 322–330. [Google Scholar] [CrossRef]
- Van Dam, R.M.; Seidel, J.C. Carbohydrate intake and obesity. Eur. J. Clin. Nutr. 2017, 61 (Suppl. 1), S75–S99. [Google Scholar] [CrossRef]
- Shivappa, N.; Steck, S.E.; Hurley, T.G.; Hussey, J.R.; Hebert, J.R. Designing and developing a literature-derived, population-based dietary inflammatory index. Public Health Nutr. 2014, 17, 1689–1696. [Google Scholar] [CrossRef] [PubMed]
- Huffmann, K.M.; Orenduff, M.C.; Samsa, G.P.; Houmard, J.A.; Kraus, W.E.; Bales, C.W. Dietary carbohydrate intake and high sensitivity C reactive protein in at-risk women and men. Am. Heart J. 2008, 154, 962–968. [Google Scholar] [CrossRef][Green Version]


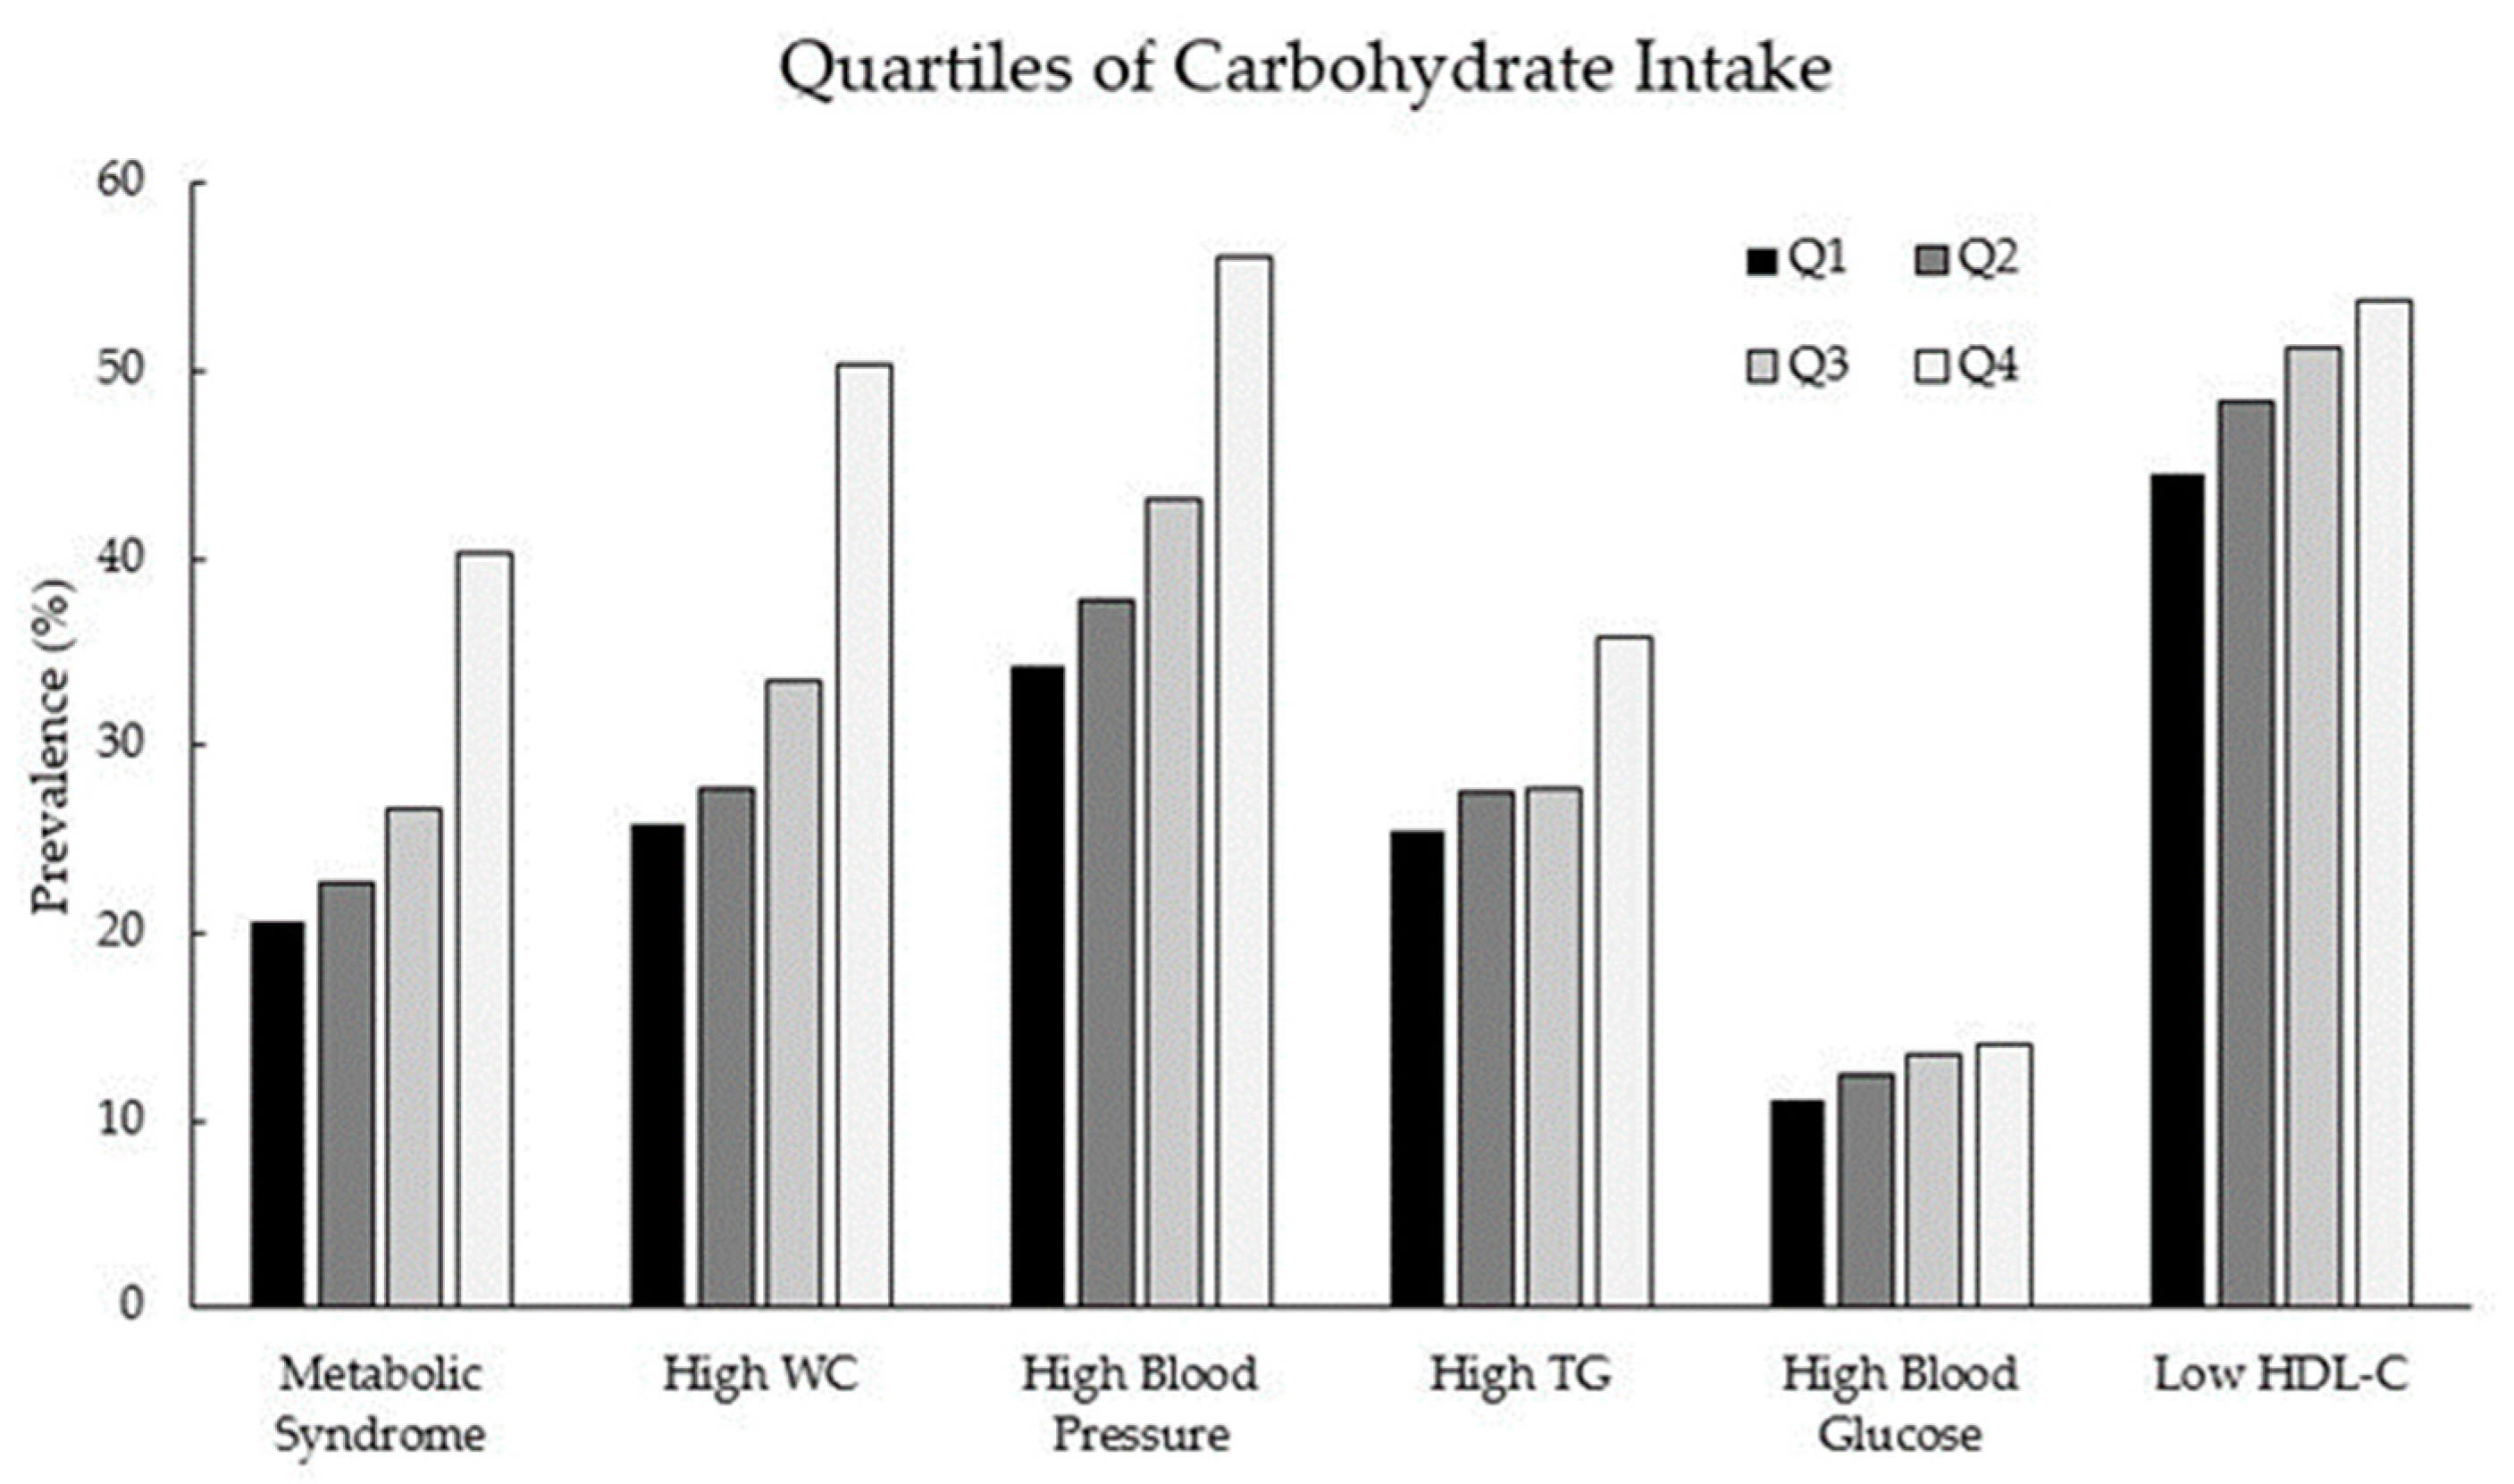
| Carbohydrate Intake 1 | No. (%) | Crude OR (95% CI) | Adjusted OR (95% CI) 2 | |
|---|---|---|---|---|
| Controls | Cases | |||
| Metabolic syndrome | ||||
| Q1 | 768 (25.0) | 200 (16.4) | 1.0 (ref) | 1.0 (ref) |
| Q2 | 768 (25.0) | 225 (18.4) | 1.13 (0.91–1.40) | 0.99 (0.79–1.25) |
| Q3 | 768 (25.0) | 278 (22.8) | 1.39 (1.13–1.71) | 1.00 (0.80–1.25) |
| Q4 | 769 (25.0) | 518 (42.4) | 2.59 (2.14–3.13) | 1.34 (1.08–1.66) |
| p for trend | <0.001 | 0.004 | ||
| Elevated waist circumference | ||||
| Q1 | 718 (25.9) | 250 (16.4) | 1.0 (ref) | 1.0 (ref) |
| Q2 | 717 (25.9) | 276 (18.1) | 1.11 (0.91–1.35) | 1.04 (0.84–1.28) |
| Q3 | 697 (25.1) | 349 (22.9) | 1.44 (1.19–1.74) | 1.02 (0.83–1.26) |
| Q4 | 640 (23.1) | 647 (42.5) | 2.90 (2.42–3.48) | 1.32 (1.08–1.62) |
| p for trend | <0.001 | 0.007 | ||
| High blood pressure | ||||
| Q1 | 637 (26.4) | 331 (17.6) | 1.0 (ref) | 1.0 (ref) |
| Q2 | 618 (25.6) | 375 (19.9) | 2.17 (0.97–1.41) | 0.99 (0.81–1.21) |
| Q3 | 594 (24.6) | 452 (24.0) | 1.46 (1.22–1.75) | 0.98 (0.80–1.19) |
| Q4 | 564 (23.4) | 723 (38.4) | 2.47 (2.08–2.93) | 1.07 (0.87–1.31) |
| p for trend | <0.001 | 0.623 | ||
| High triglycerides | ||||
| Q1 | 721 (23.9) | 247 (19.4) | 1.0 (ref) | 1.0 (ref) |
| Q2 | 719 (23.8) | 274 (21.5) | 1.11 (0.91–1.36) | 1.01 (0.82–1.23) |
| Q3 | 755 (25.0) | 291 (22.9) | 1.13 (0.92–1.37) | 0.95 (0.78–1.17) |
| Q4 | 826 (27.3) | 461 (36.2) | 1.63 (1.36–1.96) | 1.19 (0.97–1.47) |
| p for trend | <0.001 | 0.118 | ||
| High fasting blood glucose | ||||
| Q1 | 861 (23.0) | 107 (19.4) | 1.0 (ref) | 1.0 (ref) |
| Q2 | 870 (23.3) | 123 (22.3) | 1.14 (0.86–1.50) | 1.03 (0.78–1.37) |
| Q3 | 905 (24.2) | 141 (25.5) | 1.25 (0.96–1.64) | 1.08 (0.82–1.42) |
| Q4 | 1106 (29.6) | 181 (32.8) | 1.32 (1.02–1.70) | 1.08 (0.82–1.44) |
| p for trend | 0.027 | 0.508 | ||
| Low HDL cholesterol | ||||
| Q1 | 536 (24.9) | 432 (20.2) | 1.0 (ref) | 1.0 (ref) |
| Q2 | 512 (23.8) | 481 (22.5) | 1.17 (0.98–1.39) | 1.11 (0.93–1.33) |
| Q3 | 511 (23.7) | 535 (25.0) | 1.30 (1.09–1.55) | 1.18 (0.99–1.42) |
| Q4 | 595 (27.6) | 692 (32.3) | 1.44 (1.22–1.71) | 1.19 (0.99–1.43) |
| p for trend | <0.001 | 0.040 | ||
| Quartiles of Carbohydrate Intake 3 | |||||
|---|---|---|---|---|---|
| Q1 (n = 768) | Q2 (n = 768) | Q3 (n = 768) | Q4 (n = 769) | p-Value 4 | |
| Age (years) | |||||
| <50 | 546 (71.1) | 454 (59.1) | 414 (53.9) | 263 (34.2) | <0.001 |
| 50–60 | 147 (19.1) | 186 (24.2) | 186 (24.2) | 235 (30.6) | |
| ≥60 | 75 (9.8) | 128 (16.7) | 168 (21.9) | 271 (35.2) | |
| BMI (kg/m2) | |||||
| <23 | 300 (39.1) | 229 (33.7) | 262 (34.1) | 301 (39.1) | 0.063 |
| 23–25 | 227 (29.6) | 238 (31.0) | 221 (28.8) | 206 (26.8) | |
| ≥25 | 241 (31.4) | 271 (35.3) | 285 (37.1) | 262 (34.1) | |
| Residential location | |||||
| Rural area | 230 (30.0) | 201 (26.2) | 318 (41.4) | 558 (72.6) | <0.001 |
| Urban area | 538 (70.1) | 567 (73.8) | 450 (58.6) | 211 (27.4) | |
| Marital status | |||||
| No | 69 (9.0) | 102 (13.1) | 100 (13.0) | 120 (15.6) | 0.001 |
| Yes | 699 (91.0) | 664 (86.7) | 664 (86.9) | 644 (84.3) | |
| Unknown | 0 (0) | 2 (0.3) | 4 (0.5) | 5 (0.7) | |
| Occupation | |||||
| Professional, Office | 29 (3.8) | 26 (3.4) | 12 (1.7) | 13 (1.7) | <0.001 |
| Service, Sales | 114 (14.8) | 81 (10.5) | 78 (10.2) | 56 (7.3) | |
| Agriculture, manufacturing | 107 (14.0) | 109 (14.2) | 175 (22.8) | 309 (40.2) | |
| Housewife, others | 517 (67.3) | 552 (71.9) | 501 (65.2) | 385 (50.1) | |
| Unknown | 1 (0.1) | 0 (0) | 2 (0.3) | 3 (0.8) | |
| Education level | |||||
| Middle school or less | 343 (44.7) | 406 (52.9) | 501 (65.2) | 629 (81.8) | <0.001 |
| High school | 345 (44.9) | 289 (37.6) | 212 (27.6) | 110 (14.3) | |
| College or more | 78 (10.2) | 68 (8.9) | 49 (6.4) | 24 (3.1) | |
| Unknown | 0 (0.3) | 5 (0.7) | 6 (0.8) | 6 (0.8) | |
| Household income 2 | |||||
| Low (<200 won) | 385 (50.1) | 429 (55.9) | 512 (66.7) | 625 (81.4) | <0.001 |
| Medium (200–400 won) | 296 (38.5) | 260 (33.9) | 196 (25.5) | 104 (13.5) | |
| High (≥400 won) | 77 (10.0) | 64 (8.3) | 46 (6.0) | 15 (2.0) | |
| Unknown | 10 (1.3) | 15 (2.0) | 14 (1.8) | 25 (3.3) | |
| Alcohol consumption | |||||
| Never | 458 (59.6) | 541 (70.4) | 521 (67.8) | 574 (74.6) | <0.001 |
| Ever | 309 (40.3) | 223 (29.2) | 245 (32.0) | 189 (24.8) | |
| Unknown | 1 (0.1) | 4 (0.5) | 2 (0.3) | 6 (0.8) | |
| Smoking status | |||||
| Never | 712 (92.7) | 731 (95.2) | 731 (95.2) | 722 (93.9) | 0.335 |
| Ever | 41 (5.4) | 29 (3.8) | 33 (4.3) | 28 (3.7) | |
| Unknown | 15 (2.0) | 8 (1.0) | 4 (0.5) | 19 (2.5) | |
| Physical activity (METs/day) | |||||
| Q1 (<720) | 191 (24.9) | 193 (25.1) | 169 (22.0) | 204 (26.5) | <0.001 |
| Q2 (720–1155) | 223 (29.0) | 243 (31.6) | 206 (26.8) | 134 (17.4) | |
| Q3 (1155–1965) | 250 (32.6) | 214 (27.9) | 187 (24.3) | 133 (17.3) | |
| Q4 (≥1965) | 87 (11.3) | 101 (13.2) | 189 (24.6) | 262 (34.1) | |
| Unknown | 17 (2.2) | 17 (2.2) | 17 (2.2) | 36 (4.7) | |
| Carbohydrate Intake 1 | Low CRP 2 | High CRP | ||
|---|---|---|---|---|
| No. Controls/Cases | OR (95% CI) 3 | No. Controls/Cases | OR (95% CI) 3 | |
| Metabolic syndrome | ||||
| Q1 | 341/43 | 1.0 (ref) | 427/157 | 1.0 (ref) |
| Q2 | 298/55 | 1.40 (0.90–2.20) | 470/170 | 0.86 (0.66–1.12) |
| Q3 | 295/78 | 1.65 (1.08–2.52) | 473/200 | 0.82 (0.63–1.07) |
| Q4 | 290/132 | 1.84 (1.21–2.80) | 479/386 | 1.17 (0.91–1.51) |
| p for trend | 0.003 | 0.147 | ||
| Elevated waist circumference | ||||
| Q1 | 308/76 | 1.0 (ref) | 410/174 | 1.0 (ref) |
| Q2 | 276/77 | 1.09 (0.76–1.58) | 441/199 | 0.99 (0.76–1.28) |
| Q3 | 278/95 | 1.12 (0.78–1.61) | 419/254 | 0.95 (0.73–1.23) |
| Q4 | 234/188 | 1.76 (1.24–2.51) | 406/459 | 1.13 (0.87–1.45) |
| p for trend | 0.002 | 0.344 | ||
| High blood pressure | ||||
| Q1 | 284/100 | 1.0 (ref) | 353/231 | 1.0 (ref) |
| Q2 | 249/104 | 1.06 (0.74–1.50) | 369/271 | 0.95 (0.74–1.21) |
| Q3 | 242/131 | 1.06 (0.75–1.49) | 352/321 | 0.94 (0.74–1.21) |
| Q4 | 208/214 | 1.16 (0.82–1.64) | 356/509 | 1.01 (0.79–1.30) |
| p for trend | 0.464 | 0.972 | ||
| High triglyceride | ||||
| Q1 | 325/59 | 1.0 (ref) | 396/188 | 1.0 (ref) |
| Q2 | 282/71 | 1.29 (0.87–1.90) | 437/203 | 0.89 (0.70–1.14) |
| Q3 | 286/87 | 1.49 (1.02–2.18) | 469/204 | 0.78 (0.61–1.00) |
| Q4 | 311/111 | 1.53 (1.03–2.26) | 515/350 | 1.06 (0.83–1.35) |
| p for trend | 0.026 | 0.729 | ||
| High fasting blood glucose | ||||
| Q1 | 359/25 | 1.0 (ref) | 502/82 | 1.0 (ref) |
| Q2 | 324/29 | 1.15 (0.65–2.02) | 546/94 | 0.98 (0.71–1.36) |
| Q3 | 334/39 | 1.37 (0.80–2.35) | 571/102 | 0.98 (0.71–1.35) |
| Q4 | 371/51 | 1.45 (0.84–2.51) | 735/130 | 0.97 (0.70–1.34) |
| p for trend | 0.165 | 0.892 | ||
| Low HDL cholesterol | ||||
| Q1 | 248/136 | 1.0 (ref) | 288/296 | 1.0 (ref) |
| Q2 | 190/163 | 1.51 (1.12–2.03) | 322/318 | 0.91 (0.73–1.14) |
| Q3 | 183/190 | 1.80 (1.34–2.42) | 328/345 | 0.92 (0.73–1.15) |
| Q4 | 213/209 | 1.57 (1.15–2.14) | 382/483 | 1.00 (0.79–1.26) |
| p for trend | 0.001 | 0.976 | ||
| Low Carbohydrate Intake | High Carbohydrate Intake | |||||
|---|---|---|---|---|---|---|
| Dairy Food Intake | Low | High | p-Value | Low | High | p-Value |
| Metabolic syndrome | ||||||
| No. controls/cases | 563/168 | 973/257 | 0.333 | 973/571 | 564/225 | 0.014 |
| OR (95% CI)2 | 1.0 (ref) | 0.89 (0.71–1.13) | 1.0 (ref) | 0.78 (0.64–0.95) | ||
| Elevated waist circumference | ||||||
| No. controls/cases | 510/221 | 925/305 | 0.062 | 818/726 | 519/270 | <0.001 |
| OR (95% CI) 2 | 1.0 (ref) | 0.81 (0.65–1.01) | 1.0 (ref) | 0.72 (0.59–0.87) | ||
| High blood pressure | ||||||
| No. controls/cases | 461/270 | 794/436 | 0.444 | 732/812 | 426/363 | 0.264 |
| OR (95% CI) 2 | 1.0 (ref) | 0.92 (0.75–1.14) | 1.0 (ref) | 0.90 (0.74–1.09) | ||
| High triglycerides | ||||||
| No. controls/cases | 531/200 | 909/321 | 0.431 | 1006/538 | 575/214 | 0.001 |
| OR (95% CI) 2 | 1.0 (ref) | 0.92 (0.74–1.14) | 1.0 (ref) | 0.72 (0.59–0.87) | ||
| High fasting glucose | ||||||
| No. controls/cases | 634/97 | 1097/133 | 0.051 | 1335/209 | 676/113 | 0.601 |
| OR (95% CI) 2 | 1.0 (ref) | 0.75 (0.57–1.00) | 1.0 (ref) | 1.07 (0.83–1.38) | ||
| Low HDL cholesterol | ||||||
| No. controls/cases | 384/347 | 664/566 | 0.624 | 701/843 | 405/384 | 0.015 |
| OR (95% CI) 2 | 1.0 (ref) | 0.95 (0.79–1.15) | 1.0 (ref) | 0.80 (0.67–0.96) | ||
Publisher’s Note: MDPI stays neutral with regard to jurisdictional claims in published maps and institutional affiliations. |
© 2021 by the authors. Licensee MDPI, Basel, Switzerland. This article is an open access article distributed under the terms and conditions of the Creative Commons Attribution (CC BY) license (https://creativecommons.org/licenses/by/4.0/).
Share and Cite
Cho, Y.-A.; Choi, J.-H. Association between Carbohydrate Intake and the Prevalence of Metabolic Syndrome in Korean Women. Nutrients 2021, 13, 3098. https://doi.org/10.3390/nu13093098
Cho Y-A, Choi J-H. Association between Carbohydrate Intake and the Prevalence of Metabolic Syndrome in Korean Women. Nutrients. 2021; 13(9):3098. https://doi.org/10.3390/nu13093098
Chicago/Turabian StyleCho, Young-Ae, and Jeong-Hwa Choi. 2021. "Association between Carbohydrate Intake and the Prevalence of Metabolic Syndrome in Korean Women" Nutrients 13, no. 9: 3098. https://doi.org/10.3390/nu13093098
APA StyleCho, Y.-A., & Choi, J.-H. (2021). Association between Carbohydrate Intake and the Prevalence of Metabolic Syndrome in Korean Women. Nutrients, 13(9), 3098. https://doi.org/10.3390/nu13093098