
Do Breastfeeding History and Diet Quality Predict Inhibitory Control at Preschool Age?


Abstract
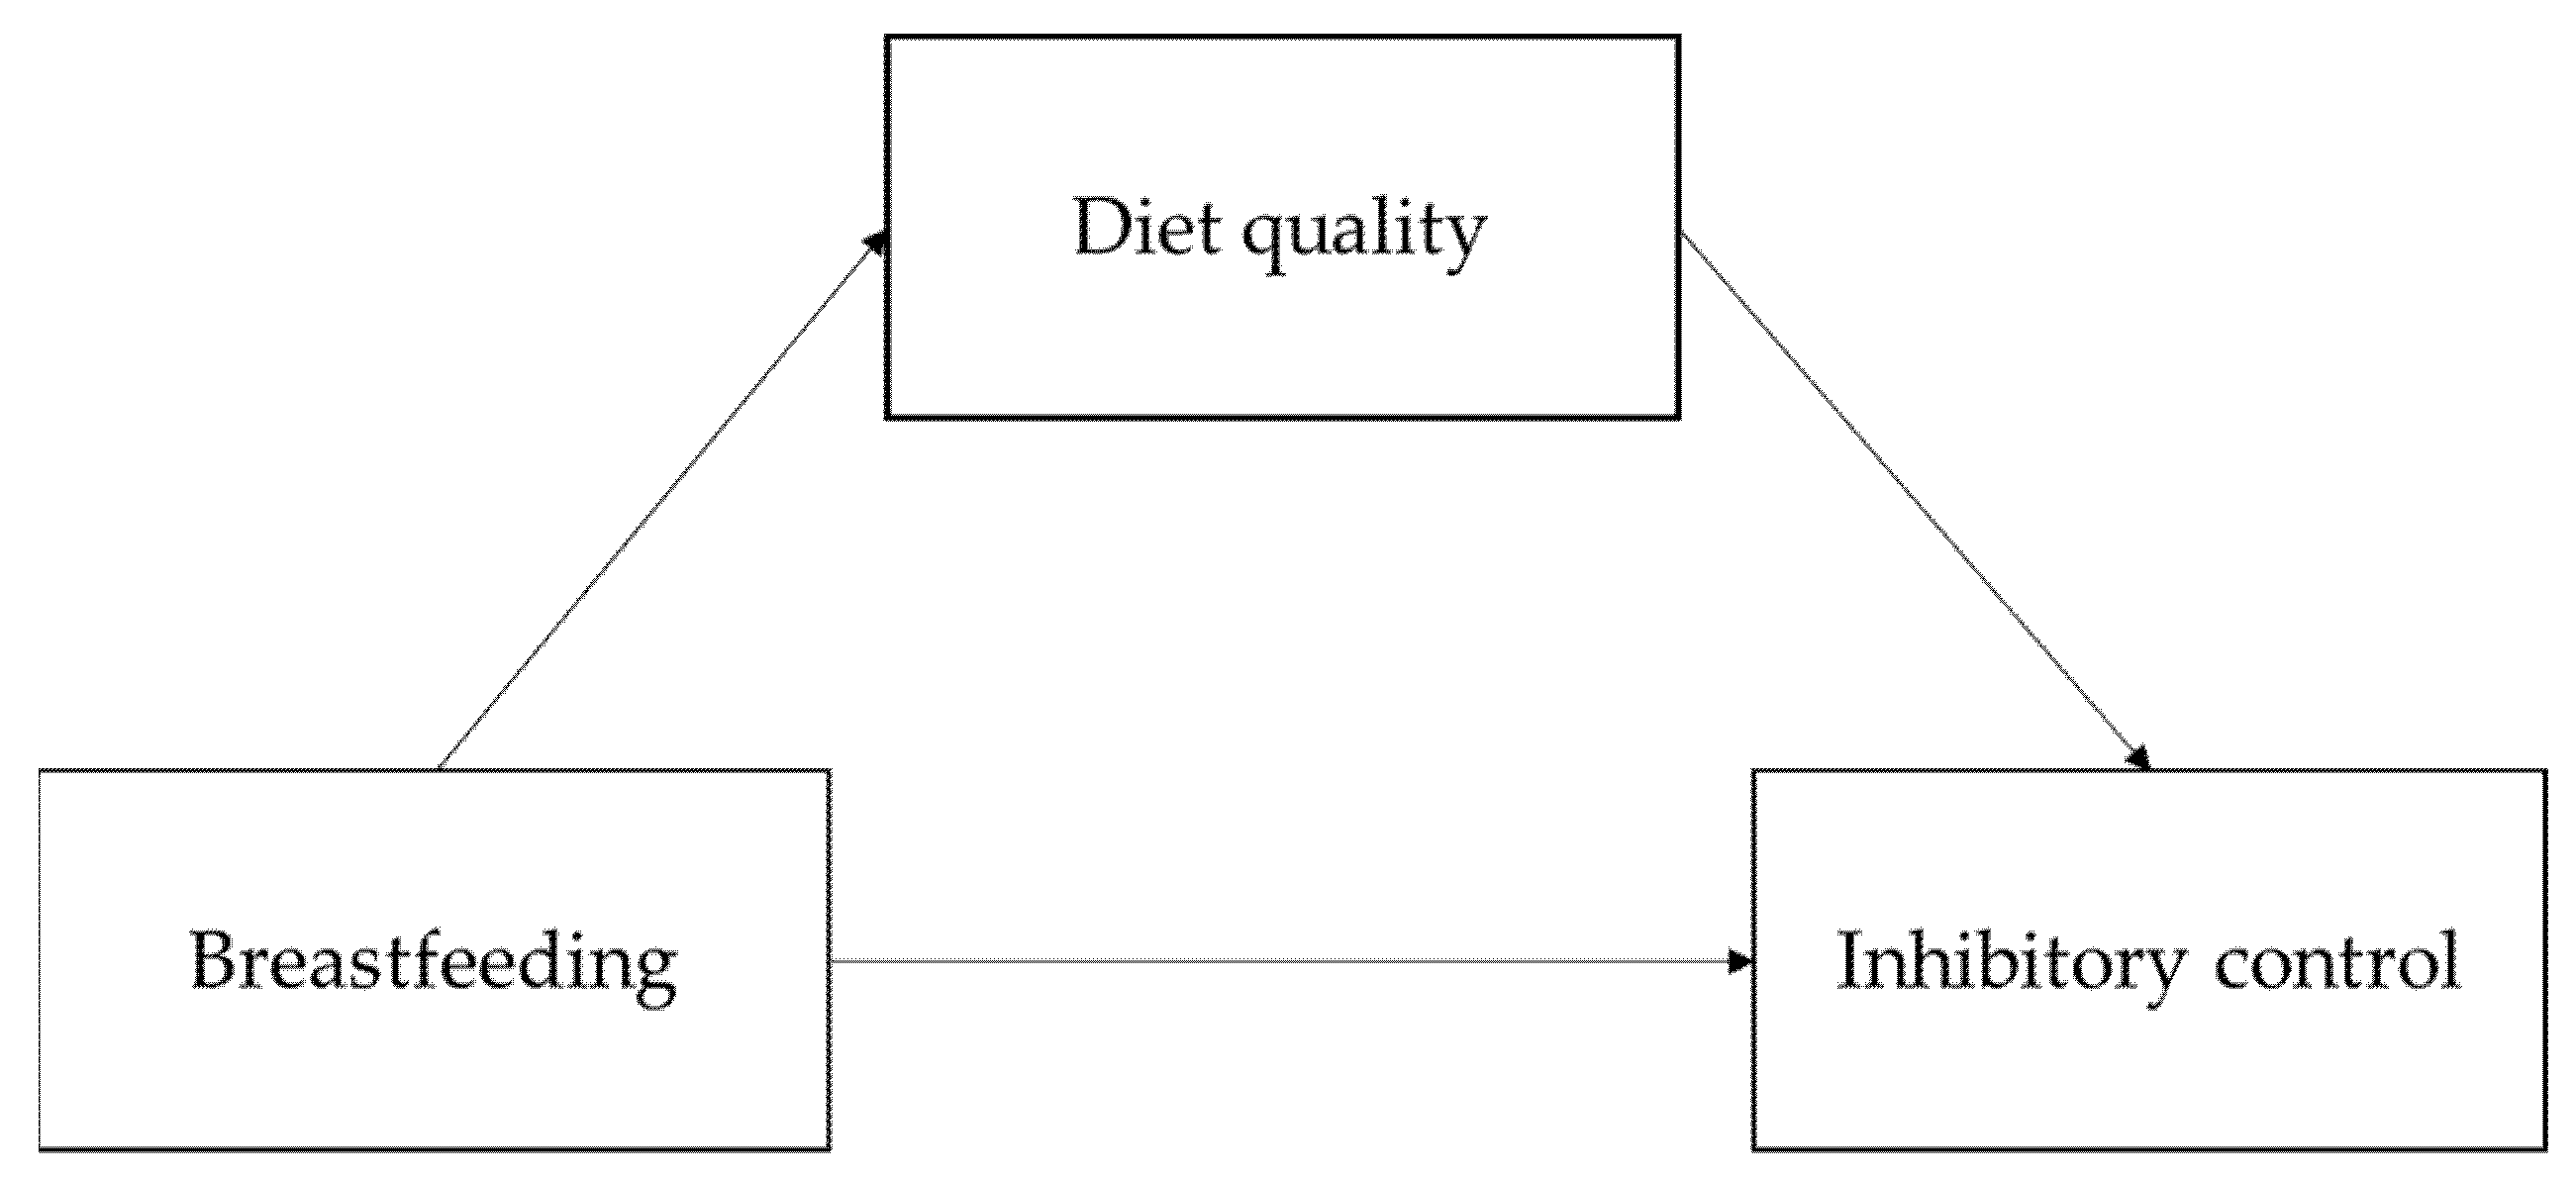
:1. Introduction
2. Materials and Methods
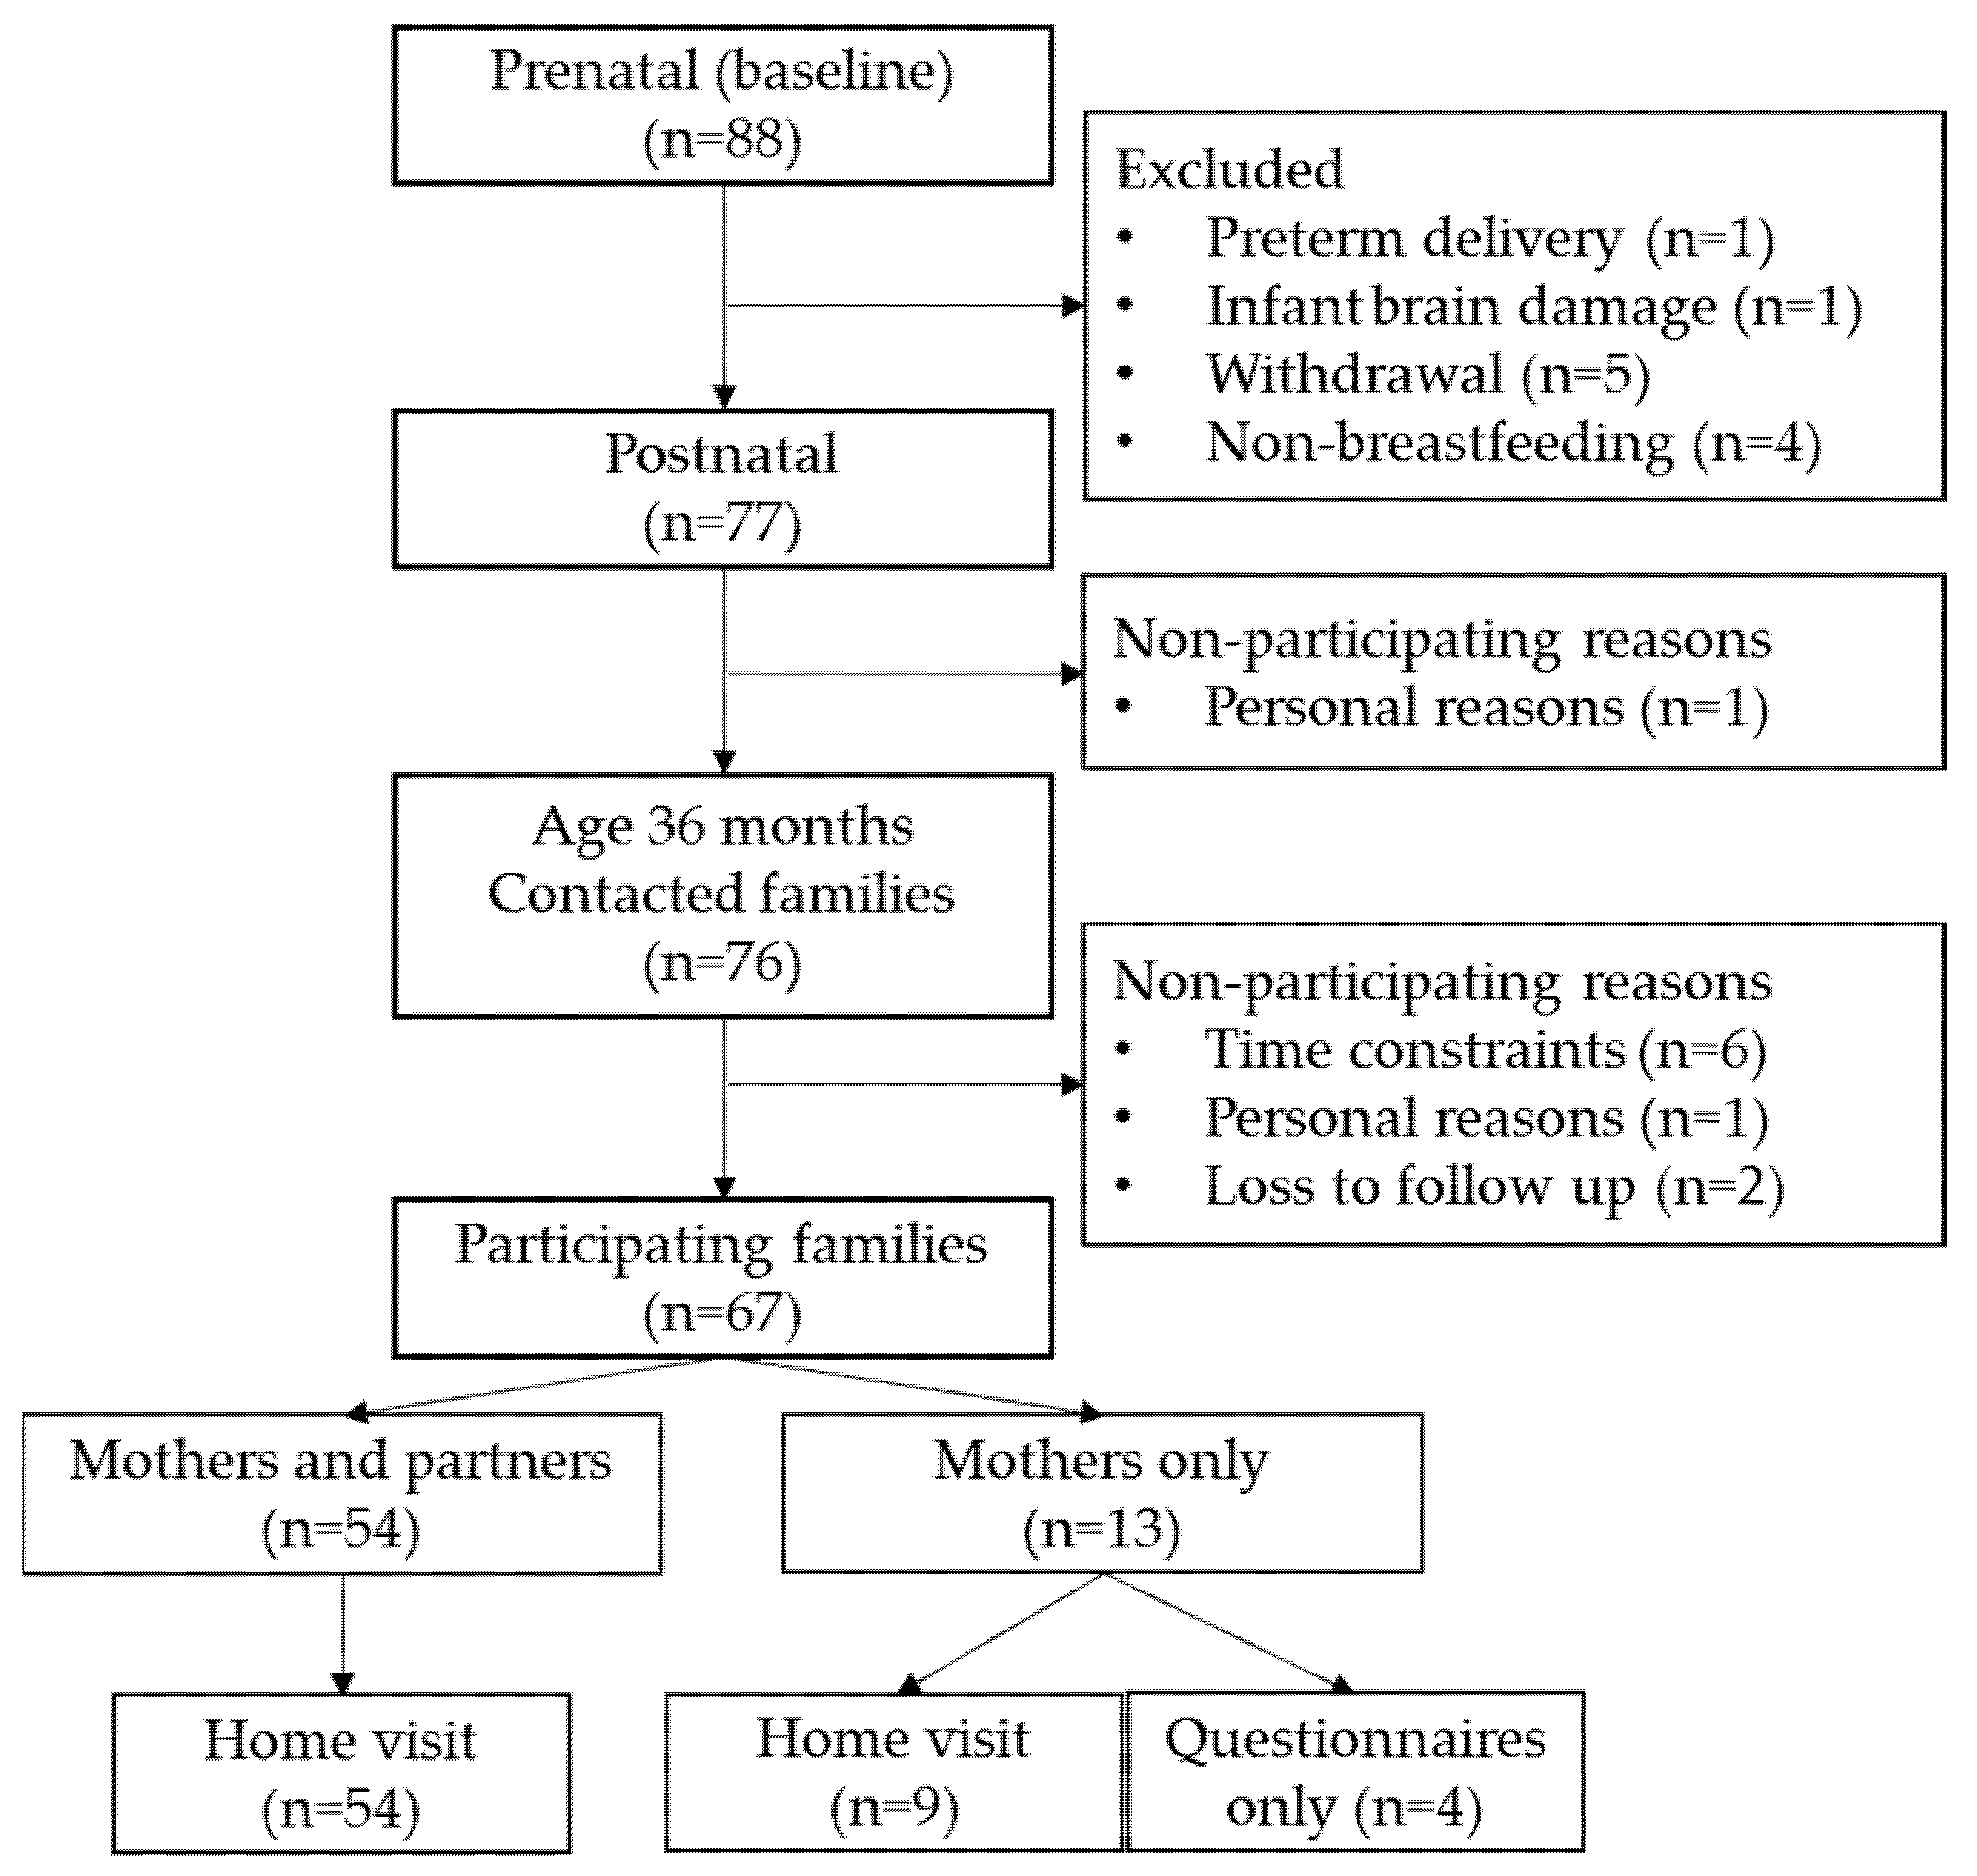
2.1. Participants
2.2. Data Collection Procedure
2.3. Measures
2.3.1. Breastfeeding History
2.3.2. Diet Quality
2.3.3. Inhibitory Control Tasks
2.3.4. Reliability of Coding
2.3.5. Parental Questionnaires on Inhibitory Control and Executive Functioning
2.3.6. Confounding
2.4. Statistical Analyses
2.5. Missing Data
2.6. Latent Variable and Composite Score Creation
2.7. Main Analyses
2.8. Comparability Analyses
2.9. Exploratory Analyses
3. Results
3.1. Preliminary Analyses
3.1.1. Descriptives
3.1.2. Latent Variable and Composite Score Creation
3.1.3. Confounders
3.2. Main Analyses
3.3. Comparability Analyses
3.4. Exploratory Analyses
4. Discussion
5. Conclusions
Supplementary Materials
Author Contributions
Funding
Institutional Review Board Statement
Informed Consent Statement
Acknowledgments
Conflicts of Interest
References
- American Psychological Association Inhibition—APA Dictionary of Psychology. Available online: https://dictionary.apa.org/inhibition (accessed on 8 November 2019).
- Diamond, A. Executive functions. Annu. Rev. Psychol. 2013, 64, 135–168. [Google Scholar] [CrossRef] [Green Version]
- Moffitt, T.E.; Arseneault, L.; Belsky, D.; Dickson, N.; Hancox, R.J.; Harrington, H.L.; Houts, R.; Poulton, R.; Roberts, B.W.; Ross, S.; et al. A gradient of childhood self-control predicts health, wealth, and public safety. Proc. Natl. Acad. Sci. USA 2011, 108, 2693–2698. [Google Scholar] [CrossRef] [PubMed] [Green Version]
- Lipszyc, J.; Schachar, R. Inhibitory control and psychopathology: A meta-analysis of studies using the stop signal task. J. Int. Neuropsychol. Soc. 2010, 16, 1064–1076. [Google Scholar] [CrossRef] [PubMed]
- Gagne, J.R.; Saudino, K.J.; Asherson, P. The genetic etiology of inhibitory control and behavior problems at 24 months of age. J. Child Psychol. Psychiatry Allied Discip. 2011, 52, 1155–1163. [Google Scholar] [CrossRef]
- Gagne, J.R.; Chang, C.-N.; Fang, H.; Spann, C.; Kwok, O.-M. A multimethod study of inhibitory control and behavioural problems in preschoolers. Infant Child Dev. 2019, 28, e2115. [Google Scholar] [CrossRef] [Green Version]
- St. John, A.M.; Kibbe, M.; Tarullo, A.R. A systematic assessment of socioeconomic status and executive functioning in early childhood. J. Exp. Child Psychol. 2019, 178, 352–368. [Google Scholar] [CrossRef]
- Cheng, N.; Lu, S.; Archer, M.; Wang, Z. Quality of Maternal Parenting of 9-Month-Old Infants Predicts Executive Function Performance at 2 and 3 Years of Age. Front. Psychol. 2018, 8, 2293. [Google Scholar] [CrossRef] [Green Version]
- Engelhardt, L.E.; Briley, D.A.; Mann, F.D.; Harden, K.P.; Tucker-Drob, E.M. Genes Unite Executive Functions in Childhood. Psychol. Sci. 2015, 26, 1151–1163. [Google Scholar] [CrossRef] [Green Version]
- Egbert, A.H.; Creber, C.; Loren, D.M.; Bohnert, A.M. Executive function and dietary intake in youth: A systematic review of the literature. Appetite 2019, 139, 197–212. [Google Scholar] [CrossRef] [PubMed]
- Cryan, J.F.; O’riordan, K.J.; Cowan, C.S.M.; Sandhu, K.V.; Bastiaanssen, T.F.S.; Boehme, M.; Codagnone, M.G.; Cussotto, S.; Fulling, C.; Golubeva, A.V.; et al. The microbiota-gut-brain axis. Physiol. Rev. 2019, 99, 1877–2013. [Google Scholar] [CrossRef]
- Vernocchi, P.; Del Chierico, F.; Putignani, L. Gut microbiota metabolism and interaction with food components. Int. J. Mol. Sci. 2020, 21, 3688. [Google Scholar] [CrossRef] [PubMed]
- Georgieff, M.K.; Brunette, K.E.; Tran, P.V. Early life nutrition and neural plasticity. Dev. Psychopathol. 2015, 27, 411–423. [Google Scholar] [CrossRef] [PubMed] [Green Version]
- Duijts, L.; Ramadhani, M.K.; Moll, H.A. Breastfeeding protects against infectious diseases during infancy in industrialized countries. A systematic review. Matern. Child Nutr. 2009, 5, 199–210. [Google Scholar] [CrossRef]
- Victora, C.G.; Bahl, R.; Barros, A.J.D.; França, G.V.A.; Horton, S.; Krasevec, J.; Murch, S.; Sankar, M.J.; Walker, N.; Rollins, N.C.; et al. Breastfeeding in the 21st century: Epidemiology, mechanisms, and lifelong effect. Lancet 2016, 387, 475–490. [Google Scholar] [CrossRef] [Green Version]
- Bar, S.; Milanaik, R.; Adesman, A. Long-term neurodevelopmental benefits of breastfeeding. Curr. Opin. Pediatr. 2016, 28, 559–566. [Google Scholar] [CrossRef]
- Zeng, Y.; Tang, Y.; Tang, J.; Shi, J.; Zhang, L.; Zhu, T.; Xiao, D.; Qu, Y.; Mu, D. Association between the different duration of breastfeeding and attention deficit/hyperactivity disorder in children: A systematic review and meta-analysis. Nutr. Neurosci. 2018, 811–823. [Google Scholar] [CrossRef]
- Julvez, J.; Ribas-Fitó, N.; Forns, M.; Garcia-Esteban, R.; Torrent, M.; Sunyer, J. Attention behaviour and hyperactivity at age 4 and duration of breast-feeding. Acta Paediatr. 2007, 96, 842–847. [Google Scholar] [CrossRef] [PubMed]
- Belfort, M.B.; Rifas-Shiman, S.L.; Kleinman, K.P.; Bellinger, D.C.; Harris, M.H.; Taveras, E.M.; Gillman, M.W.; Oken, E. Infant Breastfeeding Duration and Mid-Childhood Executive Function, Behavior, and Social-Emotional Development. J. Dev. Behav. Pediatr. 2016, 37, 43–52. [Google Scholar] [CrossRef] [Green Version]
- Lopez, D.A.; Foxe, J.J.; Mao, Y.; Thompson, W.K.; Martin, H.J.; Freedman, E.G. Breastfeeding Duration Is Associated With Domain-Specific Improvements in Cognitive Performance in 9–10-Year-Old Children. Front. Public Health 2021, 9, 657422. [Google Scholar] [CrossRef]
- Pieper, J.R.; Laugero, K.D. Preschool children with lower executive function may be more vulnerable to emotional-based eating in the absence of hunger. Appetite 2013, 62, 103–109. [Google Scholar] [CrossRef]
- Levitan, R.D.; Rivera, J.; Silveira, P.P.; Steiner, M.; Gaudreau, H.; Hamilton, J.; Kennedy, J.L.; Davis, C.; Dube, L.; Fellows, L.; et al. Gender differences in the association between stop-signal reaction times, body mass indices and/or spontaneous food intake in pre-school children: An early model of compromised inhibitory control and obesity. Int. J. Obes. 2015, 39, 614–619. [Google Scholar] [CrossRef] [PubMed]
- Cohen, J.F.W.; Gorski, M.T.; Gruber, S.A.; Kurdziel, L.B.F.; Rimm, E.B. The effect of healthy dietary consumption on executive cognitive functioning in children and adolescents: A systematic review. Br. J. Nutr. 2016, 116, 989–1000. [Google Scholar] [CrossRef] [Green Version]
- Ventura, A.K. Does Breastfeeding Shape Food Preferences? Links to Obesity. Ann. Nutr. Metab. 2017, 70, 8–15. [Google Scholar] [CrossRef]
- Hayatbakhsh, M.R.; O’Callaghan, M.J.; Bor, W.; Williams, G.M.; Najman, J.M. Association of Breastfeeding and Adolescents’ Psychopathology: A Large Prospective Study. Breastfeed. Med. 2012, 7, 480–486. [Google Scholar] [CrossRef] [PubMed]
- Hechler, C.; Beijers, R.; Riksen-Walraven, J.M.; de Weerth, C. Are cortisol concentrations in human breast milk associated with infant crying? Dev. Psychobiol. 2018, 60, 639–650. [Google Scholar] [CrossRef] [PubMed]
- Horta, B.L.; Victora, C.G.; World Health Organization. Long-Term Effects of Breastfeeding: A Systematic Review; WHO: Geneva, Switzerland, 2013. [Google Scholar]
- Meijboom, S.; van Houts-Streppel, M.T.; Perenboom, C.; Siebelink, E.; van de Wiel, A.M.; Geelen, A.; Feskens, E.J.M.; de Vries, J.H.M. Evaluation of dietary intake assessed by the Dutch self-administered web-based dietary 24-h recall tool (Compl-eatTM) against interviewer-administered telephone-based 24-h recalls. J. Nutr. Sci. 2017, 6, e49. [Google Scholar] [CrossRef] [PubMed] [Green Version]
- Voortman, T.; Kiefte-de Jong, J.C.; Geelen, A.; Villamor, E.; Moll, H.A.; de Jongste, J.C.; Raat, H.; Hofman, A.; Jaddoe, V.W.; Franco, O.H.; et al. The Development of a Diet Quality Score for Preschool Children and Its Validation and Determinants in the Generation R Study. J. Nutr. 2015, 145, 306–314. [Google Scholar] [CrossRef] [PubMed]
- Anderson, P.J.; Reidy, N. Assessing Executive Function in Preschoolers. Neuropsychol. Rev. 2012, 22, 345–360. [Google Scholar] [CrossRef]
- Beijers, R.; Riksen-Walraven, M.; Putnam, S.; de Jong, M.; de Weerth, C. Early non-parental care and toddler behaviour problems: Links with temperamental negative affectivity and inhibitory control. Early Child. Res. Q. 2013, 28, 714–722. [Google Scholar] [CrossRef]
- Kochanska, G.; Murray, K.; Jacques, T.Y.; Koenig, A.L.; Vandegeest, K.A. Inhibitory Control in Young Children and Its Role in Emerging Internalization. Child Dev. 1996, 67, 490–507. [Google Scholar] [CrossRef]
- Eriksen, B.A.; Eriksen, C.W. Effects of noise letters upon the identification of a target letter in a nonsearch task. Percept. Psychophys. 1974, 16, 143–149. [Google Scholar] [CrossRef] [Green Version]
- Zelazo, P.D.; Anderson, J.E.; Richler, J.; Wallner-Allen, K.; Beaumont, J.L.; Weintraub, S. II. NIH Toolbox Cognition Battery (CB): Measuring executive function and attention. Monogr. Soc. Res. Child Dev. 2013, 78, 16–33. [Google Scholar] [CrossRef]
- Reed, M.A.; Pien, D.L.; Rothbart, M.K. Inhibitory Self-Control in Preschool Children. Merrill. Palmer. Q. 1984, 30, 131–147. [Google Scholar]
- Kloo, D.; Sodian, B. The developmental stability of inhibition from 2 to 5 years. Br. J. Dev. Psychol. 2017, 35, 582–595. [Google Scholar] [CrossRef] [PubMed]
- Putnam, S.P.; Gartstein, M.A.; Rothbart, M.K. Measurement of Fine-Grained Aspects of Toddler Temperament: The Early Childhood Behavior Questionnaire. Infant Behav. Dev. 2006, 29, 386. [Google Scholar] [CrossRef] [PubMed] [Green Version]
- Sherman, E.M.S.; Brooks, B.L. Behavior Rating Inventory of Executive Function—Preschool Version (BRIEF-P): Test Review and Clinical Guidelines for Use. Child Neuropsychol. 2010, 16, 503–519. [Google Scholar] [CrossRef]
- Nilsen, E.S.; Huyder, V.; McAuley, T.; Liebermann, D. Ratings of Everyday Executive Functioning (REEF): A parent-report measure of preschoolers’ executive functioning skills. Psychol. Assess. 2017, 29, 50–64. [Google Scholar] [CrossRef]
- Kao, K.; Nayak, S.; Doan, S.N.; Tarullo, A.R. Relations between parent EF and child EF: The role of socioeconomic status and parenting on executive functioning in early childhood. Transl. Issues Psychol. Sci. 2018, 4, 122–137. [Google Scholar] [CrossRef]
- Ardila, A.; Rosselli, M.; Matute, E.; Guajardo, S. The influence of the parents’ educational level on the development of executive functions. Dev. Neuropsychol. 2005, 28, 539–560. [Google Scholar] [CrossRef]
- Roth, R.M.; Gioia, G.A. Behavior Rating Inventory of Executive Function—Adult Version; Psychological Assessment Resources, Inc.: Lutz, FL, USA, 2005. [Google Scholar]
- Jager, K.J.; Zoccali, C.; MacLeod, A.; Dekker, F.W. Confounding: What it is and how to deal with it. Kidney Int. 2008, 73, 256–260. [Google Scholar] [CrossRef] [PubMed] [Green Version]
- Blaine, B. Winsorizing. In The SAGE Encyclopedia of Educational Research, Measurement, and Evaluation; SAGE Publications Inc.: Thousand Oaks, CA, USA, 2018. [Google Scholar]
- Fritz, M.S.; MacKinnon, D.P. Required sample size to detect the mediated effect. Psychol. Sci. 2007, 18, 233–239. [Google Scholar] [CrossRef] [PubMed] [Green Version]
- Tabachnick, B.G.; Fidell, L.S. Structural Equation Modeling. In Using Multivariate Statistics; Pearson Education Limited: London, UK, 2014; pp. 731–836. [Google Scholar]
- Cerny, B.A.; Kaiser, H.F. A study of a measure of sampling adequacy for factor-analytic correlation matrices. Multivar. Behav. Res. 1977, 12, 43–47. [Google Scholar] [CrossRef]
- Bartlett, M.S. The Effect of Standardization on a chi square Approximation in Factor Analysis. Biometrika 1951, 38, 337–344. [Google Scholar]
- Rosseel, Y. Lavaan: An R package for structural equation modeling. J. Stat. Softw. 2012, 48, 1–36. [Google Scholar] [CrossRef] [Green Version]
- Gunzler, D.; Chen, T.; Wu, P.; Zhang, H. Introduction to mediation analysis with structural equation modeling. Shanghai Arch. Psychiatry 2013, 25, 390. [Google Scholar] [CrossRef] [PubMed]
- Feng, Q.; Song, Q.; Zhang, L.; Zheng, S.; Pan, J. Integration of Moderation and Mediation in a Latent Variable Framework: A Comparison of Estimation Approaches for the Second-Stage Moderated Mediation Model. Front. Psychol. 2020, 11, 2167. [Google Scholar] [CrossRef] [PubMed]
- Del-Ponte, B.; Quinte, G.C.; Cruz, S.; Grellert, M.; Santos, I.S. Dietary patterns and attention deficit/hyperactivity disorder (ADHD): A systematic review and meta-analysis. J. Affect. Disord. 2019, 252, 160–173. [Google Scholar] [CrossRef]
- Thursby, E.; Juge, N. Introduction to the human gut microbiota. Biochem. J. 2017, 474, 1823–1836. [Google Scholar] [CrossRef]
- Szopinska-Tokov, J.; Dam, S.; Naaijen, J.; Konstanti, P.; Rommelse, N.; Belzer, C.; Buitelaar, J.; Franke, B.; Aarts, E.; Vasquez, A.A. Investigating the gut microbiota composition of individuals with attention-deficit/hyperactivity disorder and association with symptoms. Microorganisms 2020, 8, 406. [Google Scholar] [CrossRef] [Green Version]
- Bull-Larsen, S.; Hasan Mohajeri, M. The potential influence of the bacterial microbiome on the development and progression of adhd. Nutrients 2019, 11, 2805. [Google Scholar] [CrossRef] [Green Version]
- Stewart, C.J.; Ajami, N.J.; O’Brien, J.L.; Hutchinson, D.S.; Smith, D.P.; Wong, M.C.; Ross, M.C.; Lloyd, R.E.; Doddapaneni, H.; Metcalf, G.A.; et al. Temporal development of the gut microbiome in early childhood from the TEDDY study. Nature 2018, 562, 583–588. [Google Scholar] [CrossRef] [PubMed]
- Oriach, C.S.; Robertson, R.C.; Stanton, C.; Cryan, J.F.; Dinan, T.G. Food for thought: The role of nutrition in the microbiota-gut-brain axis. Clin. Nutr. Exp. 2016, 6, 25–38. [Google Scholar] [CrossRef] [Green Version]
- Wu, X.Y.; Zhuang, L.H.; Li, W.; Guo, H.W.; Zhang, J.H.; Zhao, Y.K.; Hu, J.W.; Gao, Q.Q.; Luo, S.; Ohinmaa, A.; et al. The influence of diet quality and dietary behavior on health-related quality of life in the general population of children and adolescents: A systematic review and meta-analysis. Qual. Life Res. 2019, 28, 1989–2015. [Google Scholar] [CrossRef] [PubMed]
- Carlson, S.M.; Wang, T.S. Inhibitory control and emotion regulation in preschool children. Cogn. Dev. 2007, 22, 489–510. [Google Scholar] [CrossRef]
- Friedman, N.P.; Miyake, A. The Relations Among Inhibition and Interference Control Functions: A Latent-Variable Analysis. J. Exp. Psychol. Gen. 2004, 133, 101–135. [Google Scholar] [CrossRef] [Green Version]
- Thompson, F.E.; Subar, A.F. Dietary assessment methodology. In Nutrition in the Prevention and Treatment of Disease; Elsevier: Amsterdam, The Netherlands, 2017; pp. 5–48. ISBN 9780128029282. [Google Scholar]


| Food Group | Cut-off Level |
|---|---|
| Vegetables | ≥100 g/d |
| Fruit | ≥150 g/d |
| Bread and cereals | ≥70 g/d |
| Rice, pasta, potatoes, and legumes | ≥70 g/d |
| Dairy | ≥350 g/d |
| Meat, eggs and meat substitutes | ≥35 g/d |
| Fish | ≥15 g/d |
| Oils and fats | ≥25 g/d |
| Candy and snacks | ≤20 g/d |
| Sugar-sweetened beverages | ≤100 g/d |
| Mean ± SD | Range | n | ||
|---|---|---|---|---|
| Maternal characteristics | ||||
| Age (years) | 34.4 ± 3.7 | 28–44 | 67 | |
| Educational level | 65 | |||
| Low | 0% | |||
| Middle | 13.8% | |||
| High | 86.2% | |||
| Partner characteristics | ||||
| Gender | 51 | |||
| Male | 96.1% | |||
| Female | 3.9% | |||
| Age (years) | 35.8 ± 4.1 | 28–50 | 51 | |
| Educational level a | 48 | |||
| Low | 4.2% | |||
| Middle | 16.6% | |||
| High | 79.2% | |||
| Child characteristics | ||||
| Sex | 67 | |||
| Boy | 47.8% | |||
| Girl | 52.2% | |||
| Child birthweight (grams) | 3531.8 ± 420.0 | 2570–4445 | 63 | |
| Child gestational age (weeks) | 39.8 ± 1.6 | 35.6–42.1 | 67 | |
| Child age (months) | 37.7 ± 1.2 | 36–47 | 67 | |
| Study variables | ||||
| Breastfeeding | ||||
| Exclusive breastfeeding duration (months) | 3.5 ± 1.9 | 67 | ||
| Breastfeeding cessation age (months) | 9.5 ± 8.0 | 67 | ||
| Diet quality | 3.9 ± 1.1 | |||
| Behavioral tests | ||||
| Flanker | 1.2 ± 0.7 | 49 | ||
| Whisper | 1.8 ± 0.3 | 63 | ||
| Gift Wrap | 2.1 ± 0.9 | 62 | ||
| Gift Delay (seconds) | 77.9 ± 27.5 | 63 | ||
| Questionnaires | Mother | Partner | n (mother) | n (partner) |
| BRIEF-P inhibitory control scale | 23.1 ± 5.8 | 22.8 ± 4.6 *** | 67 | 52 |
| BRIEF-P | 94.6 ± 15.6 | 92.4 ± 18.0 *** | 67 | 52 |
| REEF | 147.8 ± 33.1 | 146.6 ± 28.8 *** | 66 | 51 |
| Exclusive BF Duration | Age of BF Cessation | Diet Quality Score | Flanker | Whisper | Gift Wrap | Gift Delay | BRIEF-P inh-M | BRIEF-P inh-P | |
|---|---|---|---|---|---|---|---|---|---|
| Exclusive BF duration | - | ||||||||
| Age of BF cessation | 0.638 ** | - | |||||||
| Diet quality score | 0.321 ** | 0.117 | - | ||||||
| Flanker | 0.161 | 0.341 * | −0.105 | - | |||||
| Whisper | −0.117 | −0.107 | 0.063 | −0.069 | - | ||||
| Gift wrap | −0.137 | 0.029 | 0.177 | 0.134 | −0.117 | - | |||
| Gift Delay | 0.123 | 0.212 | −0.036 | 0.137 | 0.135 | 0.211 | - | ||
| BRIEF-P inh-M | 0.115 | 0.139 | 0.056 | −0.065 | 0.250 * | 0.052 | 0.152 | - | |
| BRIEF-P inh-P | 0.219 | 0.078 | 0.196 | 0.033 | 0.051 | −0.081 | −0.012 | 0.415 ** | - |
| B | SE | Lower CI | Upper CI | |
|---|---|---|---|---|
| Regression Paths | Model 1: Exclusive breastfeeding duration → Diet quality score → Observed inhibitory control | |||
| Observed inhibitory control (composite) | ||||
| Exclusive breastfeeding duration | −0.016 | 0.035 | −0.085 | 0.052 |
| Diet quality score | 0.065 | 0.066 | −0.063 | 0.194 |
| Parental executive functioning | −0.009 | 0.004 | −0.017 | 0.000 |
| Diet quality score | ||||
| Exclusive breastfeeding duration | 0.173 * | 0.070 | 0.035 | 0.311 |
| Mediation effect | 0.011 | 0.012 | −0.013 | 0.035 |
| Total effect | −0.013 | 0.033 | −0.078 | 0.051 |
| Regression Paths | Model 2: Breastfeeding cessation age → Diet quality score → Observed inhibitory control | |||
| Observed inhibitory control (composite) | ||||
| Breastfeeding cessation age | 0.008 | 0.011 | −0.013 | 0.029 |
| Diet quality score | 0.024 | 0.057 | −0.088 | 0.136 |
| Parental executive functioning | −0.009 * | 0.004 | −0.017 | −0.001 |
| Maternal education | 0.089 | 0.048 | −0.004 | 0.182 |
| Diet quality score | ||||
| Breastfeeding cessation age | 0.024 | 0.016 | −0.008 | 0.055 |
| Mediation effect | 0.001 | 0.001 | −0.002 | 0.003 |
| Total effect | 0.088 | 0.047 | −0.003 | 0.180 |
| Regression Paths | Model 3: Exclusive breastfeeding duration → Diet quality score → Reported inhibitory control | |||
| Reported inhibitory control | ||||
| Exclusive breastfeeding duration | 0.296 | 0.339 | −0.368 | 0.961 |
| Diet quality score | −0.167 | 0.469 | −1.086 | 0.751 |
| Parental executive functioning | 0.086 ** | 0.030 | 0.028 | 0.144 |
| Diet quality score | ||||
| Exclusive breastfeeding duration | 0.172 * | 0.070 | 0.035 | 0.310 |
| Mediation effect | −0.029 | 0.0832 | −0.190 | 0.132 |
| Total effect | 0.354 | 0.309 | −0.252 | 0.959 |
| Regression Paths | Model 4: Breastfeeding cessation age → Diet quality score → Reported inhibitory control | |||
| Reported inhibitory control | ||||
| Breastfeeding cessation age | 0.114 | 0.070 | −0.024 | 0.252 |
| Diet quality score | −0.125 | 0.443 | −0.992 | 0.743 |
| Parental executive functioning | 0.091 ** | 0.029 | 0.034 | 0.148 |
| Maternal educational level | −0.052 | 0.389 | −0.815 | 0.711 |
| Diet quality score | ||||
| Breastfeeding cessation age | 0.024 | 0.016 | −0.008 | 0.055 |
| Mediation | −0.003 | 0.011 | −0.025 | 0.019 |
| Total model | 0.150 | 0.369 | −0.573 | 0.873 |
Publisher’s Note: MDPI stays neutral with regard to jurisdictional claims in published maps and institutional affiliations. |
© 2021 by the authors. Licensee MDPI, Basel, Switzerland. This article is an open access article distributed under the terms and conditions of the Creative Commons Attribution (CC BY) license (https://creativecommons.org/licenses/by/4.0/).
Share and Cite
Willemsen, Y.; Beijers, R.; Arias Vasquez, A.; de Weerth, C. Do Breastfeeding History and Diet Quality Predict Inhibitory Control at Preschool Age? Nutrients 2021, 13, 2752. https://doi.org/10.3390/nu13082752
Willemsen Y, Beijers R, Arias Vasquez A, de Weerth C. Do Breastfeeding History and Diet Quality Predict Inhibitory Control at Preschool Age? Nutrients. 2021; 13(8):2752. https://doi.org/10.3390/nu13082752
Chicago/Turabian StyleWillemsen, Yvonne, Roseriet Beijers, Alejandro Arias Vasquez, and Carolina de Weerth. 2021. "Do Breastfeeding History and Diet Quality Predict Inhibitory Control at Preschool Age?" Nutrients 13, no. 8: 2752. https://doi.org/10.3390/nu13082752
APA StyleWillemsen, Y., Beijers, R., Arias Vasquez, A., & de Weerth, C. (2021). Do Breastfeeding History and Diet Quality Predict Inhibitory Control at Preschool Age? Nutrients, 13(8), 2752. https://doi.org/10.3390/nu13082752