
The Impact of Environmental Sustainability Labels on Willingness-to-Pay for Foods: A Systematic Review and Meta-Analysis of Discrete Choice Experiments

Abstract
:1. Introduction
2. Materials and Methods
2.1. Eligibility Criteria and Search Strategy
2.2. Data Extraction and Quality Assessment
2.3. Data Analysis
3. Results
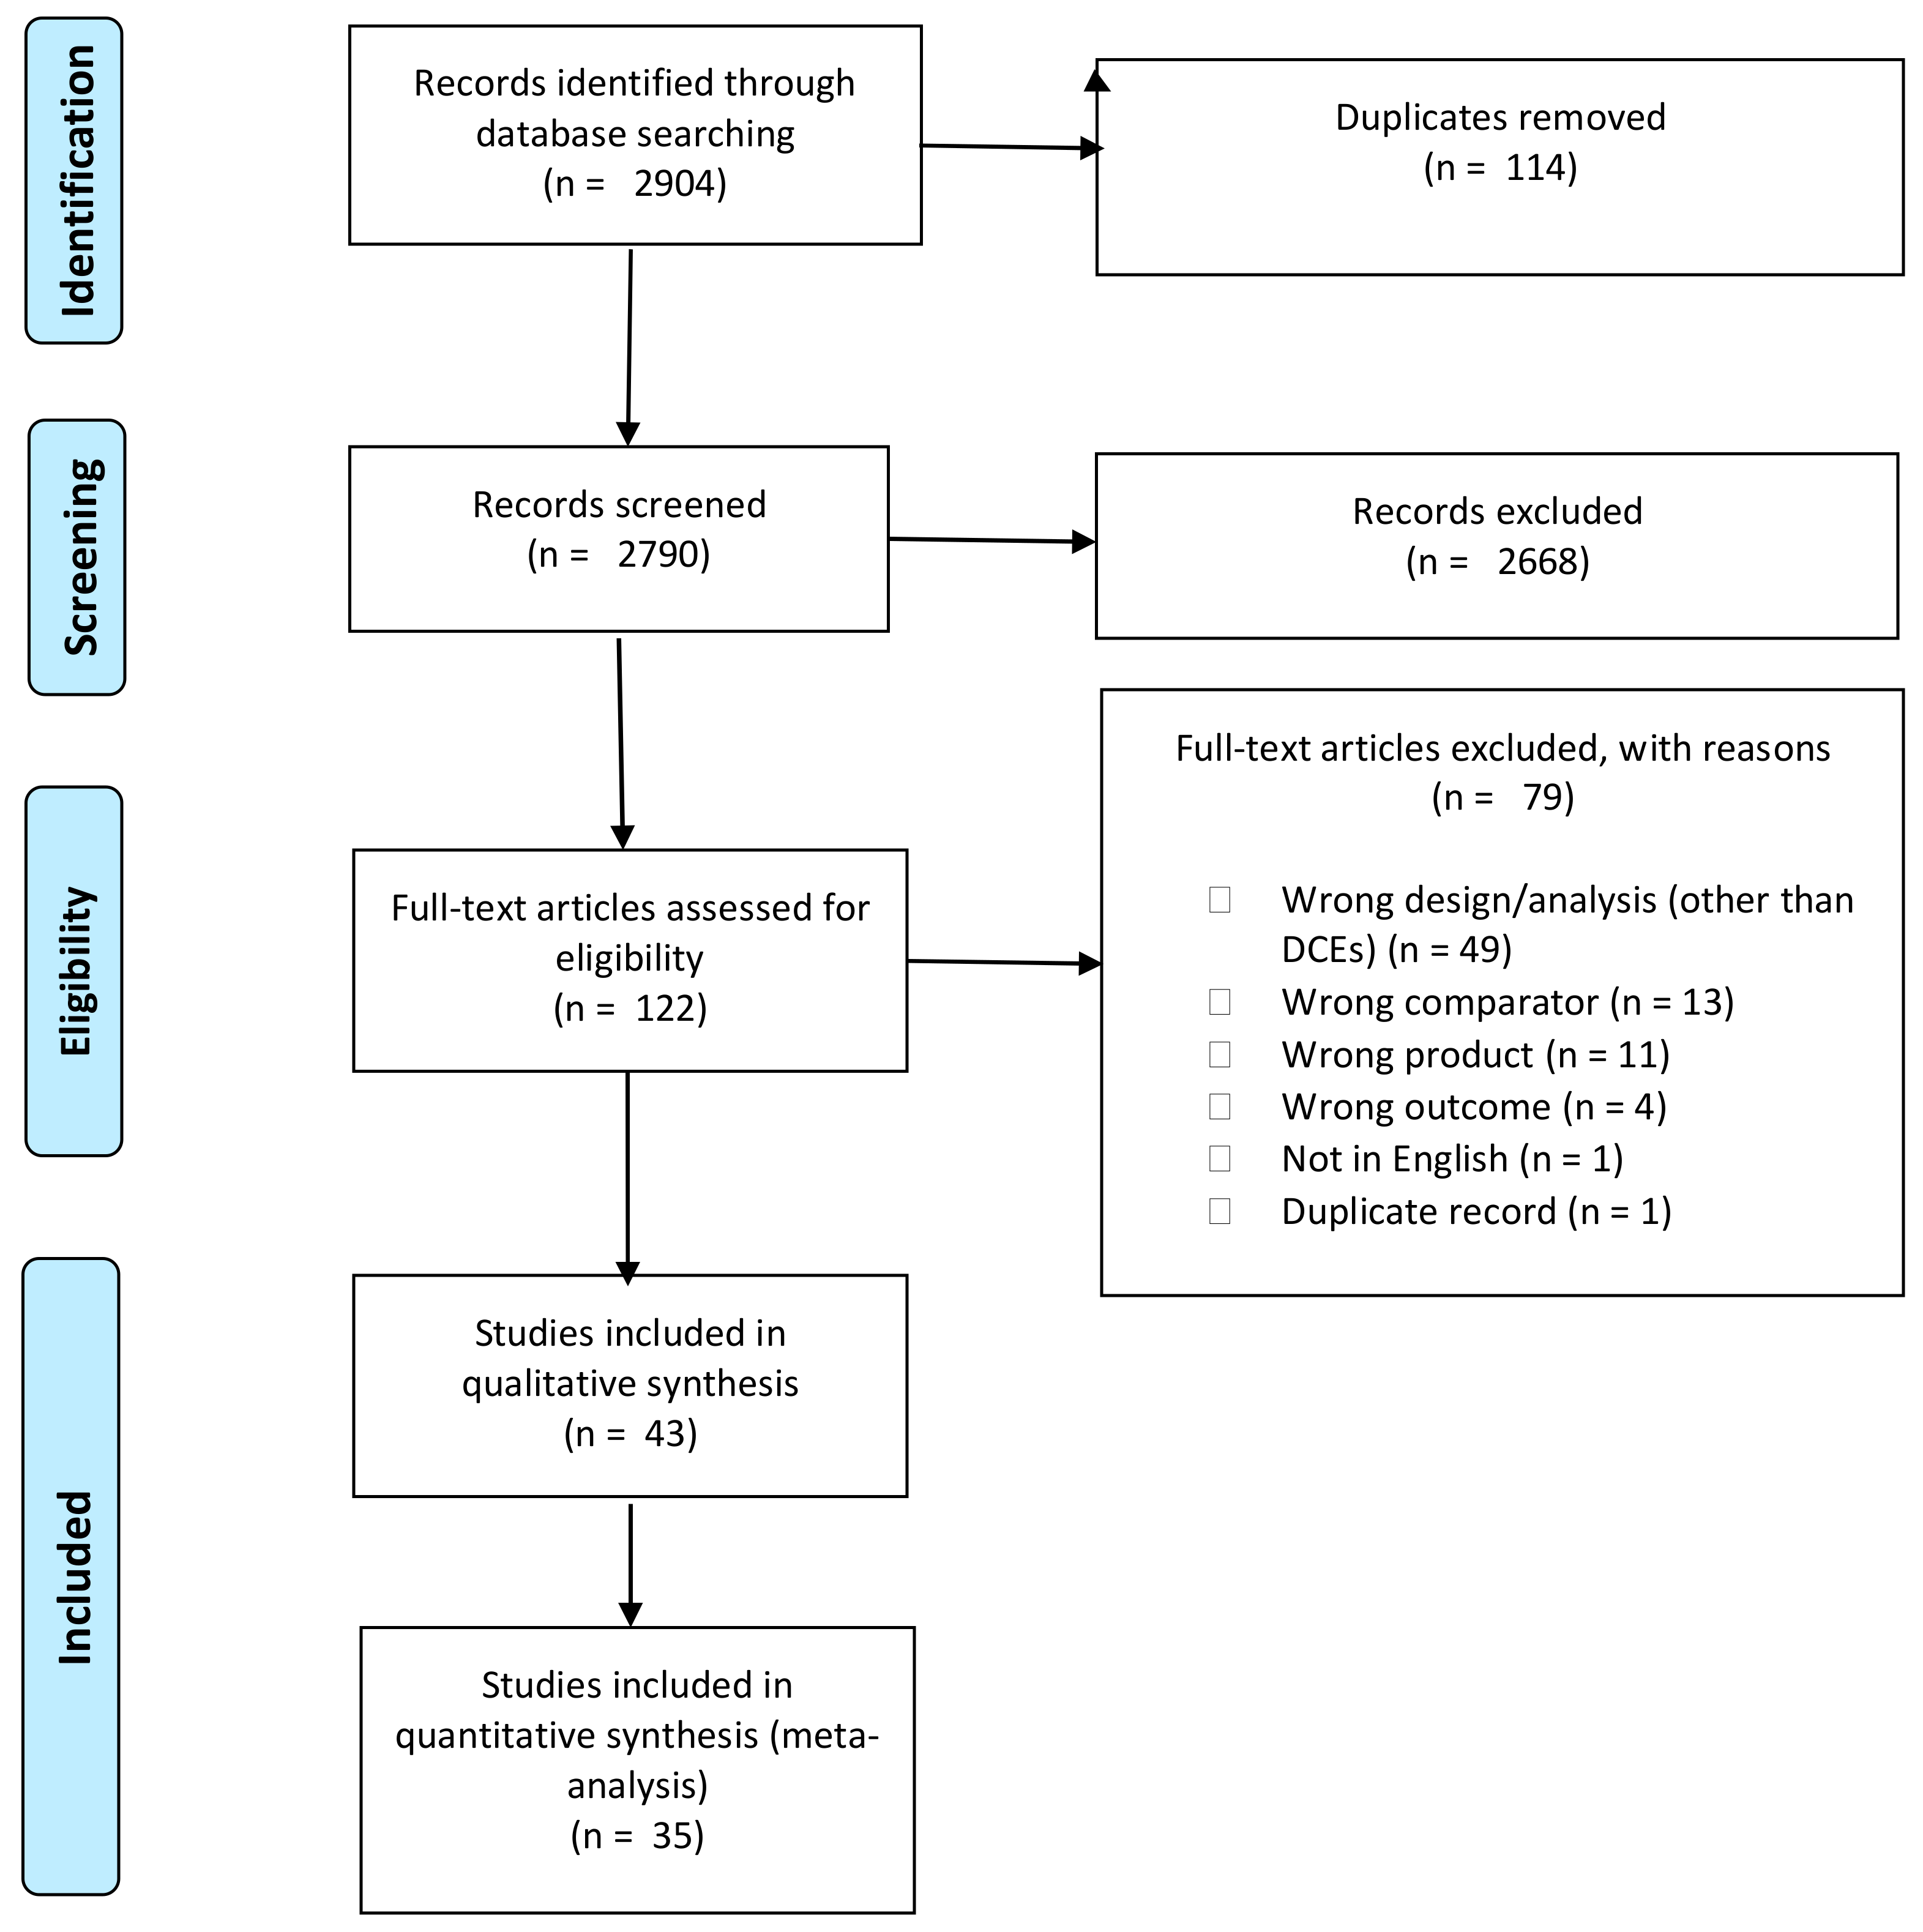
3.1. Description of Studies
3.2. Characteristics of Studies Included in the Meta-Analysis
3.3. Quality Assessment
3.4. Meta-Analysis
3.5. Meta-Regression
3.6. Studies Excluded from the Quantitative Synthesis
4. Discussion
4.1. Limitations
4.2. Conclusions
Author Contributions
Funding
Institutional Review Board Statement
Informed Consent Statement
Data Availability Statement
Conflicts of Interest
Appendix A

| Study ID | Country | N | Setting (O or I) | Product | Message Type | Certification Label | Format (T or L) | Age (% < 35–40) | Gender (%F) | Income (% below National Average) | Education (% Tertiary) | Price Premium Estimates (Currency/Unit of Measurement) |
|---|---|---|---|---|---|---|---|---|---|---|---|---|
| Aizaki, 2013 [38] | Japan | 624 | O | Milk | Sustainable | P (GAP) | T | 47.8 | 72.4 | NR | NR | “Simple explanation” condition (JP¥/l): 16.2; 17.6; 13.1; 12.7 “Detailed explanation” (JP¥/l): 34.7; 19.6; 13.8; 9.7 |
| Akaichi, 2016 [39] | Scotland, France, Netherlands | S: 100, F: 95, N: 52 | I | Bananas | Organic; CO2 | P (Organic—Soil Association) | Both | S: 28; N: 25; F: 46 | S: 73; N: 75; F: 65 | S: 39; N: 38; F: 38 | S: 83; N: 75; F: 83 | Organic (€/banana): S: 0.08; N: 0.09; F: 0.13; CO2 (€/banana): S: 0.09; N: 0.12; F: 0.12 |
| Anakamah-Yeboa, 2018 [40] | Germany | 610 | O | Trout | Organic; sustainable | P (Organic—EU); P (Sustainable—ASC) | Both | 33.61 | 60.33 | 34.59 | 28.2 | Organic: 4.54 €/kg Sustainable: 10.03 €/kg |
| Banovic, 2019 [41] | France, Germany, Italy, Spain, UK | F: 314; G: 318; I: 337; S: 313; UK: 316 | O | Aquaculture product (fresh/chilled, smoked, canned) | Sustainable | P (Sustainable—ASC) | L | F: 49.7; G: 49.1; I: 50.1; S: 50.2; UK: 49.7 | F: 50; G: 50.3; I: 48.1; S: 49.2; UK: 50.3 | F: 20.7; G: 23.3; I: 22.3; S: 15.7; UK: 21.5 | F: 49.4; G: 44.3; I: 43; S: 55; UK: 48.4 | Fresh/chilled (€/300 g.): F: 0.27; G: 0.8. I: 0.44. S: 0.3; UK: 0.30 Smoked (€/300 g.): F: 0.16; G: 0.39; I: 0.16; S: 0.25; UK: 0.37 Canned (€/300 g.): F: 0.25; G: 0.71; I: 0.16; S: 0.48; UK: 0.43 |
| Bienenfeld, 2014 [42] | USA | 2382 | O | Cereal | Organic; Sustainable; Mixed | P (Organic-USDA) | Both | NR | NR | 24 | 38.6 | Organic ($/package): 2.76; 2.23; 2.06; 1.56; 2.53; 1.76 Sustainable ($/package): 1.74; 1.55 Mixed ($/package): 2.15; 2.51; 2.03; 2.08; 1.56; 1.59; 1.5; 1.72 |
| Bronnmann, 2018 [15] (additional data was extracted from Bronnmann et al., 2017) | Germany | 485 | I | Fresh/frozen Turbot fillet Fresh/frozen Salmon fillet | Sustainable | P (MSC; ASC) | L | 39 | 58 | 30 | 62 | Product: Turbot Uninformed consumers (€/250 g.): ASC: 0.68; MSC: 4.99 Informed consumers (€/250 g.): ASC: −4.02, MSC: 8.38 Product: Salmon Uninformed consumers (€/250 g.): ASC: 3.71; MSC: 2.74 Informed consumers (€/250 g.): ASC: 4.6, MSC: 4.29 |
| Caputo, 2018 [43] | Belgium | 257 | O | Chicken breast | Organic; Sustainable (20% reduction CO2; 30% reduction CO2) | P (Organic-EU; local private) | T (CO2); L (organic) | 39 | 63 | 11 | 33 | Organic—EU (€/kg): 9.63 Organic—local private (€/kg): 7.82 20% reduction (€/kg): 1.16 30% reduction (€/kg): 3.66 |
| Carlucci, 2017 [44] | Italy | 800 | O | Oysters | Organic | A | T | NR | 55.4 | 32.5 | 30.4 | 12.84 (€/half dozen) |
| Chen, 2015 [45] | France | 194 | I | Cod, salmon, monkfish, pangasius | Organic; sustainable | P (Organic-AB); P (sustainable-MSC) | L | NR | NR | NR | NR | AB: 1.84 €/kg MSC: 0.80 €/kg |
| De-Magistris, 2016 [16] | Spain | 171 | I | Almonds | Organic | P (EU) | Both | 26.4 | 51.9 | 28 | 37.3 | Consumers segments (€/100 g.): Segment 1: 0.27 Segment 2: 0.85 Segment 3: 1.22 |
| Fernandez-Polanco, 2013 [17] | Spain | 196 | I | Seabream | Sustainable | A | T | NR | 78 | NR | NR | Consumers segment (€/kg): 4.98 Retailers segment (€/kg): 3.04 |
| Fonner, 2015 [46] | USA | 378 | I | Salmon; crab | Sustainable | A | T | NR | 59 | 13 | 73 | Crab ($/lb): 1.88 Salmon ($/lb): 3.23 |
| Gerrard, 2013 [18] | UK | 410 | I | Apples; eggs | Organic | P (EU, Soil Association logo, OF&G logo) | L | NR | 70 | NR | NR | Apples (£/NR) EU logo: 0.24 Soil Association logo: 1.01 OF&G logo: 1.08 Eggs (£/) EU logo: NR Soil Association logo: 0.98 OF&G logo: 1.12 |
| Grebitus, 2016 [19] | Canada & Germany | C: 1551; G: 1579 | O | Ground beef; yogurt; potatoes | Sustainable (CO2 impact; water usage) | A | T | NR | 52 | NR | 30 | Ground beef (Canadian$/kg) Canada: −0.11 (CO2) Canada: −0.22 (water footprint) Germany: −0.23 (CO2) Germany: −0.52 (water footprint) Potatoes (Canadian$/kg) Canada: −0.46 (CO2) Canada: −3.8 (water footprint) Germany: −1.45 (CO2) Germany: −7.79 (water footprint) Yogurt (Canadian$/750 g.) Canada: −0.66 (CO2) Canada: −1.08 (water footprint) Germany: −0.73 (CO2) Germany: −2.06 (water footprint) |
| Hearne, 2002 [30] | Costa Rica | 432 | I | Vegetables | Sustainable; Organic | P (local labels) | L | NR | 78 | NR | 65 | Sustainability: +19.8% Organic: +38.8% |
| Heng, 2016 [47] | USA | 589 | O | Eggs | Organic | P (USDA) | T | NR | 58 | 11.84 | 43 | 0.39$/dozen |
| James, 2009 [48] | USA | 1476 | I | Applesauce | Organic | P (USDA) | L | 25 | 47 | NR | 33 | Consumer segments ($/24-ounce) −0.01; −0.1; 0.31; 0.28 |
| Khai, 2015 [49] | Vietnam | 818 | I | Rice | Sustainable; Organic | A | T | NR | 52 | 3 | NR | Organic: 6511.789 VND/kg Sustainable: 3030.355 VND/kg |
| Lim, 2018 [50] | USA | 1032 | O | Canned tuna | Sustainable | P (MSC) | L | NR | 75 | NR | 39 | Segments ($/can) 0.43, 0.49, 0.7, 1.13 |
| Mamouni Limnios, 2016 [51] | Australia | 121 | O | Apples | Sustainable; Organic | A | T | NR | 77 | 8.26 | 78.52 | Consumer segments ($/kg) Organic purchasers: 0.016; −0.15; 3.47 Non-organic purchasers: −0.013; 0.57; 0.96; −0.08 |
| Liu, 2017 [52] | China | 435 | I | Rice | Organic; Sustainable | P (local labels) | Both | 41.61 | 63.22 | 69.43 | NR | Organic (RMB¥/500 g): 2.96 Sustainable: (RMB¥/500 g): 2.35 |
| Lombardi, 2017 [20] | Italy | 39 | I | Milk | Organic; Sustainable (reduction CO2) | P (Organic – EU) | Both | NR | 60 | NR | NR | Organic (€/l): 0.57 Sustainable (€/l): 0.56 |
| Mondelaers, 2009 [18] | Belgium | 529 | I | Carrots | Organic; Sustainable (reduction in residues) | A | T (Organic); Both (Sustainable) | NR | NR | NR | 59.9 | Organic (€/kg): 0.54 Sustainable (€/kg): 0.125 |
| Olesen, 2010 [53] | Norway | 115 | I | Salmon | Organic | A | L | NR | 58 | NR | NR | 18.89NOK/kg |
| Risius, 2017 [54] | Germany | 676 | I | Beef | Organic | P (EU) | Both | 5 | 68 | NR | NR | Consumer segments according to intervention conditions (€/200 g.) 3.18; 8.16 |
| Rousseau, 2015 [55] | Belgium | 601 | O | Chocolate | Organic | P (EU) | L | 71.3 | 58.7 | NR | NR | −0.37 (€/100 g.) |
| Rousseau, 2013 [56] | Belgium | 226 | O | Apples | Organic | A | T | NR | 62 | 14 | 78 | 0.57 (€/kg) |
| Sackett, 2016 [22] | USA | 1002 | O | Apples; steaks | Organic; Sustainable | P (Organic –USDA); P (sustainability – Private third party) | T | NR | 49 (apples); 52 (steaks) | 20.8 (apples); 19.1 (steaks) | 55.8 (apples); 33 (steaks) | Organic (USDA)—apple survey ($/lb): 0.05 Sustainable (private)—apple survey ($/lb): 0.13 Organic (USDA)—steak survey ($/lb): 0.61 Sustainable (private)—steak survey ($/lb): 0.9 |
| Sakagami, 2006 [57] | Japan | 698 | I | Spinach | Organic | P (government and private labels) | Both | 22.6 | 82 | NR | NR | Government labels (JP¥/NR): 22; 28.7 Private label (JP¥/NR): 19.1 |
| Tait, 2016 [31] | Japan; UK | 3624 (Japan); 3540 (UK) | O | Fruits | Sustainable (different levels of CO2 emissions reduction; different levels of water efficiency) | A | T; Both | NR | NR | NR | NR | Interventions’ segments by country (increase in %) Carbon—text-only—UK: 39 Carbon—text plus graphic—UK: 35 Carbon—compass—UK: 29 Water—text-only—UK: 17 Water—text-plus graphic—UK: 21 Water—compass—UK: 15 Carbon—text-only—Japan: 35 Carbon—text plus graphic—Japan: 23 Carbon—compass—Japan: 21 Water—text-only—Japan: 21 Water—text-plus graphic—Japan: 7 Water—compass—Japan: 7 |
| Tait, 2016 [32] | China; India; UK | C: 686; I: 695; UK: 686 | O | Lamb | Gas emissions; Water management; Biodiversity | P (outlined as “certified agency”) | T | C: 13; I: 22; UK: 29 | C: 44; I: 71; UK: 50 | NR | C: 27; I: 89; UK: 38 | Interventions’ segments by country (increase in %) Water (C): 7 Gas emissions (C): 8 Biodiversity (C): 5 Water (I): 21 Gas emissions (I): 28 Biodiversity (I): 26 Water (UK): 6 Gas emissions (UK): 6 Biodiversity (UK): 4 |
| Uchida, 2014 [58] | Japan | 3,370 | O | Salmon | Sustainable | A | Both | NR | 72 | 36.5 | 44.1 | 89 (JP¥/NR) |
| Van Loo, 2011 [59] | USA | 976 | O | Chicken breast | Organic | P(USDA); A | L; T | 45.9 | 73.05 | 45.29 | 54.05 | Per condition ($/lb) Organic (USDA): 3.54 Organic (no certification): 1.19 |
| Van Osch, 2017 [60] | Ireland | 500 | O | Salmon | Sustainable | A | Both | NR | 56 | 68 | 45 | Intervention segments (€/kg) Sustainable A (−30% environmental pressure): 9.26 Sustainable B (−20% environmental pressure): 3.65 Sustainable C (−10% environmental pressure): 1.72 |
| Wakamatsu, 2017 [61] | Japan | 2378 | O | Cod | Sustainable | P (MEL; MSC) | T | NR | 55 | 25 | 44 | Intervention segments (JP¥/NR) MEL: 56 MSC: 79 |
| Wang, 2018 [62] | China (Anhui & Jiangsu) | 369 (Anhui); 475 (Jiangsu) | I | Pork | Organic | P (governmental certifications: “Green”, “Safe”, “Organic”) | L | 30.89 (Anhui); 29.68 (Jiangsu) | 54.47 (Anhui); 57.26 (Jiangsu) | 13.01 (Anhui); 13.47 (Jiangsu) | 28.46 (Anhui); 32.84 (Jiangsu) | Intervention segments (RMB¥/500 g.) Certification 1 (“Safe food”—Anhui): 7.21 Certification 2 (“Green food”—Anhui): 17.63 Certification 3 (“Organic food”—Anhui): 18.94 Certification 1 (“Safe food”—Jiangsu): 8.1 Certification 2 (“Green food”—Jiangsu): 20.22 Certification 3 (“Organic food”—Jiangsu): 26.78 |
| Witkin, 2015 [63] | USA | 302 | O | Cod, haddock, mackerel, pollock, hake, and dogfish | Sustainable | A | Both | NR | NR | 12 | NR | Interventions’ segments ($/lb) “Best Choice”: 2.09 “Good Alternative”: −2.81 “Avoid”: −13.57 |
| Wu, 2014 [64] | China | 1254 | I | Milk (infant formula) | Organic | P (Chinese label; EU label; US label) | L | 38.04 | 64.04 | 31.02 | 33.01 | Interventions’ segments ($/400 g) Chinese label: 3.23 EU label: 5.36 US label: 10.39 |
| Xie, 2016 [33] | USA | 348 | O | Broccoli | Organic | P (USDA) | T | NR | 50.28 | 16.01 | 45.81 | Intervention segments (groups collapsed according to condition for analysis, $/lb): Treatment 1: 0.097 Treatment 2: 0.272 Treatment 3: 0.299 Treatment 4: 0.223 Control 1: 0.129 Control 2: 0.258 Control 3: 0.536 Control 4: −0.14 |
| Yue, 2015 [65] | China | 181 | I | Milk | Organic | A | T | 61.5 | 54.65 | 55.9 | 80.11 | 0.896 (RMB¥/250 g.) |
| Yin, 2018 [66] | China | 938 | I | Tomatoes | Organic | P (EU; Chinese; Green; GRS-national) | T | NR | 55.65 | 28.89 | 32.52 | Overall price (RMB¥/500 g.) Chinese: 4.23 Chinese: 2.62 Green: 0.75 GRS-national: 0.36 |
| Zanoli, 2012 [67] | Italy | 145 | I | Beef steaks | Organic | A | T | 35.9 | 53.1 | NR | 39.3 | 26.25 (€/kg) |
| Zhou, 2017 [68] | China | 949 | O | Rice | Organic | A | T | NR | 62 | NR | NR | Consumer segments (RMB¥/kg) Green label (Familiar-green group): 6.57 Organic label (Familiar-green group): 10.76 Green label (frugal group): 3.63 Organic label (frugal group): 3.786 |
Appendix B
| Database: Medline | ||
|---|---|---|
| # | Searches | Results |
| 1 | Food Labeling/ | 3170 |
| 2 | (environment * or ecolog$ or sustain$).mp. | 1,397,503 |
| 3 | 1 and 2 | 227 |
| 4 | (ecolabel$ or eco-label$).ti,ab. | 48 |
| 5 | ((environment$ or ecolog$ or eco or sustain$ or green$) adj5 label$).ti,ab. | 2849 |
| 6 | ((carbon footprint or recycl$ or organic$) adj5 label$).ti,ab. | 784 |
| 7 | 3 or 4 or 5 or 6 | 3828 |
| 8 | exp Food Preferences/ | 12,672 |
| 9 | exp Food Habits/ | 153,019 |
| 10 | exp Feeding Behavior/ | 153,019 |
| 11 | exp Eating/ | 67,441 |
| 12 | exp Diet/ | 248,118 |
| 13 | exp Choice Behavior/ | 49,870 |
| 14 | (intak$ or consume or consumes or consumption or consumed or eat$ or diet$).ti,ab. | 885,892 |
| 15 | (food adj5 (preference$ or habit$ or behavio?r$ or choice$ or decision$ or decid$ or inclin$ or lik$ or choos$ or select$ or pick$)).ab,ti. | 24,900 |
| 16 | ((drink? or beverage?) adj5 (preference$ or habit$ or behavio?r$ or choice$ or decision$ or decid$ or inclin$ or lik$ or choos$ or select$ or pick$)).ab,ti. | 2884 |
| 17 | (purchas$ or buy$ or sale$ or vend$ or sell$).ab,ti. | 70,255 |
| 18 | Consumer Behavior/ | 19,653 |
| 19 | ((willing$ or motivat$ or happy) adj5 (pay$ or spend$)).ti,ab. | 5328 |
| 20 | 8 or 9 or 10 or 11 or 12 or 13 or 14 or 15 or 16 or 17 or 18 or 19 | 1,190,096 |
| 21 | 7 and 20 | 364 |
| Database: Embase | ||
| # | Searches | Results |
| 1 | (ecolabel$ or eco-label$).ti,ab. | 89 |
| 2 | ((environment$ or ecolog$ or eco or sustain$ or green$) adj5 label$).ti,ab. | 3667 |
| 3 | ((carbon footprint or recycl$ or organic$) adj5 label$).ti,ab. | 882 |
| 4 | 1 or 2 or 3 | 4562 |
| 5 | Food Preference/ | 12,267 |
| 6 | Eating Habit/ | 10,387 |
| 7 | Feeding Behavior/ | 78,533 |
| 8 | exp Eating/ | 30,962 |
| 9 | exp Diet/ | 291,721 |
| 10 | (intak$ or consume or consumes or consumption or consumed or eat$ or diet$).ti,ab. | 1,134,198 |
| 11 | (food adj5 (preference$ or habit$ or behavio?r$ or choice$ or decision$ or decid$ or inclin$ or lik$ or choos$ or select$ or pick$)).ab,ti. | 31,314 |
| 12 | ((drink? or beverage?) adj5 (preference$ or habit$ or behavio?r$ or choice$ or decision$ or decid$ or inclin$ or lik$ or choos$ or select$ or pick$)).ab,ti. | 3870 |
| 13 | (purchas$ or buy$ or sale$ or vend$ or sell$).ab,ti. | 92,262 |
| 14 | Consumer Attitude/ | 3532 |
| 15 | ((willing$ or motivat$ or happy) adj5 (pay$ or spend$)).ti,ab. | 8106 |
| 16 | 5 or 6 or 7 or 8 or 9 or 10 or 11 or 12 or 13 or 14 or 15 | 1,337,184 |
| 17 | 4 and 16 | 295 |
| Database: PsycINFO | ||
| # | Searches | Results |
| 1 | (ecolabel$ or eco-label$).ti,ab. | 59 |
| 2 | ((environment$ or ecolog$ or eco or sustain$ or green$) adj5 label$).ti,ab. | 445 |
| 3 | ((carbon footprint or recycl$ or organic$) adj5 label$).ti,ab. | 77 |
| 4 | 1 or 2 or 3 | 521 |
| 5 | Food Preferences/ | 4202 |
| 6 | Eating attitudes/ | 1511 |
| 7 | Feeding Behavior/ | 8868 |
| 8 | exp Eating/ | 18,195 |
| 9 | Diets/ | 11,471 |
| 10 | choice behavior/ | 16,781 |
| 11 | (intak$ or consume or consumes or consumption or consumed or eat$ or diet$).ti,ab. | 148,647 |
| 12 | (food adj5 (preference$ or habit$ or behavio?r$ or choice$ or decision$ or decid$ or inclin$ or lik$ or choos$ or select$ or pick$)).ab,ti. | 12,186 |
| 13 | ((drink? or beverage?) adj5 (preference$ or habit$ or behavio?r$ or choice$ or decision$ or decid$ or inclin$ or lik$ or choos$ or select$ or pick$)).ab,ti. | 1766 |
| 14 | (purchas$ or buy$ or sale$ or vend$ or sell$).ab,ti. | 37,255 |
| 15 | Consumer behavior/ | 25,781 |
| 16 | ((willing$ or motivat$ or happy) adj5 (pay$ or spend$)).ti,ab. | 2536 |
| 17 | 5 or 6 or 7 or 8 or 9 or 10 or 11 or 12 or 13 or 14 or 15 or 16 | 225,560 |
| 18 | 4 and 17 | 183 |
| Database: CAB Abstracts | ||
| # | Searches | Results |
| 1 | (sustainability and labelling).sh. | 246 |
| 2 | (environmental protection and labelling).sh. | 93 |
| 3 | (ecolabel * or eco-label *).ti,ab. | 599 |
| 4 | ((environment * or ecolog * or sustain* or green *) adj5 label*).ti,ab. | 1304 |
| 5 | ((carbon footprint or recycl * or organic *) adj5 label*).ti,ab. | 1041 |
| 6 | 1 or 2 or 3 or 4 or 5 | 2876 |
| 7 | food consumption/ | 22,812 |
| 8 | exp eating patterns/ | 5482 |
| 9 | (intak$ or consume or consumes or consumption or consumed or eat$ or diet$).ti,ab. | 791,616 |
| 10 | (food adj5 (preference$ or habit$ or behavio?r$ or choice$ or decision$ or decid$ or inclin$ or lik$ or choos$ or select$ or pick$)).ab,ti. | 33,288 |
| 11 | ((drink? or beverage?) adj5 (preference$ or habit$ or behavio?r$ or choice$ or decision$ or decid$ or inclin$ or lik$ or choos$ or select$ or pick$)).ab,ti. | 2075 |
| 12 | (purchas$ or buy$ or sale$ or vend$ or sell$).ab,ti. | 94,220 |
| 13 | ((willing$ or motivat$ or happy) adj5 (pay$ or spend$)).ti,ab. | 6331 |
| 14 | (consumer attitudes or consumer behaviour or consumer preferences).sh. | 27,696 |
| 15 | 7 or 8 or 9 or 10 or 11 or 12 or 13 or 14 | 901,400 |
| 16 | 6 and 15 | 831 |
References
- Willett, W.; Rockström, J.; Loken, B.; Springmann, M.; Lang, T.; Vermeulen, S.; Jonell, M. Food in the Anthropocene: The EAT–Lancet Commission on healthy diets from sustainable food systems. Lancet 2019, 393, 447–492. [Google Scholar] [CrossRef]
- United Nations. Transforming Our World: The 2030 Agenda for Sustainable Development. 2015. Available online: http://www.un.org/ga/search/view_doc.asp?symbol=A/RES/70/1&Lang=E (accessed on 27 July 2020).
- Eyhorn, F.; Muller, A.; Reganold, J.P.; Frison, E.; Herren, H.R.; Luttikholt, L.; Smith, P. Sustainability in global agriculture driven by organic farming. Nat. Sustain. 2019, 2, 253–255. [Google Scholar] [CrossRef] [Green Version]
- Editorial: Food audit. Counting the hidden US$12-trillion cost of our dismal handling of global food resources. Nature 2019, 574, 296. [CrossRef]
- Victor, V.; Joy Thoppan, J.; Jeyakumar Nathan, R.; Farkas Maria, F. Factors influencing consumer behavior and prospective purchase decisions in a dynamic pricing environment—An exploratory factor analysis approach. Soc. Sci. 2018, 7, 153. [Google Scholar] [CrossRef] [Green Version]
- Chong, F.S.; Farmer, L.J.; Hagan, T.D.J.; Speers, J.S.; Sanderson, D.W.; Devlin, D.J.; Kerry, J.P. Regional, socioeconomic and behavioural-impacts on consumer acceptability of beef in Northern Ireland, Republic of Ireland and Great Britain. Meat Sci. 2019, 154, 86–95. [Google Scholar] [CrossRef]
- Hartmann-Boyce, J.; Bianchi, F.; Piernas, C.; Riches, S.P.; Frie, K.; Nourse, R.; Jebb, S.A. Grocery store interventions to change food purchasing behaviors: A systematic review of randomized controlled trials. Am. J. Clin. Nutr. 2018, 107, 1004–1016. [Google Scholar] [CrossRef] [PubMed]
- Thøgersen, J.; Haugaard, P.; Olesen, A. Consumer responses to ecolabels. Eur. J. Mark. 2010, 44, 1787–1810. [Google Scholar] [CrossRef]
- Printezis, I.; Grebitus, C.; Hirsch, S. The price is right!? A meta-regression analysis on willingness to pay for local food. PLoS ONE 2019, 14, e0215847. [Google Scholar] [CrossRef] [PubMed] [Green Version]
- Potter, C.; Bastounis, A.; Hartmann-Boyce, J.; Stewart, C.; Frie, K.; Tudor, K.; Bianchi, F.; Cartwright, E.; Cook, B.; Rayner, M.; et al. The effects of environmental sustainability labels on selection, purchase, and consumption of food and drink products: A systematic review. Environ. Behav. 2021, 0013916521995473. [Google Scholar] [CrossRef]
- Dolgopolova, I.; Teuber, R. Consumers’ willingness to pay for health benefits in food products: A meta-analysis. Appl. Econ. Perspect. Policy 2018, 40, 333–352. [Google Scholar] [CrossRef]
- Moher, D.; Liberati, A.; Tetzlaff, J.; Altman, D.G. Preferred reporting items for systematic reviews and meta-analyses: The PRISMA statement. Ann. Intern. Med. 2009, 151, 264–269. [Google Scholar] [CrossRef] [PubMed] [Green Version]
- Cochrane Handbook for Systematic Reviews of Interventions. 2019. Available online: www.training.cochrane.org/handbook (accessed on 12 March 2020).
- Hensher, D.A.; Rose, J.M.; Greene, W.H. Applied Choice Analysis, 2nd ed.; Cambridge University Press: Cambridge, UK, 2015. [Google Scholar]
- Bronnmann, J.; Hoffmann, J. Consumer preferences for farmed and ecolabeled turbot: A North German perspective. Aquac. Econ. Manag. 2018, 22, 342–361. [Google Scholar] [CrossRef]
- De-Magistris, T.; Gracia, A. Consumers’ willingness-to-pay for sustainable food products: The case of organically and locally grown almonds in Spain. J. Clean. Prod. 2016, 118, 97–104. [Google Scholar] [CrossRef]
- Fernández-Polanco, J.; Loose, S.M.; Luna, L. Are retailers’ preferences for seafood attributes predictive for consumer wants? Results from a choice experiment for seabream sparus aurata. Aquac. Econ. Manag. 2013, 17, 103–122. [Google Scholar] [CrossRef]
- Gerrard, C.; Janssen, M.; Smith, L.; Hamm, U.; Padel, S. UK consumer reactions to organic certification logos. Br. Food J. 2013, 115, 727–742. [Google Scholar] [CrossRef] [Green Version]
- Grebitus, C.; Steiner, B.; Veeman, M.M. Paying for sustainability: A cross-cultural analysis of consumers’ valuations of food and non-food products labeled for carbon and water footprints. J. Behav. Exp. Econ. 2016, 63, 50–58. [Google Scholar] [CrossRef]
- Lombardi, G.V.; Berni, R.; Rocchi, B. Environmental friendly food. Choice experiment to assess consumer’s attitude toward “climate neutral” milk: The role of communication. J. Clean. Prod. 2017, 142, 257–262. [Google Scholar] [CrossRef]
- Mondelaers, K.; van Huylenbroek, G.; Verbeke, W.; Van Huylenbroeck, G. Importance of health and environment as quality traits in the buying decision of organic products. Br. Food J. 2009, 111, 1120–1139. [Google Scholar] [CrossRef] [Green Version]
- Sackett, H.; Shupp, R.; Tonsor, G. Differentiating “sustainable” from “organic” and “local” food choices: Does information about certification criteria help consumers? Int. J. Food Agric. Econ. 2016, 4, 17–31. [Google Scholar]
- Johnson, F.R.; Lancsar, E.; Marshall, D.; Kilambi, V.; Mühlbacher, A.; Regier, D.A.; Bridges, J.F. Constructing experimental designs for discrete-choice experiments: Report of the ISPOR conjoint analysis experimental design good research practices task force. Value Health 2013, 16, 3–13. [Google Scholar] [CrossRef] [Green Version]
- Bridges, J.F.; Hauber, A.B.; Marshall, D.; Lloyd, A.; Prosser, L.A.; Regier, D.A.; Mauskopf, J. Conjoint analysis applications in health—A checklist: A report of the ISPOR Good Research Practices for Conjoint Analysis Task Force. Value Health 2011, 14, 403–413. [Google Scholar] [CrossRef] [Green Version]
- OECD Data Purchasing Power Parities PPP$. Available online: https://data.oecd.org/conversion/purchasing-power-parities-ppp.htm (accessed on 19 January 2020).
- The World Bank GDP Deflator. Available online: https://data.worldbank.org/indicator/NY.GDP.DEFL.ZS (accessed on 19 January 2020).
- Price, J.; Dupont, D.; Adamowicz, W. As time goes by: Examination of temporal stability across stated preference question formats. Environ. Resour. Econ. 2017, 68, 643–662. [Google Scholar] [CrossRef]
- Hensher, D.A.; Rose, J.M.; Li, Z. Does the choice model method and/or the data matter? Transportation 2012, 39, 351–385. [Google Scholar] [CrossRef]
- de Boer, W.I.; Koning, R.H.; Mierau, J.O. Ex ante and ex post willingness to pay for hosting a large international sport event. J. Sports Econ. 2019, 20, 159–176. [Google Scholar] [CrossRef] [Green Version]
- Hearne, R.R.; Volcan, M.M. The Use of Choice Experiments to Analyze Consumer Preferences for Organic Produce in Costa Rica. In Proceedings of the AAEA Annual Meetings, Long Beach, CA, USA, 28–31 July 2002. [Google Scholar]
- Tait, P.; Saunders, C.; Guenther, M.; Rutherford, P. Emerging versus developed economy consumer willingness to pay for environmentally sustainable food production: A choice experiment approach comparing Indian, Chinese and United Kingdom lamb consumers. J. Clean. Prod. 2016, 124, 65–72. [Google Scholar] [CrossRef] [Green Version]
- Tait, P.; Saunders, C.; Guenther, M.; Rutherford, P.; Miller, S. Exploring the impacts of food label format on consumer willingness to pay for environmental sustainability: A choice experiment approach in the United Kingdom and Japan. Int. Food Res. J. 2016, 23, 1787–1796. [Google Scholar]
- Xie, J.; Gao, Z.; Swisher, M.; Zhao, X. Consumers’ preferences for fresh broccolis: Interactive effects between country of origin and organic labels. Agric. Econ. 2016, 47, 181–191. [Google Scholar] [CrossRef]
- Stata 16 Base Reference Manual; Stata Press: Stata Corp.: College Station, TX, USA, 2017.
- Borenstein, M.; Hedges, L.V.; Higgins, J.P.; Rothstein, H.R. Fixed-effect versus random-effects models. Introd. Meta-Anal. 2009, 77, 85. [Google Scholar]
- Siegrist, M.; Hartmann, C. Impact of sustainability perception on consumption of organic meat and meat substitutes. Appetite 2019, 132, 196–202. [Google Scholar] [CrossRef]
- Buckell, J.; Hess, S. Stubbing out hypothetical bias: Improving tobacco market predictions by combining stated and revealed preference data. J. Health Econ. 2019, 65, 93–102. [Google Scholar] [CrossRef]
- Aizaki, H.; Nanseki, T.; Zhou, H. Japanese consumer preferences for milk certified with the good agricultural practice (GAP) label. Anim. Sci. J. 2013, 84, 82–89. [Google Scholar] [CrossRef]
- Akaichi, F.; de Grauw, S.; Darmon, P.; Revoredo-Giha, C. Does Fair Trade Compete with Carbon Footprint and Organic Attributes in the Eyes of Consumers? Results from a Pilot Study in Scotland, The Netherlands and France. J. Agric. Environ. Ethics 2016, 29, 969–984. [Google Scholar] [CrossRef]
- Ankamah-Yeboah, I.; Jacobsen, J.B.; Olsen, S.B. Innovating out of the fishmeal trap. Br. Food J. 2018, 120, 2395–2410. [Google Scholar] [CrossRef] [Green Version]
- Banovic, M.; Reinders, M.J.; Claret, A.; Guerrero, L.; Krystallis, A. A cross-cultural perspective on impact of health and nutrition claims, country-of-origin and eco-label on consumer choice of new aquaculture products. Food Res. Int. 2019, 123, 36–47. [Google Scholar] [CrossRef] [Green Version]
- Bienenfeld, J.M. Consumer Willingness to Pay for Organic, Environmental and Country of Origin Attributes of Food Products; The Ohio State University: Columbus, OH, USA, 2014. [Google Scholar]
- Caputo, V.; Van Loo, E.J.; Scarpa, R.; Nayga, R.M.; Verbeke, W. Comparing Serial, and Choice Task Stated and Inferred Attribute Non-Attendance Methods in Food Choice Experiments. J. Agric. Econ. 2018, 69, 35–57. [Google Scholar] [CrossRef] [Green Version]
- Carlucci, D.; Devitiis, B.D.; Nardone, G.; Santeramo, F.G. Certification Labels Versus Convenience Formats: What Drives the Market in Aquaculture Products? Mar. Resour. Econ. 2017, 32, 295–310. [Google Scholar] [CrossRef]
- Chen, X.; Alfnes, F.; Rickertsen, K. Consumer Preferences, Ecolabels, and Effects of Negative Environmental Information. AgBioForum 2015, 18, 327–336. [Google Scholar]
- Fonner, R.; Sylvia, G. Willingness to Pay for Multiple Seafood Labels in a Niche Market. Mar. Resour. Econ. 2015, 30, 51–70. [Google Scholar] [CrossRef]
- Heng, Y.; Peterson, H.H.; Li, X. Consumer Responses to Multiple and Superfluous Labels in the Case of Eggs. J. Food Distrib. Res. 2016, 47, 62–82. [Google Scholar]
- James, J.S.; Rickard, B.J.; Rossman, W.J. Product Differentiation and Market Segmentation in Applesauce: Using a Choice Experiment to Assess the Value of Organic, Local, and Nutrition Attributes. Agric. Resour. Econ. Rev. 2009, 38, 357–370. [Google Scholar] [CrossRef]
- Khai, H.V.; Yabe, M. Consumer preferences for agricultural products considering the value of biodiversity conservation in the Mekong Delta, Vietnam. J. Nat. Conserv. 2015, 25, 62–71. [Google Scholar] [CrossRef]
- Lim, K.H.; Hu, W.; Nayga, R.M. Is Marine Stewardship Council’s ecolabel a rising tide for all? Consumers’ willingness to pay for origin-differentiated ecolabeled canned tuna. Mar. Policy 2018, 96, 18–26. [Google Scholar] [CrossRef]
- Mamouni Limnios, E.; Schilizzi, S.G.M.; Burton, M.; Ong, A.; Hynes, N. Willingness to pay for product ecological footprint: Organic vs non-organic consumers. Technol. Forecast. Soc. Chang. 2016, 111, 338–348. [Google Scholar] [CrossRef]
- Liu, Q.; Yan, Z.; Zhou, J. Consumer Choices and Motives for Eco-Labeled Products in China: An Empirical Analysis Based on the Choice Experiment. Sustainability 2017, 9, 331. [Google Scholar] [CrossRef] [Green Version]
- Olesen, I.; Alfnes, F.; Røra, M.B.; Kolstad, K. Eliciting consumers’ willingness to pay for organic and welfare-labelled salmon in a non-hypothetical choice experiment. Livest. Sci. 2010, 127, 218–226. [Google Scholar] [CrossRef]
- Risius, A.; Hamm, U. The effect of information on beef husbandry systems on consumers’ preferences and willingness to pay. Meat Sci. 2017, 124, 9–14. [Google Scholar] [CrossRef] [PubMed]
- Rousseau, S. The role of organic and fair trade labels when choosing chocolate. Food Qual. Prefer. 2015, 44, 92–100. [Google Scholar] [CrossRef] [Green Version]
- Rousseau, S.; Vranken, L. Green market expansion by reducing information asymmetries: Evidence for labeled organic food products. Food Policy 2013, 40, 31–43. [Google Scholar] [CrossRef]
- Sakagami, M.; Sato, M.; Ueta, K. Measuring consumer preferences regarding organic labelling and the JAS label in particular. N. Z. J. Agric. Res. 2010, 49, 247–254. [Google Scholar] [CrossRef]
- Uchida, H.; Onozaka, Y.; Morita, T.; Managi, S. Demand for ecolabeled seafood in the Japanese market: A conjoint analysis of the impact of information and interaction with other labels. Food Policy 2014, 44, 68–76. [Google Scholar] [CrossRef]
- Van Loo, E.J.; Caputo, V.; Nayga, R.M.; Meullenet, J.-F.; Ricke, S.C. Consumers’ willingness to pay for organic chicken breast: Evidence from choice experiment. Food Qual. Prefer. 2011, 22, 603–613. [Google Scholar] [CrossRef]
- van Osch, S.; Hynes, S.; O’Higgins, T.; Hanley, N.; Campbell, D.; Freeman, S. Estimating the Irish public’s willingness to pay for more sustainable salmon produced by integrated multi-trophic aquaculture. Mar. Policy 2017, 84, 220–227. [Google Scholar] [CrossRef] [Green Version]
- Wakamatsu, H.; Miyata, T. Reputational damage and the Fukushima disaster: An analysis of seafood in Japan. Fish. Sci. 2017, 83, 1049–1057. [Google Scholar] [CrossRef]
- Wang, J.; Ge, J.; Ma, Y. Urban Chinese Consumers’ Willingness to Pay for Pork with Certified Labels: A Discrete Choice Experiment. Sustainability 2018, 10, 603. [Google Scholar] [CrossRef] [Green Version]
- Witkin, T.; Dissanayake, S.T.M.; McClenachan, L. Opportunities and barriers for fisheries diversification: Consumer choice in New England. Fish. Res. 2015, 168, 56–62. [Google Scholar] [CrossRef]
- Wu, L.; Yin, S.; Xu, Y.; Zhu, D. Effectiveness of China’s Organic Food Certification Policy: Consumer Preferences for Infant Milk Formula with Different Organic Certification Labels. Can. J. Agric. Econ. Rev. Can. D’agroecon. 2014, 62, 545–568. [Google Scholar] [CrossRef]
- Yue, F.; Arbiol, J.; Nomura, H.; Yabe, M. Preferences and Willingness to Pay for Organic Milk among Urban Consumers in Dalian, China. J. Fac. Agric. 2015, 60, 501–509. [Google Scholar]
- Yin, S.; Hu, W.; Chen, Y.; Han, F.; Wang, Y.; Chen, M. Chinese consumer preferences for fresh produce: Interaction between food safety labels and brands. Agribusiness 2019, 35, 53–68. [Google Scholar] [CrossRef]
- Zanoli, R.; Scarpa, R.; Napolitano, F.; Piasentier, E.; Naspetti, S.; Bruschi, V. Organic label as an identifier of environmentally related quality: A consumer choice experiment on beef in Italy. Renew. Agric. Food Syst. 2012, 28, 70–79. [Google Scholar] [CrossRef] [Green Version]
- Zhou, J.; Liu, Q.; Mao, R.; Yu, X. Habit spillovers or induced awareness: Willingness to pay for eco-labels of rice in China. Food Policy 2017, 71, 62–73. [Google Scholar] [CrossRef]

| Meta-Regression 1 Interverntions’ Characteristics Coefficients (95%CI) | Meta-Regression 2 Participants’ Characteristics Coefficients (95%CI) | |
|---|---|---|
| Setting(in-person interview/questionnaire) | 3.48 * (0.14, 6.82) | |
| Message(reference group: Organic) | ||
| Sustainability | −3.62 * (−6.79, −0.44) | |
| Combined | −2.60 (−6.52, 1.32) | |
| Certification(reference group: certification label present) | 2 (−1.19, 5.21) | |
| Format (reference group: text format) | ||
| Label | −0.72 (−4.65, 3.2) | |
| Combined | −0.84 (−4.15, 2.46) | |
| Age | 6.6 (−13.48, 26.7) | |
| Gender: Female | 28.25 *** (12.83, 43.67) | |
| Income | 3.25 (−14.29, 20.81) | |
| Education | −28.81 *** (−36.95, −20.67) | |
| Obs. | 129 | 39 |
| R2 (%) | 7.45 | 56.41 |
| T2 | 53.19 | 11.27 |
| I2 (%) | 100 | 100 |
Publisher’s Note: MDPI stays neutral with regard to jurisdictional claims in published maps and institutional affiliations. |
© 2021 by the authors. Licensee MDPI, Basel, Switzerland. This article is an open access article distributed under the terms and conditions of the Creative Commons Attribution (CC BY) license (https://creativecommons.org/licenses/by/4.0/).
Share and Cite
Bastounis, A.; Buckell, J.; Hartmann-Boyce, J.; Cook, B.; King, S.; Potter, C.; Bianchi, F.; Rayner, M.; Jebb, S.A. The Impact of Environmental Sustainability Labels on Willingness-to-Pay for Foods: A Systematic Review and Meta-Analysis of Discrete Choice Experiments. Nutrients 2021, 13, 2677. https://doi.org/10.3390/nu13082677
Bastounis A, Buckell J, Hartmann-Boyce J, Cook B, King S, Potter C, Bianchi F, Rayner M, Jebb SA. The Impact of Environmental Sustainability Labels on Willingness-to-Pay for Foods: A Systematic Review and Meta-Analysis of Discrete Choice Experiments. Nutrients. 2021; 13(8):2677. https://doi.org/10.3390/nu13082677
Chicago/Turabian StyleBastounis, Anastasios, John Buckell, Jamie Hartmann-Boyce, Brian Cook, Sarah King, Christina Potter, Filippo Bianchi, Mike Rayner, and Susan A. Jebb. 2021. "The Impact of Environmental Sustainability Labels on Willingness-to-Pay for Foods: A Systematic Review and Meta-Analysis of Discrete Choice Experiments" Nutrients 13, no. 8: 2677. https://doi.org/10.3390/nu13082677
APA StyleBastounis, A., Buckell, J., Hartmann-Boyce, J., Cook, B., King, S., Potter, C., Bianchi, F., Rayner, M., & Jebb, S. A. (2021). The Impact of Environmental Sustainability Labels on Willingness-to-Pay for Foods: A Systematic Review and Meta-Analysis of Discrete Choice Experiments. Nutrients, 13(8), 2677. https://doi.org/10.3390/nu13082677