
The Utility of Body Composition Assessment in Nutrition and Clinical Practice: An Overview of Current Methodology


Abstract

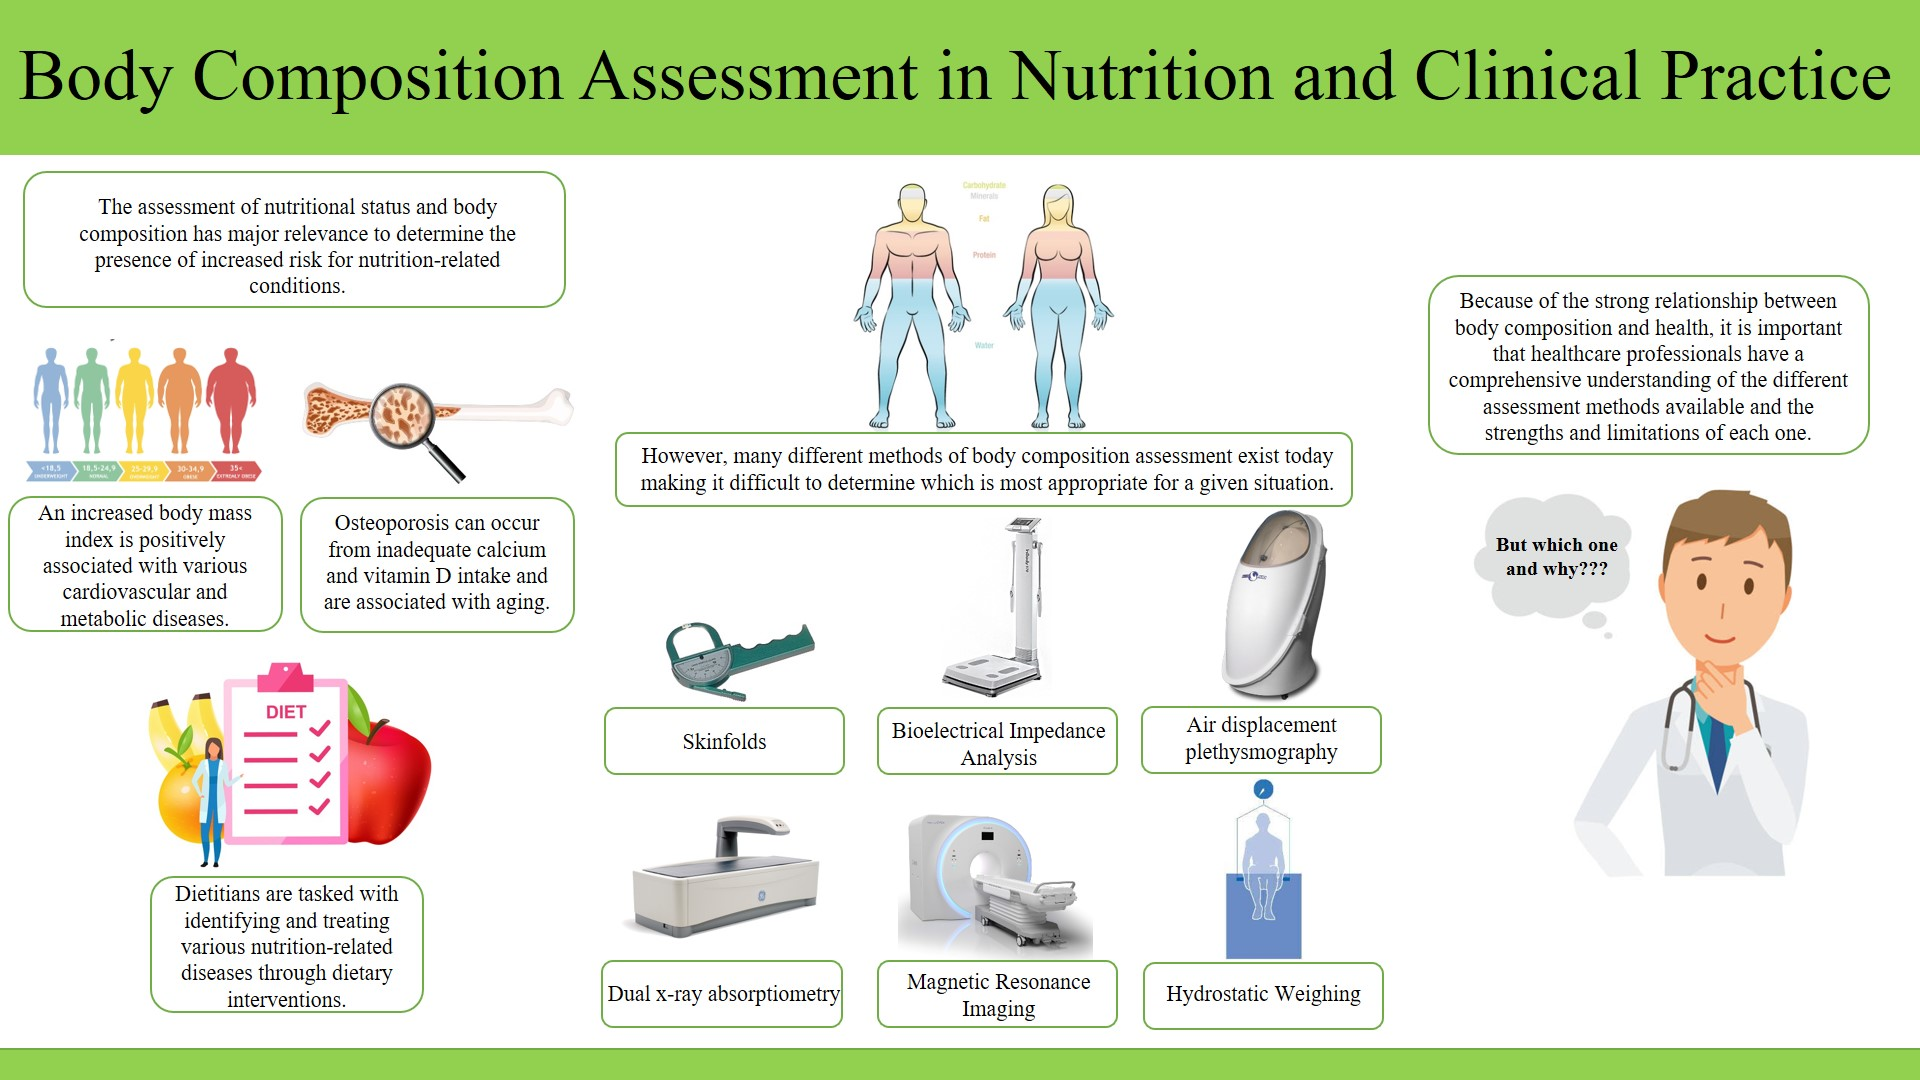
1. Introduction
2. Clinical Relevance of Body Composition Assessment
3. Methods for Estimating and Quantifying Body Composition
3.1. Body Mass Index (BMI)
3.2. Waist and Hip Circumferences
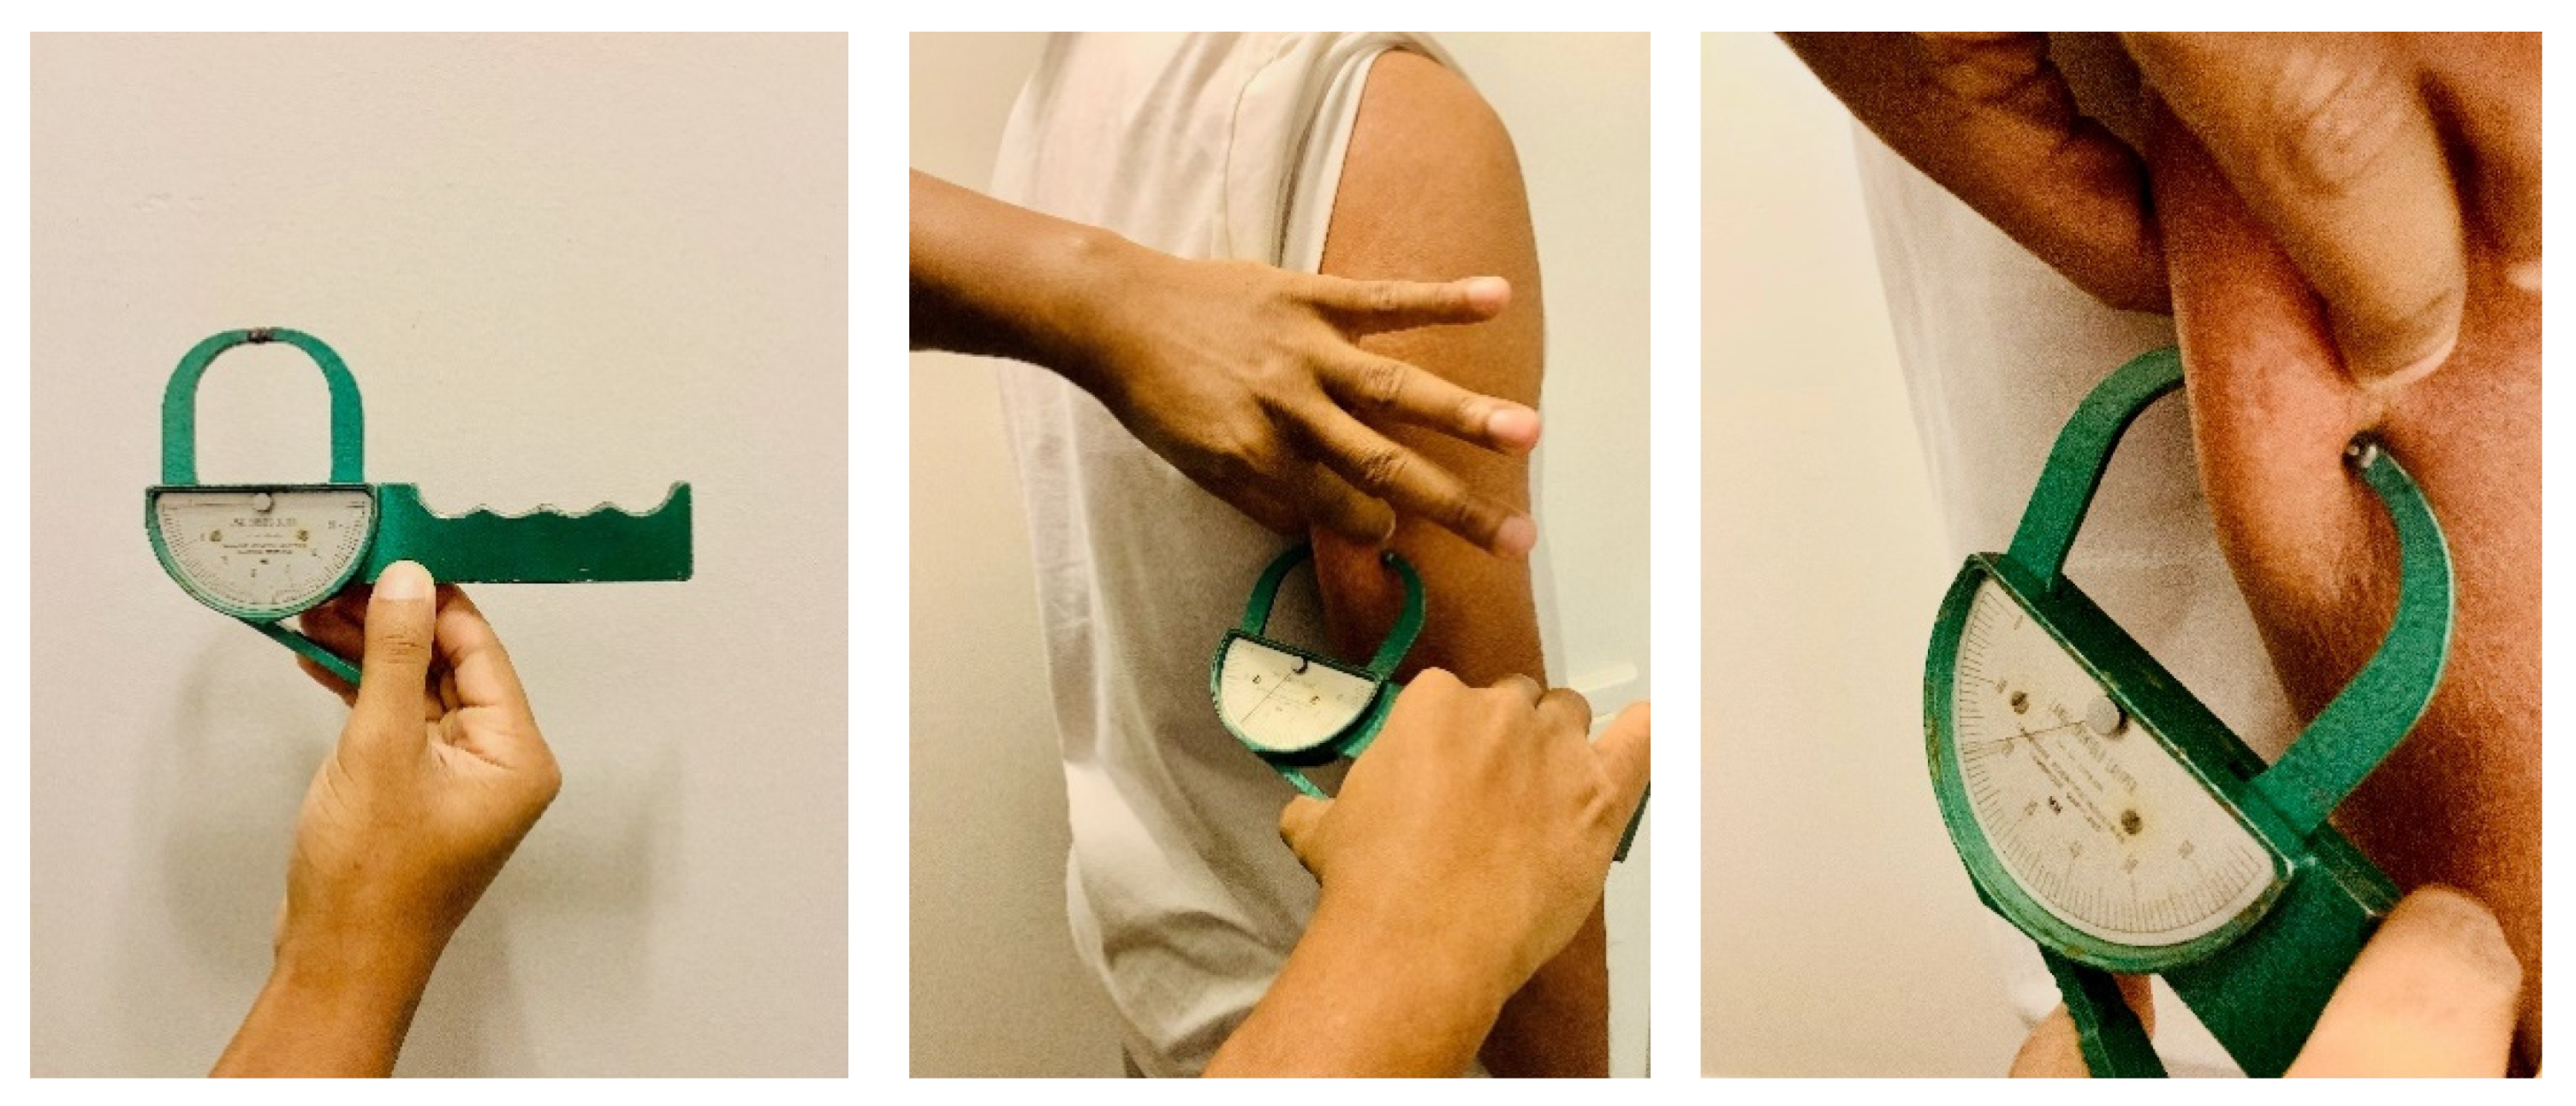
3.3. Skinfolds (SKF)
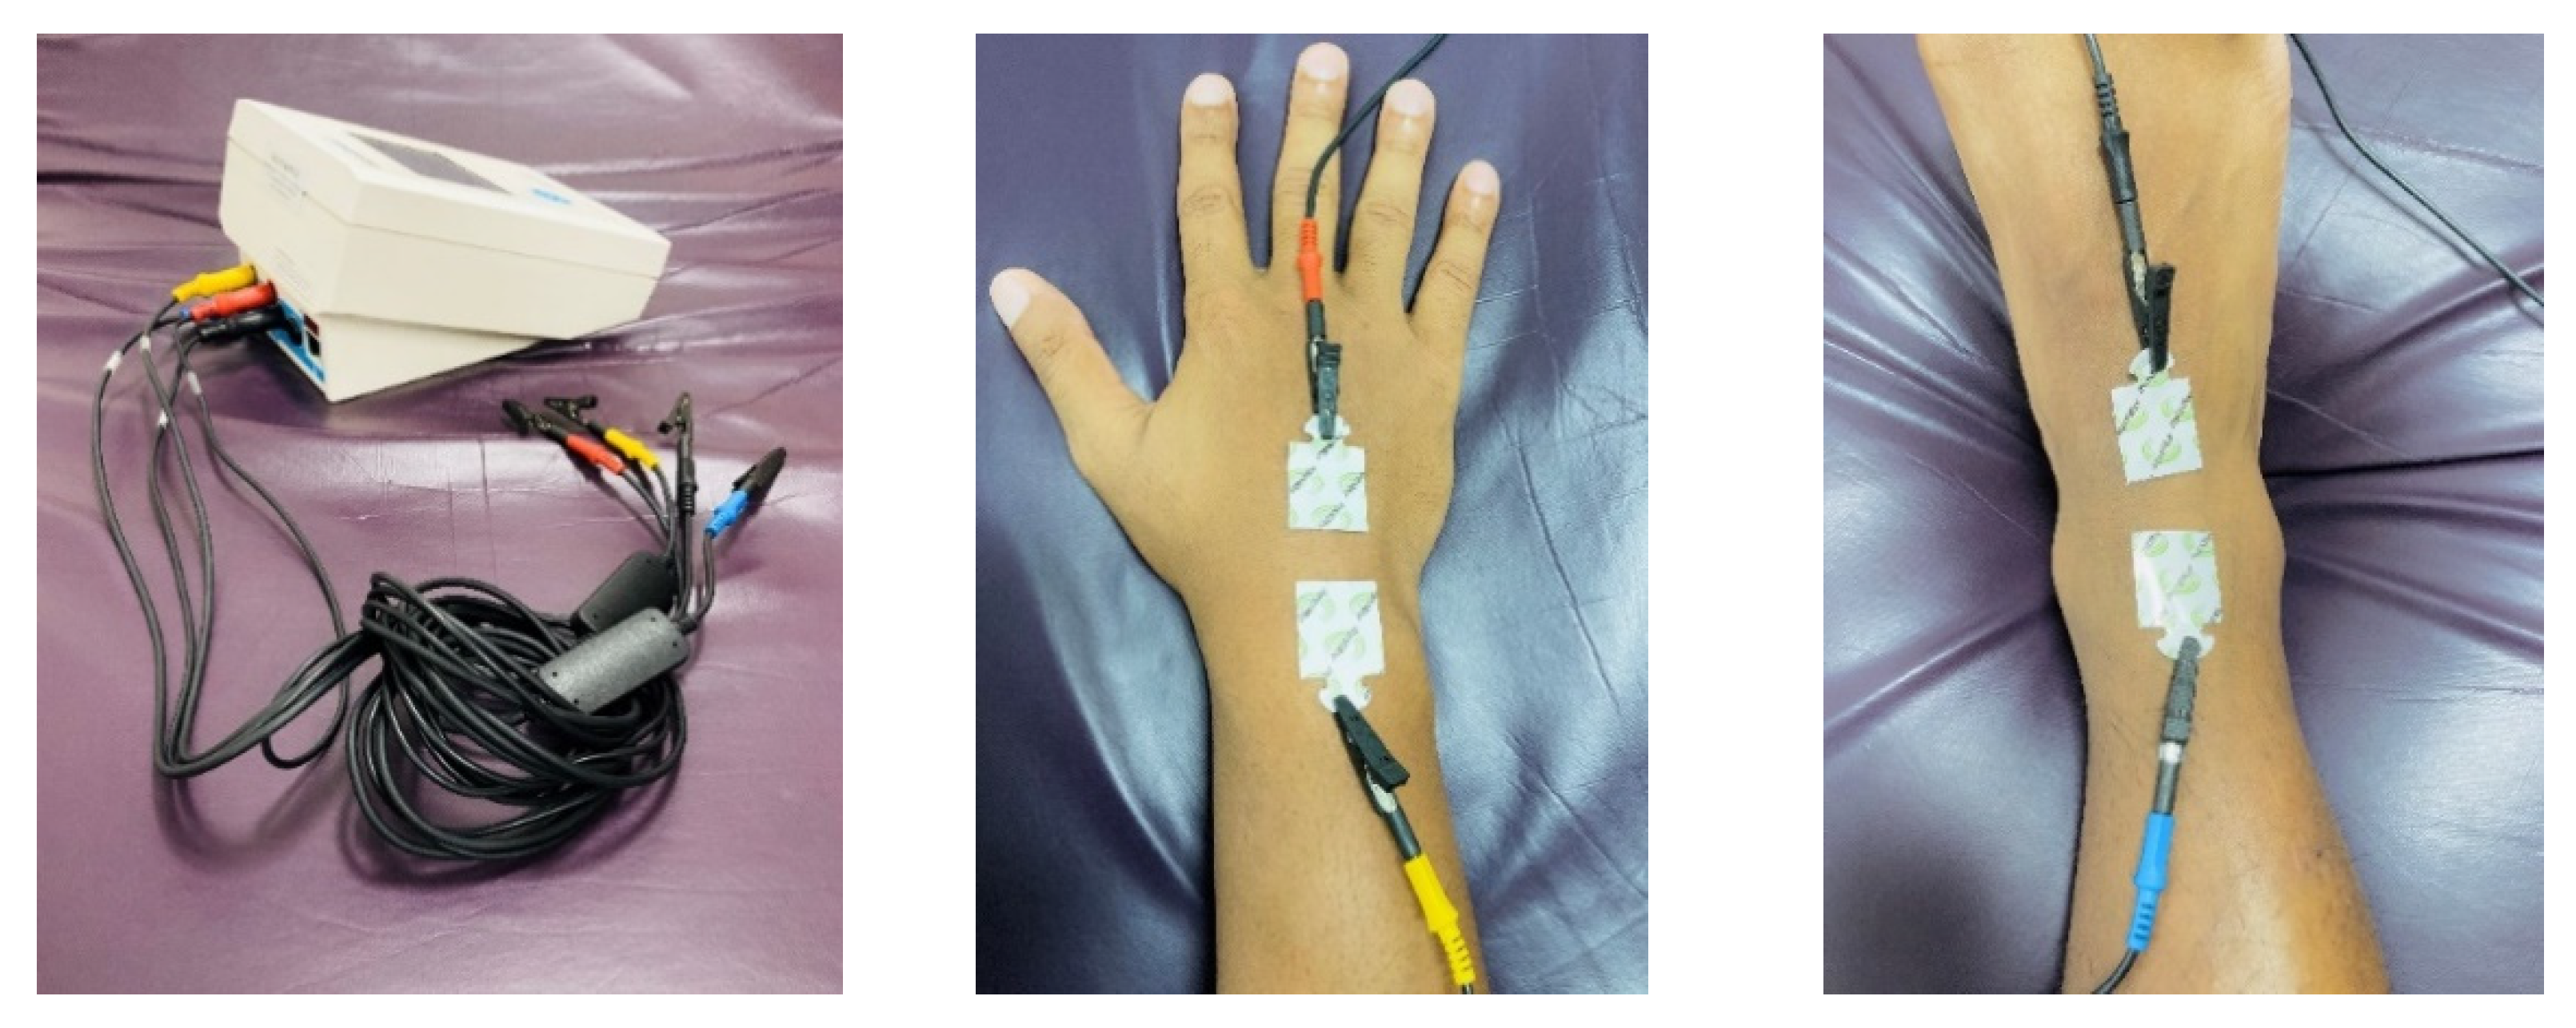
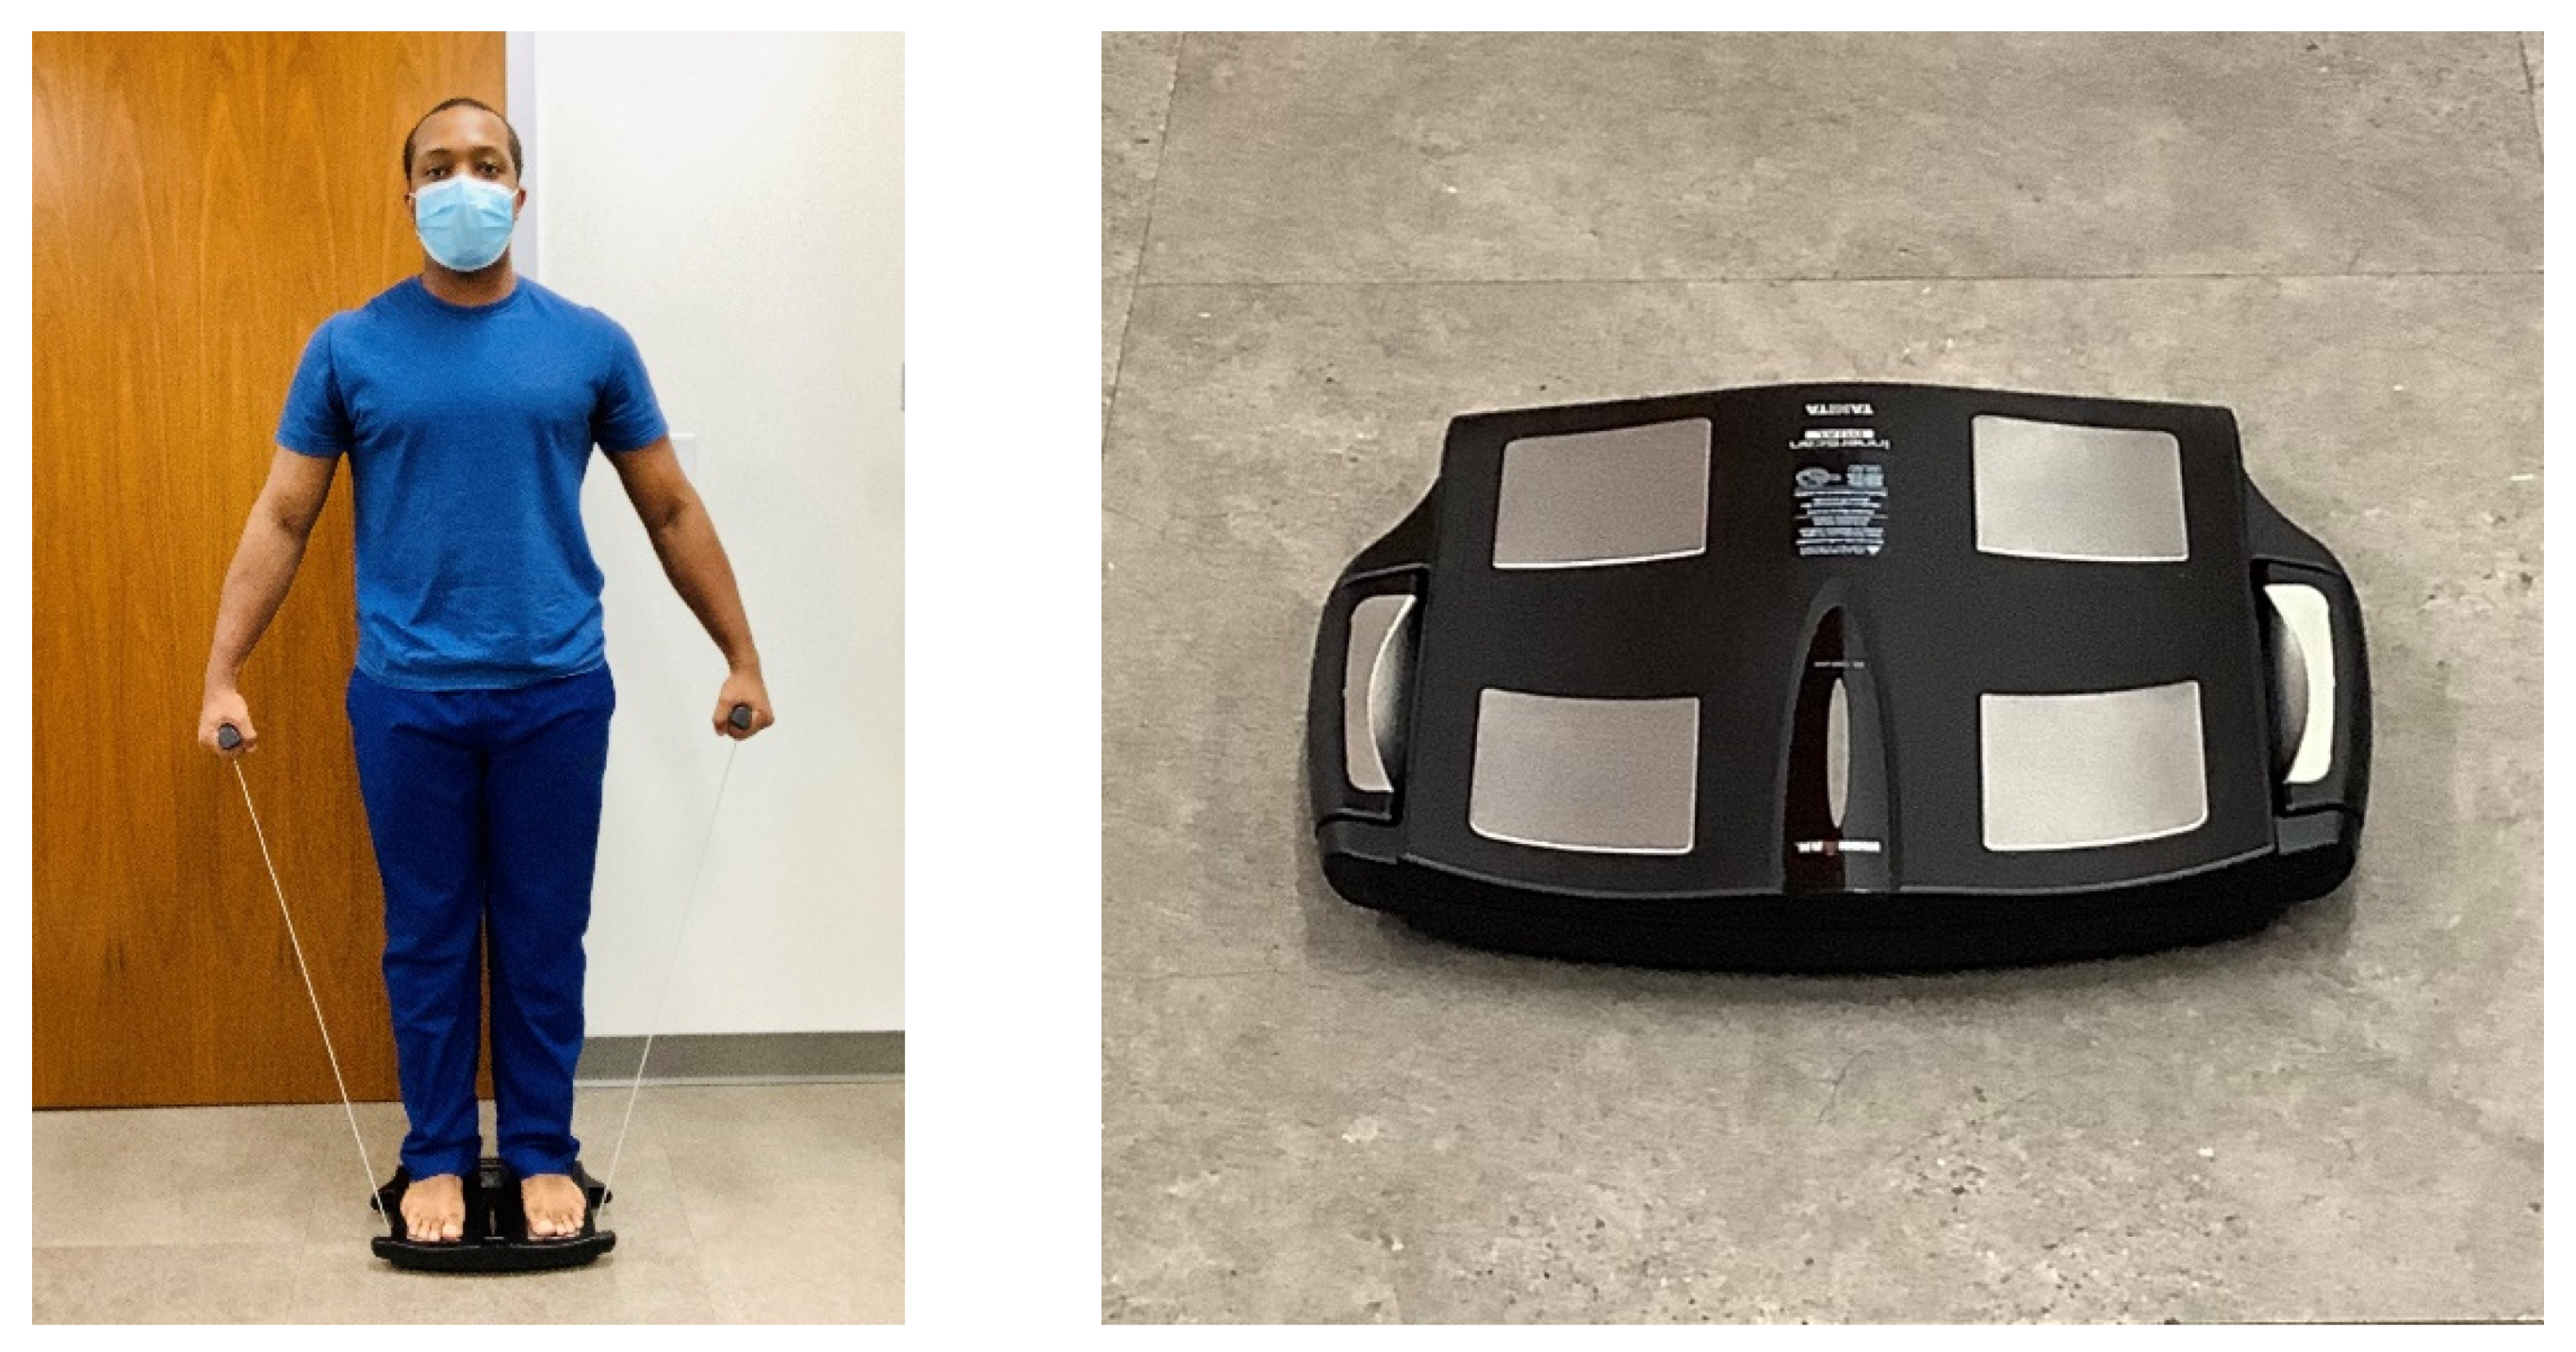
3.4. Bioelectrical Impedance Analysis (BIA)
3.5. Digital Image Analysis
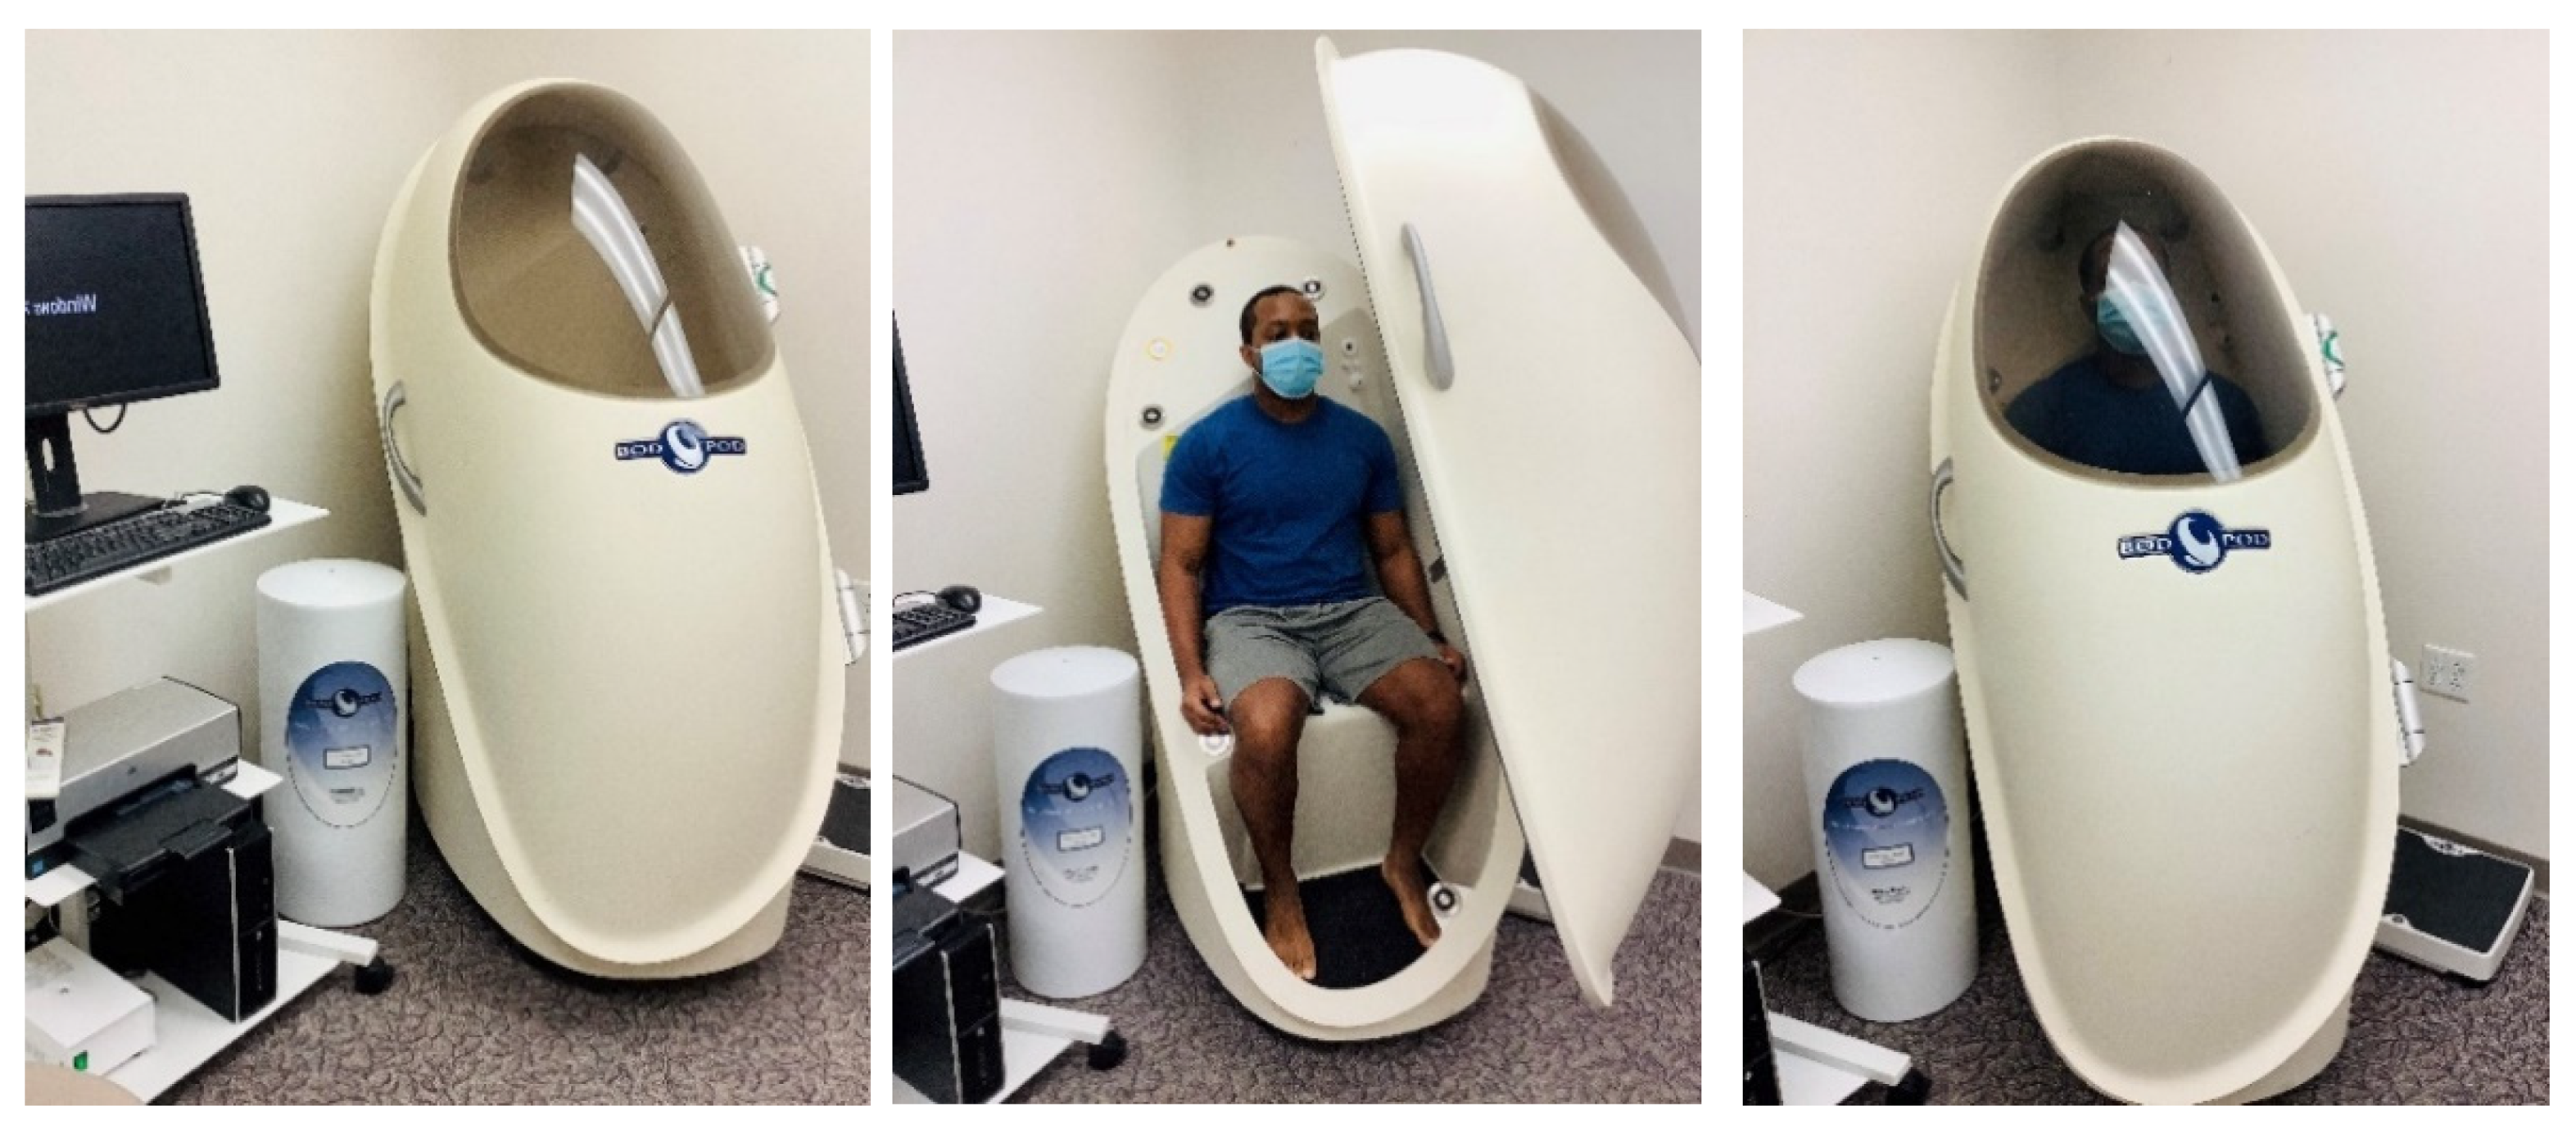
3.6. Air Displacement Plethysmography (ADP)
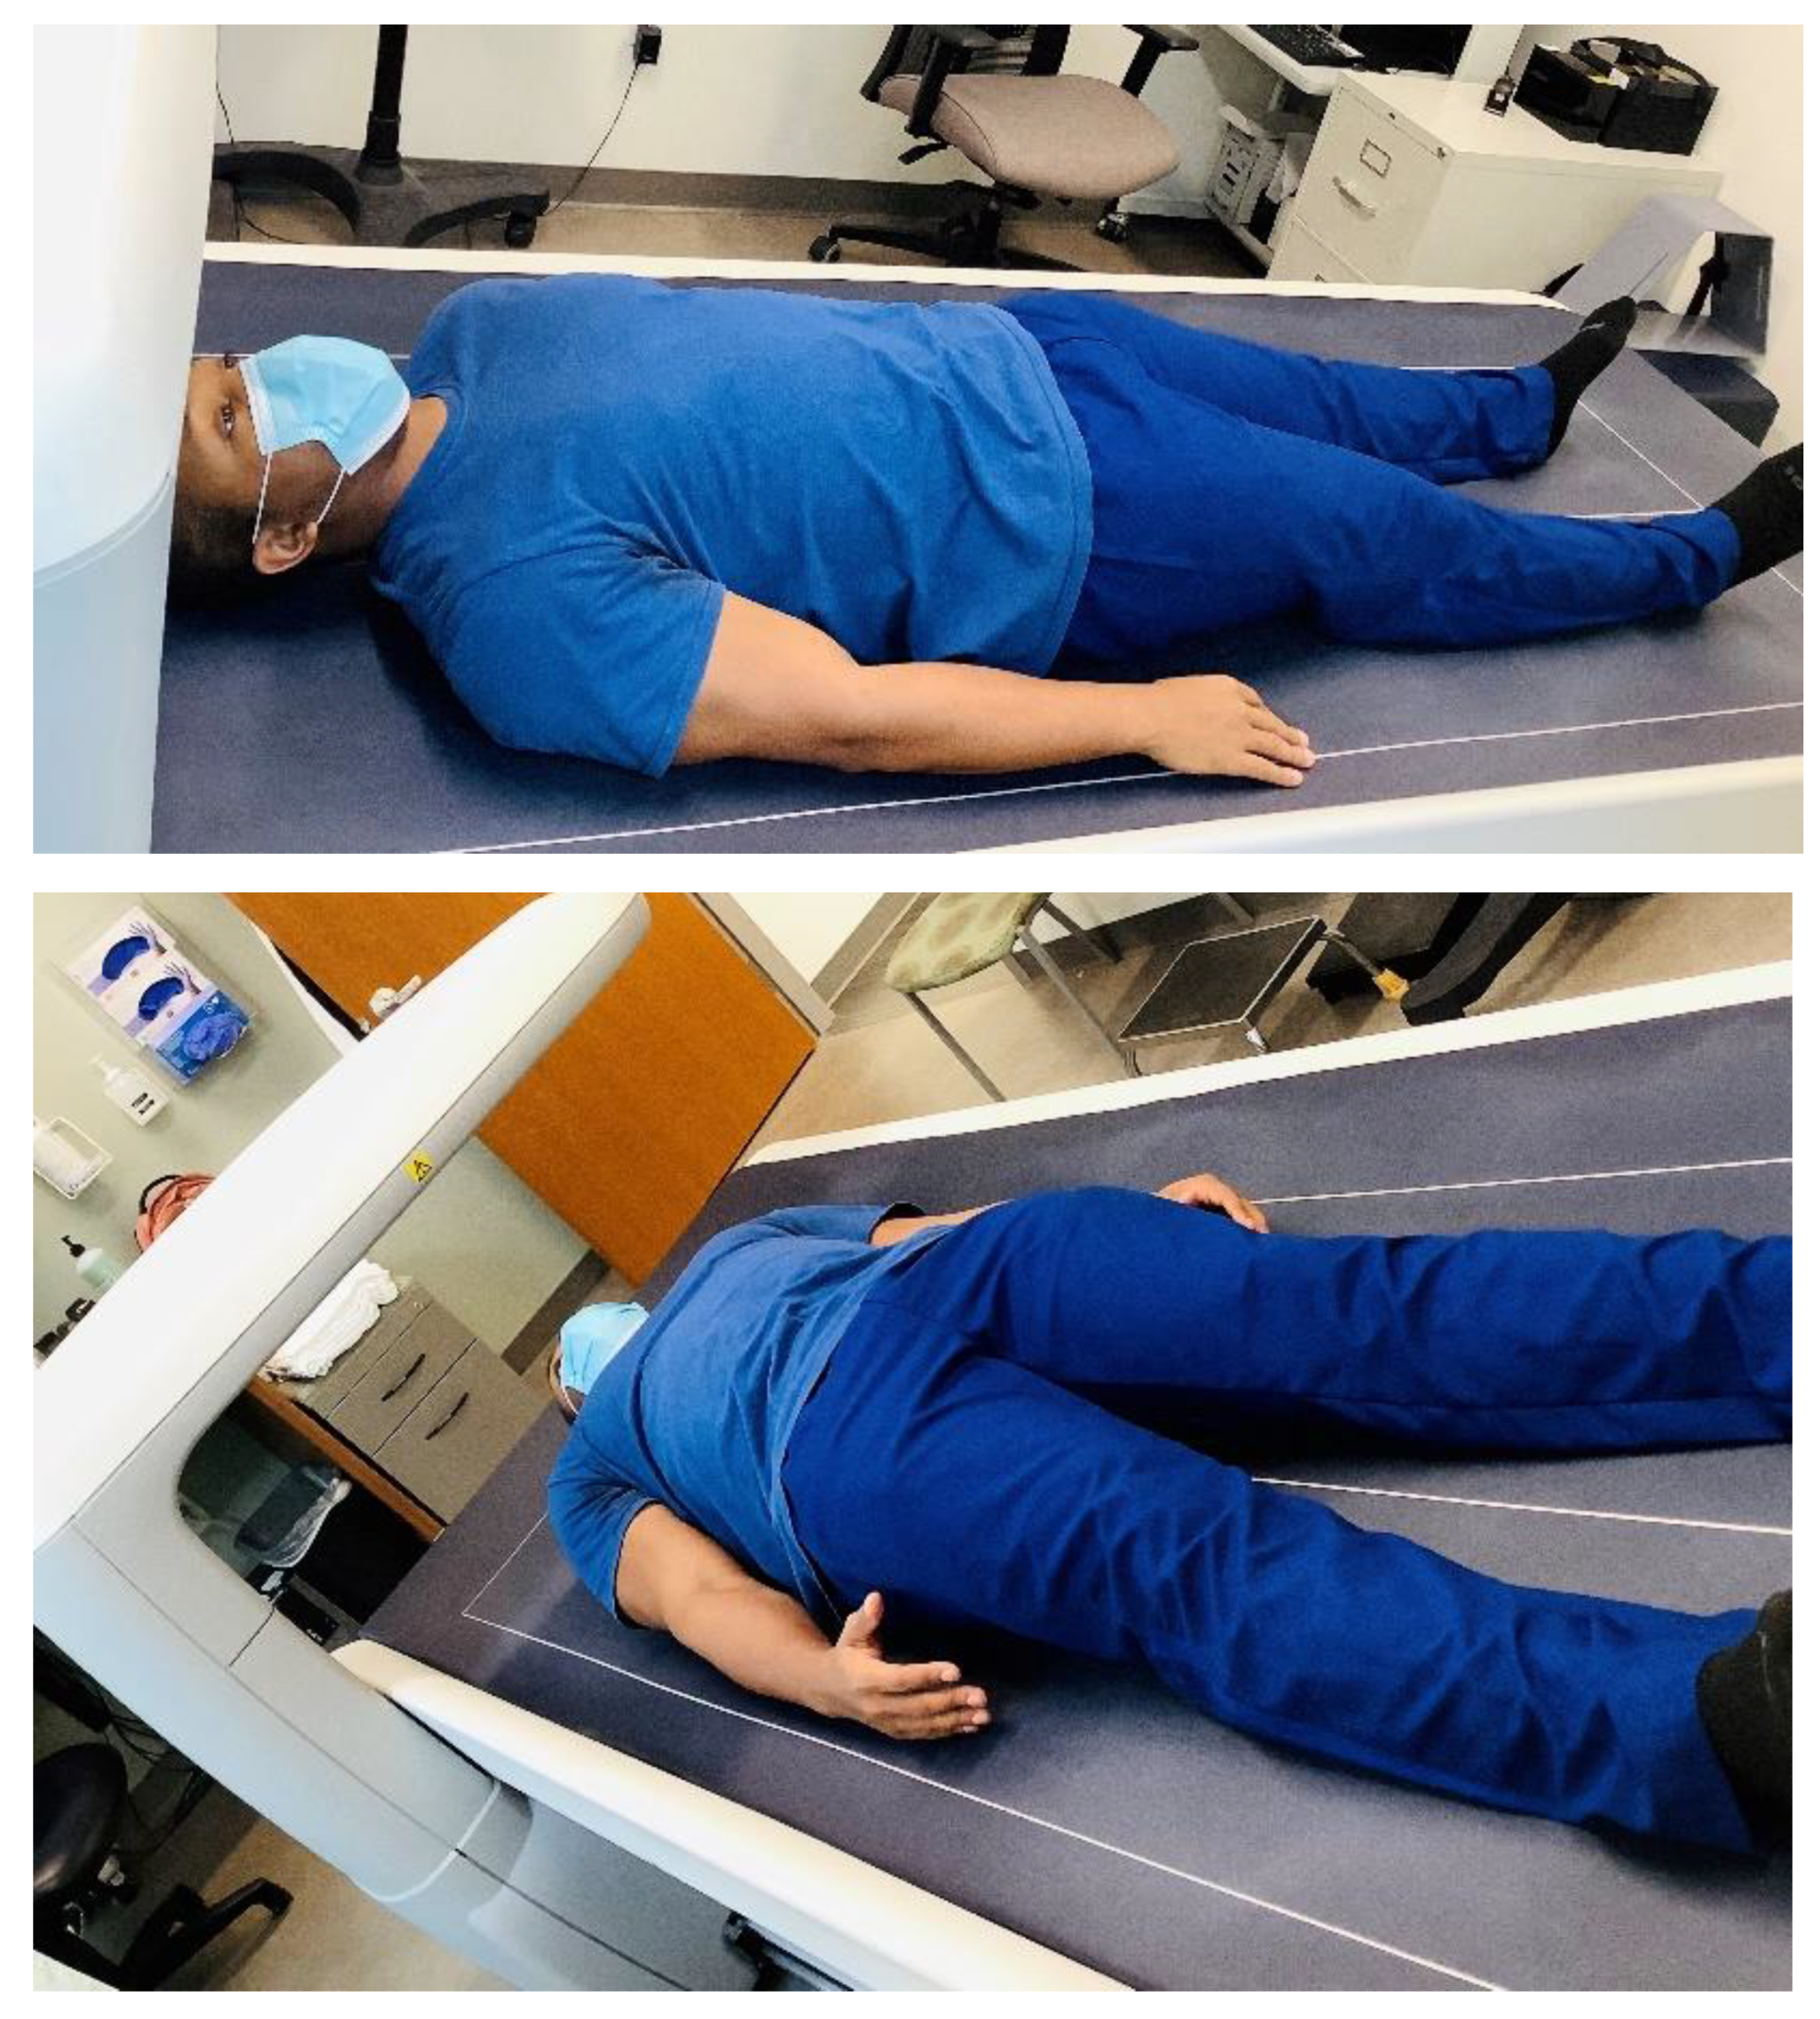
3.7. Dual-Energy X-ray Absorptiometry (DXA)
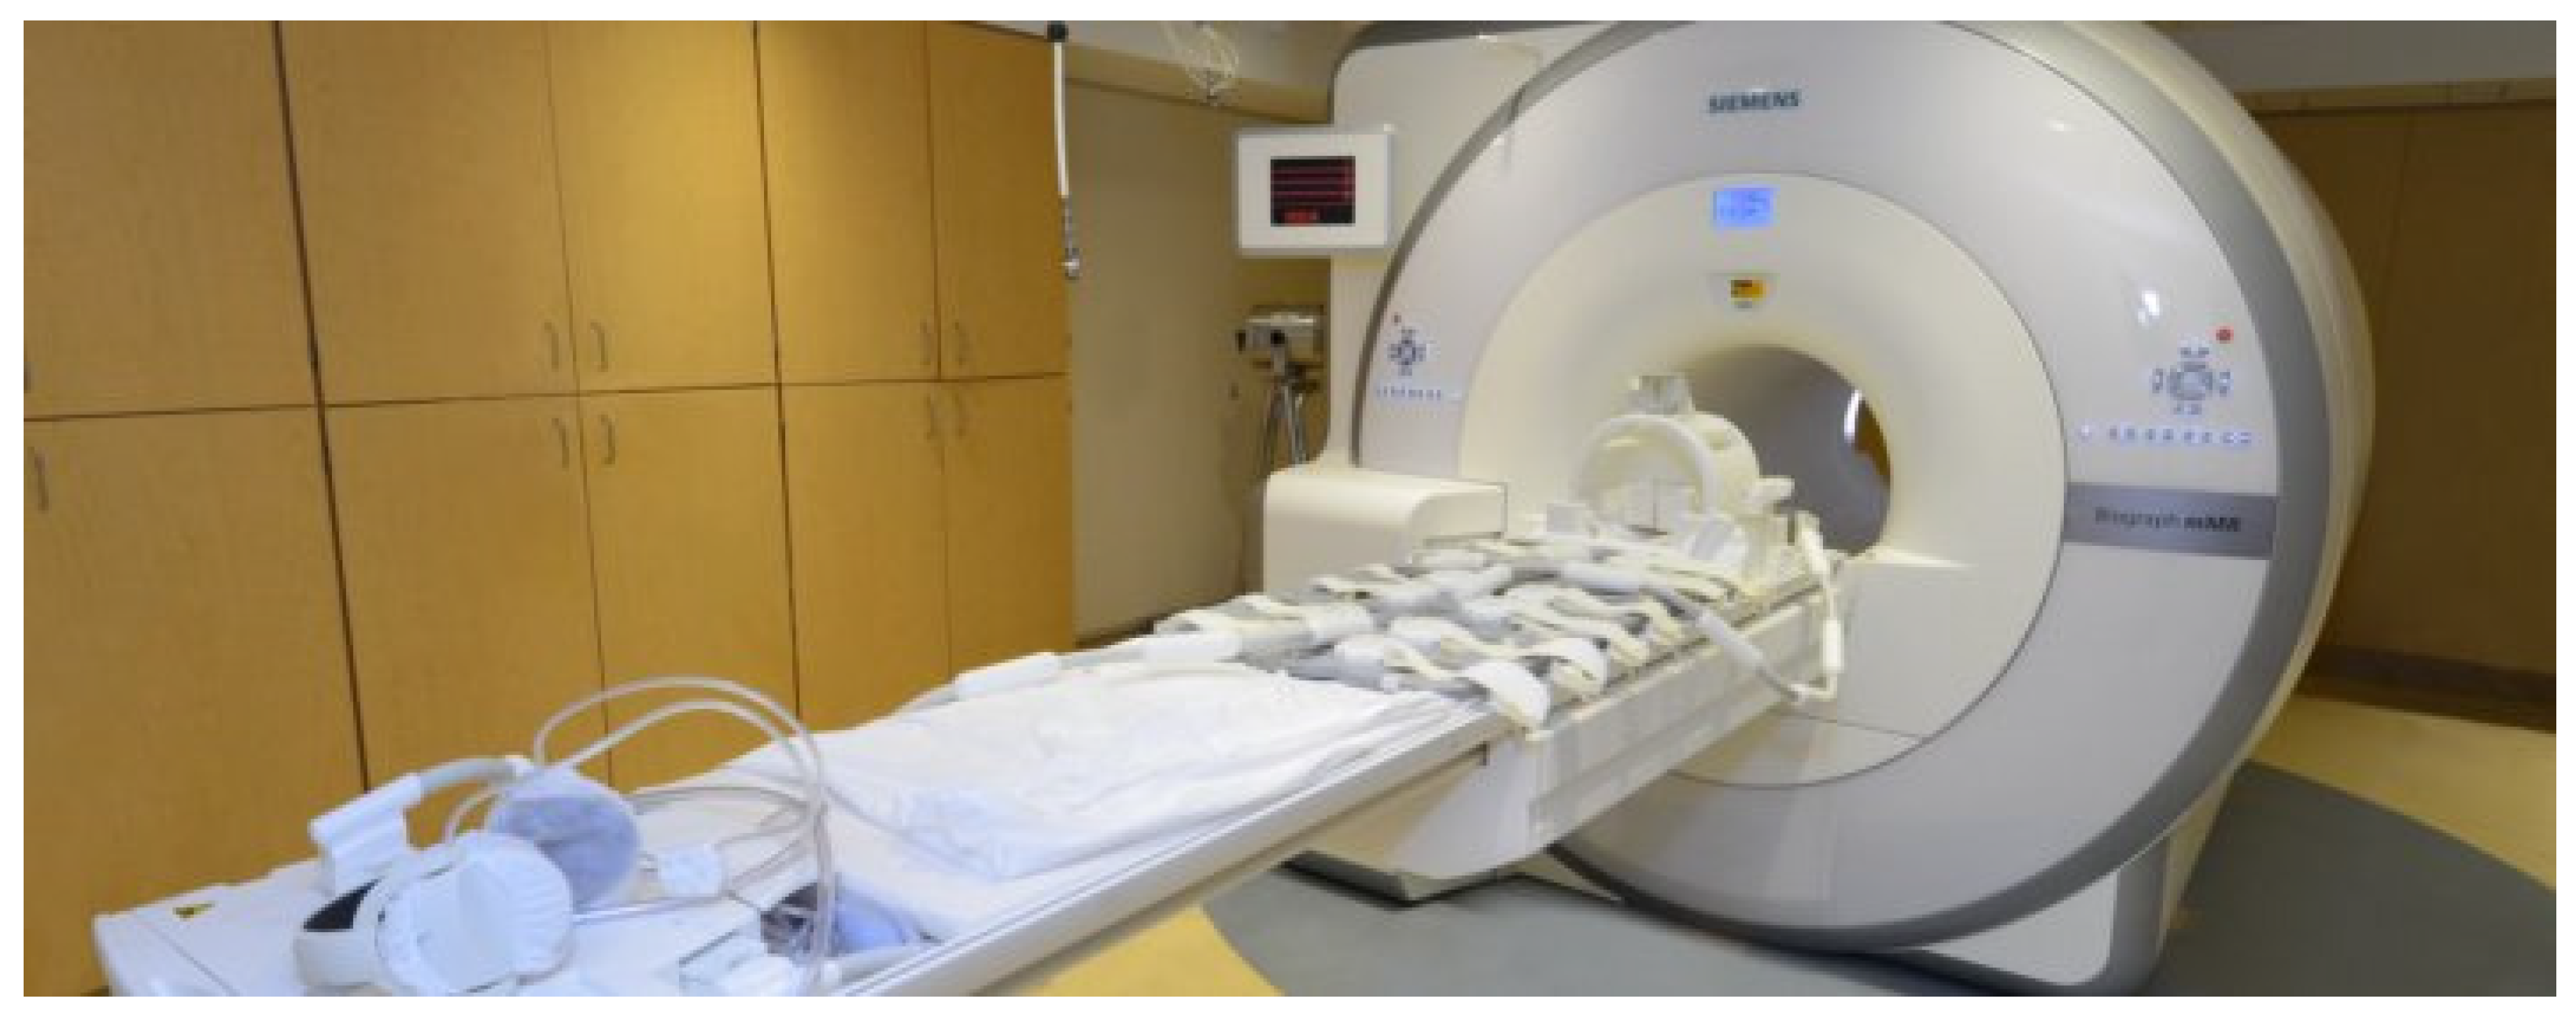
3.8. Computed Tomography (CT) and Magnetic Resonance Imaging (MRI)
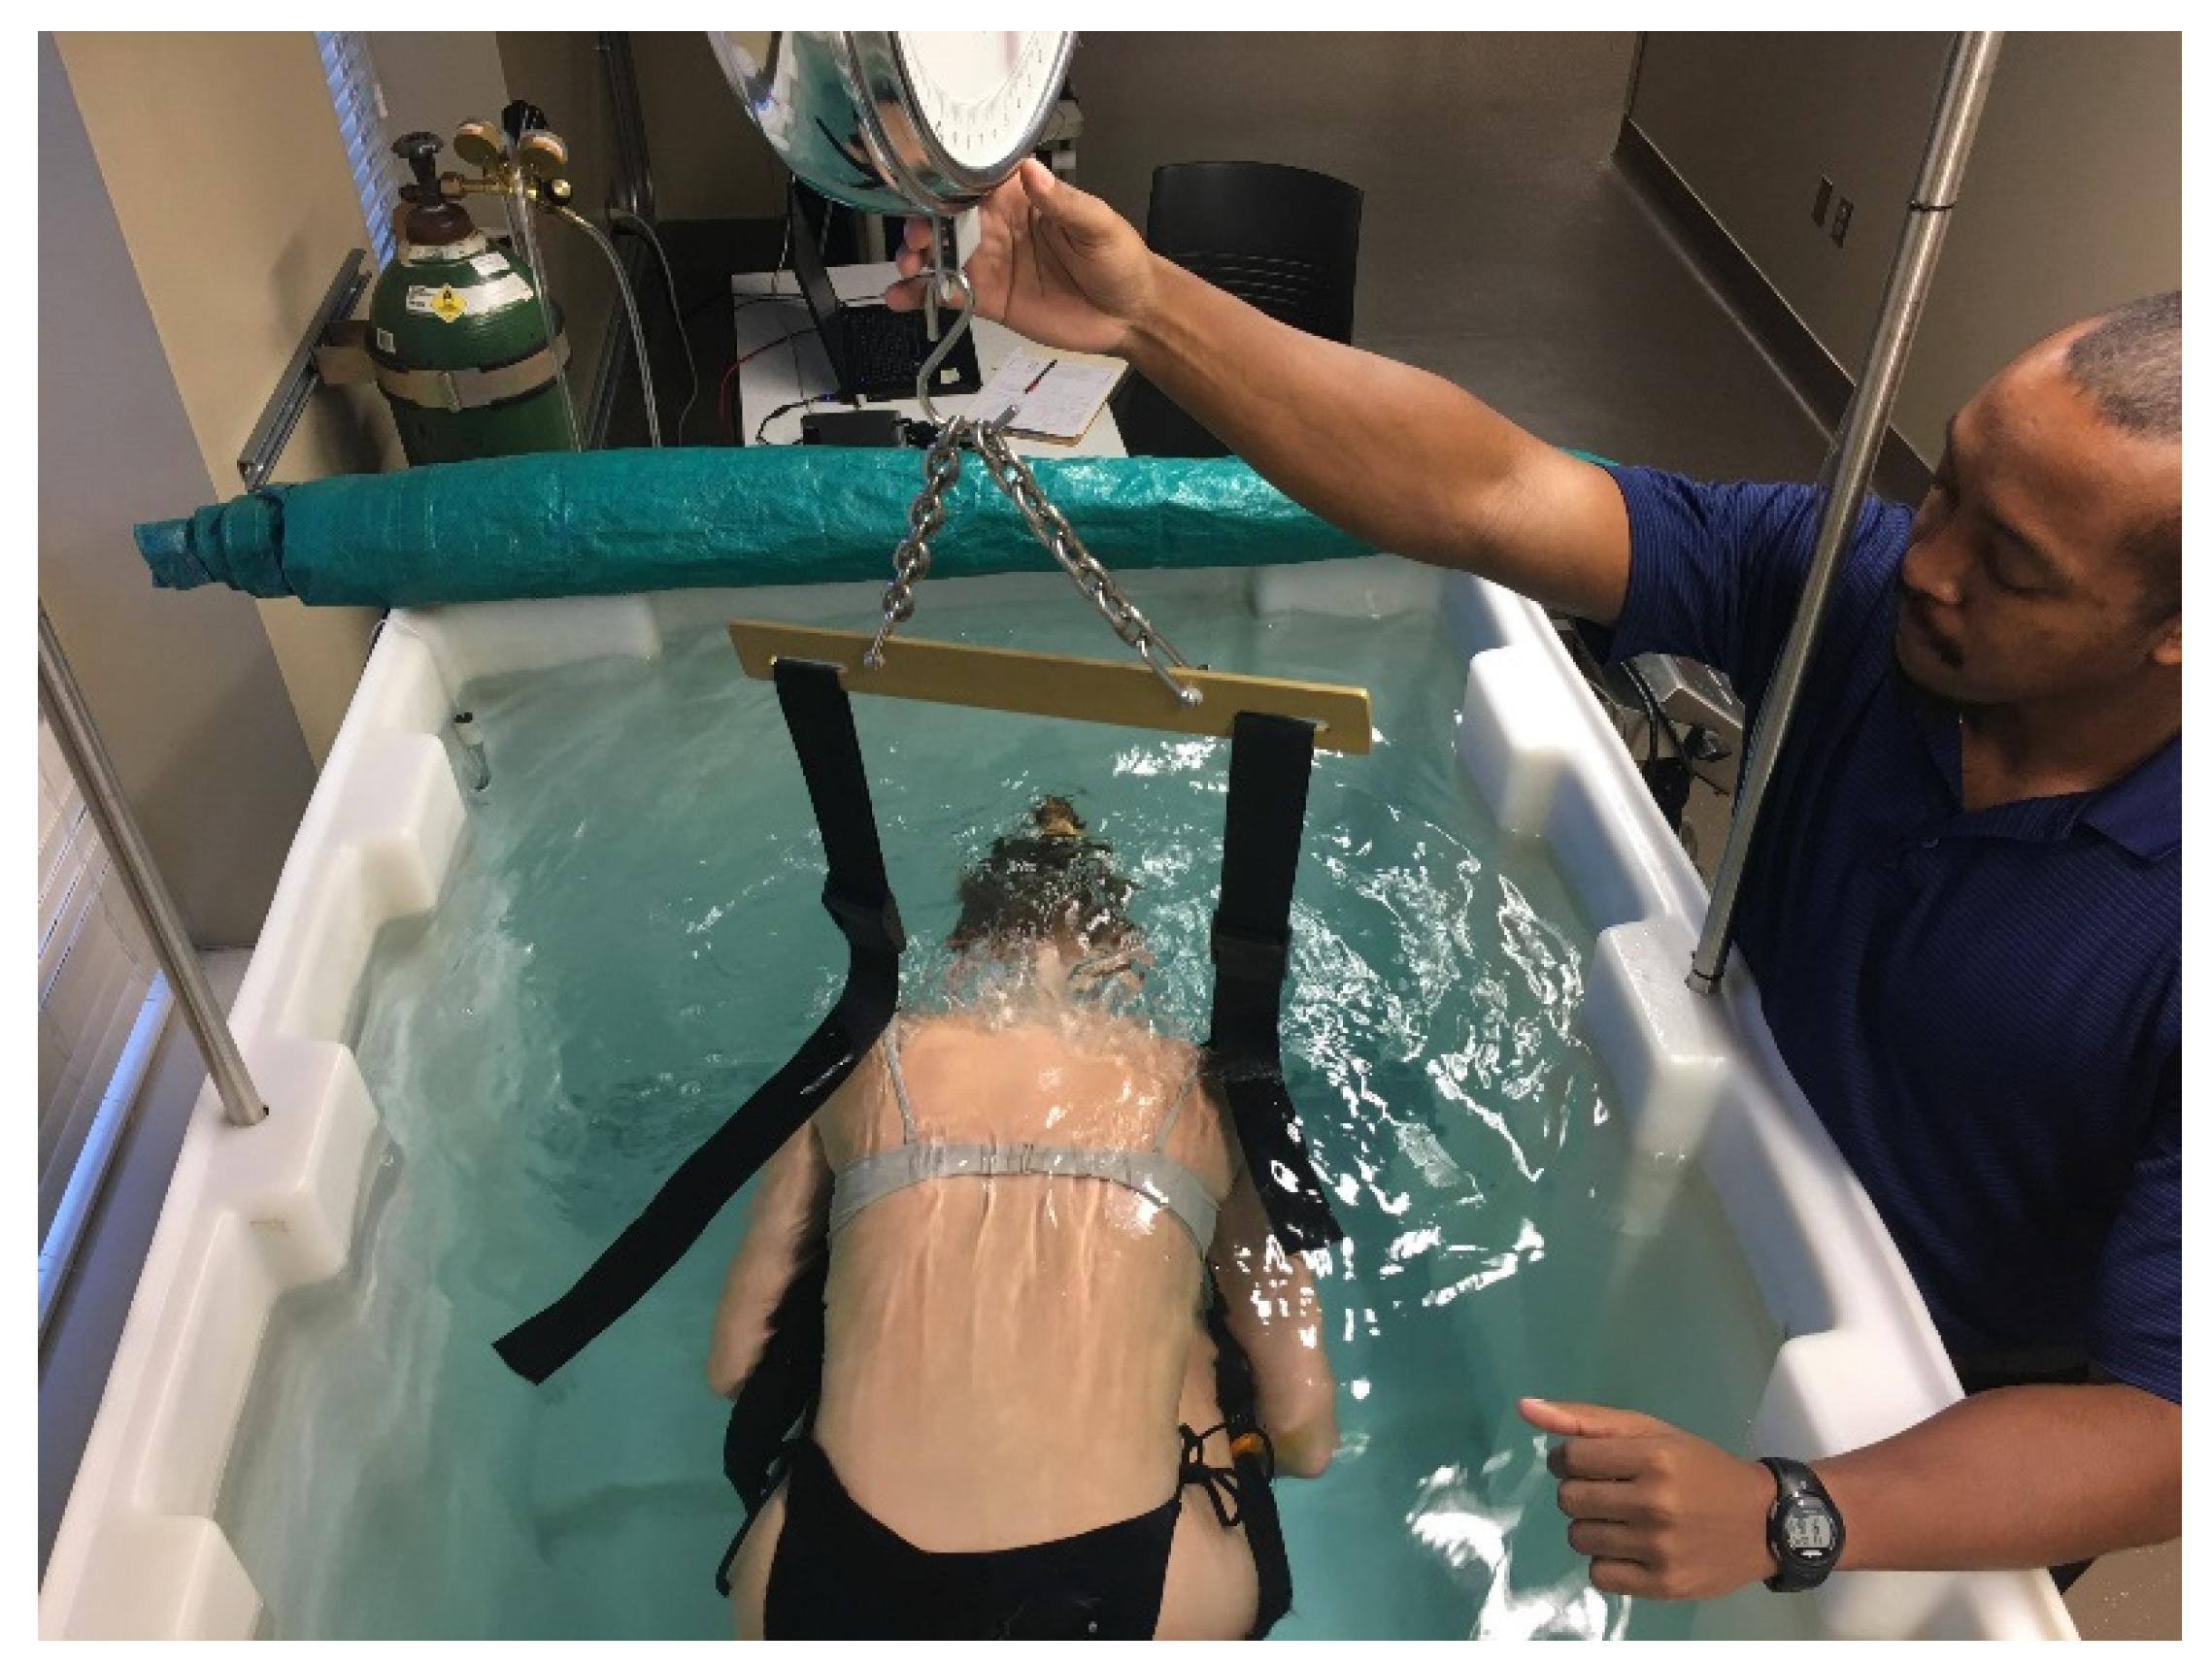
3.9. Hydrostatic Weighing (HW)
4. Practical Applications
5. Conclusions
Author Contributions
Funding
Institutional Review Board Statement
Informed Consent Statement
Data Availability Statement
Conflicts of Interest
References
- World Health Organization. Diet, Nutrition, and the Prevention of Chronic Diseases: Report of a Joint WHO/FAO Expert Consultation; World Health Organization: Geneva, Switzerland, 2003. [Google Scholar]
- Andreoli, A.; Garaci, F.; Cafarelli, F.P.; Guglielmi, G. Body composition in clinical practice. Eur. J. Radiol. 2016, 85, 1461–1468. [Google Scholar] [CrossRef]
- Reber, E.; Gomes, F.; Vasiloglou, M.F.; Schuetz, P.; Stanga, Z. Nutritional risk screening and assessment. J. Clin. Med. 2019, 8, 1065. [Google Scholar] [CrossRef]
- Wharton, S.; Lau, D.C.; Vallis, M.; Sharma, A.M.; Biertho, L.; Campbell-Scherer, D.; Adamo, K.; Alberga, A.; Bell, R.; Boulé, N.; et al. Obesity in adults: A clinical practice guideline. Can. Med. Assoc. J. 2020, 192, E875–E891. [Google Scholar] [CrossRef]
- Kondrup, J.; Allison, S.P.; Elia, M.; Vellas, B.; Plauth, M. ESPEN guidelines for nutrition screening 2002. Clin. Nutr. 2003, 22, 415–421. [Google Scholar] [CrossRef]
- Thibault, R.; Genton, L.; Pichard, C. Body composition: Why, when and for who? Clin. Nutr. 2012, 31, 435–447. [Google Scholar] [CrossRef]
- Donini, L.M.; Savina, C.; Rosano, A.; Cannella, C. Systematic review of nutritional status evaluation and screening tools in the elderly. J. Nutr. Health Aging 2007, 11, 421–432. [Google Scholar] [PubMed]
- Foley, N.C.; Salter, K.L.; Robertson, J.; Teasell, R.W.; Woodbury, M.G. Which reported estimate of the prevalence of malnutrition after stroke is valid? Stroke 2009, 40, e66–e74. [Google Scholar] [CrossRef]
- Srikanthan, P.; Horwich, T.B.; Tseng, C.H. Relation of muscle mass and fat mass to cardiovascular disease mortality. Am. J. Cardiol. 2016, 117, 1355–1360. [Google Scholar] [CrossRef] [PubMed]
- Gomez-Ambrosi, J.; Silva, C.; Galofré, J.C.; Escalada, J.; Santos, S.; Gil, M.J.; Valentí, V.; Rotellar, F.; Ramírez, B.; Salvador, J.; et al. Body adiposity and type 2 diabetes: Increased risk with a high body fat percentage even having a normal BMI. Obesity 2011, 19, 1439–1444. [Google Scholar] [CrossRef] [PubMed]
- Freisling, H.; Arnold, M.; Soerjomataram, I.; O’Doherty, M.G.; Ordóñez-Mena, J.M.; Bamia, C.; Kampman, E.; Leitzmann, M.; Romieu, I.; Kee, F.; et al. Comparison of general obesity and measures of body fat distribution in older adults in relation to cancer risk: Meta-analysis of individual participant data of seven prospective cohorts in Europe. Br. J. Cancer 2017, 116, 1486–1497. [Google Scholar] [CrossRef]
- Bigaard, J.; Frederiksen, K.; Tjonneland, A.; Thomsen, B.L.; Overvad, K.; Heitmann, B.L.; Sørensen, T.I. Body fat and fat-free mass and all-cause mortality. Obes. Res. 2004, 12, 1042–1049. [Google Scholar] [CrossRef]
- Fryar, C.D.; Carroll, M.D.; Afful, J. Prevalence of Overweight, Obesity, and Extreme Obesity among Adults Aged 20 and Over: United States, 1960–1962 through 2011–2014; National Center for Health Statistics Data: Atlanta, GA, USA, 2016; Health E-Stats. Available online: https://www.cdc.gov/nchs/data/hestat/obesity_adult_13_14/obesity_adult_13_14.htm (accessed on 10 May 2020).
- Finkelstein, E.A.; Trogdon, J.G.; Cohen, J.W.; Dietz, W. Annual medical spending attributable to obesity: Payer-and service-specific estimates: Amid calls for health reform, real cost savings are more likely to be achieved through reducing obesity and related risk factors. Health Aff. 2009, 28 (Suppl. 1), w822–w831. [Google Scholar] [CrossRef]
- Dietz, W.; Santos-Burgoa, C. Obesity and its implications for covid-19 mortality. Obesity 2020, 28, 1005. [Google Scholar] [CrossRef]
- Thibault, R.; Pichard, C. The evaluation of body composition: A useful tool for clinical practice. Ann. Nutr. Metab. 2012, 60, 6–16. [Google Scholar] [CrossRef]
- Bélanger, V.; McCarthy, A.; Marcil, V.; Marchand, V.; Boctor, D.L.; Rashid, M.; Noble, A.; Avinashi, V.; Davidson, B.; Groleau, V.; et al. Assessment of malnutrition risk in canadian pediatric hospitals: A multicenter prospective cohort study. J. Pediatr. 2019, 205, 160–167.e6. [Google Scholar] [CrossRef]
- Naber, T.H.; Schermer, T.; De Bree, A.; Nusteling, K.; Eggink, L.; Kruimel, J.W.; Bakkeren, J.; Van Heereveld, H.; Katan, M.B. Prevalence of malnutrition in nonsurgical hospitalized patients and its association with disease complications. Am. J. Clin. Nutr. 1997, 66, 1232–1239. [Google Scholar] [CrossRef]
- Mehta, N.M.; Corkins, M.R.; Lyman, B.; Malone, A.; Goday, P.S.; Carney, L.; Monczka, J.L.; Plogsted, S.W.; Schwenk, W.F. the American Society for Parenteral and Enteral Nutrition (A.S.P.E.N.) Board of Directors. Defining pediatric malnutrition: A paradigm shift toward etiology-related definitions. JPEN J. Parenter Enter. Nutr. 2013, 37, 460–481. [Google Scholar] [CrossRef] [PubMed]
- Pirlich, M.; Schütz, T.; Norman, K.; Gastell, S.; Lübke, H.J.; Bischoff, S.C.; Bolder, U.; Frieling, T.; Güldenzoph, H.; Hahn, K.; et al. The German hospital malnutrition study. Clin. Nutr. 2006, 25, 563–572. [Google Scholar] [CrossRef] [PubMed]
- Amaral, T.F.; Matos, L.C.; Tavares, M.M.; Subtil, A.; Martins, R.; Nazaré, M.; Pereira, N.S. The economic impact of disease-related malnutrition at hospital admission. Clin. Nutr. 2007, 26, 778–784. [Google Scholar] [CrossRef] [PubMed]
- Pichard, C.; Kyle, U.G.; Morabia, A.; Perrier, A.; Vermeulen, B.; Unger, P. Nutritional assessment: Lean body mass depletion at hospital admission is associated with an increased length of stay. Am. J. Clin. Nutr. 2004, 79, 613–618. [Google Scholar] [CrossRef] [PubMed]
- Capuano, G.; Gentile, P.C.; Bianciardi, F.; Tosti, M.; Palladino, A.; Di Palma, M. Prevalence and influence of malnutrition on quality of life and performance status in patients with locally advanced head and neck cancer before treatment. Support. Care Cancer 2010, 18, 433–437. [Google Scholar] [CrossRef] [PubMed]
- Cereda, E.; Pedrolli, C.; Klersy, C.; Bonardi, C.; Quarleri, L.; Cappello, S.; Turri, A.; Rondanelli, M.; Caccialanza, R. Nutritional status in older persons according to healthcare setting: A systematic review and meta-analysis of prevalence data using MNA®. Clin. Nutr. 2016, 35, 1282–1290. [Google Scholar] [CrossRef] [PubMed]
- Sözen, T.; Özışık, L.; Başaran, N.Ç. An overview and management of osteoporosis. Eur. J. Rheumatol. 2017, 4, 46–56. [Google Scholar] [CrossRef] [PubMed]
- Packard, P.T.; Heaney, R.P. Medical nutrition therapy for patients with osteoporosis. J. Am. Diet. Assoc. 1997, 97, 414–417. [Google Scholar] [CrossRef]
- Tucker, K.L. Osteoporosis prevention and nutrition. Curr. Osteoporos. Rep. 2009, 7, 111–117. [Google Scholar] [CrossRef] [PubMed]
- Ganapathy, A.; Nieves, J.W. Nutrition and sarcopenia-what do we know? Nutrients 2020, 12, 1755. [Google Scholar] [CrossRef]
- Prado, C.M.; Lieffers, J.R.; McCargar, L.J.; Reiman, T.; Sawyer, M.B.; Martin, L.; Baracos, V.E. Prevalence and clinical implications of sarcopenic obesity in patients with solid tumours of the respiratory and gastrointestinal tracts: A population-based study. Lancet Oncol. 2008, 9, 629–635. [Google Scholar] [CrossRef]
- Hsu, K.J.; Liao, C.D.; Tsai, M.W.; Chen, C.N. Effects of exercise and nutritional intervention on body composition, metabolic health, and physical performance in adults with sarcopenic obesity: A meta-analysis. Nutrients 2019, 11, 2163. [Google Scholar] [CrossRef]
- van de Worp, W.R.P.H.; Schols, A.M.W.J.; Theys, J.; van Helvoort, A.; Langen, R.C.J. Nutritional interventions in cancer cachexia: Evidence and perspectives from experimental models. Front. Nutr. 2020, 7, 1329. [Google Scholar] [CrossRef]
- Dev, R. Measuring cachexia-diagnostic criteria. Ann. Palliat. Med. 2019, 8, 24–32. [Google Scholar] [CrossRef]
- Gullett, N.P.; Mazurak, V.C.; Hebbar, G.; Ziegler, T.R. Nutritional interventions for cancer-induced cachexia. Curr. Probl. Cancer 2011, 35, 58–90. [Google Scholar] [CrossRef]
- Arends, J.; Baracos, V.; Bertz, H.; Bozzetti, F.; Calder, P.; Deutz, N.; Erickson, N.; Laviano, A.; Lisanti, M.; Lobo, D.; et al. ESPEN expert group recommendations for action against cancer-related malnutrition. Clin. Nutr. 2017, 36, 1187–1196. [Google Scholar] [CrossRef]
- Naumann, P.; Eberlein, J.; Farnia, B.; Liermann, J.; Hackert, T.; Debus, J.; Combs, S.E. Cachectic body composition and inflammatory markers portend a poor prognosis in patients with locally advanced pancreatic cancer treated with chemoradiation. Cancers 2019, 11, 1655. [Google Scholar] [CrossRef]
- Cho, K.H.; Han, E.Y.; Lee, S.A.; Park, H.; Lee, C.; Im, S.H. Feasibility of bioimpedance analysis to assess the outcome of complex decongestive therapy in cancer treatment-related lymphedema. Front. Oncol. 2020, 10, 111. [Google Scholar] [CrossRef] [PubMed]
- Mehrara, B.J.; Greene, A.K. Lymphedema and obesity: Is there a link? Plast. Reconstr. Surg. 2014, 134, 154e–160e. [Google Scholar] [CrossRef] [PubMed]
- Merli, P.; Furnari, R.; Fadda, M.; De Francesco, A.; McConnell, R.; Massazza, G. Role of bioelectrical impedance analysis in the evaluation of patients with upper limb lymphedema. Lymphat. Res. Biol. 2020, 18, 555–559. [Google Scholar] [CrossRef] [PubMed]
- Guest, J.F.; Panca, M.; Baeyens, J.-P.; de Man, F.; Ljungqvist, O.; Pichard, C.; Wait, S.; Wilson, L. Health economic impact of managing patients following a community-based diagnosis of malnutrition in the UK. Clin. Nutr. 2011, 30, 422–429. [Google Scholar] [CrossRef]
- Thibault, R.; Pichard, C. Nutrition and clinical outcome in intensive care patients. Curr. Opin. Clin. Nutr. Metab. Care 2010, 13, 177–183. [Google Scholar] [CrossRef]
- The National Heart. Executive summary of the clinical guidelines on the identification, evaluation, and treatment of overweight and obesity in adults. Arch. Intern. Med. 1998, 158, 1855–1867. [Google Scholar] [CrossRef]
- Tuttle, M.S.; Montoye, A.H.K.; Kaminsky, L.A. The benefits of body mass index and waist circumference in the assessment of health risk. ACSM’s Health Fit. J. 2016, 20, 15–20. [Google Scholar] [CrossRef]
- World Health Organization. Waist Circumference and Waist-Hip Ratio: Report of a WHO Expert Consultation, Geneva, 8–11 December 2008; World Health Organization: Geneva, Switzerland, 2011. [Google Scholar]
- Goodwin, S. The practical guide to the identification, evaluation and treatment of overweight and obesity in adults. Clin. Nurse Spec. 2002, 16, 164. [Google Scholar] [CrossRef][Green Version]
- Jackson, A.S.; Pollock, M.L. Practical assessment of body composition. Phys. Sportsmed. 1985, 13, 76–90. [Google Scholar] [CrossRef] [PubMed]
- Jackson, A.S.; Pollock, M.L. Generalized equations for predicting body density of men. Br. J. Nutr. 1978, 40, 497–504. [Google Scholar] [CrossRef] [PubMed]
- Jackson, A.S.; Pollock, M.L.; Ward, A. Generalized equations for predicting body density of women. Med. Sci. Sports Exerc. 1980, 12, 175–181. [Google Scholar] [CrossRef] [PubMed]
- Siri, W.E. Body composition from fluid spaces and density: Analysis of methods. Nutrition 1961, 9, 480–491. [Google Scholar]
- Brozek, J.; Grande, F.; Anderson, J.T.; Keys, A. Densitometric analysis of body composition: Revision of some quantitative assumptions Ann. N. Y. Acad. Sci. 1963, 110, 113–140. [Google Scholar] [CrossRef]
- Heyward, V.H.; Wagner, D.R. Applied Body Composition Assessment; Human Kinetics: Champaign, IL, USA, 2004. [Google Scholar]
- Heymsfield, S.; Lohman, T.; Wang, Z.; Going, S.B. Human Body Composition; Human Kinetics: Champaign, IL, USA, 2005; Volume 918. [Google Scholar]
- Campa, F.; Toselli, S.; Mazzilli, M.; Gobbo, L.A.; Coratella, G. Assessment of body composition in athletes: A narrative review of available methods with special reference to quantitative and qualitative bioimpedance analysis. Nutrients 2021, 13, 1620. [Google Scholar] [CrossRef]
- Anderson, L.J.; Erceg, D.N.; Schroeder, E.T. Utility of multifrequency bioelectrical impedance compared with dual-energy x-ray absorptiometry for assessment of total and regional body composition varies between men and women. Nutr. Res. 2012, 32, 479–485. [Google Scholar] [CrossRef]
- Moon, J.R.; Stout, J.R.; Smith-Ryan, A.E.; Kendall, K.L.; Fukuda, D.H.; Cramer, J.T.; Moon, S.E. Tracking fat-free mass changes in elderly men and women using single-frequency bioimpedance and dual-energy X-ray absorptiometry: A four-compartment model comparison. Eur. J. Clin. Nutr. 2013, 67 (Suppl. 1), S40–S46. [Google Scholar] [CrossRef]
- Neovius, M.; Hemmingsson, E.; Freyschuss, B.; Uddén, J. Bioelectrical impedance underestimates total and truncal fatness in abdominally obese women. Obesity 2006, 14, 1731–1738. [Google Scholar] [CrossRef]
- Gába, A.; Kapuš, O.; Cuberek, R.; Botek, M. Comparison of multi- and single-frequency bioelectrical impedance analysis with dual-energy X-ray absorptiometry for assessment of body composition in post-menopausal women: Effects of body mass index and accelerometer-determined physical activity. J. Hum. Nutr. Diet. 2015, 28, 390–400. [Google Scholar] [CrossRef]
- Chen, K.-T.; Chen, Y.-Y.; Wang, C.-W.; Chuang, C.-L.; Chiang, L.-M.; Lai, C.-L.; Lu, H.-K.; Dwyer, G.B.; Chao, S.-P.; Shih, M.-K.; et al. Comparison of standing posture bioelectrical impedance analysis with dxa for body composition in a large, healthy chinese population. PLoS ONE 2016, 11, e0160105. [Google Scholar] [CrossRef]
- Lukaski, H.C.; Siders, W.A. Validity and accuracy of regional bioelectrical impedance devices to determine whole-body fatness. Nutrition 2003, 19, 851–857. [Google Scholar] [CrossRef]
- Stone, T.; Wingo, J.; Nickerson, B.; Esco, M. Comparison of bioelectrical impedance analysis and dual-energy x-ray absorptiometry for estimating bone mineral content. Int. J. Sport Nutr. Exerc. Metab. 2018, 28, 1–16. [Google Scholar] [CrossRef] [PubMed]
- LaForgia, J.; Gunn, S.; Withers, R.T. Body composition: Validity of segmental bioelectrical impedance analysis. Asia Pac. J. Clin. Nutr. 2008, 17, 586–591. [Google Scholar]
- Nickerson, B.S.; Tinsley, G.M. Utilization of bia-derived bone mineral estimates exerts minimal impact on body fat estimates via multicompartment models in physically active adults. J. Clin. Densitom. 2018, 21, 541–549. [Google Scholar] [CrossRef] [PubMed]
- Kyle, U.G.; Bosaeus, I.; De Lorenzo, A.D.; Deurenberg, P.; Elia, M.; Gómez, J.M.; Heitmann, B.L.; Kent-Smith, L.; Melchior, J.-C.; Pirlich, M.; et al. Bioelectrical impedance analysis-part II: Utilization in clinical practice. Clin. Nutr. 2004, 23, 1430–1453. [Google Scholar] [CrossRef] [PubMed]
- Tinsley, G.M.; Moore, M.L.; Benavides, M.L.; Dellinger, J.R.; Adamson, B.T. 3-Dimensional optical scanning for body composition assessment: A 4-component model comparison of four commercially available scanners. Clin. Nutr. 2020, 39, 3160–3167. [Google Scholar] [CrossRef]
- Dempster, P.; Aitkens, S. A new air displacement method for the determination of human body composition. Med. Sci. Sports Exerc. 1995, 27, 1692–1697. [Google Scholar] [CrossRef]
- Vescovi, J.D.; Hildebrandt, L.; Miller, W.; Hammer, R.; Spiller, A. Evaluation of the BOD POD for estimating percent fat in female college athletes. J. Strength Cond. Res. 2002, 16, 599–605. [Google Scholar]
- Bentzur, K.M.; Kravitz, L.; Lockner, D.W. Evaluation of the BOD POD for estimating percent body fat in collegiate track and field female athletes: A comparison of four methods. J. Strength Cond. Res. 2008, 22, 1985–1991. [Google Scholar] [CrossRef]
- Vescovi, J.D.; Zimmerman, S.L.; Miller, W.C.; Hildebrandt, L.; Hammer, R.L.; Fernhall, B. Evaluation of the BOD POD for estimating percentage body fat in a heterogeneous group of adult humans. Eur. J. Appl. Physiol. 2001, 85, 326–332. [Google Scholar] [CrossRef]
- Liao, Y.-S.; Li, H.-C.; Lu, H.-K.; Lai, C.-L.; Wang, Y.-S.; Hsieh, K.-C. Comparison of bioelectrical impedance analysis and dual energy x-ray absorptiometry for total and segmental bone mineral content with a three-compartment model. Int. J. Environ. Res. Public Health 2020, 17, 2595. [Google Scholar] [CrossRef] [PubMed]
- Pietrobelli, A.; Formica, C.; Wang, Z.; Heymsfield, S.B. Dual-energy x-ray absorptiometry body composition model: Review of physical concepts. Am. J. Physiol. 1996, 271 Pt 1, E941–E951. [Google Scholar] [CrossRef]
- Moon, J.R. Body composition in athletes and sports nutrition: An examination of the bioimpedance analysis technique. Eur. J. Clin. Nutr. 2013, 67 (Suppl. 1), S54–S59. [Google Scholar] [CrossRef] [PubMed]
- Forslund, A.H.; Johansson, A.G.; Sjödin, A.; Bryding, G.; Ljunghall, S.; Hambraeus, L. Evaluation of modified multicompartment models to calculate body composition in healthy males. Am. J. Clin. Nutr. 1996, 63, 856–862. [Google Scholar] [CrossRef]
- MacDonald, A.J.; Greig, C.A.; Baracos, V. The advantages and limitations of cross-sectional body composition analysis. Curr. Opin. Support. Palliat. Care 2011, 5, 342–349. [Google Scholar] [CrossRef] [PubMed]
- Smith, S.; Madden, A.M. Body composition and functional assessment of nutritional status in adults: A narrative review of imaging, impedance, strength and functional techniques. J. Hum. Nutr. Diet. 2016, 29, 714–732. [Google Scholar] [CrossRef]
- Heymsfield, S.; Ross, R.; Wang, Z.; Frager, D. Imaging techniques of body composition: Advantages of measurement and new uses. In Emerging Technologies for Nutrition Research: Potential for Assessing Military performance Capability; Carlson-Newberry, S.J., Costello, R.B., Eds.; Institute of Medicine (US) Committee on Military Nutrition Research: Washington, DC, USA, 1997; pp. 127–150. [Google Scholar]


| Weight Status Classification | Body Mass Index (kg/m2) | |
|---|---|---|
| Underweight | <18.5 | |
| Severe Thinness | <16.0 | |
| Moderate Thinness | 16.0 to 16.9 | |
| Mild Thinness | 17.0 to 18.4 | |
| Normal weight | 18.5 to 24.9 | |
| Overweight | 25.0 to 29.9 | |
| Obese, Class I | 30.0 to 34.9 | |
| Obese, Class II | 35.0 to 39.9 | |
| Obese, Class III | ≥40.0 | |
| Waist Classifications | Waist Circumference | |
| Risk Classification | Women | Men |
| Normal | <32 in. (80 cm) | <37 in. (94 cm) |
| Increased | ≥32 in. (80 cm) | ≥37 in. (94 cm) |
| Substantially increased | ≥35 in. (88 cm) | ≥40 in. (102 cm) |
| Assessment Method | Equipment Needed | Time Needed for Assessment | Pros | Cons |
|---|---|---|---|---|
| Body Mass Index (BMI) |
| ≤3 min |
|
|
| Circumferences |
| ≤5 min |
|
|
| Skinfolds (SKF) |
| 10–20 min |
|
|
| Bioelectrical Impedance Analysis (BIA) |
| ≤5 min |
|
|
| Digital Image Analysis |
| 1–2 min |
|
|
| Air Displacement Plethysmography (ADP) |
| ≤10 min |
|
|
| Dual-Energy X-ray Absorptiometry (DXA) |
| 10–30 min |
|
|
| Computed Tomography (CT) |
| variable (depends on regions being scanned) |
|
|
| Magnetic Resonance Imaging (MRI) |
| variable (depends on regions being scanned) |
|
|
| Hydrostatic Weighing (HW) |
| 30–45 min |
|
|
Publisher’s Note: MDPI stays neutral with regard to jurisdictional claims in published maps and institutional affiliations. |
© 2021 by the authors. Licensee MDPI, Basel, Switzerland. This article is an open access article distributed under the terms and conditions of the Creative Commons Attribution (CC BY) license (https://creativecommons.org/licenses/by/4.0/).
Share and Cite
Holmes, C.J.; Racette, S.B. The Utility of Body Composition Assessment in Nutrition and Clinical Practice: An Overview of Current Methodology. Nutrients 2021, 13, 2493. https://doi.org/10.3390/nu13082493
Holmes CJ, Racette SB. The Utility of Body Composition Assessment in Nutrition and Clinical Practice: An Overview of Current Methodology. Nutrients. 2021; 13(8):2493. https://doi.org/10.3390/nu13082493
Chicago/Turabian StyleHolmes, Clifton J., and Susan B. Racette. 2021. "The Utility of Body Composition Assessment in Nutrition and Clinical Practice: An Overview of Current Methodology" Nutrients 13, no. 8: 2493. https://doi.org/10.3390/nu13082493
APA StyleHolmes, C. J., & Racette, S. B. (2021). The Utility of Body Composition Assessment in Nutrition and Clinical Practice: An Overview of Current Methodology. Nutrients, 13(8), 2493. https://doi.org/10.3390/nu13082493