Abstract
We set up a series of school-based interventions on the basis of an ecological model targeting sugar-sweetened beverage (SSB) reduction in Chinese elementary and middle schools and evaluated the effects. A total of 1046 students from Chinese elementary and middle schools were randomly recruited in an intervention group, as were 1156 counterparts in a control group. The interventions were conducted in the intervention schools for one year. The participants were orally instructed to answer all the questionnaires by themselves at baseline and after intervention. The difference in difference statistical approach was used to identify the effects exclusively attributable to the interventions. There were differences in grade composition and no difference in sex distribution between the intervention and control groups. After adjusting for age, sex, and group differences at baseline, a significant reduction in SSB intake was found in the intervention group post intervention, with a decrease of 35.0 mL/day (p = 0.034). Additionally, the frequency of SSB consumption decreased by 0.2 times/day (p = 0.071). The students in the elementary schools with interventions significantly reduced their SSB intake by 61.6 mL/day (p = 0.002) and their frequency of SSB consumption by 0.3 times/day (p = 0.017) after the intervention. The boys in the intervention group had an intervention effect of a 50.2 mL/day reduction in their SSB intake (p = 0.036). School-based interventions were effective in reducing SSB consumption, especially among younger ones. The boys were more responsive to the interventions than the girls. (ChiCTR, ChiCTR1900020781.)
1. Introduction
Each year, sugar-sweetened beverage (SSB) intake is related to the loss of about 8.5 million disability-adjusted life years (DALYs), and three quarters of this burden occurs in low- and middle-income countries [1]. SSBs were defined as nonalcoholic beverages sweetened by sugar, such as carbonated beverages, sugar-sweetened fruit or vegetable juice beverages, etc. The frequent consumption of excess amounts of SSBs is a risk factor for obesity [2], type 2 diabetes [3], cardiovascular disease [4], and dental caries [5]. The potential pathophysiology of SSB consumption explained the unfavorable health outcomes linked to SSBs. SSBs contain energy but no micro- and macronutrients, except glucose and fructose. Excessive glucose intake is known for causing adverse glycemic effects on metabolism [6], and fructose can be converted into fat, unfettered by the cellular controls that prevent unrestrained lipid synthesis from glucose [7]. The adverse health outcomes linked to SSBs occur in both adults and children [8,9]. Behavioral factors such as diet linked to mortality causes are preventable and both shape and are shaped by the social environment [10]. Studies have shown that interventions can achieve favorable results in reducing SSB intake in children but not in adults [11]. It is possible that interventions might have effects on individuals who were before or at their behavioral development period rather than those already forming behavioral models.
Comprehensive school-based program achieved some changes on dietary intakes of students [12,13]. School-based interventions aiming at decreasing SSB consumption have shown promising results in previous Western studies [14]. More than half of the children and adolescents in China consumed SSB, and the increasing consumption of SSBs has created the obvious threat of obesity among Chinese children and adolescents [15,16]. However, there has been no study reporting evaluations of school-based interventions tackling SSB reduction in China. Considering the different environmental and cultural backgrounds compared to Western countries, we set up a series of school-based interventions on the basis of an ecological model targeting SSB reduction in Chinese elementary and middle schools and evaluated the effects on SSB reduction among Chinese children and adolescents.
2. Materials and Methods
2.1. Study Population
We adopted epidemiological methods to establish a parallel control group intervention experiment for one year, from February 2019 to January 2020, in Shanghai, China. Three elementary schools and two middle schools were randomly recruited into the intervention group, and the same number of adjacent counterparts into the control group. Students in the 3rd and 4th grades from the selected elementary schools and the 6th and 7th grades from the selected middle schools were enrolled into the intervention or control group according to their school’s allocation. The participants were not informed of which group they were assigned.
The theoretical minimum sample size was 1051 for the intervention and control groups, respectively, following the formula of sample size calculation for experiments with comparisons between two different groups:
n = [(Zα/2 + Zβ)S/δ]2
We set α = 0.05 and β = 0.10. S represented standard deviation of SSB intake, andδ represented allowance error.
We decided to select 220 students in each grade of a school and a total of 1100 students in both the intervention and control groups. After enrollment, 1082 and 1259 students were in the intervention and control groups, respectively. By eliminating the students lost to follow up, there were 1046 in the intervention group and 1156 in the control group (Figure 1).
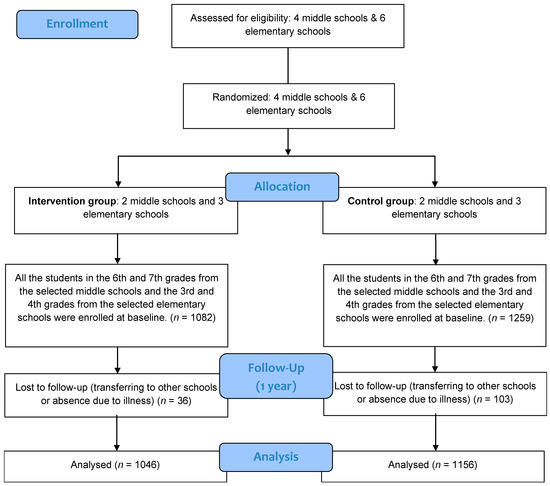
Figure 1.
Flow chart of subjects throughout the research.
This study was approved by the Shanghai Municipal Center for Disease Control on 17 May 2017 (No. 2017-18). Informed consent was obtained from each participant or the participant’s parents or guardian before the research. The study complied with the code of ethics of the World Medical Association (Declaration of Helsinki). This intervention study was registered at the Chinese Clinical Trial Registry (http://www.chictr.org.cn, accessed on 7 April 2021) with the registration number of ChiCTR1900020781 (http://www.chictr.org.cn/showproj.aspx?proj=35002, accessed on 19 January 2019).
2.2. SSB Intake, Frequency, and Knowledge Assessment
The investigators were public health doctors in local community health centers and received a standard training course on the facilitation of the questionnaires. The participants were orally instructed to answer all the questionnaires by themselves. The investigators verified the answers after each questionnaire was completed.
The information collected at the baseline and post one-year intervention were both at the interval between January to February, just before and after the complete one-year intervention period.
A general questionnaire was used to obtain demographic information and SSB-related knowledge. There were six questions related to SSB consumption and health which were used to assess the SSB-related knowledge of the participants. The participant received one point if they gave the right answer. A full score was six. The six questions were as follows:
- I am not going to get fat if I consume SSBs frequently.
- SSBs contain many nutrients.
- SSBs are the best choice for quenching my thirst.
- I should not have even one sip of an SSB.
- SSBs bring the body extra energy because the sugar in it can be easily absorbed but they hardly make one feel full.
- SSBs have empty energy that will not pose a threat to health.
An SSB frequency questionnaire was administrated to collect information on SSB intake and frequency in the past 3 months. This questionnaire originated from a former food frequency questionnaire that was developed and validated by the China Center for Disease and Control and Prevention [17]. SSBs were defined as nonalcoholic beverages sweetened by sugar, excluding fresh juice, categorized as carbonated beverages, sugar-sweetened fruit or vegetable juice beverages, protein-based beverages, probiotic beverages, milk-based beverages, bottled tea beverages, coffee drink, and typical Southeast Asian milky tea (a popular SSB in China). According to each SSB category, SSB consumption frequency was listed in terms of consumption times per day, week, month, or year, and the amount consumed each time was recorded.
The survey was conducted in the pre- and post-intervention periods using the same questionnaires. No disastrous events such as rain or snow disasters that would have affected the normal food supply took place during the research period. The weather was typical of the marine climate in Shanghai, China.
2.3. Interventions
The interventions were designed using the structures of an ecological model targeting individuals and their environment, including multiple levels of influence [18]. The interventions were conducted for one year by the teachers in the intervention schools with the collaboration of public health doctors in local community health centers. The control schools had no intervening events. All the participating schools followed the city-wide education schedule during the intervention period.
- Individual level
- ■
- Hold “restricting SSBs”-themed class meeting every semester (twice a year) and praise students with outstanding health behaviors (the themed class meeting was designed to provide SSB-related knowledge regarding the six questions about SSB-related knowledge in the questionnaire).
- ■
- Distribute SSB-related knowledge materials every semester (twice a year).
- ■
- Record one’s own SSB behaviors once per week.
- Family level
- ■
- Establish WeChat (the most popular social communication application in China) groups for parents and publish new media promotional materials once a month.
- Peer level
- ■
- Distribute promotional cards to students every semester (twice a year; the cards showed cartoon figures and information regarding the six questions on SSB-related knowledge in the questionnaire, as well as mottos and goals for the new semester).
- School level
- ■
- Carry out a blackboard painting activity with the theme of “understanding SSBs” every semester (twice a year).
- ■
- Forbid selling SSBs on campus during the intervention.
- Community level
- ■
- Negotiate with stores near the gates of schools not to sell SSBs to students.
2.4. Statistical Analyses
Statistical analyses were conducted using the SAS statistical software (v. 9.4; SAS Institute, Cary, NC, USA). The comparisons were conducted between the participants in the same level of different schools, different groups and pre and post intervention. T tests were applied to determine the differences between the intervention and control groups pre and post intervention. The difference in difference (DID) statistical approach was used to identify the net effects exclusively attributable to the interventions in this study [19]. The DID approach was designed for quasi-experimental research studying causal relationships in public health settings where randomized controlled trials (RCTs) are infeasible or unethical. In the current analysis of DID, an interactive item of the variate representing group classification and a variate representing pre- or post-intervention classification was included in the multivariate general linear regression models, representing the intervention effect. Age, sex, and the variates mentioned above were included in the same models as covariates. A two-sided p < 0.05 was considered to indicate statistical significance.
3. Results
3.1. Characteristics of the Participants
At baseline, 1082 subjects were recruited in the intervention group and 1259 subjects in the control group. At one-year follow-up, 1046 remained in the intervention group and 1156 in the control group. The retention rates were 96.7% and 91.8% in the intervention and control groups, respectively. Differences in sex distribution were not observed between the two groups either pre or post intervention. The differences in grade composition were significant between the groups both pre and post intervention (Table 1).

Table 1.
Characteristics of the participants pre and post intervention (%).
3.2. Differences in SSB Intake, Frequency, and Knowledge between the Groups pre and Post Intervention
At baseline, the SSB intakes were 286.0 ± 266.5 mL/day and 286.0 ± 288.2 mL/day in the intervention and control groups, respectively. The frequencies of SSB consumption were 1.6 ± 1.6 times/day and 1.7 ± 1.9 times/day, respectively. The scores for SSB-related knowledge were 4.3 ± 1.2 and 4.5 ± 1.0, respectively. There was no difference in the SSB intake and frequency of SSB consumption between the two groups and their subgroups (p > 0.05). The scores for SSB-related knowledge were significantly different between the two groups (p < 0.001).
After the one-year intervention, the SSB intakes were 220.9 ± 262.3 mL/day and 254.4 ± 268.9 mL/day in the intervention and control groups, respectively. The frequencies of SSB consumption were 1.1 ± 1.5 times/day and 1.4 ± 1.7 times/day, respectively. The scores for SSB-related knowledge were 4.4 ± 1.3 and 4.5 ± 1.1, respectively. Significant differences existed in the SSB intake and the frequency of SSB consumption between groups (p = 0.003, p < 0.001). The scores for SSB-related knowledge showed no statistical difference between the groups (p = 0.060) (Table 2).
Table 2.
The differences in SSB intake, frequency, and knowledge between the groups pre and post intervention.
3.3. The Effects on SSB Intake, Frequency, and Knowledge Attributed to the Interventions
After adjusting for age, sex, and group differences at baseline, a significant reduction in SSB intake which was exclusively attributed to the interventions was found in the intervention group post intervention, with a decrease of 35.0 mL/day (p = 0.034). Additionally, the frequency of SSB consumption decreased by 0.2 times/day, with a borderline significance (p = 0.071), due to the intervention. No statistically significant effect was found in the score for SSB-related knowledge after the intervention (p = 0.347).
After intervention, the participants in the elementary schools with the intervention significantly reduced their SSB intake by 61.6 mL/day (p = 0.017) and their frequency of SSB consumption by 0.3 time/day (p = 0.002), but no changes were observed in the SSB intake and frequency of SSB consumption among those from middle schools with the intervention (p = 0.945 and p = 0.978, respectively). The boys in the intervention group had an intervention effect of a 50.2 mL/day reduction in SSB intake (p = 0.036), while the girls presented no significant intervention effect in SSB intake (p = 0.403) (Table 3).
Table 3.
The effects attributable to the interventions on SSB intake, frequency, and knowledge after the one-year intervention a.
4. Discussion
In the current study, the one-year school-based interventions achieved favorable effects in reducing SSB consumption among Chinese children and adolescents. Regarding the feasibility of the intervention implemented, each participant was not assigned randomly into an intervention or control group. Actually, the participants were allocated indiscriminately into interventions or control groups according to their school’s allocation in the study. Moreover, other citywide health promotion events at the time or the underlying natural growth of individuals might have affected their SSB consumption as well. All these factors made it difficult to identify the effects exclusively attributed to the current interventions. The DID approach provided an alternative means for us to study the net effects on the SSB consumption changes which were exclusively attributable to the interventions [19,20]. After adjusting for age, sex, and group differences at baseline, we discovered a substantial scale of SSB reduction attributable to the interventions in this study. The school stood out as one of the most common settings to improve health behaviors [21]. Previous studies indicated that Western school-based interventions were promising to reduce SSB consumption [14]. Our results give more evidence regarding school-based interventions in the setting of an Eastern culture and environment. The current results also supported the theory that the ecological model helped to develop an environment conducive to change, facilitating the adoption of healthy behaviors [22].
We found that the beneficial effects occurred among the younger children rather than the adolescents in the current study. Both the amount and the frequency of SSB consumption reduced after the one-year intervention, while SSB-related knowledge also increased modestly among the younger children. However, there was no obvious change in the amount and the frequency of SSB consumption and SSB-related knowledge among the participants in the middle schools between pre- and post-intervention. These findings coincided with previous studies showing that interventions focusing on SSB control are more effective on younger children than older ones [23,24]. This also suggests that future interventions or policies aiming at reducing SSBs should target younger children in order to achieve more favorable cost-effective outcomes.
We observed that the consumption of SSBs decreased in the boy participants but not in the girl participants. In the current study, the consumption of SSBs was discrepant at baseline in that the boys consumed more SSBs than the girls no matter whether they were in the intervention or control group. Boys had a higher preference for SSBs and consumed more SSBs than girls in their daily lives [15,25,26]. This might explain the significant effects on the boys after the intervention while there were hardly any effects on the girls in our study. Furthermore, the prevalence of overweight and obesity is much higher in boys than in girls in China [27]. The discrepancies between boys and girls in terms of intervention effects should be taken into consideration when conceiving obesity control strategies among children and adolescents.
In this study, we failed to discover enough evidence of improvement in SSB-related knowledge among our participants through the interventions. Only a modest increase in knowledge score that was of borderline significance (p = 0.066) occurred among the participants in the elementary schools with the intervention. In the current interventions, we provided SSB-related knowledge through routine school activities to the students and electronic messages to their parents, which aimed to set up supportive environments for SSB restriction. Previous studies showed that knowledge was not associated with SSB behaviors among children [28]. Other factors such as parental health behavior might determine SSB consumption among children [29,30]. Parental modelling was more crucial to children’s behavioral development [31]. These might be the reasons why the behavior of SSB consumption changed but the SSB-related knowledge remained unimproved among the participants after the intervention in our study.
A limitation of this study was the methodology used to assess SSB intake and frequency. We designed an SSB consumption questionnaire to obtain SSB intake and frequency, which were self-reported by the participants, thus the data on SSB intake and frequency were limited by the accuracy of participants’ estimation and recall. Furthermore, although we adjusted for potential confounding factors, we did not treat dietary intake as one of the confounders under the limitation of data collection. This might have caused bias in the current results. Besides this, the investigators were not blinded to the allocation of schools as intervention and control. This awareness of the investigators might have caused data collection bias. Finally, it was possible that some of the six questions used to assess the SSB-related knowledge were beyond the understanding of the students, which might have influenced our assessment of the SSB-related knowledge change.
5. Conclusions
School-based interventions designed in an ecological model were effective in the reduction in SSB consumption among Chinese children and adolescents, especially among younger children. The boys were more responsive to the interventions than the girls.
Author Contributions
Z.Z. conceived and designed the experiments; S.Q. and C.L. performed the experiments; Z.Z. analyzed the data; X.W., J.F., and S.Z. interpreted the statistical results; X.W., J.F., and Y.W. wrote the draft paper; Z.Z. wrote the paper and the final version of the manuscript; J.S. supervised the study. All authors have read and agreed to the published version of the manuscript.
Funding
This study was funded by the Study of Diet and Nutrition Assessment and Intervention Technology (No.2020YFC2006300) from Active Health and Aging Technologic Solutions Major Project of National Key R&D Program—Intervention Strategies of Main Nutrition Problems in China (No.2020YFC2006305); Shanghai Municipal Health Commission—Academic Leader Program (GWV-10.2-XD12); the Foundation of Shanghai Municipal Health Commission (201740073); and the Youth Nutrition Elite Development Program of Chinese Nutrition Society.
Institutional Review Board Statement
The study was conducted in accordance with the Declaration of Helsinki, and the protocol was approved by the Shanghai Municipal Center for Disease Control on 17 May 2017 (No. 2017-18).
Informed Consent Statement
Informed consent was obtained from all subjects involved in the study.
Data Availability Statement
The datasets used and analyzed in the current study are available from the corresponding author on reasonable request.
Acknowledgments
We are grateful to all the individuals who participated in this study. We also thank the teachers from the participating schools as well as the public health doctors at the local districts’ Centers for Disease Control and Prevention and the local community health centers for their assistance with the intervention implementation and data collection.
Conflicts of Interest
The authors declare no conflict of interest. The founding sponsors had no role in the design of the study; in the collection, analyses, or interpretation of data; in the writing of the manuscript, and in the decision to publish the results.
Abbreviations
SSB, sugar-sweetened beverage; DALYs, disability-adjusted life years; DID, difference in difference; RCTs, randomized controlled trials.
References
- Singh, G.M.; Micha, R.; Khatibzadeh, S.; Lim, S.; Ezzati, M.; Mozaffarian, D.; Global, B.O.D.N. Estimated global, regional, and national disease burdens related to Sugar-Sweetened beverage consumption in 2010. Circulation 2015, 132, 639–666. [Google Scholar] [CrossRef]
- Malik, V.S.; Hu, F.B. Fructose and cardiometabolic health: What the evidence from Sugar-Sweetened beverages tells us. J. Am. Coll. Cardiol. 2015, 66, 1615–1624. [Google Scholar] [CrossRef]
- Imamura, F.; O’Connor, L.; Ye, Z.; Mursu, J.; Hayashino, Y.; Bhupathiraju, S.N.; Forouhi, N.G. Consumption of sugar sweetened beverages, artificially sweetened beverages, and fruit juice and incidence of type 2 diabetes: Systematic review, meta-analysis, and estimation of population attributable fraction. BMJ 2015, 351, h3576. [Google Scholar] [CrossRef]
- Vos, M.B.; Kaar, J.L.; Welsh, J.A.; Van Horn, L.V.; Feig, D.I.; Anderson, C.A.M.; Patel, M.J.; Cruz Munos, J.; Krebs, N.F.; Xanthakos, S.A.; et al. Added sugars and cardiovascular disease risk in children: A scientific statement from the american heart association. Circulation 2017, 135, e1017–e1034. [Google Scholar] [CrossRef]
- Bleich, S.N.; Vercammen, K.A. The negative impact of sugar-sweetened beverages on children’s health: An update of the literature. BMC Obes. 2018, 5, 6. [Google Scholar] [CrossRef] [PubMed]
- Samanta, A.; Burden, A.C.; Jones, G.R. Plasma glucose responses to glucose, sucrose, and honey in patients with diabetes mellitus: An analysis of glycaemic and peak incremental indices. Diabet Med. 1985, 2, 371–373. [Google Scholar] [CrossRef]
- Lyssiotis, C.A.; Cantley, L.C. Metabolic syndrome: F stands for fructose and fat. Nature 2013, 502, 181–182. [Google Scholar] [CrossRef] [PubMed]
- Zhu, Z.; He, Y.; Wang, Z.; He, X.; Zang, J.; Guo, C.; Jia, X.; Ren, Y.; Shan, C.; Sun, J.; et al. The associations between sugar-sweetened beverage intake and cardiometabolic risks in Chinese children and adolescents. Pediatr Obes. 2020, 15, e12634. [Google Scholar] [CrossRef] [PubMed]
- Shin, S.; Kim, S.; Ha, J.; Lim, K. Sugar-Sweetened Beverage Consumption in Relation to Obesity and Metabolic Syndrome among Korean Adults: A Cross-Sectional Study from the 2012–2016 Korean National Health and Nutrition Examination Survey (KNHANES). Nutrients 2018, 10, 1467. [Google Scholar] [CrossRef]
- Smedley, B.D.; Syme, S.L. Promoting health: Intervention strategies from social and behavioral research. Am. J. Health Promot. 2001, 15, 149–166. [Google Scholar] [CrossRef] [PubMed]
- Vargas-Garcia, E.J.; Evans, C.E.L.; Prestwich, A.; Sykes-Muskett, B.J.; Hooson, J.; Cade, J.E. Interventions to reduce consumption of sugar-sweetened beverages or increase water intake: Evidence from a systematic review and meta-analysis. Obes Rev. 2017, 18, 1350–1363. [Google Scholar] [CrossRef]
- Siega-Riz, A.M.; El Ghormli, L.; Mobley, C.; Gillis, B.; Stadler, D.; Hartstein, J.; Volpe, S.L.; Virus, A.; Bridgman, J.; Healthy, S.G. The effects of the HEALTHY study intervention on middle school student dietary intakes. Int. J. Behav. Nutr. Phys. Act. 2011, 8, 7. [Google Scholar] [CrossRef] [PubMed]
- Singhal, N.; Misra, A. A school-based intervention for diabetes risk reduction. N. Engl. J.Med. 2010, 363, 1769. [Google Scholar] [PubMed]
- Vézina-Im, L.; Beaulieu, D.; Bélanger-Gravel, A.; Boucher, D.; Sirois, C.; Dugas, M.; Provencher, V. Efficacy of school-based interventions aimed at decreasing sugar-sweetened beverage consumption among adolescents: A systematic review. Public Health Nutr. 2017, 20, 2416–2431. [Google Scholar] [CrossRef] [PubMed]
- Gui, Z.; Zhu, Y.; Cai, L.; Sun, F.; Ma, Y.; Jing, J.; Chen, Y. Sugar-Sweetened beverage consumption and risks of obesity and hypertension in chinese children and adolescents: A national Cross-Sectional analysis. Nutrients 2017, 9, 1302. [Google Scholar] [CrossRef] [PubMed]
- Greenhalgh, S. Making China safe for Coke: How Coca-Cola shaped obesity science and policy in China. BMJ 2019, 364, k5050. [Google Scholar] [CrossRef]
- He, Y.; Zhao, W.; Zhang, J.; Zhao, L.; Yang, Z.; Huo, J.; Yang, L.; Wang, J.; He, L.; Sun, J.; et al. Data resource profile: China national nutrition surveys. Int. J. Epidemiol. 2019, 48, 368. [Google Scholar] [CrossRef] [PubMed]
- Sallis, J.F.; Owen, N.; Fisher, E.B. Ecological models of health behavior. Health Behav. Health Educ. 2008, 5, 465–485. [Google Scholar]
- Wing, C.; Simon, K.; Bello-Gomez, R.A. Designing difference in difference studies: Best practices for public health policy research. Annu. Rev. Publ. Health 2018, 39, 453–469. [Google Scholar] [CrossRef]
- Greece, J.A. Behavioral Impact of a School-Based Healthy Eating Intervention for At-Risk Children. Ph.D. Theses, Boston University, Boston, MA, USA, 2011. [Google Scholar]
- Waters, E.; de Silva-Sanigorski, A.; Hall, B.J.; Brown, T.; Campbell, K.J.; Gao, Y.; Armstrong, R.; Prosser, L.; Summerbell, C.D. Interventions for preventing obesity in children. Cochrane Database Syst. Rev. 2011, D1871. [Google Scholar] [CrossRef]
- Bandura, A.; Cliffs, N. Social Foundations of Thought and Action: Cognitive Theory; PRENTICE-HALL: Hoboken, NJ, USA, 1987. [Google Scholar]
- Klesges, R.C.; Obarzanek, E.; Kumanyika, S.; Murray, D.M.; Klesges, L.M.; Relyea, G.E.; Stockton, M.B.; Lanctot, J.Q.; Beech, B.M.; McClanahan, B.S.; et al. The Memphis Girls’ health Enrichment Multi-site Studies (GEMS): An evaluation of the efficacy of a 2-year obesity prevention program in African American girls. Arch. Pediatr. Adolesc. Med. 2010, 164, 1007–1014. [Google Scholar] [CrossRef] [PubMed]
- Albala, C.; Ebbeling, C.B.; Cifuentes, M.; Lera, L.; Bustos, N.; Ludwig, D.S. Effects of replacing the habitual consumption of sugar-sweetened beverages with milk in Chilean children. Am. J Clin Nutr. 2008, 88, 605–611. [Google Scholar] [CrossRef][Green Version]
- Mendez, M.A.; Miles, D.R.; Poti, J.M.; Sotres-Alvarez, D.; Popkin, B.M. Persistent disparities over time in the distribution of sugar-sweetened beverage intake among children in the United States. Am. J Clin Nutr. 2019, 109, 79–89. [Google Scholar] [CrossRef] [PubMed]
- Kim, J.; Yun, S.; Oh, K. Beverage consumption among Korean adolescents: Data from 2016 Korea Youth Risk Behavior Survey. Nutr. Res. Pract. 2019, 13, 70–75. [Google Scholar] [CrossRef] [PubMed]
- Jia, P.; Li, M.; Xue, H.; Lu, L.; Xu, F.; Wang, Y. School environment and policies, child eating behavior and overweight/obesity in urban China: The childhood obesity study in China megacities. Int. J. Obes. 2017, 41, 813–819. [Google Scholar] [CrossRef]
- Lundeen, E.A.; Park, S.; Onufrak, S.; Cunningham, S.; Blanck, H.M. Adolescent Sugar-Sweetened beverage intake is associated with parent intake, not knowledge of health risks. Am. J. Health Promot. 2018, 32, 1661–1670. [Google Scholar] [CrossRef] [PubMed]
- Mazarello Paes, V.; Hesketh, K.; O’Malley, C.; Moore, H.; Summerbell, C.; Griffin, S.; van Sluijs, E.M.F.; Ong, K.K.; Lakshman, R. Determinants of sugar-sweetened beverage consumption in young children: A systematic review. Obes Rev. 2015, 16, 903–913. [Google Scholar] [CrossRef]
- Bjelland, M.; Hausken, S.E.; Bergh, I.H.; Grydeland, M.; Klepp, K.I.; Andersen, L.F.; Totland, T.H.; Lien, N. Changes in adolescents’ and parents’ intakes of sugar-sweetened beverages, fruit and vegetables after 20 months: Results from the HEIA study—A comprehensive, multi-component school-based randomized trial. Food Nutr. Res. 2015, 59, 25932. [Google Scholar] [CrossRef]
- Horne, P.J.; Greenhalgh, J.; Erjavec, M.; Lowe, C.F.; Viktor, S.; Whitaker, C.J. Increasing pre-school children’s consumption of fruit and vegetables. A modelling and rewards intervention. Appetite 2011, 56, 375–385. [Google Scholar] [CrossRef]

Publisher’s Note: MDPI stays neutral with regard to jurisdictional claims in published maps and institutional affiliations. |
© 2021 by the authors. Licensee MDPI, Basel, Switzerland. This article is an open access article distributed under the terms and conditions of the Creative Commons Attribution (CC BY) license (https://creativecommons.org/licenses/by/4.0/).