
Early-Life Metabolic and Hormonal Markers in Blood and Growth until Age 2 Years: Results from a Randomized Controlled Trial in Healthy Infants Fed a Modified Low-Protein Infant Formula

 , , ,
, , ,  and
and
Abstract
1. Introduction
2. Materials and Methods
2.1. Procedures
2.2. Anthropometrics
2.3. Body Composition
2.4. Deuterium Oxide Dilution (D2O) Technique
2.5. Laboratory Analyses
2.6. Outcomes
3. Statistical Analyses
4. Results
4.1. Differences between Feeding Groups
4.2. Associations between Metabolic and Hormonal Markers and Anthropometric Parameters at 4 Months of Age
4.3. Associations between Early Metabolic and Hormonal Markers and Long-Term Anthropometric Parameters
5. Discussion
Supplementary Materials
Author Contributions
Funding
Institutional Review Board Statements
Informed Consent Statement
Acknowledgment
Conflicts of Interest
Clinical Trial Registry
References
- Weber, M.; Grote, V.; Closa-Monasterolo, R.; Escribano, J.; Langhendries, J.P.; Dain, E.; Giovannini, M.; Verduci, E.; Gruszfeld, D.; Socha, P.; et al. Lower protein content in infant formula reduces BMI and obesity risk at school age: Follow-up of a randomized trial. Am. J. Clin. Nutr. 2014, 99, 1041–1051. [Google Scholar] [CrossRef] [PubMed]
- Gruszfeld, D.; Weber, M.; Gradowska, K.; Socha, P.; Grote, V.; Xhonneux, A.; Dain, E.; Verduci, E.; Riva, E.; Closa-Monasterolo, R.; et al. Association of early protein intake and pre-peritoneal fat at five years of age: Follow-up of a randomized clinical trial. Nutr. Metab. Cardiovasc. Dis. 2016, 26, 824–832. [Google Scholar] [CrossRef]
- Rzehak, P.; Grote, V.; Lattka, E.; Weber, M.; Gruszfeld, D.; Socha, P.; Closa-Monasterolo, R.; Escribano, J.; Giovannini, M.; Verduci, E.; et al. Associations of IGF-1 gene variants and milk protein intake with IGF-I concentrations in infants at age 6 months—Results from a randomized clinical trial. Growth Horm. IGF Res. 2013, 23, 149–158. [Google Scholar] [CrossRef] [PubMed]
- Koletzko, B.; von Kries, R.; Closa, R.; Escribano, J.; Scaglioni, S.; Giovannini, M.; Beyer, J.; Demmelmair, H.; Gruszfeld, D.; Dobrzanska, A.; et al. Lower protein in infant formula is associated with lower weight up to age 2 y: A randomized clinical trial. Am. J. Clin. Nutr. 2009, 89, 1836–1845. [Google Scholar] [PubMed]
- Lind, M.V.; Larnkjaer, A.; Molgaard, C.; Michaelsen, K.F. Dietary protein intake and quality in early life: Impact on growth and obesity. Curr. Opin. Clin. Nutr. Metab. Care 2017, 20, 71–76. [Google Scholar] [CrossRef]
- Ketelslegers, J.M.; Maiter, D.; Maes, M.; Underwood, L.E.; Thissen, J.P. Nutritional regulation of the growth hormone and insulin-like growth factor-binding proteins. Horm. Res. 1996, 45, 252–257. [Google Scholar] [CrossRef]
- Karlberg, J.; Jalil, F.; Lam, B.; Low, L.; Yeung, C.Y. Linear growth retardation in relation to the three phases of growth. Eur. J. Clin. Nutr. 1994, 48 (Suppl. 1), S25–S43, discussion S43–S44. [Google Scholar] [PubMed]
- Hoppe, C.; Udam, T.R.; Lauritzen, L.; Molgaard, C.; Juul, A.; Michaelsen, K.F. Animal protein intake, serum insulin-like growth factor I, and growth in healthy 2.5-y-old Danish children. Am. J. Clin. Nutr. 2004, 80, 447–452. [Google Scholar] [CrossRef]
- Breij, L.M.; Mulder, M.T.; van Vark-van der Zee, L.C.; Hokken-Koelega, A.C.S. Appetite-regulating hormones in early life and relationships with type of feeding and body composition in healthy term infants. Eur. J. Nutr. 2017, 56, 1725–1732. [Google Scholar] [CrossRef] [PubMed]
- Putet, G.; Labaune, J.M.; Mace, K.; Steenhout, P.; Grathwohl, D.; Raverot, V.; Morel, Y.; Picaud, J.C. Effect of dietary protein on plasma insulin-like growth factor-1, growth, and body composition in healthy term infants: A randomised, double-blind, controlled trial (Early Protein and Obesity in Childhood (EPOCH) study). Br. J. Nutr. 2016, 115, 271–284. [Google Scholar] [CrossRef] [PubMed]
- Socha, P.; Grote, V.; Gruszfeld, D.; Janas, R.; Demmelmair, H.; Closa-Monasterolo, R.; Subias, J.E.; Scaglioni, S.; Verduci, E.; Dain, E.; et al. Milk protein intake, the metabolic-endocrine response, and growth in infancy: Data from a randomized clinical trial. Am. J. Clin. Nutr. 2011, 94 (Suppl. 6), 1776S–1784S. [Google Scholar]
- Madsen, A.L.; Larnkjaer, A.; Molgaard, C.; Michaelsen, K.F. IGF-I and IGFBP-3 in healthy 9 month old infants from the SKOT cohort: Breastfeeding, diet, and later obesity. Growth Horm. IGF Res. 2011, 21, 199–204. [Google Scholar] [CrossRef]
- Chellakooty, M.; Juul, A.; Boisen, K.A.; Damgaard, I.N.; Kai, C.M.; Schmidt, I.M.; Petersen, J.H.; Skakkebaek, N.E.; Main, K.M. A prospective study of serum insulin-like growth factor I (IGF-I) and IGF-binding protein-3 in 942 healthy infants: Associations with birth weight, gender, growth velocity, and breastfeeding. J. Clin. Endocrinol. Metab. 2006, 91, 820–826. [Google Scholar] [CrossRef] [PubMed]
- Savino, F.; Fissore, M.F.; Grassino, E.C.; Nanni, G.E.; Oggero, R.; Silvestro, L. Ghrelin, leptin and IGF-I levels in breast-fed and formula-fed infants in the first years of life. Acta Paediatr. 2005, 94, 531–537. [Google Scholar] [CrossRef] [PubMed]
- Bang, P.; Nygren, J.; Carlsson-Skwirut, C.; Thorell, A.; Ljungqvist, O. Postoperative induction of insulin-like growth factor binding protein-3 proteolytic activity: Relation to insulin and insulin sensitivity. J. Clin. Endocrinol. Metab. 1998, 83, 2509–2515. [Google Scholar] [CrossRef]
- Firth, S.M.; Baxter, R.C. Cellular actions of the insulin-like growth factor binding proteins. Endocr. Rev. 2002, 23, 824–854. [Google Scholar] [CrossRef]
- Duan, C.; Xu, Q. Roles of insulin-like growth factor (IGF) binding proteins in regulating IGF actions. Gen. Comp. Endocrinol. 2005, 142, 44–52. [Google Scholar] [CrossRef]
- Haywood, N.J.; Slater, T.A.; Matthews, C.J.; Wheatcroft, S.B. The insulin like growth factor and binding protein family: Novel therapeutic targets in obesity & diabetes. Mol. Metab. 2019, 19, 86–96. [Google Scholar]
- Yau, S.W.; Harcourt, B.E.; Kao, K.T.; Alexander, E.J.; Russo, V.C.; Werther, G.A.; Sabin, M.A. Serum IGFBP-2 levels are associated with reduced insulin sensitivity in obese children. Clin. Obes. 2018, 8, 184–190. [Google Scholar] [CrossRef]
- Ko, J.M.; Park, H.K.; Yang, S.; Kim, E.Y.; Chung, S.C.; Hwang, I.T. Association between insulin-like growth factor binding protein-2 levels and cardiovascular risk factors in Korean children. Endocr. J. 2012, 59, 335–343. [Google Scholar] [CrossRef]
- Miralles, O.; Sanchez, J.; Palou, A.; Pico, C. A physiological role of breast milk leptin in body weight control in developing infants. Obesity 2006, 14, 1371–1377. [Google Scholar] [CrossRef]
- Lonnerdal, B.; Havel, P.J. Serum leptin concentrations in infants: Effects of diet, sex, and adiposity. Am. J. Clin. Nutr. 2000, 72, 484–489. [Google Scholar] [CrossRef]
- Kouwenhoven, S.M.P.; Antl, N.; Finken, M.J.J.; Twisk, J.W.R.; van der Beek, E.M.; Abrahamse-Berkeveld, M.; van de Heijning, B.J.M.; Schierbeek, H.; Holdt, L.M.; van Goudoever, J.B.; et al. A modified low-protein infant formula supports adequate growth in healthy, term infants: A randomized, double-blind, equivalence trial. Am. J. Clin. Nutr. 2019, 111, 962–974. [Google Scholar] [CrossRef] [PubMed]
- Schierbeek, H.; van den Akker, C.H.; Fay, L.B.; van Goudoever, J.B. High-precision mass spectrometric analysis using stable isotopes in studies of children. Mass Spectrom. Rev. 2012, 31, 312–330. [Google Scholar] [CrossRef]
- Schierbeek, H.; Rieken, R.; Dorst, K.Y.; Penning, C.; van Goudoever, J.B. Validation of deuterium and oxygen18 in urine and saliva samples from children using on-line continuous-flow isotope ratio mass spectrometry. Rapid Commun. Mass Spectrom. 2009, 23, 3549–3554. [Google Scholar] [CrossRef]
- Kouwenhoven, S.M.; de Waard, M. Early-life Nutrition and Stable Isotope Techniques. In Mass Spectrometry and Stable Isotopes in Nutritional and Pediatric Research; Schierbeek, H., Ed.; John Wiley & Sons: Hoboken, NJ, USA, 2017. [Google Scholar]
- Butte, N.F.; Hopkinson, J.M.; Wong, W.W.; Smith, E.O.; Ellis, K.J. Body composition during the first 2 years of life: An updated reference. Pediatr. Res. 2000, 47, 578–585. [Google Scholar] [CrossRef]
- Matthews, D.R.; Hosker, J.P.; Rudenski, A.S.; Naylor, B.A.; Treacher, D.F.; Turner, R.C. Homeostasis model assessment: Insulin resistance and beta-cell function from fasting plasma glucose and insulin concentrations in man. Diabetologia 1985, 28, 412–419. [Google Scholar] [CrossRef]
- Low, L.C.; Tam, S.Y.; Kwan, E.Y.; Tsang, A.M.; Karlberg, J. Onset of significant GH dependence of serum IGF-I and IGF-binding protein 3 concentrations in early life. Pediatr. Res. 2001, 50, 737–742. [Google Scholar] [CrossRef]
- Closa-Monasterolo, R.; Ferre, N.; Luque, V.; Zaragoza-Jordana, M.; Grote, V.; Weber, M.; Koletzko, B.; Socha, P.; Gruszfeld, D.; Janas, R.; et al. Sex differences in the endocrine system in response to protein intake early in life. Am. J. Clin. Nutr. 2011, 94 (Suppl. 6), 1920S–1927S. [Google Scholar]
- Petridou, E.; Mantzoros, C.S.; Belechri, M.; Skalkidou, A.; Dessypris, N.; Papathoma, E.; Salvanos, H.; Lee, J.H.; Kedikoglou, S.; Chrousos, G.; et al. Neonatal leptin levels are strongly associated with female gender, birth length, IGF-I levels and formula feeding. Clin. Endocrinol. 2005, 62, 366–371. [Google Scholar] [CrossRef]
- Savino, F.; Nanni, G.E.; Maccario, S.; Costamagna, M.; Oggero, R.; Silvestro, L. Breast-fed infants have higher leptin values than formula-fed infants in the first four months of life. J. Pediatr. Endocrinol. Metab. 2004, 17, 1527–1532. [Google Scholar] [CrossRef] [PubMed]


| mLP (n = 53) | CTRL (n = 45) | BF (n = 36) | Total Group (n = 134) | |
|---|---|---|---|---|
| Infant characteristics | ||||
| Boys [n (%)] | 23 (43.4) | 20 (44.4) | 14 (38.9) | 57 (42.5) |
| Caucasian [n (%)] | 45 (84.9) | 37 (82.2) | 31 (86.1) | 113 (84.3) |
| Gestational age (Wk) | 39.5 ± 1.2 | 39.8 ± 1.2 | 39.9 ± 1.1 | 39.7 ± 1.2 |
| Birth weight (g) | 3418 ± 366 | 3402 ± 437 | 3400 ± 284 | 3408 ± 370 |
| Caesarean delivery [n (%)] | 18 (34.0) | 14 (31.1) | 7 (19.4) | 39 (29.1) |
| Ever breast-fed [n (%)] | 27 (50.9) | 20 (44.4) | 36 (100) | 83 (61.9) |
| Age at baseline (d) | 30 ± 9 | 31 ± 10 | 31 ± 8 | 31 ± 9 |
| Age at visit 4 mo (mo) | 3.9 ± 0.1 | 3.9 ± 0.1 | 3.9 ± 0.1 | 3.9 ± 0.1 |
| Randomized in Amsterdam | 35 (66.0) | 25 (55.6) | 27 (75) | 87 (64.9) |
| mLP (n = 53) | CTRL (n = 45) | BF (n = 36) | ||||
|---|---|---|---|---|---|---|
| n | n | n | ||||
| Anthropometry | ||||||
| Weight (g) | ||||||
| 4 months | 53 | 6647 ± 648 | 45 | 6621 ± 644 | 36 | 6307 ± 774 |
| 6 months | 53 | 7695 ± 804 | 44 | 7770 ± 753 | 36 | 7241 ± 827 |
| 1 year | 44 | 9548 ± 1143 | 37 | 9621 ± 1036 | 29 | 9302 ± 860 |
| 2 years | 41 | 12,400 ± 1598 | 32 | 12,195±1200 | 28 | 12,103 ± 1040 |
| Length (cm) | ||||||
| 4 months | 53 | 63.9 ± 2.0 | 45 | 63.8 ± 2.1 | 36 | 63.4 ± 2.3 |
| 6 months | 53 | 68.0 ± 2.2 | 44 | 68.3 ± 2.4 | 36 | 67.0 ± 2.5 |
| 1 year | 44 | 75.7 ± 2.6 | 37 | 75.8 ± 2.4 | 29 | 74.7 ± 2.2 |
| 2 years | 41 | 86.9 ± 3.4 | 32 | 86.8±3.1 | 28 | 86.1 ± 2.3 |
| Body composition | ||||||
| Fat mass (g) | ||||||
| 4 months | 52 | 1738 ± 335 | 43 | 1712 ± 414 | 33 | 1586 ± 461 |
| 6 months | 50 | 1985 ± 430 | 39 | 2023 ± 477 | 36 | 1861 ± 461 |
| 1 year | 15 | 1916 ± 950 | 12 | 1941 ± 701 | 16 | 1805 ± 822 |
| 2 years | 24 | 2917 ± 1285 | 14 | 2156 ± 1123 | 22 | 2427 ± 874 |
| Fat (%) | ||||||
| 4 months | 52 | 25.7 ± 3.4 | 43 | 25.3 ± 4.7 | 33 | 24.5 ± 5.0 |
| 6 months | 50 | 25.4 ± 3.6 | 39 | 25.7 ± 4.5 | 36 | 25.2 ± 4.6 |
| 1 year | 15 | 19.1 ± 8.5 | 12 | 20.1 ± 6.6 | 16 | 19.1 ± 8.0 |
| 2 years | 24 | 22.2 ± 7.7 | 14 | 17.1 ± 7.7 | 22 | 19.8 ± 7.1 |
| Fat free mass (g) | ||||||
| 4 months | 52 | 5014 ± 463 | 43 | 5018 ± 471 | 33 | 4796 ± 484 |
| 6 months | 50 | 5789 ± 549 | 39 | 5781 ± 559 | 36 | 5455 ± 580 |
| 1 year | 15 | 7921 ± 1123 | 12 | 7621 ± 787 | 16 | 7453 ± 801 |
| 2 years | 24 | 9858 ± 605 | 14 | 10,099 ± 627 | 22 | 9858 ± 1148 |
| mLP | CTRL | BF | ||||
|---|---|---|---|---|---|---|
| n | n | n | ||||
| Glucose (mmol/L) | 53 | 4.95 ± 0.38 | 44 | 4.87 ± 0.34 | 36 | 4.88 ± 0.37 |
| Insulin (µU/mL) | 52 | 5.35 (3.65, 8.08) | 44 | 5.60 (3.45, 9.28) | 36 | 3.15 (1.85, 5.28) |
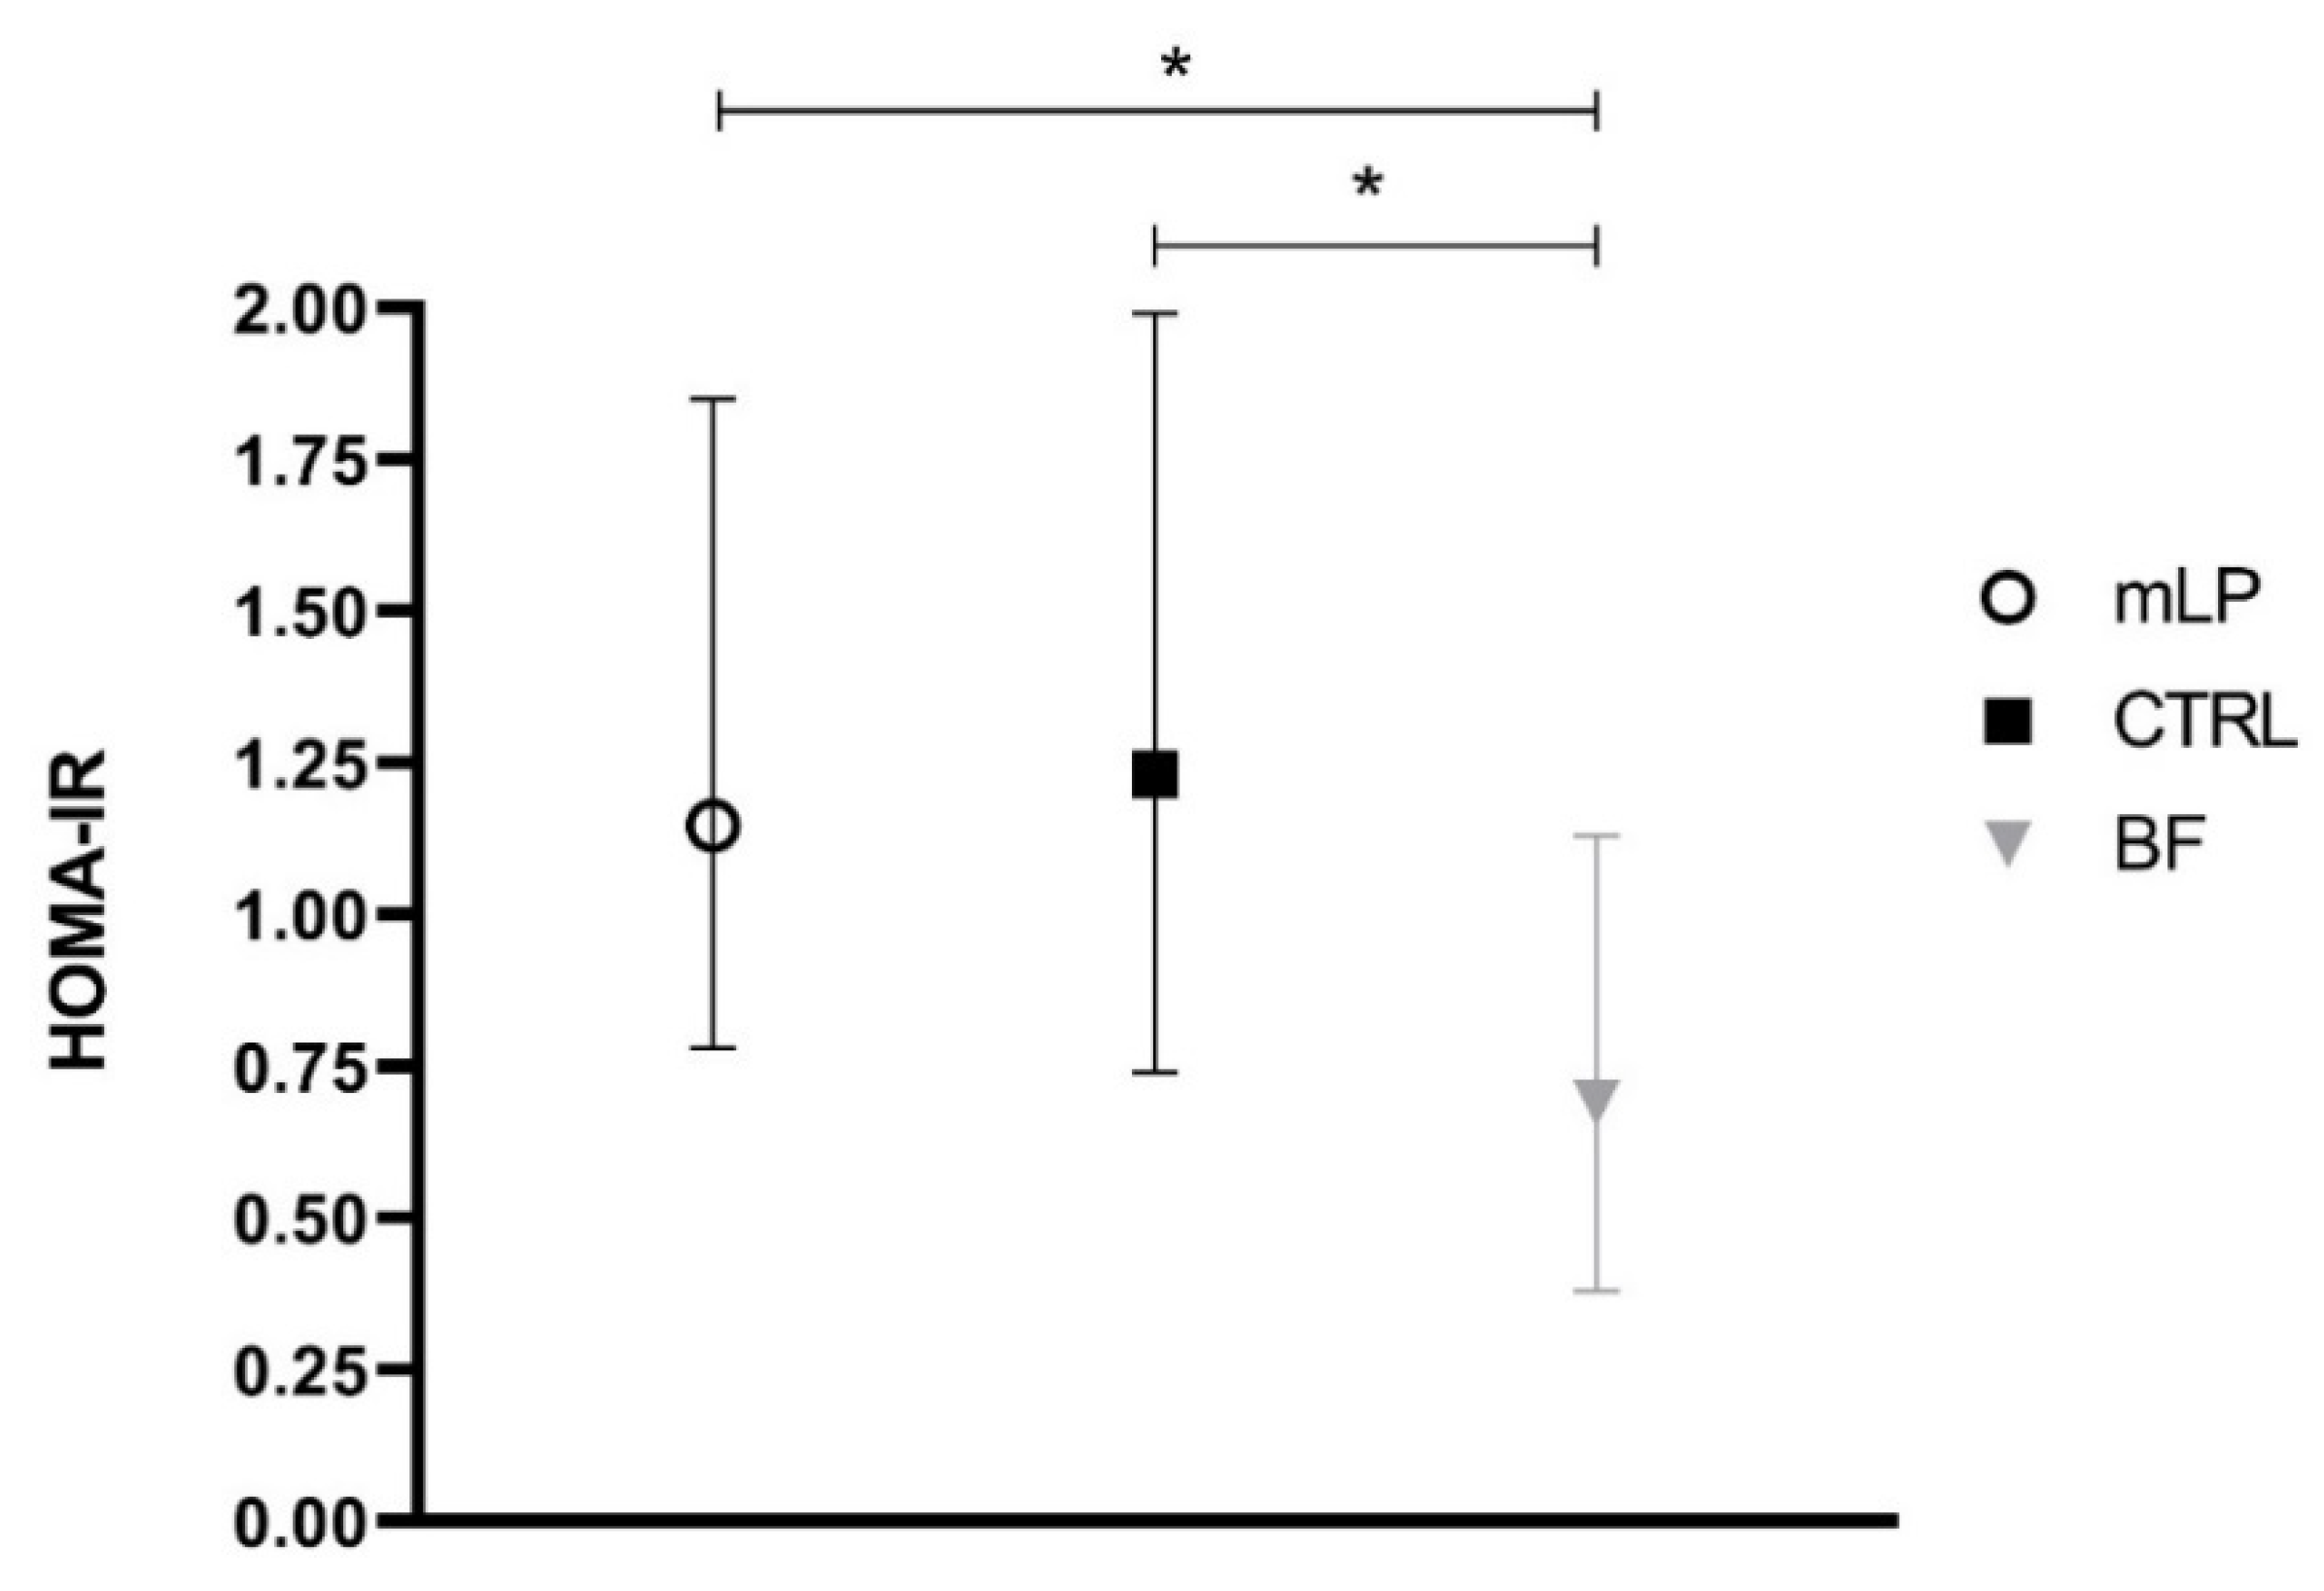
| HOMA-IR | 52 | 1.15 (0.78, 1.85) | 44 | 1.23 (0.74, 1.99) | 36 | 0.69 (0.38, 1.13) |
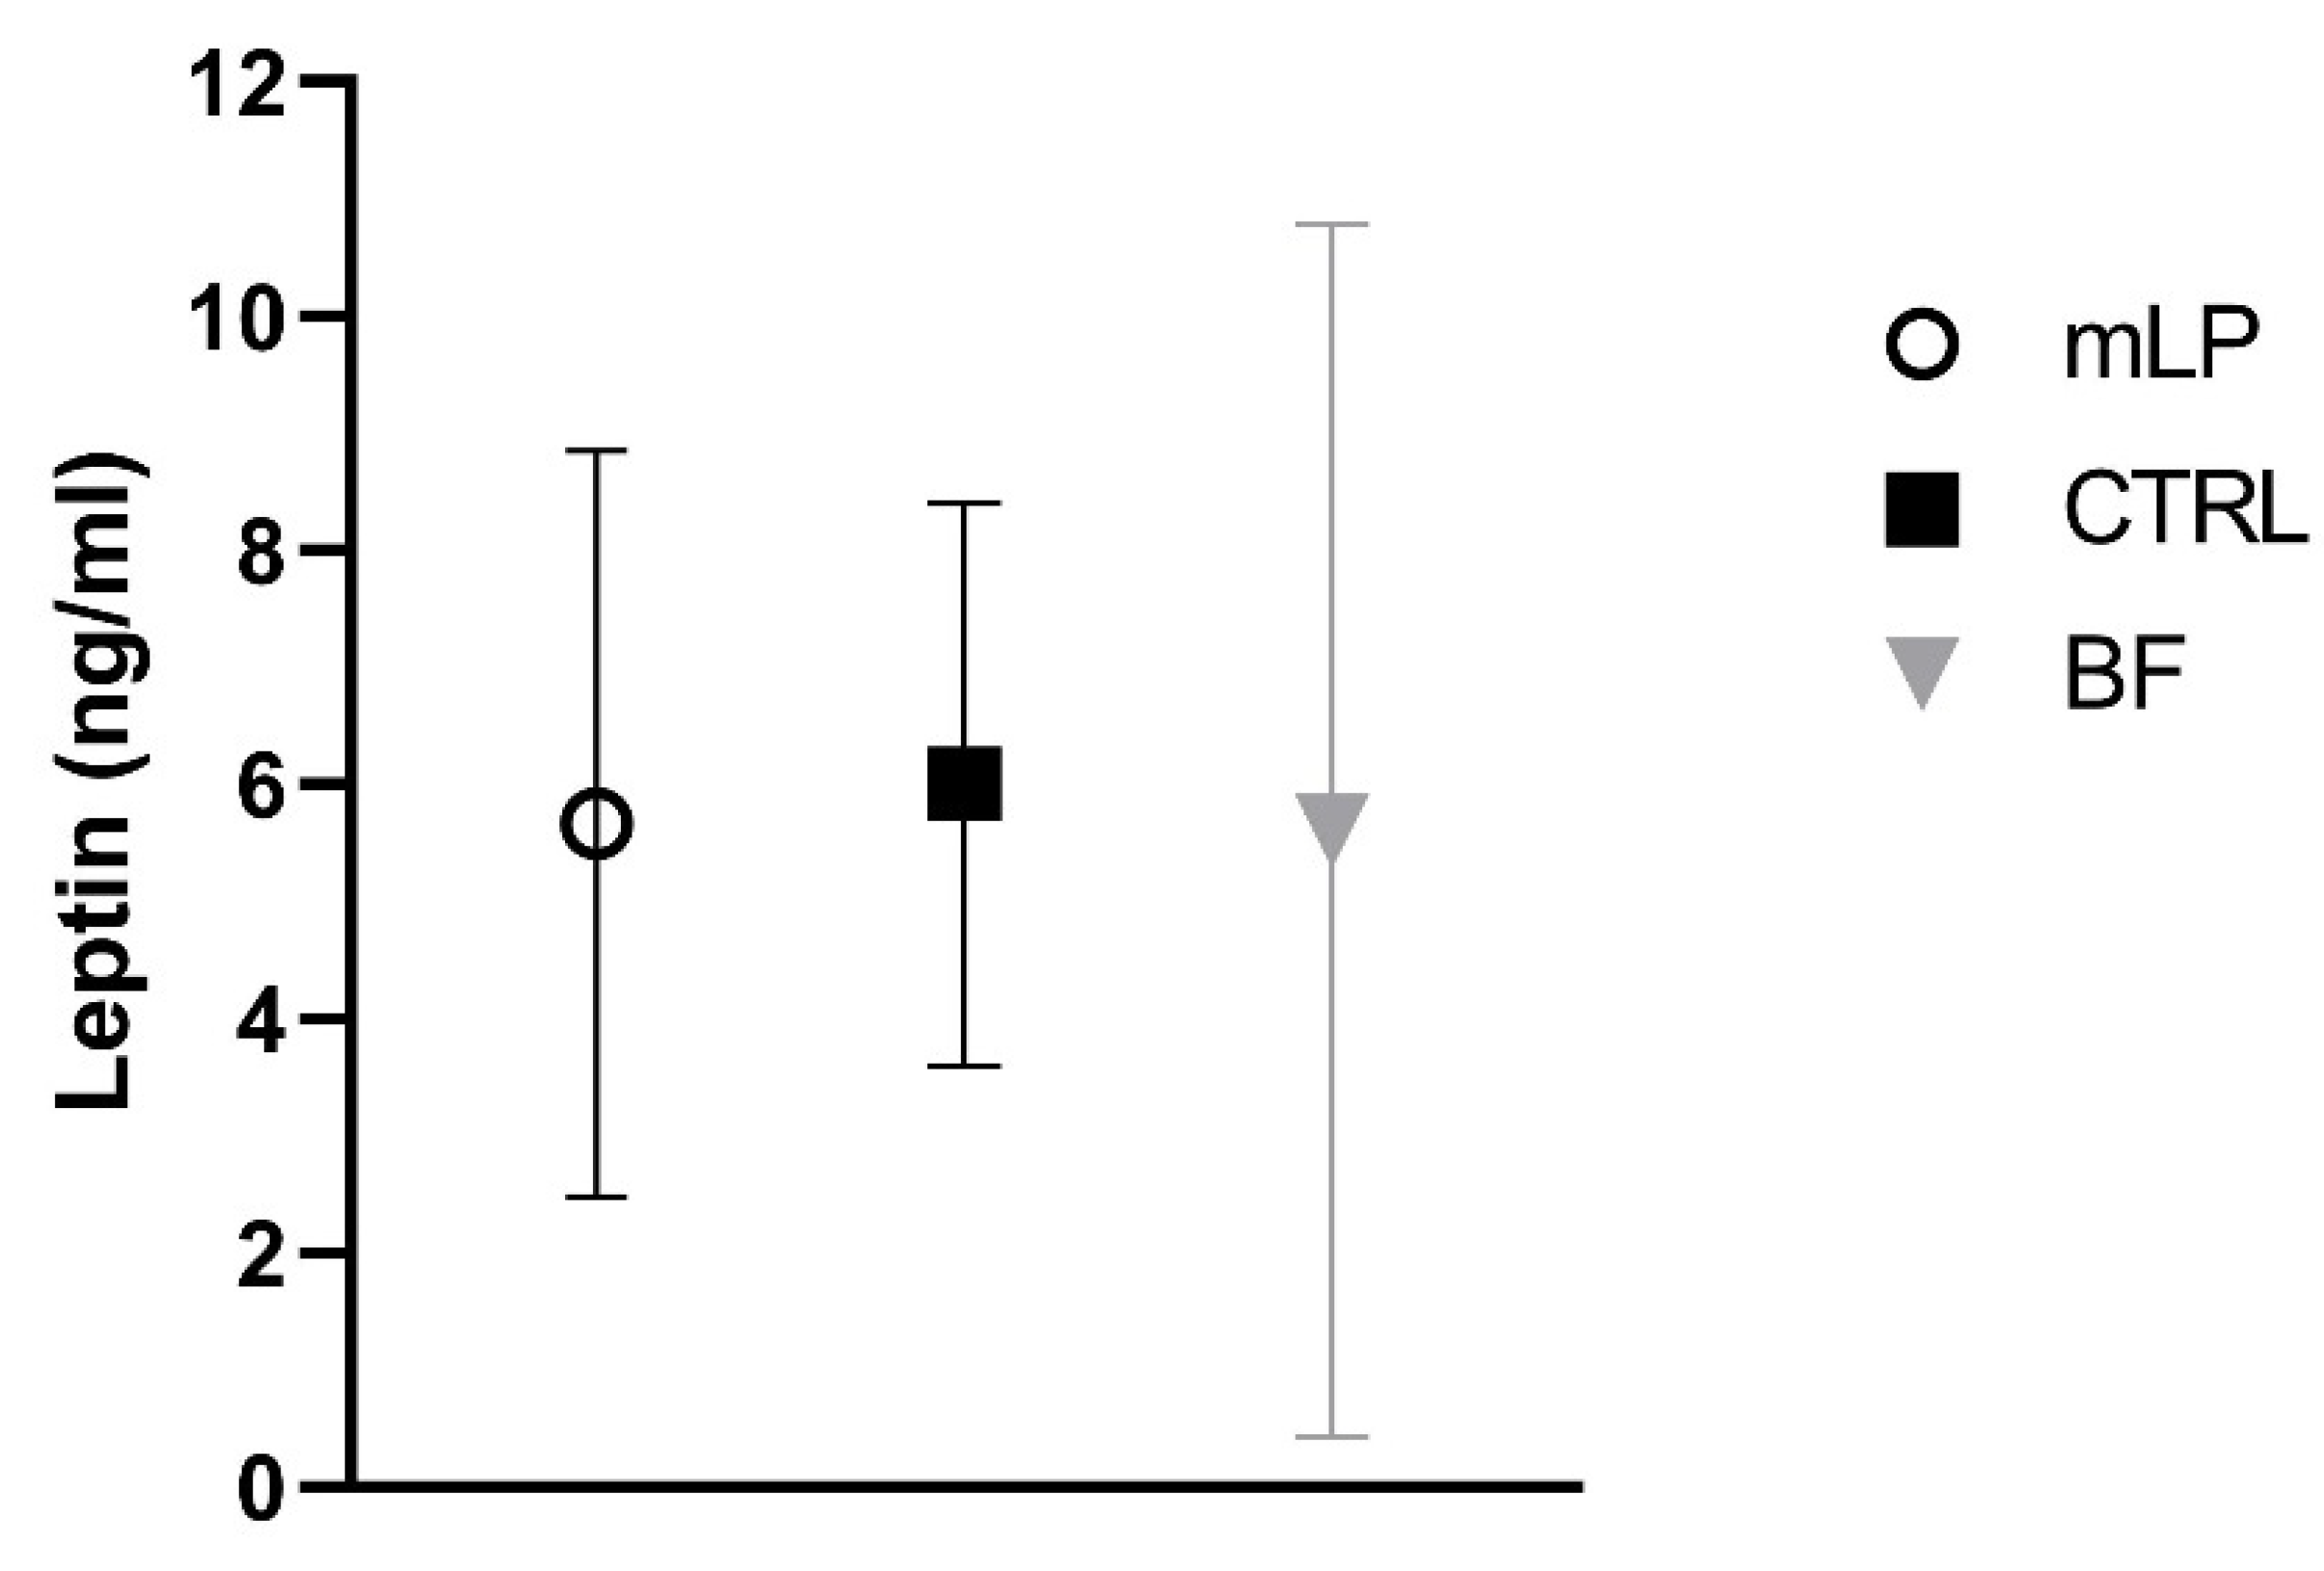
| Leptin (ng/mL) | 45 | 5.66 ± 3.19 | 38 | 6.00 ± 2.40 | 31 | 5.60 ± 5.18 |
| IGF-1 (ng/mL) | 48 | 25.41 (6.23, 88.13) | 39 | 27.66 (8.78, 81.36) | 32 | 36.29 (5.19, 70.18) |
| IGF-BP1 (ng/mL) | 47 | 7.95 (4.70, 14.42) | 39 | 8.37 (6.14, 11.98) | 32 | 15.60 (7.90, 20.62) |
| IGF-BP2 (ng/mL) | 48 | 523 ± 230 | 38 | 471 ± 154 | 32 | 594 ± 179 |
| IGF-BP3 (ng/mL) | 48 | 3050 ± 612 | 39 | 3002 ± 521 | 32 | 2777 ± 548 |
| mLP vs. CTRL (mLP Minus CTRL) | mLP vs. BF (mLP Minus BF) | CTRL vs. BF (CTRL Minus BF) | |||||||
|---|---|---|---|---|---|---|---|---|---|
| 95% CI | p | 95% CI | p | 95% CI | p | ||||
| Glucose 1 (mmol/L) | 0.07 | −0.07, 0.22 | 0.33 | 0.06 | −0.1, 0.21 | 0.45 | −0.01 | −0.17, 0.15 | 0.87 |
| Insulin 2 (µU/mL) | 0.96 | 0.74, 1.23 | 0.72 | 1.69 | 1.30, 2.20 | <0.001 | 1.77 | 1.34, 2.33 | <0.001 |
| HOMA-IR 2 | 0.96 | 0.74, 1.25 | 0.79 | 1.70 | 1.29, 2.25 | <0.001 | 1.76 | 1.32, 2.35 | <0.001 |
| Leptin 1 (ng/mL) | −0.44 | −2.00, 1.12 | 0.58 | 0.05 | −1.60, 1.70 | 0.95 | 0.49 | −1.23, 2.20 | 0.57 |
| IGF-1 2,3 (ng/mL) | 0.86 | 0.30, 2.49 | 0.86 | 0.92 | 0.30, 2.82 | 0.72 | 0.79 | 0.24, 2.56 | 0.83 |
| IGF-BP1 2 (ng/mL) | 0.92 | 0.67, 1.27 | 0.63 | 0.58 | 0.41, 0.81 | <0.01 | 0.62 | 0.44, 0.89 | <0.01 |
| IGF-BP2 1 (ng/mL) | 46 | −37, 129 | 0.27 | −69 | −156, 17 | 0.12 | −115 | −207, −24 | 0.014 |
| IGF-BP3 1 (ng/mL) | 36 | −204, 276 | 0.77 | 277 | 24, 531 | 0.03 | 241 | −24, 507 | 0.08 |
| Metabolic and Hormonal Markers | Age | Weight, g | Length, cm | Fat Mass, g | Fat Free Mass, g | Fat Mass, % | ||||||||||
|---|---|---|---|---|---|---|---|---|---|---|---|---|---|---|---|---|
| B | 95%CI | p | B | 95%CI | p | B | 95%CI | p | B | 95%CI | p | B | 95%CI | p | ||
| Glucose at 4 months | ||||||||||||||||
| 4 months | 188.88 | −232.06, 609.83 | 0.38 | −0.70 | −1.14, 1.00 | 0.90 | 156.33 | −155.94, 468.60 | 0.33 | 37.80 | −227.88, 303.47 | 0.78 | 1.69 | −0.93, 4.31 | 0.21 | |
| 6 months | 228.74 | −192.24, 649.71 | 0.29 | 0.57 | −0.40, 1.64 | 0.29 | 91.89 | −222.39, 406.18 | 0.57 | 175.87 | −91.56, 443.31 | 0.20 | 0.30 | −2.34, 2.93 | 0.83 | |
| 1 year | 23.27 | −406.30, 452.83 | 0.92 | 0.83 | −0.26, 1.91 | 0.14 | −24.64 | −483.45, 434.16 | 0.92 | 256.08 | −136.87, 649.03 | 0.20 | −0.62 | −4.48, 3.24 | 0.75 | |
| 2 years | 338.33 | −105.30, 781.96 | 0.13 | 0.99 | −0.13, 2.12 | 0.08 | −97.89 | −488.58, 292.79 | 0.62 | 337.85 | 4.01, 671.68 | 0.047 | −1.13 | −4.42, 2.15 | 0.50 | |
| Insulin at 4 months | ||||||||||||||||
| 4 months | 9.08 | −23.32, 41.49 | 0.58 | −0.01 | −0.09, 0.07 | 0.86 | 9.84 | −13.96, 33.65 | 0.42 | −4.13 | −24.49, 16.23 | 0.69 | 0.14 | −0.05, 0.34 | 0.15 | |
| 6 months | 20.17 | −12.28, 52.62 | 0.22 | 0.04 | −0.04, 0.12 | 0.32 | 16.90 | −6.91, 40.71 | 0.16 | 4.20 | −16.17, 24.57 | 0.69 | 0.16 | −0.04, 0.36 | 0.12 | |
| 1 year | 8.66 | −24.83, 42.16 | 0.61 | 0.05 | −0.04, 0.13 | 0.26 | 5.85 | −51.18, 62.88 | 0.84 | −8.02 | −57.19, 41.15 | 0.75 | 0.09 | −0.39, 0.57 | 0.71 | |
| 2 years | 17.55 | −16.88, 51.97 | 0.32 | 0.08 | −0.01, 0.16 | 0.09 | 25.20 | −3.67, 54.06 | 0.09 | −30.84 | −55.61, −6.08 | 0.01 | 0.23 | −0.01, 0.48 | 0.06 | |
| HOMA-IR at 4 months | ||||||||||||||||
| 4 months | 40.24 | −99.10, 179.59 | 0.57 | −0.04 | −0.39, 0.31 | 0.82 | 42.07 | −60.31, 144.45 | 0.42 | −14.47 | −102.07, 73.13 | 0.75 | 0.61 | −0.25, 1.46 | 0.16 | |
| 6 months | 86.10 | −53.41, 225.61 | 0.23 | 0.18 | −0.17, 0.54 | 0.30 | 70.91 | −31.56, 173.38 | 0.17 | 20.56 | −67.12, 108.24 | 0.64 | 0.65 | −0.20, 1.51 | 0.13 | |
| 1 year | 27.70 | −115.90, 171.29 | 0.70 | 0.21 | −0.15, 0.57 | 0.25 | 23.63 | −221.14, 268.40 | 0.85 | −29.88 | −241.04, 181.28 | 0.78 | 0.37 | −1.69, 2.44 | 0.72 | |
| 2 years | 71.72 | −74.79, 218.22 | 0.34 | 0.32 | −0.05, 0.69 | 0.09 | 96.83 | −23.49, 217.15 | 0.11 | −119.97 | −223.18, −16.75 | 0.02 | 0.92 | −0.09, 1.92 | 0.08 | |
| Leptin at 4 months | ||||||||||||||||
| 4 months | 75.05 | 30.55, 119.55 | 0.001 | 0.12 | 0.01, 0.22 | 0.04 | 40.77 | 6.92, 74.62 | 0.02 | 33.25 | 5.31, 61.19 | 0.02 | 0.31 | 0.03, 0.58 | 0.03 | |
| 6 months | 76.37 | 31.86, 120.88 | <0.010 | 0.13 | 0.02, 0.24 | 0.02 | 47.07 | 13.33, 80.70 | <0.01 | 31.34 | 3.54, 59.14 | 0.03 | 0.33 | 0.06, 0.61 | 0.02 | |
| 1 year | 35.79 | −9.16, 80.74 | 0.12 | 0.13 | 0.02, 0.24 | 0.02 | 84.60 | 4.78, 164.42 | 0.04 | −52.73 | −118.65, 13.19 | 0.12 | 0.87 | 0.22, 1.53 | <0.015 | |
| 2 years | 63.11 | 17.35, 108.87 | <0.01 | 0.12 | 0.003, 0.23 | 0.04 | 53.34 | 13.06, 93.61 | <0.01 | 22.23 | −11.02, 55.47 | 0.19 | 0.29 | −0.04, 0.62 | 0.09 | |
| IGF-1 at 4 months | ||||||||||||||||
| 4 months | 1.84 | −2.02, 5.70 | 0.35 | 0.001 | −0.01, 0.01 | 0.80 | 1.05 | −1.90, 4.01 | 0.48 | 0.68 | −1.83, 3.19 | 0.59 | 0.01 | −0.02, 0.03 | 0.47 | |
| 6 months | 1.05 | −2.82, 4.92 | 0.59 | 0.000 | −0.01, 0.01 | 0.98 | −0.07 | −3.03, 2.89 | 0.96 | 1.19 | −1.32, 3.71 | 0.35 | −0.01 | −0.03, 0.02 | 0.69 | |
| 1 year | −2.85 | −6.89, 1.20 | 0.17 | −0.003 | −0.01, 0.01 | 0.5 | −2.16 | −7.14, 2.83 | 0.40 | 3.24 | −0.99, 7.46 | 0.13 | −0.02 | −0.07, 0.02 | 0.25 | |
| 2 years | −1.84 | −6.04, 2.36 | 0.39 | −0.007 | −0.02, 0.00 | 0.16 | 2.05 | −2.05, 6.14 | 0.33 | 0.14 | −3.34, 3.61 | 0.94 | 0.01 | −0.02, 0.05 | 0.39 | |
| IGF-BP1 at 4 months | ||||||||||||||||
| 4 months | −8.36 | −17.97, 1.25 | 0.09 | −0.033 | −0.06, −0.01 | 0.01 | −3.27 | −10.58, 4.04 | 0.38 | −4.67 | −10.63, 1.29 | 0.12 | −0.02 | −0.08, 0.05 | 0.61 | |
| 6 months | −12.21 | −21.82, −2.59 | 0.01 | −0.046 | −0.07, −0.02 | <0.001 | −2.23 | −9.52, 5.07 | 0.55 | −9.83 | −15.78, −3.88 | 0.001 | 0.02 | −0.04, 0.08 | 0.56 | |
| 1 year | −18.15 | −27.84, −8.47 | <0.001 | −0.051 | −0.08, −0.03 | <0.001 | −1.51 | −9.25, 6.23 | 0.70 | −16.12 | −22.45, −9.80 | <0.001 | 0.03 | −0.04, 0.09 | 0.41 | |
| 2 years | −19.09 | −28.79, −9.38 | <0.001 | −0.042 | −0.07, −0.02 | <0.001 | −15.51 | −25.07, −5.96 | 0.001 | −1.50 | −9.36, 6.35 | 0.71 | −0.11 | −0.19, −0.03 | <0.01 | |
| IGF-BP2 at 4 months | ||||||||||||||||
| 4 months | −0.86 | −1.66, −0.06 | 0.04 | −0.002 | −0.003, 0.00 | 0.06 | −0.28 | −0.90, 0.35 | 0.39 | −0.55 | −1.06, −0.04 | 0.04 | −0.001 | −0.01, 0.00 | 0.84 | |
| 6 months | −1.33 | −2.13, −0.53 | 0.001 | −0.004 | −0.01, −0.00 | <0.001 | −0.40 | −1.03, 0.23 | 0.21 | 0.88 | −1.40, −0.37 | <0.001 | −0.001 | −0.01, 0.00 | 0.77 | |
| 1 year | −1.07 | −1.89, −0.25 | 0.01 | −0.003 | −0.01, −0.00 | <0.001 | −0.08 | −0.99, 0.83 | 0.86 | −1.48 | −2.22, −0.73 | <0.001 | 0.002 | −0.01, 0.01 | 0.56 | |
| 2 years | −1.22 | −2.06, −0.39 | <0.01 | −0.006 | −0.01, −0.00 | <0.001 | −0.08 | −0.92, 0.77 | 0.86 | −0.44 | −1.13, 0.25 | 0.21 | 0.001 | −0.01, 0.01 | 0.68 | |
| IGF−BP3 at 4 months | ||||||||||||||||
| 4 months | 0.41 | 0.13, 0.69 | <0.01 | 0.001 | −0.0002, 0.00 | 0.13 | 0.21 | −0.01, 0.42 | 0.06 | 0.19 | 0.01, 0.37 | 0.04 | 0.001 | −0.000130, 0.003448 | 0.07 | |
| 6 months | 0.55 | 0.27, 0.82 | <0.001 | 0.001 | −0.00002, 0.00 | 0.06 | 0.24 | 0.03, 0.45 | 0.03 | 0.31 | 0.13, 0.49 | <0.001 | 0.001 | −0.001, 0.003 | 0.15 | |
| 1 year | 0.44 | 0.15, 0.72 | <0.01 | 0.001 | −0.0001, 0.00 | 0.08 | 0.14 | −0.16, 0.45 | 0.4 | 0.18 | −0.08, 0.44 | 0.17 | 0.001 | −0.001, 0.003 | 0.62 | |
| 2 years | 0.27 | −0.03, 0.56 | 0.08 | 0.000 | −0.0005, 0.00 | 0.46 | −0.27 | −0.56, 0.02 | 0.07 | 0.28 | 0.03, 0.53 | 0.03 | −0.002 | −0.005, 0.0004 | 0.10 | |
Publisher’s Note: MDPI stays neutral with regard to jurisdictional claims in published maps and institutional affiliations. |
© 2021 by the authors. Licensee MDPI, Basel, Switzerland. This article is an open access article distributed under the terms and conditions of the Creative Commons Attribution (CC BY) license (https://creativecommons.org/licenses/by/4.0/).
Share and Cite
Kouwenhoven, S.M.P.; Fleddermann, M.; Finken, M.J.J.; Twisk, J.W.R.; van der Beek, E.M.; Abrahamse-Berkeveld, M.; van de Heijning, B.J.M.; van Harskamp, D.; van Goudoever, J.B.; Koletzko, B.V. Early-Life Metabolic and Hormonal Markers in Blood and Growth until Age 2 Years: Results from a Randomized Controlled Trial in Healthy Infants Fed a Modified Low-Protein Infant Formula. Nutrients 2021, 13, 1159. https://doi.org/10.3390/nu13041159
Kouwenhoven SMP, Fleddermann M, Finken MJJ, Twisk JWR, van der Beek EM, Abrahamse-Berkeveld M, van de Heijning BJM, van Harskamp D, van Goudoever JB, Koletzko BV. Early-Life Metabolic and Hormonal Markers in Blood and Growth until Age 2 Years: Results from a Randomized Controlled Trial in Healthy Infants Fed a Modified Low-Protein Infant Formula. Nutrients. 2021; 13(4):1159. https://doi.org/10.3390/nu13041159
Chicago/Turabian StyleKouwenhoven, Stefanie M. P., Manja Fleddermann, Martijn J. J. Finken, Jos W. R. Twisk, Eline M. van der Beek, Marieke Abrahamse-Berkeveld, Bert J. M. van de Heijning, Dewi van Harskamp, Johannes B. van Goudoever, and Berthold V. Koletzko. 2021. "Early-Life Metabolic and Hormonal Markers in Blood and Growth until Age 2 Years: Results from a Randomized Controlled Trial in Healthy Infants Fed a Modified Low-Protein Infant Formula" Nutrients 13, no. 4: 1159. https://doi.org/10.3390/nu13041159
APA StyleKouwenhoven, S. M. P., Fleddermann, M., Finken, M. J. J., Twisk, J. W. R., van der Beek, E. M., Abrahamse-Berkeveld, M., van de Heijning, B. J. M., van Harskamp, D., van Goudoever, J. B., & Koletzko, B. V. (2021). Early-Life Metabolic and Hormonal Markers in Blood and Growth until Age 2 Years: Results from a Randomized Controlled Trial in Healthy Infants Fed a Modified Low-Protein Infant Formula. Nutrients, 13(4), 1159. https://doi.org/10.3390/nu13041159