
Dietary Intake, Nutritional Adequacy, and Food Sources of Protein and Relationships with Personal and Family Factors in Spanish Children Aged One to <10 Years: Findings of the EsNuPI Study †


 ,
,  ,
,  ,
,  , , , ,
  ,
,  and
and
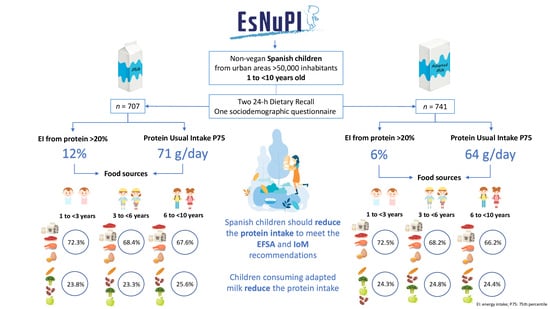
Abstract
1. Introduction
2. Materials and Methods
2.1. Study Design and Population
2.2. Dietary Data Assessment
2.3. Sociodemographic and Anthropometric Data
2.4. Physical Activity and Sedentary Behavior
2.5. Evaluation of Plausible Reporting and Misreporting (Under- and Over-Reporting)
2.6. Statistical Analysis
3. Results
3.1. Subjects Characteristics
3.2. Total Protein Intake and Animal, Plant, and Mixed Protein Intakes
3.3. Contribution to Total Energy Intake from Total, Animal, Plant, and Mixed Protein
3.4. Adequacy of Protein Intake to EFSA and IoM Recommendations
3.5. Association between Total Protein, Animal Protein, Plant Protein, and the Individual Usual Intake of Total Protein and Family- and Personal-Related Factors
3.6. Food Groups Contributing to Total, Animal, and Plant Protein Intake
4. Discussion
4.1. Contribution of Protein to the Total Energy and Total Protein Intake
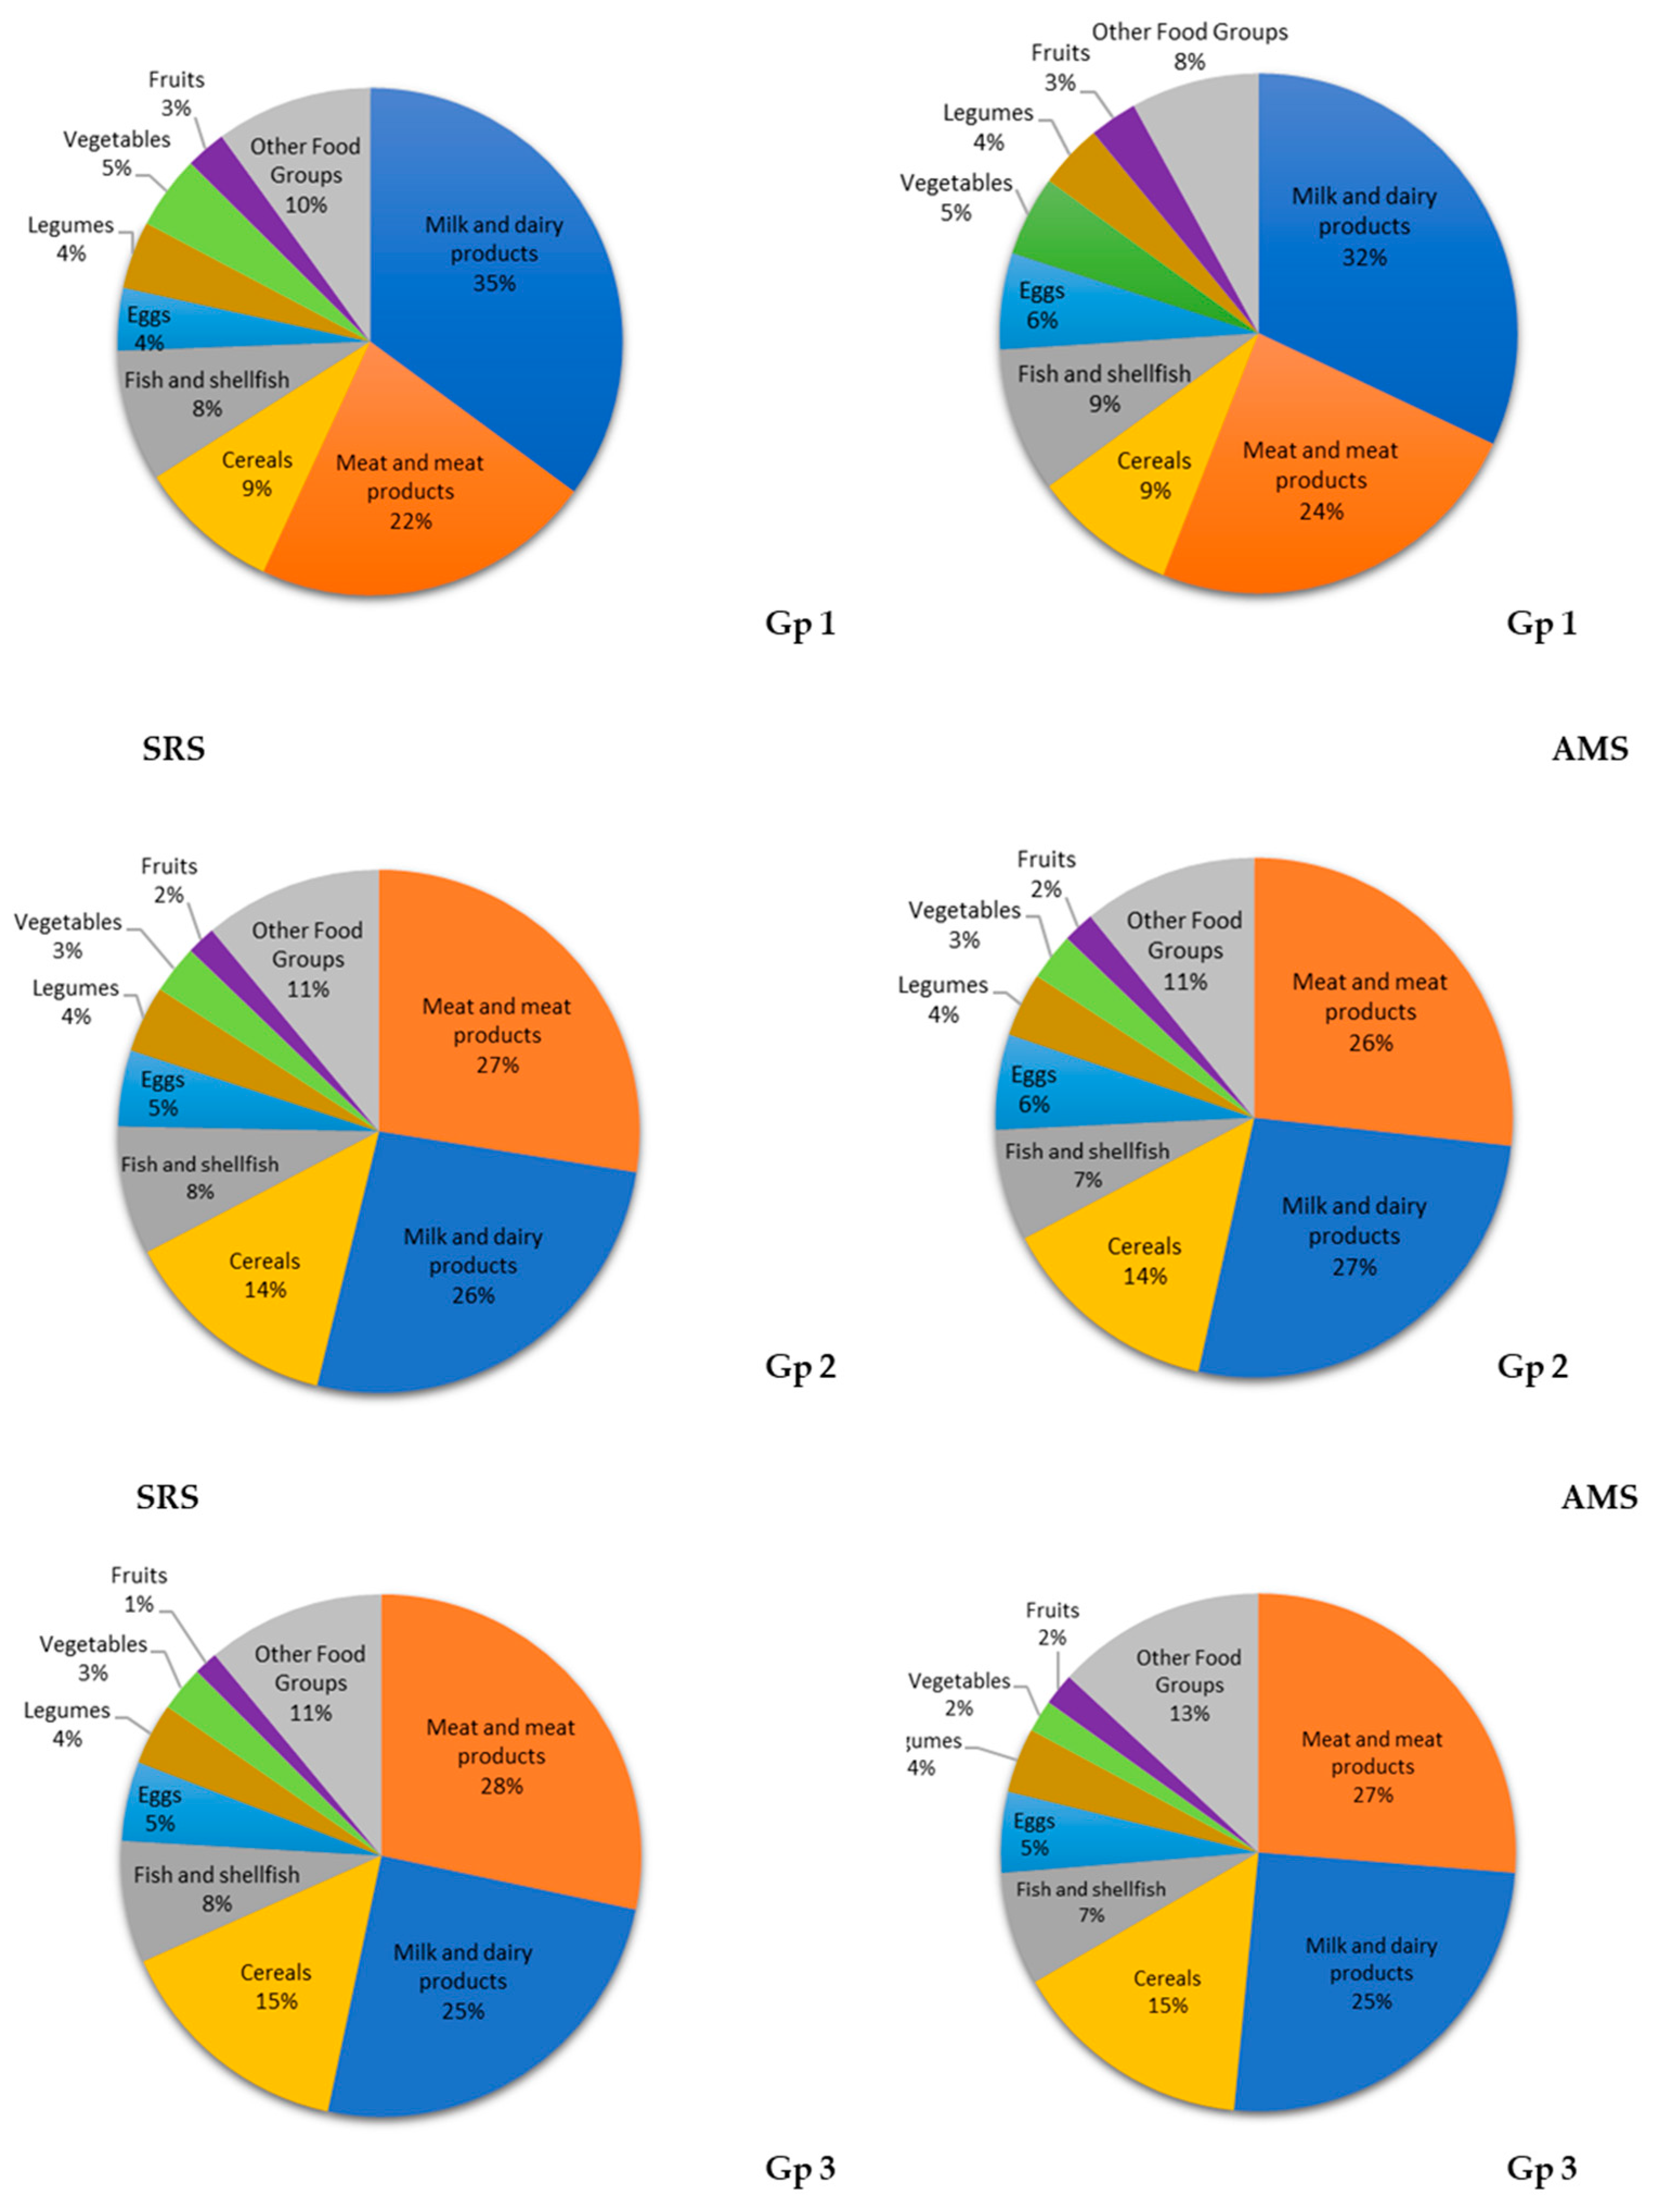
4.2. Contribution of Food Groups to Total, Animal, and Plant Protein Intake
4.3. Strength and Limitations
5. Conclusions
Supplementary Materials
Author Contributions
Funding
Institutional Review Board Statement
Informed Consent Statement
Acknowledgments
Conflicts of Interest
References
- Braun, K.; Erler, N.; Kiefte-de Jong, J.; Jaddoe, V.; van den Hooven, E.; Franco, O.; Voortman, T. Dietary Intake of Protein in Early Childhood Is Associated with Growth Trajectories between 1 and 9 Years of Age. J. Nutr. 2016, 146, 2361–2367. [Google Scholar] [CrossRef]
- Institute of Medicine. Dietary Reference Intakes for Energy, Carbohydrate, Fiber, Fat, Fatty Acids, Cholesterol, Protein, and Amino Acids; The National Academies Press: Washington, DC, USA, 2005. [Google Scholar]
- Lind, M.; Larnkjær, A.; Mølgaard, C.; Michaelsen, K. Dietary protein intake and quality in early life: Impact on growth and obesity. Curr. Opin. Clin. Nutr. Metab. Care 2016, 20, 71–76. [Google Scholar] [CrossRef]
- European Food Safety Authority (EFSA) Dietary Reference Values for the European Union. 2019. Available online: https://www.efsa.europa.eu/en/topics/topic/dietary-reference-values (accessed on 1 March 2020).
- Jen, V.; Karagounis, L.; Jaddoe, V.; Franco, O.; Voortman, T. Dietary protein intake in school-age children and detailed measures of body composition: The Generation R Study. Int. J. Obes. 2018, 42, 1715–1723. [Google Scholar] [CrossRef]
- Subhasish, D.; Sanchez, J.; Alam, A.; Haque, A.; Mahfuz, M.; Ahmed, T.; Long, K.Z. Dietary Magnesium, Vitamin D, and Animal Protein Intake and Their Association to the Linear Growth Trajectory of Children from Birth to 24 Months of Age: Results From MAL-ED Birth Cohort Study Conducted in Dhaka, Bangladesh. Food Nutr. Bull. 2020, 41, 200–210. [Google Scholar]
- Koletzko, B.; Broekaert, I.; Demmelmair, H.; Franke, J.; Hannibal, I.; Oberle, D.; Schiess, S.; Baumann, B.T.; Verwied-Jorky, S. Protein intake in the first year of life: A risk factor for later obesity? Adv. Exp. Med. Biol. 2005, 569, 69–79. [Google Scholar] [PubMed]
- Dalmau, J.; Peña, L.; Morais, A.; Martínez, V.; Varea, V.; Martínez, M.; Soler, B. Análisis cuantitativo de la ingesta de nutrientes en niños menores de 3 años. An. Pediatr. 2015, 82, 255–266. [Google Scholar] [CrossRef] [PubMed]
- Ruiz, E.; Ávila, J.M.; Valero, T.; Del Pozo, S.; Rodriguez, P.; Aranceta-Bartrina, J.; Gil, Á.; González-Gross, M.; Ortega, R.M.; Serra-Majem, L.; et al. Macronutrient Distribution and Dietary Sources in the Spanish Population: Findings from the ANIBES Study. Nutrients 2016, 8, 177. [Google Scholar]
- López-Sobaler, A.M.; Aparicio, A.; Rubio, J.; Marcos, V.; Sanchidrián, R.; Santos, S.; Pérez-Farinós, N.; Dal-Re, M.Á.; Villar-Villalba, C.; Yusta-Boyo, M.J.; et al. Adequacy of usual macronutrient intake and macronutrient distribution in children and adolescents in Spain: A National Dietary Survey on the Child and Adolescent Population, ENALIA 2013–2014. Eur. J. Nutr. 2019, 58, 705–719. [Google Scholar] [CrossRef]
- Aranceta, J.; Serra, L. Objetivos nutricionales para la población española. Consenso de la Sociedad Española de Nutrición Comunitaria, 2011. Rev. Esp. Nutr. Comunitaria 2011, 17, 178–199. [Google Scholar]
- Berryman, C.; Lieberman, H.; Fulgoni, V.; Pasiakos, S. Protein intake trends and conformity with the Dietary Reference Intakes in the United States: Analysis of the National Health and Nutrition Examination Survey, 2001–2014. Am. J. Clin. Nutr. 2018, 108, 405–413. [Google Scholar] [CrossRef]
- Brunner, T.; Casetti, L.; Haueter, P.; Müller, P.; Nydegger, A.; Spalinger, J. Nutrient intake of Swiss toddlers. Eur. J. Nutr. 2018, 57, 2489–2499. [Google Scholar] [CrossRef]
- Börnhorst, C.; Huybrechts, I.; Hebestreit, A.; Krogh, V.; De Decker, A.; Barba, G.; Moreno, L.A.; Lissner, L.; Tornaritis, M.; Loit, H.M.; et al. Usual energy and macronutrient intakes in 2–9-year-old European children. Int. J. Obes. 2014, 38, s115–s123. [Google Scholar] [CrossRef]
- Pimpin, L.; Jebb, S.A.; Johnson, L.; Llewellyn, C.; Ambrosini, G.L. Sources and pattern of protein intake and risk of overweight or obesity in young UK twins. Br. J. Nutr. 2018, 120, 820–829. [Google Scholar] [CrossRef]
- Langsetmo, L.; Barr, S.; Berger, C.; Kreiger, N.; Rahme, E.; Adachi, J.D.; Papaioannou, A.; Kaiser, S.M.; Prior, J.C.; Hanley, D.A.; et al. Associations of protein intake and protein source with bone mineral density and fracture risk: A population-based cohort study. J. Nutr. Health Aging 2015, 19, 861–868. [Google Scholar] [CrossRef]
- Lamas, C.; Castro, M.J.; Gil-Campos, M.; Gil, Á.; Couce, M.L.; Leis, R. Effects of Dairy Product Consumption on Height and Bone Mineral Content in Children: A Systematic Review of Controlled Trials. Adv. Nutr. 2019, 10, S88–S96. [Google Scholar] [PubMed]
- Madrigal, C.; Soto-Méndez, M.J.; Hernández-Ruiz, Á.; Ruiz, E.; Valero, T.; Ávila, J.M.; Lara-Villoslada, F.; Leis, R.; Martínez de Victoria, E.; Moreno, J.M.; et al. Dietary and Lifestyle Patterns in the Spanish Pediatric Population (One to <10 Years Old): Design, Protocol, and Methodology of the EsNuPI Study. Nutrients 2019, 11, 3050. [Google Scholar] [CrossRef] [PubMed]
- European Food Safety Authority (EFSA) Guidance of the EU Menu methodology. EFSA J. 2014, 12, 3944.
- Moreiras, O.; Carbajal, A.; Cabrera, L. Ingestas Diarias Recomendadas de Energía y Nutrientes para la Población Española. In Tablas de Composición de Alimentos, 19th ed.; Ediciones Pirámide (Grupo Anaya, SA): Madrid, Spain, 2018. [Google Scholar]
- Fundación Española de la Nutrición (FEN) Software VD-FEN 2.1 Programa de Valoración Dietética de la FEN; Fundación Española de la Nutrición (FEN): Madrid, Spain, 2013.
- Ruiz-López, M.D.; de Martínez Victoria, E.; Gil, A. Guía Fotográfica de Porciones de Alimentos Consumidos en España; Fundación Iberoamericana de Nutrición: Granada, Spain, 2019. [Google Scholar]
- Camargo, D.M.; Santisteban, S.; Paredes, E.; Flórez, M.; Bueno, D.A. Confiabilidad de un cuestionario para medir actividad física y comportamientos sedentarios en niños desde preescolar a cuarto grado de primaria. Biomedica 2015, 35, 347–356. [Google Scholar] [CrossRef] [PubMed]
- Madrigal, C.; Soto-Méndez, M.J.; Hernández-Ruiz, Á.; Valero, T.; Ávila, J.M.; Ruiz, E.; Lara Villoslada, F.; Leis, R.; Martínez de Victoria, E.; Moreno, J.M.; et al. Energy Intake, Macronutrient Profile and Food Sources of Spanish Children Aged One to 10 Years—Results from the EsNuPI Study. Nutrients 2020, 12, 893. [Google Scholar] [CrossRef] [PubMed]
- European Food Safety Authority (EFSA). Example of a Protocol for Identification of Misreporting (Underand Overreporting of Energy Intake) Based on the PILOT-PANEU Project. Available online: http://www.efsa.europa.eu/sites/default/files/efsa_rep/blobserver_assets/3944A-8-2-1.pdf (accessed on 1 November 2019).
- Souverein, O.W.; Dekkers, A.L.; Geelen, A.; Haubrock, J.; de Vries, J.H. Comparing four methods to estimate usual intake distributions. Eur. J. Clin. Nutr. 2011, 65, s92–s101. [Google Scholar] [CrossRef]
- Cuadrado-Soto, E.; López-Sobaler, A.M.; Jiménez-Ortega, A.I.; Aparicio, A.; Bermejo, L.M.; Hernández-Ruiz, Á.; Lara Villoslada, F.; Leis, R.; Martínez de Victoria, E.; Moreno, J.M.; et al. Usual Dietary Intake, Nutritional Adequacy and Food Sources of Calcium, Phosphorus, Magnesium and Vitamin D of Spanish Children Aged One to <10 Years. Findings from the EsNuPI Study. Nutrients 2020, 12, 1787. [Google Scholar] [CrossRef]
- Samaniego-Vaesken, M.L.; Partearroyo, T.; Valero, T.; Rodriguez, P.; Soto-Méndez, M.J.; Hernández-Ruiz, Á.; Villoslada, F.L.; Leis, R.; Martínez de Victoria, E.; Moreno, J.M.; et al. Carbohydrates, Starch, Total Sugar, Fiber Intake and Food Sources in Spanish Children Aged One to <10 Years-Results from the EsNuPI Study. Nutrients 2020, 12, 3171. [Google Scholar] [CrossRef]
- Fewtrell, M.; Bronsky, J.; Campoy, C.; Domellöf, M.; Embleton, N.; Fidler, N.; Hojsak, I.; Hulst, J.; Indrio, F.; Lapillonne, A.; et al. Complementary Feeding: A Position Paper by the European Society for Paediatric Gastroenterology, Hepatology, and Nutrition (ESPGHAN) Committee on Nutrition. J. Pediatr. Gastroenterol. Nutr. 2017, 64, 119–132. [Google Scholar] [CrossRef]
- World Health Organization (WHO). Protein and Amino Acid Requerements in Human Nutrition; Report of a Joint WHO/FAO/ONU Expert Cosultation; Expert report on diet, nutrition and the prevention of chronic disease; World Health Organization: Geneva, Switzerland, 2007. [Google Scholar]
- European Food Safety Authority. Panel on Dietetic Products, Nutrition and Allergies (NDA). Scientific Opinion on Dietary Reference Values for protein. EFSA J. 2012, 10, 2557. [Google Scholar] [CrossRef]
- Ruiz, E.; Ávila, J.M.; Valero, T.; Pozo, S.; Rodriguez, P.; Aranceta-Bartrina, J.; Gil, Á.; González-Gross, M.; Ortega, R.; Serra-Majem, L.; et al. Energy Intake, Profile, and Dietary Sources in the Spanish Population: Findings of the ANIBES Study. Nutrients 2015, 7, 4739–4762. [Google Scholar] [CrossRef]
- Lin, Y.; Bolca, S.; Vandevijvere, S.; Van Oyen, H.; Van Camp, J.; Backer, G.; Foo, L.; Henauw, S.; Huybrechts, I. Dietary sources of animal and plant protein intake among Flemish preschool children and the association with socio-economic and lifestyle-related factors. Nutr. J. 2011, 10, 97. [Google Scholar] [CrossRef][Green Version]
- Walton, J.; Flynn, A. Nutritional adequacy of diets containing growing up milks or unfortified cow’s milk in Irish children (aged 12–24 months). Food Nutr. Res. 2013, 57, 21836. [Google Scholar] [CrossRef] [PubMed]
- Ghisolfi, J.; Fantino, M.; Turck, D.; Potier de Courcy, G.; Vidailhet, M. Nutrient intakes of children aged 1–2 years as a function of milk consumption, cows’ milk or growing-up milk. Public Health Nutr. 2013, 3, 524–534. [Google Scholar] [CrossRef]
- Vieux, F.; Brouzes, C.; Maillot, M.; Briend, A.; Hankard, R.; Lluch, A.; Darmon, N. Role of Young Child Formulae and Supplements to Ensure Nutritional Adequacy in U.K. Young Children. Nutrients 2016, 8, 539. [Google Scholar] [CrossRef] [PubMed]
- Zhang, J.; Wang, D.; Zhang, Y. Patterns of the Consumption of Young Children Formula in Chinese Children Aged 1–3 Years and Implications for Nutrient Intake. Nutrients 2020, 12, 1672. [Google Scholar] [CrossRef]
- Chouraqui, J.P.; Turck, D.; Tavoularis, G. The Role of Young Child Formula in Ensuring a Balanced Diet in Young Children (1–3 Years Old). Nutrients 2019, 11, 2213. [Google Scholar] [CrossRef]
- Hörnell, A.; Lagström, H.; Lande, B.; Thorsdottir, I. Protein intake from 0 to 18 years of age and its relation to health: A systematic literature review for the 5th Nordic Nutrition Recommendations. Food Nutr. Res. 2013, 23, 57. [Google Scholar] [CrossRef]
- Cerdó, T.; García-Santos, J.A.; Bermúdez, M.; Campoy, C. The Role of Probiotics and Prebiotics in the Prevention and Treatment of Obesity. Nutrients 2019, 11, 635. [Google Scholar] [CrossRef]
- Luque, V.; Closa-Monasterolo, R.; Escribano, J.; Ferré, N. Early Programming by Protein Intake: The Effect of Protein on Adiposity Development and the Growth and Functionality of Vital Organs. Nutr. Metab. Insights 2015, 8, 49–56. [Google Scholar] [CrossRef]
- Weber, M.; Grote, V.; Closa-Monasterolo, R.; Escribano, J.; Langhendries, J.P.; Dain, E.; Giovannini, M.; Verduci, E.; Gruszfeld, D.; Socha, P.; et al. Lower protein content in infant formula reduces BMI and obesity riskat school age: Follow-up of a randomized trial. Am. J. Clin. Nutr. 2014, 99, 1041–1051. [Google Scholar] [CrossRef] [PubMed]
- Merkiel, S. Dietary intake in 6-year-old children from southern Poland: Part 1—Energy and macronutrient intakes. BMC Pediatrics 2014, 14, 197. [Google Scholar]
- Lin, Y.; Mouratidou, T.; Vereecken, C.; Kersting, M.; Bolca, S.; de Moraes, A.C.; Cuenca-García, M.; Moreno, L.A.; González-Gross, M.; Valtueña, J.; et al. Dietary animal and plant protein intakes and their associations with obesity and cardio-metabolic indicators in European adolescents: The HELENA cross-sectional study. Nutr. J. 2015, 14, 10. [Google Scholar] [CrossRef] [PubMed]
- Varela-Moreiras, G.; Ruiz, E.; Valero, T.; Ávila, J.M.; del Pozo, S. The Spanish diet: An update. Nutr. Hosp. 2013, 28, 13–20. [Google Scholar]
- Partearroyo, T.; Samaniego-Vaesken, M.L.; Ruiz, E.; Aranceta-Bartrina, J.; Gil, A.; González-Gross, M.; Ortega, R.M.; Serra-Majem, L.; Varela-Moreiras, G. Current Food Consumption amongst the Spanish ANIBES Study Population. Nutrients 2019, 11, 2663. [Google Scholar] [CrossRef]
- Srbely, V.; Janjua, I.; Buchholz, A.; Newton, G. Interventions Aimed at Increasing Dairy and/or Calcium Consumption of Preschool-Aged Children: A Systematic Literature Review. Nutrients 2019, 11, 714. [Google Scholar] [CrossRef]
- Dror, D.K.; Allen, L.H. Dairy product intake in children and adolescents in developed countries: Trends, nutritional contribution, and a review of association with health outcomes. Nutr. Rev. 2014, 72, 68–81. [Google Scholar] [CrossRef]
- Ortega, R.M.; Jiménez, A.I.; Perea, J.M.; Cuadrado, E.; Aparicio, A.; López-Sobaler, A.M. Nutritional Value of Dairy Products and Recommended Daily Consumption. Nutr. Hosp. 2019, 36, 25–29. [Google Scholar] [CrossRef]
- Santaliestra-Pasías, A.M.; González-Gil, E.M.; Pala, V.; Intemann, T.; Hebestreit, A.; Russo, P.; Van Aart, C.; Rise, P.; Veidebaum, T.; Molnar, D.; et al. Predictive associations between lifestyle behaviours and dairy consumption: The IDEFICS study. Nutr. Metab. Cardiovasc. Dis. 2020, 30, 514–522. [Google Scholar] [CrossRef]
- Del Pozo, S.; García, V.; Cuadrado, C.; Ruiz, E.; Valero, T.; Ávila, J.M.; Varela-Moreiras, G. Valoración Nutricional de la Dieta Española de acuerdo al Panel de Consumo Alimentario; Fundación Española de la Nutrición (FEN): Madrid, Spain, 2012. [Google Scholar]
- Damianidi, L.; Gruszfeld, D.; Verduci, E.; Vecchi, F.; Xhonneux, A.; Langhendries, J.P.; Luque, V.; Theurich, M.A.; Zaragoza-Jordana, M.; Koletzko, B.; et al. Protein intakes and their nutritional sources during the first 2 years of life: Secondary data evaluation from the European Childhood Obesity Project. Eur. J. Clin. Nutr. 2016, 70, 1291–1297. [Google Scholar] [CrossRef]
- Naghshi, S.; Sadeghi, O.; Willett, W.; Esmaillzadeh, A. Dietary intake of total, animal, and plant proteins and risk of all cause, cardiovascular, and cancer mortality: Systematic review and dose-response meta-analysis of prospective cohort studies. BMJ 2020, 370, 1–17. [Google Scholar] [CrossRef]
- Bhathena, S.J.; Velasquez, M.T. Beneficial role of dietary phytoestrogens in obesity and diabetes. Am. J. Clin. Nutr. 2002, 76, 1191–1201. [Google Scholar] [CrossRef]
- Cederroth, C.R.; Nef, S. Soy, phytoestrogens and metabolism: A review. Mol. Cell. Endocrinol. 2009, 304, 30–42. [Google Scholar] [CrossRef]
- Günther, A.; Remer, T.; Kroke, A.; Buyken, A. Early protein intake and later obesity risk: Which protein sources at which time points throughout infancy and childhood are important for body mass index and body fat percentage at 7 y of age? J. Clin. Nutr. 2007, 86, 1765–1772. [Google Scholar] [CrossRef]
- Richter, C.; Skulas-Ray, A.; Champagne, C.; Kris-Etherton, P. Plant Protein and Animal Proteins: Do They Differentially Affect Cardiovascular Disease Risk? Adv. Nutr. 2015, 6, 6712–6728. [Google Scholar] [CrossRef]


| Spanish Reference Cohort (SRS) | Adapted Milk Consumers Cohort (AMS) | ||||||
|---|---|---|---|---|---|---|---|
| Total | Boys | Girls | Total | Boys | Girls | ||
| n = 707 | n = 357 | n = 350 | n = 741 | n = 371 | n = 370 | ||
| Age, mean ± SD (years) | One to <3 years | 1.52 ± 0.50 | 1.60 ± 0.49 | 1.44 ± 0.50 | 1.46 ± 0.50 | 1.44 ± 0.50 | 1.48 ± 0.50 |
| Three to <6 years | 3.87 ± 0.82 | 3.85 ± 0.82 | 3.89 ± 0.83 | 3.79 ± 0.82 | 3.81 ± 0.83 | 3.76 ± 0.82 | |
| Six to <10 years | 7.60 ± 1.12 | 7.55 ± 1.11 | 7.66 ± 1.12 | 7.57 ± 1.10 | 7.61 ± 1.11 | 7.53 ± 1.09 | |
| One to <3 years | 162 (22.9) * | 84 (23.5) * | 78 (22.3) * | 294 (39.7) * | 144 (38.8) * | 150 (40.5) * | |
| Age group, n (%) | Three to <6 years | 244 (34.5) * | 122 (34.2) * | 122 (34.9) * | 262 (35.4) * | 128 (34.5) * | 134 (36.2) * |
| Six to <10 years | 301 (42.6) * | 151 (42.3) * | 150 (42.9) * | 185 (25) * | 99 (26.7) * | 86 (23.2) * | |
| Anthropometric characteristics, median (IQR) | Z-BMI/Age | 0.6 (−0.3–1.5) | 0.6 (−0.3–1.5) | 0.6 (−0.3–1.4) | 0.5 (−0.3–(−1.4) | 0.45 (−0.3–1.4) | 0.5 (−0.3–1.4) |
| Z-Weight/Age | 0.5 (−0.3–1.2) | 0.4 (−0.4–1.2) | 0.6 (−0.3–1.3) | 0.6 (−0.3–1.4) | 0.6 (−0.1–1.4) | 0.5 (−0.3–1.4) | |
| Z-Height/Age | −0.3 (−1.2–(−0.9)) | −0.2 (−1.1–1.0) | −0.4 (−1.3–0.7) | −0.4 ** (−1.4–0.6) | −0.4 ** (−1.4–0.6) | −0.4 (−1.5–0.6) | |
| PAL, median (IQR) | One to <3 years | 1.6 (1.3–1.8) | 1.6 (1.4–1.8) | 1.5 (1.3–1.8) | 1.5 (1.3–1.7) | 1.5 (1.3–1.8) | 1.5 (1.3–1.7) |
| Three to <6 years | 1.6 (1.4–1.7) | 1.6 (1.4–1.7) | 1.5 (1.4–1.7) | 1.5 (1.4–1.7) | 1.5 (1.4–1.7) | 1.5 (1.4−1.7) | |
| Six to <10 years | 1.6 (1.4–1.7) | 1.6 (1.4–1.8) | 1.6 (1.5–1.7) | 1.6 (1.5–1.7) | 1.6 (1.5–1.8) | 1.6 (1.5−1.7) | |
| Size of the municipality, n (%) | 50,001 to 300,000 people | 376 (53.2) | 193 (54.1) | 183 (52.3) | 406 (54.8) | 204 (55.0) | 202 (54.6) |
| >300,000 people | 331 (46.8) | 164 (45.9) | 167 (47.7) | 335 (45.2) | 167 (45.0) | 168 (45.4) | |
| Highest level of education achieved by one of the parents, n (%) | ≤10 years of education | 23 (3.3) | 10 (2.9) | 13 (3.8) | 14 (1.9) | 7 (1.9) | 7 (1.9) |
| Secondary education | 416 (60.5) | 219 (62.9) | 197 (57.9) | 414 (57.0) | 208 (57.5) | 206 (56.6) | |
| University studies | 249 (36.2) | 119 (34.2) | 130 (38.2) | 298 (41.0) | 147 (40.6) | 151 (41.5) | |
| Family income, n (%) | Low (<1500 €) | 171 (24.2) | 79 (22.1) | 92 (26.3) | 163 (22.0) | 84 (22.6) | 79 (21.4) |
| Medium (1501 to 2000 €) | 126 (17.8) | 67 (18.8) | 59 (16.9) | 134 (18.1) | 64 (17.3) | 70 (18.9) | |
| High (>2000 €) | 226 (32.0) | 123 (34.5) | 103 (29.4) | 238 (32.1) | 110 (29.6) | 128 (34.6) | |
| No answer/doesn’t know | 184 (26.0) | 88 (24.6) | 96 (27.4) | 206 (27.8) | 113 (30.5) | 93 (25.1) | |
| Number of feeding bottles or glasses of milk per day, n (%) | Less than two | 222 (32.9) | 110 (32.0) | 115 (33.8) | 178 (24.1) | 92 (24.9) | 86 (23.3) |
| Two or more | 459 (67.1) | 234 (68.0) | 225 (66.2) | 561 (75.9) | 278 (75.1) | 283 (76.7) | |
| Spanish Reference Cohort (SRS) | |||||||||||||
| One to <3 years n = 162 | Three to <6 years n = 244 | Six to <10 years n = 301 | |||||||||||
| Protein (g/d) | Mean | SD | Median | IQR | Mean | SD | Median | IQR | Mean | SD | Median | IQR | p |
| Total | 48.67 | 16.57 | 47.61 a | 20.75 | 61.91 | 15.85 | 61.67 b | 18.66 | 67.85 | 16.69 | 67.04 c | 23.58 | <0.001 |
| Animal | 33.79 | 12.65 | 33.71 a | 17.95 | 41.67 | 13.71 | 40.57 b | 17.29 | 44.79 | 13.42 | 43.71 c | 18.23 | <0.001 |
| Plant | 11.88 | 6.32 | 10.65 a | 9.73 | 15.30 | 6.22 | 14.25 b | 9.30 | 17.64 | 7.07 | 16.97 c | 9.23 | <0.001 |
| Mixed ‡ | 2.63 | 4.38 | 0.87 a | 3.09 | 4.33 | 4.94 | 2.35 b | 6.14 | 5.03 | 5.23 | 3.09 b | 6.97 | <0.001 |
| Animal: Plant ratio | 3.74 | 3.59 | 2.92 | 2.38 | 3.20 | 1.81 | 2.89 | 1.99 | 2.96 | 1.47 | 2.59 | 1.78 | 0.111 |
| Total Protein (g/kg) § | 4.08 | 1.30 | 4.02 a | 1.66 | 3.62 | 1.16 | 3.49 b | 1.34 | 2.53 | 0.83 | 2.42 c | 1.04 | <0.001 |
| Adapted Milk Consumer Cohort (AMS) | |||||||||||||
| One to <3 years n = 294 | Three to <6 years n = 262 | Six to <10 years n = 185 | |||||||||||
| Protein (g/d) | Mean | SD | Median | IQR | Mean | SD | Median | IQR | Mean | SD | Median | IQR | p |
| Total | 44.57 | 15.00 | 43.42 *a | 19.12 | 58.59 | 15.06 | 57.35 *b | 21.64 | 64.81 | 16.21 | 64.44 c | 21.39 | <0.001 |
| Animal | 31.78 | 12.64 | 30.41 a | 17.76 | 39.43 | 12.29 | 38.38 b | 18.95 | 42.32 | 14.14 | 41.42 *b | 18.97 | <0.001 |
| Plant | 10.73 | 4.94 | 9.72 a | 5.89 | 14.69 | 5.89 | 13.55 b | 8.36 | 15.96 | 5.80 | 15.51 *b | 8.07 | <0.001 |
| Mixed ‡ | 1.65 | 2.77 | 0.70 a | 1.96 | 3.98 | 4.93 | 2.10 b | 4.54 | 6.18 | 6.05 | 4.54 *c | 8.23 | <0.001 |
| Animal: Plant ratio | 3.44 | 1.91 | 2.94 | 2.01 | 3.13 | 1.95 | 2.70 | 1.93 | 3.00 | 1.45 | 2.67 | 1.81 | 0.033 |
| Total Protein (g/kg) § | 3.84 | 1.38 | 3.63 *a | 1.70 | 3.60 | 1.08 | 3.52 a | 1.46 | 2.53 | 0.89 | 2.41 b | 1.16 | <0.001 |
| Spanish Reference Cohort (SRS) | |||||||||||||||||
| Total n = 707 | One to <3 years n = 162 | Three to <6 years n = 244 | Six to <10 years n = 301 | ||||||||||||||
| Contribution (%) total protein | Mean | SD | Median | IQR | Mean | SD | Median | IQR | Mean | SD | Median | IQR | Mean | SD | Median | IQR | p |
| Total (% EI) | 16.79 | 2.76 | 16.60 | 3.49 | 15.91 | 3.00 | 15.94 a | 3.99 | 17.01 | 2.53 | 16.94 b | 3.37 | 17.09 | 2.70 | 16.85 b | 3.40 | <0.001 |
| Animal | 67.70 | 11.57 | 68.65 | 15.63 | 70.41 | 12.94 | 72.33 a | 16.31 | 67.40 | 11.17 | 68.47 b | 15.13 | 66.24 | 10.86 | 67.65 b | 14.72 | <0.001 |
| Plant | 25.65 | 9.81 | 24.57 | 12.23 | 24.74 | 11.47 | 23.82 | 13.25 | 25.46 | 9.37 | 23.34 | 12.39 | 26.29 | 9.16 | 25.60 | 11.76 | 0.136 |
| Mixed ‡ | 6.76 | 7.80 | 3.65 | 9.47 | 4.85 | 7.45 | 1.64 a | 6.98 | 7.13 | 8.05 | 4.06 b | 9.88 | 7.47 | 9.97 | 4.67 b | 7.62 | <0.001 |
| Adapted Milk Consumer Cohort (AMS) | |||||||||||||||||
| Total n = 741 | One to <3 years n = 294 | Three to <6 years n = 262 | Six to <10 years n = 185 | ||||||||||||||
| Contribution (%) total protein | Mean | SD | Median | IQR | Mean | SD | Median | IQR | Mean | SD | Median | IQR | Mean | SD | Median | IQR | p |
| Total (% EI) | 15.63 | 2.60 | 15.49 * | 3.19 | 14.92 | 2.46 | 14.72 *a | 2.91 | 15.79 | 2.58 | 15.59 *b | 3.10 | 16.55 | 2.53 | 16.34 *c | 3.09 | <0.001 |
| Animal | 68.45 | 11.31 | 69.76 | 15.14 | 71.29 | 11.13 | 72.56 a | 13.55 | 67.66 | 10.81 | 68.29 b | 15.53 | 65.04 | 11.22 | 66.25 b | 14.28 | <0.001 |
| Plant | 25.20 | 8.81 | 24.42 | 11.89 | 24.93 | 9.44 | 24.30 | 12.22 | 25.64 | 8.74 | 24.84 | 12.66 | 25.01 | 7.83 | 24.48 | 11.12 | 0.504 |
| Mixed ‡ | 6.36 | 7.98 | 3.39 | 8.67 | 3.78 | 6.00 | 1.67 a | 4.71 | 6.70 | 7.94 | 3.86 b | 7.65 | 9.95 | 9.27 | 7.07 *c | 13.30 | <0.001 |
| Spanish Reference Cohort (SRS) | Adapted Milk Consumers Cohort (AMS) | |||||||
|---|---|---|---|---|---|---|---|---|
| Total n = 687 | Total n = 726 | |||||||
| (g/Day) | Mean | β | CI (95%) | p | Mean | β | CI (95%) | p |
| Protein | 61.45 | 54.62 | ||||||
| Geographical area (Nielsen area) | −0.486 | (−1.037)–0.066 | 0.084 | −0.111 | (−0.620)–0.399 | 0.670 | ||
| Family income | 0.790 | (−0.486)–2.066 | 0.224 | 1.695 | 0.479–2.910 | 0.006 * | ||
| Highest level of education achieved by one of the parents | −0.063 | (−1.033)–0.907 | 0.898 | −1.082 | (−2.006)–(−0.158) | 0.022 * | ||
| Animal Protein | 41.21 | 37.17 | ||||||
| Geographical area (Nielsen area) | 0.103 | (−0.330)–0.535 | 0.641 | 0.028 | (−0.370)–0.427 | 0.889 | ||
| Family income | 0.188 | (−0.813)–1.189 | 0.713 | 1.277 | 0.328–2.227 | 0.008 * | ||
| Highest level of education achieved by one of the parents | −0.090 | (−0.851)–0.672 | 0.817 | −0.784 | (−1.506)–(−0.063) | 0.033 * | ||
| Plant Protein | 15.53 | 13.41 | ||||||
| Geographical area (Nielsen area) | −0.250 | (−0.459)–(−0.040) | 0.019 * | −0.081 | (−0.253)–0.091 | 0.355 | ||
| Family income | 0.353 | (−0.132)–0.837 | 0.153 | 0.453 | 0.043–0.863 | 0.031 * | ||
| Highest level of education achieved by one of the parents | 0.220 | (−0.148)–0.588 | 0.241 | −0.253 | (−0.565)–0.059 | 0.112 | ||
| Mixed Protein ‡ | 4.24 | 3.63 | ||||||
| Geographical area (Nielsen area) | −0.377 | (−0.529)–(−0.224) | 0.000 * | −0.163 | (−0.306)–(−0.020) | 0.026 * | ||
| Family income | 0.220 | (−0.133)–(0.573) | 0.222 | −0.019 | (−0.361)–0.322 | 0.913 | ||
| Highest level of education achieved by one of the parents | −0.204 | (−0.473)–(0.064) | 0.136 | −0.021 | (−0.281)–0.238 | 0.872 | ||
| IUI Protein Percentiles | Total | One to <3 years | Three to <6 years | Six to <10 years |
|---|---|---|---|---|
| <P25 | 53.60 | 40.50 | 55.49 | 60.80 |
| >P75 | 71.31 | 54.61 | 68.83 | 75.71 |
| Adapted Milk Consumer Cohort (AMS) | ||||||||
|---|---|---|---|---|---|---|---|---|
| Total n = 741 | One <3 Years n = 294 | Three <6 Years n = 262 | Six <10 Years n = 185 | |||||
| IUI Protein | n | % | n | % | n | % | n | % |
| <25th percentile | 299 | 40.35 | 117 | 39.80 | 117 | 44.66 | 65 | 35.14 |
| ≥25th to ≤75th percentile | 335 | 45.21 | 139 | 47.28 | 110 | 41.98 | 86 | 45.49 |
| >75th percentile | 107 | 14.44 | 38 | 12.93 | 35 | 13.36 | 34 | 18.38 |
| Spanish Reference Cohort (SRS) | |||||||||||||
|---|---|---|---|---|---|---|---|---|---|---|---|---|---|
| IUI Protein (g/day) ≥P75 † (ref.: <P75) | Total Protein (g/day) ≥P75 † (ref.: <P75) | Animal Protein (g/day) ≥P75 † (ref.: <P75) | Plant Protein (g/day) ≥P75 † (ref.: <P75) | ||||||||||
| Factor | Subcategories | OR | CI | p | OR | CI | p | OR | CI | p | OR | CI | p |
| Sex | Boys | 1 | 1 | 1 | 1 | ||||||||
| Girls | 1.20 | 0.86–1.69 | 0.287 | 1.32 | 0.94–1.86 | 0.113 | 1.28 | 0.91–1.80 | 0.158 | 1.32 | 0.94–1.86 | 0.113 | |
| Number of feeding bottles or glasses of milk per day | Less than two | 1 | 1 | 1 | 1 | ||||||||
| Two or more | 1.17 | 0.81–1.68 | 0.407 | 1.13 | 0.78–1.62 | 0.520 | 1.05 | 0.73–1.52 | 0.790 | 1.20 | 0.83–1.73 | 0.338 | |
| PAL | ≥P50 by sex and age | 1.19 | 0.85–1.67 | 0.318 | 1.19 | 0.85–1.67 | 0.317 | 1.30 | 0.93–1.83 | 0.129 | 0.73 | 0.52–1.03 | 0.075 |
| Size of municipality (n) | 50,000–300,000 | 1 | 1 | 1 | 1 | ||||||||
| >300,000 | 0.75 | 0.53–1.05 | 0.095 | 0.77 | 0.55–1.08 | 0.134 | 0.90 | 0.64–1.26 | 0.530 | 0.66 | 0.47–0.93 | 0.018 * | |
| Family income (€) | ≤1500 | 1 | 1 | 1 | 1 | ||||||||
| 1501–2000 | 1.06 | 0.64–0.75 | 0.809 | 0.97 | 0.59–1.59 | 0.892 | 0.95 | 0.58–1.54 | 0.823 | 1.18 | 0.70–1.97 | 0.540 | |
| ≥2000 | 0.76 | 0.43–1.36 | 0.356 | 0.72 | 0.40–1.27 | 0.253 | 0.82 | 0.48–1.41 | 0.467 | 1.51 | 0.88–2.60 | 0.135 | |
| Not known/no answer | 1.79 | 1.14–2.79 | 0.011 * | 1.65 | 1.06–2.56 | 0.027 * | 1.13 | 0.73–1.77 | 0.578 | 1.95 | 1.23–3.10 | 0.005 * | |
| Highest level of education achieved by one parent | ≤10 years of education | 1 | 1 | 1 | 1 | ||||||||
| Secondary education | 0.86 | 0.53–1.40 | 0.553 | 0.83 | 0.51–1.34 | 0.436 | 0.78 | 0.48–1.28 | 0.321 | 0.86 | 0.54–1.39 | 0.546 | |
| University studies | 1.15 | 0.78–1.70 | 0.492 | 1.06 | 0.72–1.56 | 0.772 | 1.14 | 0.77–1.68 | 0.509 | 0.86 | 0.58–1.27 | 0.452 | |
| Adapted Milk Consumers Cohort (AMS) | |||||||||||||
|---|---|---|---|---|---|---|---|---|---|---|---|---|---|
| IUI Protein (g/Day) ≥P75 † (ref.: <P75) | Total Protein (g/Day) ≥P75 † (ref.: <P75) | Animal Protein (g/day) ≥P75 † (ref.: <P75) | Plant Protein (g/day) ≥P75 † (ref.: <P75) | ||||||||||
| Factor | Subcategories | OR | CI | p | OR | CI | p | OR | CI | p | OR | CI | p |
| Sex | Boys | 1 | 1 | 1 | 1 | ||||||||
| Girls | 0.81 | 0.53–1.22 | 0.304 | 0.92 | 0.63–1.35 | 0.677 | 0.70 | 0.49–1.02 | 0.062 | 1.19 | 0.81–1.75 | 0.387 | |
| Number of feeding bottles or glasses of milk per day | Less than two | 1 | 1 | 1 | 1 | ||||||||
| Two or more | 1.35 | 0.85–2.12 | 0.202 | 1.45 | 0.95–2.21 | 0.084 | 0.98 | 0.63–1.50 | 0.910 | 1.62 | 1.07–2.47 | 0.024 * | |
| PAL | ≥P50 by sex and age | 1.29 | 0.85–1.94 | 0.226 | 1.38 | 0.94–2.02 | 0.098 | 1.22 | 0.85–1.76 | 0.286 | 1.09 | 0.74–1.60 | 0.675 |
| Size of municipality (n) | 50,000–300,000 | 1 | 1 | 1 | 1 | ||||||||
| >300,000 | 0.44 | 0.29–0.67 | <0.001 * | 0.47 | 0.32–0.69 | <0.001 * | 0.66 | 0.46–0.95 | 0.027 * | 0.73 | 0.49–1.07 | 0.109 | |
| Family income (€) | ≤1500 | 1 | 1 | 1 | 1 | ||||||||
| 1501–2000 | 0.60 | 0.33–1.07 | 0.085 | 0.51 | 0.30–0.88 | 0.016 * | 0.75 | 0.45–1.25 | 0.271 | 0.56 | 0.31–1.01 | 0.055 | |
| ≥2000 | 0.42 | 0.21–0.84 | 0.014 * | 0.42 | 0.23–0.78 | 0.006 * | 0.66 | 0.38–1.15 | 0.146 | 0.38 | 0.19–0.77 | 0.007 * | |
| Not known/no answer | 0.76 | 0.46–1.25 | 0.287 | 0.65 | 0.41–1.03 | 0.068 | 0.67 | 0.42–1.06 | 0.088 | 1.21 | 0.76–1.92 | 0.417 | |
| Highest level of education achieved by one parent | ≤10 years of education | 1 | 1 | 1 | 1 | ||||||||
| Secondary education | 1.21 | 0.67–2.21 | 0.526 | 1.14 | 0.65–1.99 | 0.650 | 1.37 | 0.82–2.29 | 0.228 | 0.75 | 0.40–1.41 | 0.374 | |
| University studies | 1.54 | 0.97–2.45 | 0.065 | 1.57 | 1.03–2.40 | 0.038 * | 1.34 | 0.89–2.03 | 0.160 | 1.53 | 0.99–2.35 | 0.055 | |
Publisher’s Note: MDPI stays neutral with regard to jurisdictional claims in published maps and institutional affiliations. |
© 2021 by the authors. Licensee MDPI, Basel, Switzerland. This article is an open access article distributed under the terms and conditions of the Creative Commons Attribution (CC BY) license (http://creativecommons.org/licenses/by/4.0/).
Share and Cite
Madrigal, C.; Soto-Méndez, M.J.; Hernández-Ruiz, Á.; Valero, T.; Lara Villoslada, F.; Leis, R.; Martínez de Victoria, E.; Moreno, J.M.; Ortega, R.M.; Ruiz-López, M.D.; et al. Dietary Intake, Nutritional Adequacy, and Food Sources of Protein and Relationships with Personal and Family Factors in Spanish Children Aged One to <10 Years: Findings of the EsNuPI Study. Nutrients 2021, 13, 1062. https://doi.org/10.3390/nu13041062
Madrigal C, Soto-Méndez MJ, Hernández-Ruiz Á, Valero T, Lara Villoslada F, Leis R, Martínez de Victoria E, Moreno JM, Ortega RM, Ruiz-López MD, et al. Dietary Intake, Nutritional Adequacy, and Food Sources of Protein and Relationships with Personal and Family Factors in Spanish Children Aged One to <10 Years: Findings of the EsNuPI Study. Nutrients. 2021; 13(4):1062. https://doi.org/10.3390/nu13041062
Chicago/Turabian StyleMadrigal, Casandra, María José Soto-Méndez, Ángela Hernández-Ruiz, Teresa Valero, Federico Lara Villoslada, Rosaura Leis, Emilio Martínez de Victoria, José Manuel Moreno, Rosa M. Ortega, María Dolores Ruiz-López, and et al. 2021. "Dietary Intake, Nutritional Adequacy, and Food Sources of Protein and Relationships with Personal and Family Factors in Spanish Children Aged One to <10 Years: Findings of the EsNuPI Study" Nutrients 13, no. 4: 1062. https://doi.org/10.3390/nu13041062
APA StyleMadrigal, C., Soto-Méndez, M. J., Hernández-Ruiz, Á., Valero, T., Lara Villoslada, F., Leis, R., Martínez de Victoria, E., Moreno, J. M., Ortega, R. M., Ruiz-López, M. D., Varela-Moreiras, G., & Gil, Á. (2021). Dietary Intake, Nutritional Adequacy, and Food Sources of Protein and Relationships with Personal and Family Factors in Spanish Children Aged One to <10 Years: Findings of the EsNuPI Study. Nutrients, 13(4), 1062. https://doi.org/10.3390/nu13041062