
Recent Trends in Dietary Habits of the Italian Population: Potential Impact on Health and the Environment


1
Department of Clinical Medicine and Surgery, Federico II University, 80131 Naples, Italy
2
Department of Pharmacy, Federico II University, 80131 Naples, Italy
*
Author to whom correspondence should be addressed.
Nutrients 2021, 13(2), 476; https://doi.org/10.3390/nu13020476
Submission received: 15 December 2020
/
Revised: 25 January 2021
/
Accepted: 28 January 2021
/
Published: 31 January 2021
(This article belongs to the Special Issue Nutrition during the Lifespan: Underpinning Innovation?)
Abstract
:Population growth, globalization, urbanization, and economic pressures are causing changes in food consumption all over the world. The study’s aims are (1) to evaluate trends in food habits in Italy to highlight deviations from the traditional Mediterranean diet, (2) to analyze the features of the present Italian diet that should be modified to meet evidence-based global scientific targets for a healthy and sustainable diet proposed by the EAT–Lancet Commission. Trends in food availability for human consumption during the period 2000–2017 were assessed using the food balance sheets (FBSs). Greenhouse gas (GHG) emission was estimated according to life cycle assessment (LCA) analyses. During the study period, the availability of animal fat and beef meat greatly declined (−58% and −32%, respectively), followed by fruit, potatoes, vegetables, milk, and non-tropical oils (−20%, −15%, −13%, −14%, and −11%, respectively). A substantial increase has occurred for tropical oils, fish, and nuts (+156, +26%, and +21%, respectively). In order to meet the targets of consumption proposed by the EAT–Lancet Commission, the consumption of legumes and nuts should be almost doubled, whereas the consumption of meat, eggs, dairy products, animal fat, tropical oils, and sugars should be reduced by proportions ranging from 60% to 90%. If implemented, these changes would reduce the diet-related greenhouse gas emission by nearly 50%. In conclusion, these data call for nutritional education programs and interventions on the food system aimed at promoting a healthier and more environmentally sustainable diet. To this end, the availability and affordability of products with a better impact on human health and the environment should be promoted.
1. Introduction
A large body of evidence highlights dietary choices as lifestyle features strongly associated with chronic non-communicable diseases (NCDs), such as cancer, cardiovascular disease, and diabetes, that represent the main cause of premature death and disability [1,2]. The traditional Mediterranean diet is a balanced model of healthy eating deeply rooted in a rich cultural and gastronomic background. Because of its distinctiveness in terms of practical knowledge and traditions and its strong cultural foundations, the Mediterranean diet has been recognized by UNESCO as an “Intangible Cultural Heritage of Humanity.”
The health benefits of the traditional Mediterranean diet have been well documented over the years. Several studies have consistently shown a positive association between a diet resembling the Mediterranean model, a longer lifespan, and a lower risk of diabetes, cardiovascular disease, and cancer; more recent evidence suggests that also cognitive decline and chronic digestive diseases occur less frequently. These findings have been consistently reproduced in different countries and in various ethnic groups [3,4,5,6,7,8,9].
In addition, the Mediterranean diet represents a potentially useful means to achieve the Agenda 2030 Sustainable Development Goals because it can help reduce the environmental impact of the diet [10]. The relevance of the food choices in relation to ecological sustainability is gaining increasing support in the scientific literature. Food production and distribution contribute at least one-third of the greenhouse gas (GHG) emissions, thus playing a significant role in climate change. However, not all foods have the same ecological impact; in general, foods of animal origin have a greater impact on environmental degradation than those of vegetable origin [11].
Italy has been traditionally linked to the Mediterranean diet since the pioneering work of Keys et al. [12]. The traditional Italian cuisine is typically based on large quantities of vegetables, fruit, cereals, legumes, nuts, and limited amounts of animal products. In addition, it has another important feature—the use of olive oil, rather than animal fat, for cooking [13]. However, population growth, globalization, urbanization, and economic pressures are causing changes in the food systems, eating habits, and food consumption patterns towards a globalized approach, with undesired effects on people’s health and the environment [14]; in this process, Italy is no exception. Providing a growing global population with healthy and environmentally more sustainable food options is an urgent challenge. To this aim, the “EAT–Lancet Commission on healthy diets from sustainable food systems” has produced a reference diet with indications for recommendable ranges of intake [14]. This commission brings together 19 commissioners from 16 countries, experts in various fields of human health, to develop global scientific targets based on the best evidence available for healthy diets and sustainable food production.
Against this background, the study’s aims are (1) to evaluate trends in food habits in Italy to highlight any deviations from the traditional Mediterranean diet and (2) to analyze the features of the present-day Italian diet that should be modified to meet the evidence-based global scientific targets for a healthy and sustainable diet proposed by the EAT–Lancet Commission.
2. Materials and Methods
2.1. Food Balance Sheets (FBSs)
The evolution of food availability over time in Italy has been assessed by the food balance sheets (FBSs), the statistical databases of the Food and Agriculture Organization (FAO) of the United Nations, which provide a comprehensive picture of the food available for consumption in each country, during a specified reference time period [15]. The food supply during each year is estimated as the sum of the total quantity of foodstuffs produced (including production, imports, and stock changes) minus exports, food use other than human feed (including animal feed, seeds for agricultural use, etc.), and food losses during food transport, storage, and processing. The per capita food supply available for human consumption in Italy is then obtained by dividing the respective quantity of each food group by the number of people living in the country in the same time period. Because FBS data do not consider food waste occurring with food distribution and consumption at the household level, for each food category we have calculated the amount of food available for human consumption by subtracting from the per capita food supply obtained from FBSs, the presumable waste, as calculated by FAO [15,16], following the formula of the amount of per capita food available for human consumption (FBS data) minus presumable waste (FAO). The reported estimate of food loss and waste has remained stable during the years. The data reported in the tables and figures pertain to “food available for human consumption”, and the terms “food consumption,” “food intake,” or “food supply” should be read as “food available for human consumption.” Raw data are given in the supplemental table (Table S1).
Data were extracted for the following food groups—fruits, vegetables, legumes, nuts, potatoes, cereals, beef and pork meat, poultry, fish, eggs, milk, animal fat, tropical oils (coconut, palm, and palm kernel), non-tropical oils (maize, olive, sunflower, rapeseed, peanut, and soybean), and sugars. Subsequently, the average per capita supply of macronutrients (i.e., energy, protein, and fats). as reported by the FBSs, was used in the analyses; carbohydrate content was estimated using the following formula:
Carbohydrate content in grams = total energy − (energy from fat + energy from protein + energy from alcohol) /4 (the energy value provided by 1 gram of carbohydrates).
Consumption trends were evaluated starting from the beginning of this century up to the year 2017, which represents the most updated information available. Because some difficulties are encountered when estimating trade, production, and stock changes on an annual scale, we reported the mean and range of three-year periods to minimize estimation errors; the average figures relative to the last available observation (i.e., years 2015–2017) has been compared with the average intake recommended by the EAT–Lancet Commission [14] to highlight the desirable changes in consumption necessary to meet the recommendations.
2.2. Green House Gas (GHG) Emission
GHG covers CO2 emissions from fossil fuels, CH4 released during cattle rearing and the cultivation of certain crops, and N2O released from fertilizers, manure, and plowing of grassland. It is expressed as Kg CO2-equivalents (CO2e) calculated by adding CO2eq, N2O, and CO2eq CH4 to CO2 emissions. These metrics are estimated according to life cycle assessment (LCA) analyses. LCA is an internationally recognized method employed to estimate the impact of resource use at all stages of a product’s lifespan [17]. For most food groups, we used the GHG data provided by the study of Naja et al. [11], which was conducted in the Mediterranean area (Lebanon) with climate and food choices not dissimilar from Italy’s. In order to obtain GHG values expressed in a conventional way, i.e., Kg/capita/year–data on food supplies expressed as g/capita/day was multiplied by 365/1000 and then multiplied again by the corresponding values of GHG per Kg food. When a food group included multiple items, CO2 was calculated separately for each item based on the amount available for consumption according to FBS, and then summed-up.
3. Results
Data on the quantity of each food group available for consumption over time—corrected for waste—are reported in Table 1; they represent the average of three-year periods. Information on the crude yearly data without waste correction is given in Supplemental Table S1.
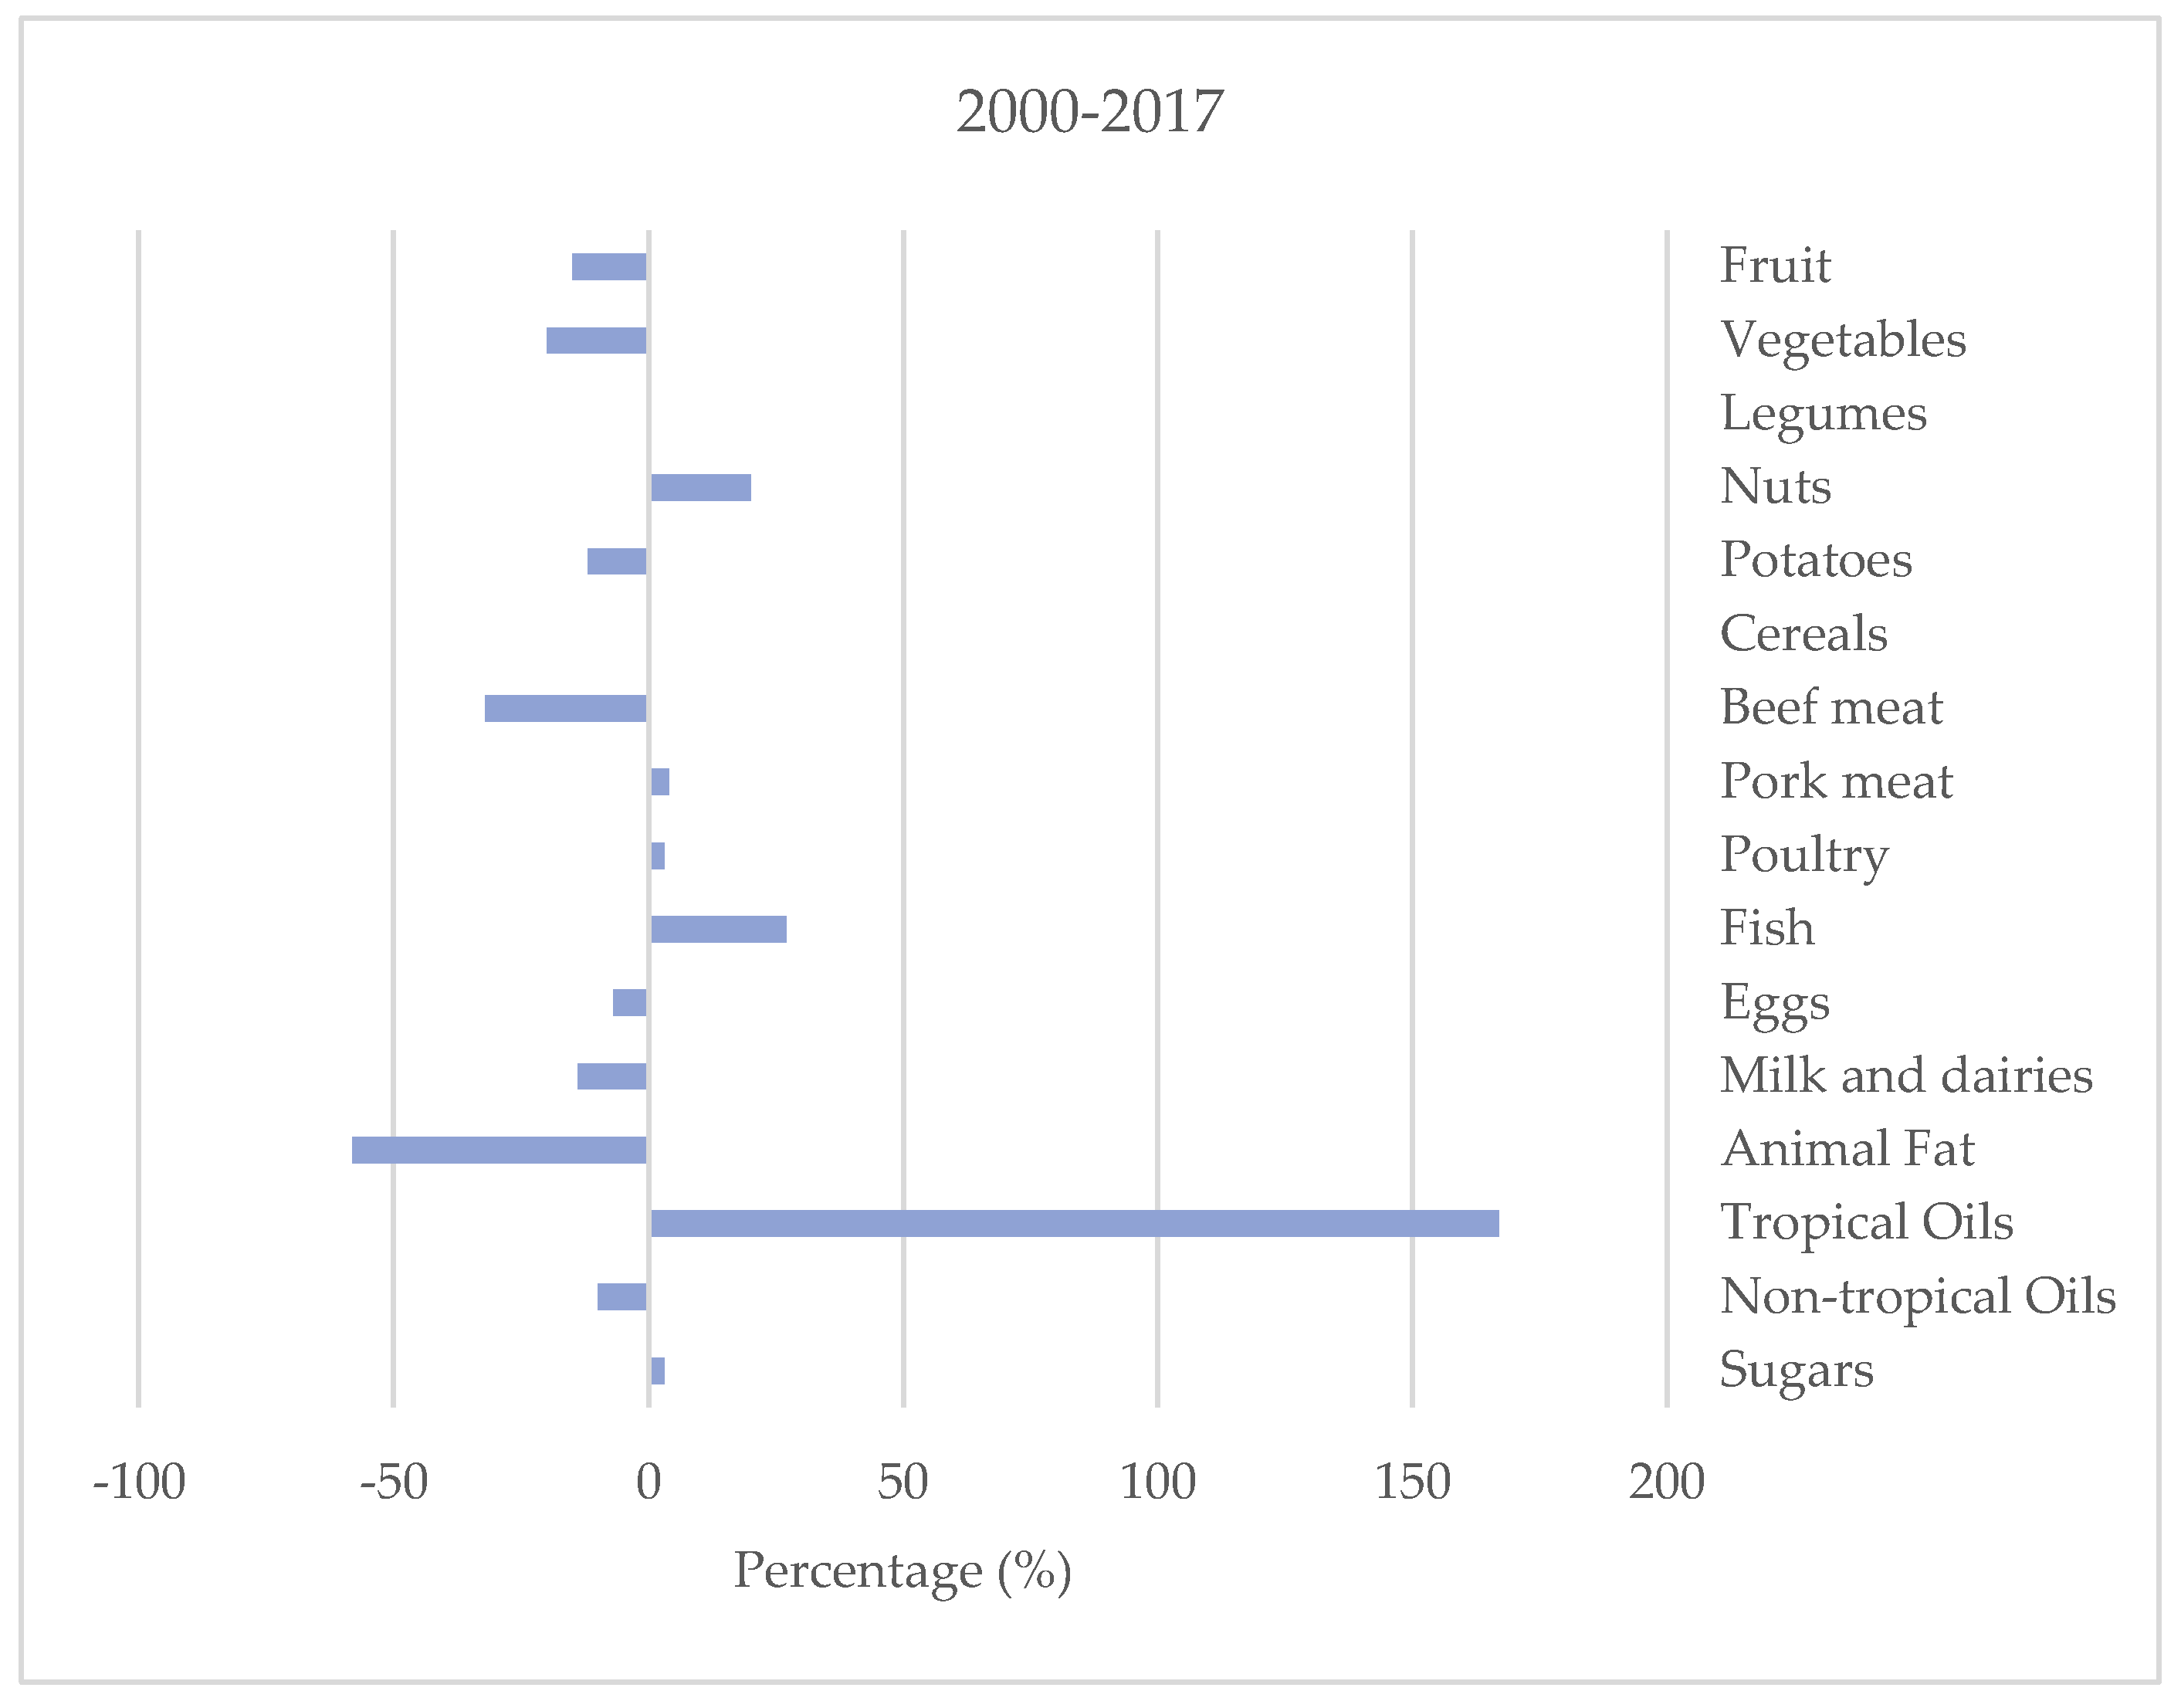
In the time period 2000–2017, the amount available for consumption has remained stable (i.e., <5% observed change) for cereals, legumes, pork meat, poultry, eggs, and sugars. A relevant decline is observed for animal fat and beef meat (−58% and −32%, respectively), with negative trends starting from the years 2009–2011. Fruit, potatoes, and vegetable supplies have also progressively declined in comparison with the years 2000–2003, albeit to a lesser extent (i.e., −20%, −15%, and 13%, respectively); these trends began in the first decade of the century for potatoes and vegetables, and more recently, in the years 2012–2014, for fruit. During the study period, the consumption of milk (including dairy foods) and non-tropical oils have also declined substantially (−14% and −11%, respectively) (Table 1, Figure 1).
The food groups with a marked increase in their supply over the observation period were tropical oils, fish, and nuts (+156%, +26%, and +21%, respectively), although with a different pattern—for nuts, a steady increase occurred at the beginning of the century, remaining fairly constant ever since; conversely, for tropical oils and fish, there has been a progressive rise over time (Table 1, Figure 1).
The pattern of the energy and nutrient composition of the diet, which is calculated by summing up the macronutrient content of all foods available for consumption during each of the three-year periods, is reported in Table 2.
The data clearly show that no important changes occurred during the observation period in terms of total energy, fat, proteins, and carbohydrates, with the only exception of energy and fat from foods of animal origin, which decreased by 10% and 9%, respectively. Declines in energy and fat of animal origin have started already at the beginning of the century, expanding gradually up to the last available observations.
Table 3 reports quantities of foods available for consumption at the last available observation (2015–2017) as compared to the targets proposed by the EAT–Lancet Commission for healthy and environmentally sustainable dietary choices.
To meet the EAT–Lancet targets, the consumption of fruits, vegetables, legumes, and nuts, although still within the recommended ranges, should be substantially increased in the current Italian diet; conversely, the consumption of beef and pork meat eggs, milk and dairy products, animal fat, tropical oils, and sugars should be reduced. The most relevant decreases should concern beef and pork meat, animal fat, and sugar, which should be reduced by amounts ranging from 60% to 90% (Table 3). The consumption of poultry, fish, and non-tropical oils, although above the targets, falls within the recommended ranges, however, and should not change.
In Table 4 we compared the GHG production induced by the foods available for consumption in Italy in the years 2015–2017 with the expected GHG production under the hypothesis that food consumptions would comply with the targets recommended by the EAT–Lancet Commission. The present Italian diet is associated with a CO2 equivalent production of 1465 Kg/person/year, while the EAT–Lancet Commission diet is expected to produce 740 Kg/person/year (Table 4).
This improvement in the environmental impact of the diet would be due largely to reduced use of animal products and represents the balance between the modest increase (+77 Kg CO2 equivalent/capita/year) due to the greater consumption of legumes and nuts and the large decrease due to the reduced consumption of red meat and dairies, which contribute more than 40% of the GHG (Table 4).
4. Discussion
This study shows that food habits in Italy have changed considerably since the beginning of the century; however, changes in the consumption of specific food items were not uniform— some of them increased and some others declined, overall balancing each other in terms of energy supply (Table 2). This is in line with the observation that the prevalence of overweight/ obesity in Italy has remained fairly stable in this period [18].
The recent changes in dietary habits in Italy were only partially coherent with recommended targets for a healthy and sustainable diet. In particular, during the last twenty years, the consumption of beef meat, animal fat, milk, and dairy products has decreased, while the supply of nuts has increased; these changes represent an improvement of the diet in relation to its potential impact on NCD prevention and environmental sustainability. Unfortunately, other food choices have changed in the opposite direction; in fact, the supply of vegetables and fruit has dropped, and the supply of tropical oils has increased (Table 1).
Reductions in supplies of fruit and vegetables have started only recently, despite the large body of scientific evidence accumulated in the last decades on their health benefits and the indications of many influential health authorities that strongly recommend the consumption of these items [19,20,21]. The reduced amount of fruit and vegetables in the Italian diet during recent years goes in parallel with similar trends reported in other European countries [22,23]. There are no clear explanations for this observation; one possibility is the aging population—elderly people tend to consume less of these foods. Other factors may, however, be at play, including accessibility, affordability, and availability of these products that may substantially impact consumption [22,24,25,26,27]. Climate changes may also have a relevant effect.
The recent modifications in dietary habits in Italy are only partially coherent with the recommended targets for a healthy and sustainable diet proposed by the EAT-Lancet commission. Overall, the data indicate that most dietary choices of the Italian population should be modified to comply with these targets. The major desirable changes would be a further remarkable drop in the consumption of red and processed meat (75–90%), animal fat (60%), sugar (60%), and dairy products and eggs (50%). The consumption of nuts and legumes should, however, be promoted based on the available evidence on the beneficial health effects of these foods, including their relevant contribution to the protein supply [14].
The health benefits of greater adherence to the recommended targets are supported by a large body of literature [28]. Several prospective observational studies have convincingly shown that the incidence of NCDs, in particular, cardiovascular disease and type 2 diabetes, is associated with high intakes of red and processed meat, animal fat, and sugar—particularly soft drinks—and with low consumption of vegetables, fruit, legumes, nuts, and non-tropical vegetable oils [29]. Data on the relationships between NCDs and dairy foods and eggs are less consistent but overall indicate possible harm at very high intakes [28,30]. Moreover, the PREDIMED (Primary Prevention of Cardiovascular Disease with Mediterranean Diet) trial has shown that the implementation of a diet resembling the traditional Mediterranean diet, in many ways similar to the dietary pattern proposed by the Eat–Lancet Commission, substantially reduces the incidence of cardiovascular diseases and diabetes [31,32].
Regrettably, adherence to the traditional Mediterranean diet is at present rather modest in Italy, despite its strong linkage with the Italian gastronomic tradition. Population-based studies performed with the use of food frequency questionnaires document a high intake of meat and a low intake of vegetables and fruit, and legumes [33,34,35]. The reported recent trends in the Italian diet can significantly impact the health of the general population since dietary habits represent the third leading risk factor for death with a strong impact also on disability-adjusted life years (DALYs), which include years lost due to premature death and the fraction of years lived in less than full health [36]. Moving toward the dietary pattern promoted by the Eat–Lancet Commission would reduce the burden of diseases attributable to unhealthy dietary habits and would also lead to a substantial reduction of CO2 emissions. A yearly saving of 725 Kg CO2 emission per person (Table 4)—roughly corresponding to the GHG emission of a car covering 4000 Km—would be obtained if all the proposed dietary targets were met [37]. These findings are qualitatively in line with those of several studies showing that the traditional Mediterranean diet, predominantly based on foods of vegetal origin, has a lower ecological impact and, in particular, a low GHG emission compared to present-day dietary habits in many western countries [38] and in the Mediterranean region [37,38,39,40,41].
As for the impact of each dietary component on GHG, our study shows that the sole reduction of red and processed meat consumption in the habitual Italian diet would cut the per capita production of CO2 equivalent by as much as 31% and contribute to more than 50% to the GHG savings obtained by following the EAT–Lancet Commission recommendations. However, considering that too sharp reductions of red and processed meat intake are rather difficult to achieve in the short term, it is worth underlining that, for the time being, even less dramatic changes in their consumption in Italy would be relevant and should therefore be promoted [42].
Our study has strengths and limitations. The study strengths are the assessment of the trends in food choices up to recent years (2000–2017) and the evaluation of the nutrition transition in a country deeply rooted in the traditional Mediterranean diet. Moreover, it is also worth underlining that food choices in this study have been assessed not only in relation to their nutritional relevance but also for their environmental sustainability. In this respect, we have performed quantitative evaluations of the ecological impact of the current Italian diet and of the improvements that could be achieved were the EAT -Lancet targets met.
As for limitations, we have to acknowledge that, because in Italy no regular assessment of food habits at the population level is performed, we had to rely on foods available for consumption (food balance sheets, FBSs) rather than on direct measurements of dietary habits. This was the only available tool to look at dietary changes over time. However, in the interpretation of FBS data, it is important to consider that they exceed by a variable extent the real food intake since they include also wasted foods; in order to overcome, at least partially, this source of inaccuracy, we have corrected the crude data by the rate of waste for each food according to FAO [16]. Moreover, in this study food supplies were used either to assess temporal trends or to evaluate the relative contribution of each food group to the total energy content of the diet; within this framework, a global overestimate of food consumption would not represent a source of systematic bias.
5. Conclusions
In conclusion, recent changes in dietary choices of the Italian population are heterogeneous in terms of their impact on health and the environment since some of them (less red meat and animal fat and higher nut consumption) are beneficial, while others (vegetables and fruit reduction) are harmful. Moreover, consumption of legumes, pork meat, and sugars have been fairly stable over time, while more legumes and less pork meat and sugar would have been more appropriate. Overall, despite the strong links between the traditional Mediterranean diet and the Italian cuisine, present-day eating habits of the Italian population are not fully coherent with a healthy and sustainable diet.
The information provided by our study can represent a useful background to promote nutritional education programs together with interventions on the food system aiming at improving the availability and affordability of products with a better impact on human health and the environment. Moreover, the data may help to understand which features of the traditional Mediterranean diet are more difficult to reconcile with people’s lifestyles in a globalized world, thus facilitating tailored measures for the promotion of the Mediterranean diet in different cultural backgrounds.
Supplementary Materials
The following are available online at https://www.mdpi.com/2072-6643/13/2/476/s1, Table S1: Crude data without waste correction for all food groups and for each year of the observation period.
Author Contributions
Conceptualization, O.V. and G.R.; methodology, M.V.; software, M.V. and A.G.; validation, M.V., A.G.; formal analysis, M.V.; investigation, M.V., A.G., O.V. and G.R.; RESOURCES, M.V. and A.G.; data curation, M.V.; writing—original draft preparation, M.V., A.G., O.V. and G.R.; writing—review and editing, O.V. and G.R.; visualization, M.V. and A.G.; supervision, O.V. and G.R. All authors have read and agreed to the published version of the manuscript.
Funding
This research received no external funding.
Institutional Review Board Statement
Not applicable.
Informed Consent Statement
Not applicable.
Data Availability Statement
The data presented in this study are openly available online: http://www.fao.org/faostat/en/#data.
Acknowledgments
The expert linguistic revision of Rosanna Scala is gratefully acknowledged.
Conflicts of Interest
The authors declare no conflict of interest.
References
- Jayedi, A.; Soltani, S.; Abdolshahi, A.; Shab-Bidar, S. Healthy and Unhealthy Dietary Patterns and the Risk of Chronic Disease: An Umbrella Review of Meta-Analyses of Prospective Cohort Studies. Br. J. Nutr. 2020, 124, 1133–1144. [Google Scholar] [CrossRef] [PubMed]
- Afshin, A.; Sur, P.J.; Fay, K.A.; Cornaby, L.; Ferrara, G.; Salama, J.S.; Mullany, E.C.; Abate, K.H.; Abbafati, C.; Abebe, Z.; et al. Health effects of dietary risks in 195 countries, 1990–2017: A systematic analysis for the Global Burden of Disease Study 2017. Lancet 2019, 393, 1958–1972. [Google Scholar] [CrossRef] [Green Version]
- O’Connor, L.E.; Hu, E.A.; Steffen, L.M.; Selvin, E.; Rebholz, C.M. Adherence to a Mediterranean-style eating pattern and risk of diabetes in a U.S. prospective cohort study. Nutr. Diabetes 2020, 20, 1–9. [Google Scholar] [CrossRef] [PubMed] [Green Version]
- Schwingshackl, L.; Hoffmann, G. Adherence to Mediterranean diet and risk of cancer: An updated systematic review and meta-analysis of observational studies. Cancer Med. 2015, 4, 1933–1947. [Google Scholar] [CrossRef] [PubMed]
- Estruch, R.; Ros, E.; Salas-Salvadò, J.; Covas, M.I.; Corella, D.; Aròs, F.; Gòmez-Gracia, E.; Ruiz-Gutiérrez, V.; Fiol, M.; Lapetra, J.; et al. Primary Prevention of Cardiovascular Disease with a Mediterranean Diet Supplemented with Extra-Virgin Olive Oil or Nuts. N. Engl. J. Med. 2018, 378, e34. [Google Scholar] [CrossRef] [PubMed]
- Rees, K.; Takeda, A.; Martin, N.; Ellis, L.; Wijesekara, D.; Vepa, A.; Das, A.; Hartley, L.; Stranges, S. Mediterranean-style diet for the primary and secondary prevention of cardiovascular disease. Cochrane Database Syst. Rev. 2019, 3, CD009825. [Google Scholar] [CrossRef] [Green Version]
- Mantzorou, M.; Vadikolias, K.; Pavlidou, E.; Tryfonos, C.; Vasios, G.; Serdari, A.; Giaginis, C. Mediterranean diet adherence is associated with better cognitive status and less depressive symptoms in a Greek elderly population. Aging Clin. Exp. Res. 2020. [Google Scholar] [CrossRef]
- Sofi, F.; Macchi, C.; Abbate, R.; Gensini, G.F.; Casini, A. Mediterranean diet and health status: An updated meta-analysis and a proposal for a literature-based adherence score. Public Health Nutr. 2014, 17, 2769–2782. [Google Scholar] [CrossRef] [Green Version]
- Lopez-Garcia, E.; Rodriguez-Artalejo, F.; Li, T.Y.; Fung, T.T.; Li, S.; Willett, W.C.; Rimm, E.B.; Hu, F.B. The Mediterranean-style dietary pattern and mortality among men and women with cardiovascular disease. Am. J. Clin. Nutr. 2014, 99, 172–180. [Google Scholar] [CrossRef] [Green Version]
- Aleksandrowicz, L.; Green, R.; Joy, E.J.; Smith, P.; Haines, A. The Impacts of Dietary Change on Greenhouse Gas Emissions, Land Use, Water Use, and Health: A Systematic Review. PLoS ONE 2016, 11, e0165797. [Google Scholar] [CrossRef] [Green Version]
- Naja, F.; Jomaa, L.; Itani, L.; Zidek, J.; El Labban, S.; Sibai, A.M.; Hwalla, N. Environmental footprints of food consumption and dietary patterns among Lebanese adults: A cross-sectional study. Nutr. J. 2018, 17, 85. [Google Scholar] [CrossRef] [PubMed]
- Keys, A.; Menotti, A.; Karvonen, M.J.; Aravanis, C.; Blackburn, H.; Buzina, R.; Djordjevic, B.S.; Dontas, A.S.; Fidanza, F.; Keys, M.H.; et al. The diet and 15-year death rate in the seven countries study. Am. J. Epidemiol. 1986, 124, 903–915. [Google Scholar] [CrossRef] [PubMed]
- Pounis, G.; Bonanni, A.; Ruggiero, E.; Di Castelnuovo, A.; Costanzo, S.; Persichillo, M.; Bonaccio, M.; Cerletti, C.; Riccardi, G.; Donati, M.B.; et al. Food group consumption in an Italian population using the updated food classification system FoodEx2: Results from the Italian Nutrition & HEalth Survey (INHES) study. Nutr. Metab. Cardiovasc. Dis. 2017, 27, 307–328. [Google Scholar] [CrossRef]
- Willett, W.; Rockstrom, J.; Loken, B.; Springmann, M.; Lang, T.; Vermeulen, S.; Garnett, T.; Tilman, D.; DeClerck, F.; Wood, A.; et al. Food in the Anthropocene: The EAT-Lancet Commission on healthy diets from sustainable food systems. Lancet 2019, 393, 447–492. [Google Scholar] [CrossRef]
- Food Balance Sheets 2020. Available online: http://www.fao.org/faostat/en/#data (accessed on 15 October 2020).
- FAO. Global Food Losses and Waste—Extend, Causes and Prevention; Food and Agriculture Organization: Rome, Italy, 2011. [Google Scholar]
- Guinee, J.B.; Vanduin, R.; Huijbregts, M.A.J.; Lindeijer, E.; Roorda, A.A.H.; Van Der Ven, B.L. Handbook on Life Cycle Assessment: Operational Guide to the ISO Standards; Institute for Environmental Sciences: Leiden, The Netherlands, 2002; ISBN 1402002289. [Google Scholar]
- Micciolo, R.; Di Francesco, V.; Fantin, F.; Canal, L.; Harris, T.B.; Bosello, O.; Zamboni, M. Prevalence of overweight and obesity in Italy (2001–2008): Is there a rising obesity epidemic? Ann. Epidemiol. 2010, 20, 258–264. [Google Scholar] [CrossRef] [Green Version]
- World Health Organization. Diet, Nutrition and the Prevention of Chronic Diseases—Report of a Joint WHO/FAO Expert Consultation; World Health Organization: Geneva, Switzerlan, 2003; pp. 1–149, backcover. [Google Scholar]
- Mach, F.; Baigent, C.; Catapano, A.L.; Koskinas, K.C.; Casula, M.; Badimon, L.; Chapman, M.J.; De Backer, G.G.; Delgado, V.; Ference, B.A.; et al. 2019 ESC/EAS Guidelines for the management of dyslipidaemias: Lipid modification to reduce cardiovascular risk. Eur. Hear. J. 2020, 41, 111–188. [Google Scholar] [CrossRef]
- Eckel, R.H.; Jakicic, J.M.; Ard, J.D.; de Jesus, J.M.; Houston Miller, N.; Hubbard, V.S.; Lee, I.M.; Lichtenstein, A.H.; Loria, C.M.; Millen, B.E.; et al. 2013 AHA/ACC guideline on lifestyle management to reduce cardiovascular risk: A report of the American College of Cardiology/American Heart Association Task Force on Practice Guidelines. Circulation 2014, 129, S76–S99. [Google Scholar] [CrossRef] [Green Version]
- Riccardi, G.; Vitale, M.; Vaccaro, O. Are Europeans moving towards dietary habits more suitable for reducing cardiovascular disease risk? Nutr. Metab. Cardiovasc. Dis. 2020, 30, 1857–1860. [Google Scholar] [CrossRef]
- Wilkins, E.; Wilson, L.; Wickramasinghe, K.; Bhatnagar, P.; Leal, J.; Luengo-Fernandez, R.; Burns, R.; Rayner, M.; Townsend, N. European Cardiovascular Disease Statistics 2017. Available online: http://www.ehnheart.org/images/CVD-statistics-report-August-2017.pdf (accessed on 4 November 2020).
- Da Silva, R.; Bach-Faig, A.; Raidò Quintana, B.; Buckland, G.; de Almeida, M.D.; Serra-Majem, L. Worldwide variation of adherence to the Mediterranean diet, in 1961–1965 and 2000–2003. Public Health Nutr. 2009, 12, 1676–1684. [Google Scholar] [CrossRef] [Green Version]
- Vareiro, D.; Bach-Faig, A.; Raidò Quintana, B.; Bertomeu, I.; Buckland, G.; de Almeida, M.D.; Serra-Majem, L. Availability of Mediterranean and non-Mediterranean foods during the last four decades: Comparison of several geographical areas. Public Health Nutr. 2009, 12, 1667–1675. [Google Scholar] [CrossRef]
- Partearroyo, T.; Samaniego-Vaesken, M.L.; Ruiz, E.; Aranceta-Bartrina, J.; Gil, Á.; Gonzalez-Gross, M.; Ortega, R.M.; Serra-Majem, L.; Varela-Moreiras, G. Current Food Consumption amongst the Spanish ANIBES Study Population. Nutrients 2019, 11, 2663. [Google Scholar] [CrossRef] [PubMed] [Green Version]
- Lopez, C.N.; Martinez-Gonzalez, M.A.; Sanchez-Villegas, A.; Alonso, A.; Pimenta, A.M.; Bes-Rastrollo, M. Costs of Mediterranean and western dietary patterns in a Spanish cohort and their relationship with prospective weight change. J. Epidemiol. Community Health 2009, 63, 920–927. [Google Scholar] [CrossRef] [PubMed]
- Calabrese, I.; Riccardi, G. Effectiveness of Changes in Diet Composition on Reducing the Incidence of Cardiovascular Disease. Curr. Cardiol. Rep. 2019, 21, 88. [Google Scholar] [CrossRef] [PubMed]
- Yu, E.; Malik, V.S.; Hu, F.B. Cardiovascular Disease Prevention by Diet Modification: JACC Health Promotion Series. J. Am. Coll. Cardiol. 2018, 72, 914–926. [Google Scholar] [CrossRef] [PubMed]
- Forouhi, N.G.; Krauss, R.M.; Taubes, G.; Willett, W. Dietary fat and cardiometabolic health: Evidence, controversies, and consensus for guidance. BMJ 2018, 361, k2139. [Google Scholar] [CrossRef] [Green Version]
- Salas-Salvadò, J.; Bullò, M.; Babio, N.; Martinez-Gonzalez, M.; Ibarrola-Jurado, N.; Basora, J.; Estruch, R.; Covas, M.I.; Corella, D.; Aras, F.; et al. Reduction in the incidence of type 2 diabetes with the Mediterranean diet: Results of the PREDIMED-Reus nutrition intervention randomized trial. Diabetes Care 2011, 34, 14–19. [Google Scholar] [CrossRef] [Green Version]
- Li, J.; Guasch-Ferrè, M.; Chung, W.; Ruiz-Canela, M.; Toledo, E.; Corella, D.; Bhupathiraju, S.N.; Tobias, D.K.; Tabung, F.K.; Hu, J.; et al. The Mediterranean diet, plasma metabolome, and cardiovascular disease risk. Eur. Hear. J. 2020, 41, 2645–2656. [Google Scholar] [CrossRef]
- Dinu, M.; Pagliai, G.; Giangrandi, I.; Colombini, B.; Toniolo, L.; Gensini, G.; Sofi, F. Adherence to the Mediterranean diet among Italian adults: Results from the web-based Medi-Lite questionnaire. Int. J. Food Sci. Nutr. 2020, 1–9. [Google Scholar] [CrossRef]
- Marventano, S.; Godos, J.; Platania, A.; Galvano, F.; Mistretta, A.; Grosso, G. Mediterranean diet adherence in the Mediterranean healthy eating, aging and lifestyle (MEAL) study cohort. Int. J. Food Sci. Nutr. 2018, 69, 100–107. [Google Scholar] [CrossRef]
- Vitale, M.; Racca, E.; Izzo, A.; Giacco, A.; Parente, E.; Riccardi, G.; Giacco, R. Adherence to the traditional Mediterranean diet in a population of South of Italy: Factors involved and proposal of an educational field-based survey tool. Int. J. Food Sci. Nutr. 2019, 70. [Google Scholar] [CrossRef]
- Monasta, L.; Abbafati, C.; Logroscino, G.; Remuzzi, G.; Perico, N.; Bikbov, B.; Tamburlini, G.; Beghi, E.; Traini, E.; Redford, S.B.; et al. Italy’s health performance, 1990–2017: Findings from the Global Burden of Disease Study 2017. Lancet Public Health 2019, 4, e645–e657. [Google Scholar] [CrossRef]
- Carlsson-Kanyama, A.; González, A.D. Potential Contributions of Food Consumption Patterns to Climate Change. Proc. Am. J. Clin. Nutr. 2009, 89, 1704S–1709S. [Google Scholar] [CrossRef] [PubMed] [Green Version]
- Nelson, M.E.; Hamm, M.W.; Hu, F.B.; Abrams, S.A.; Griffin, T.S. Alignment of Healthy Dietary Patterns and Environmental Sustainability: A Systematic Review. Adv. Nutr. 2016, 7, 1005–1025. [Google Scholar] [CrossRef] [PubMed] [Green Version]
- Grosso, G.; Fresan, U.; Bes-Rastrollo, M.; Marventano, S.; Galvano, F. Environmental Impact of Dietary Choices: Role of the Mediterranean and Other Dietary Patterns in an Italian Cohort. Int. J. Environ. Res. Public Health 2020, 17, 1468. [Google Scholar] [CrossRef] [PubMed] [Green Version]
- Fresan, U.; Martinez-Gonzalez, M.A.; Sabatè, J.; Bes-Rastrollo, M. The Mediterranean diet, an environmentally friendly option: Evidence from the Seguimiento Universidad de Navarra (SUN) cohort. Public Health Nutr. 2018, 21, 1573–1582. [Google Scholar] [CrossRef] [PubMed] [Green Version]
- Saez-Almendros, S.; Obrador, B.; Bach-Faig, A.; Serra-Majem, L. Environmental footprints of Mediterranean versus Western dietary patterns: Beyond the health benefits of the Mediterranean diet. Environ. Health 2013, 12, 118. [Google Scholar] [CrossRef] [PubMed] [Green Version]
- Farchi, S.; De Sario, M.; Lapucci, E.; Davoli, M.; Michelozzi, P. Meat consumption reduction in Italian regions: Health co-benefits and decreases in GHG emissions. PLoS ONE 2017, 12, e0182960. [Google Scholar] [CrossRef] [Green Version]
Figure 1.
Changes in the amounts of foods available for consumption in Italy (Food Balance Sheets) from 2000 to 2017.
Figure 1.
Changes in the amounts of foods available for consumption in Italy (Food Balance Sheets) from 2000 to 2017.


Table 1.
Food supply in Italy over time according to the food balance sheets (FBSs).
| Food Supply (g/per capita/day) by Time | |||||||
|---|---|---|---|---|---|---|---|
| Food Loss and Waste % | 2000–2002 | 2003–2005 | 2006–2008 | 2009–2011 | 2012–2014 | 2015–2017 | |
| Fruit | 45 | 213 (201–221) | 222 (202–233) | 240 (234–243) | 237 (217–263) | 196 (182–210) | 181 (171–195) |
| Vegetables | 45 | 256 (222–301) | 283 (267–301) | 241 (241–246) | 240 (222–269) | 202 (197–208) | 205 (202–208) |
| Legumes | 20 | 12 (12–12) | 12 (12–12) | 12 (12–12) | 12 (11–12) | 12 (11–12) | 12 (12–12) |
| Nuts | 20 | 15 (14–15) | 15 (14–16) | 17 (16–19) | 17 (16–19) | 16 (15–17) | 18 (16–19) |
| Potatoes | 50 | 57 (55–59) | 54 (51–57) | 53 (51–54) | 54 (53–55) | 51 (49–53) | 50 (49–50) |
| Cereals | 35 | 289 (288–290) | 283 (279–287) | 279 (278–279) | 278 (275–282) | 280 (279–282) | 288 (287–288) |
| Beef meat | 20 | 53 (52–55) | 52 (52–54) | 52 (50–53) | 50 (47–52) | 43 (41–45) | 36 (34–37) |
| Pork meat | 20 | 85 (82–87) | 87 (85–88) | 88 (85–90) | 89 (87–92) | 85 (81–88) | 88 (84–96) |
| Poultry | 20 | 40 (39–42) | 34 (33–34) | 34 (30–37) | 39 (38–40) | 41 (41–42) | 41 (41–41) |
| Fish | 30 | 45 (43–47) | 47 (46–48) | 49 (48–50) | 50 (48–51) | 51 (49–54) | 57 (56–57) |
| Eggs | 10 | 30 (29–31) | 29 (29–29) | 28 (27–29) | 29 (28–31) | 31 (29–33) | 28 (28–29) |
| Milk and dairies | 10 | 664 (662–667) | 653 (645–668) | 654 (637–664) | 638 (635–643) | 619 (609–630) | 571 (556–595) |
| Animal Fat | 10 | 33 (33–34) | 32 (31–33) | 34 (33–34) | 31 (31–32) | 26 (15–33) | 14 (14–14) |
| Tropical Oils | 20 | 3 (3–3) | 3 (3–4) | 4 (4–5) | 7 (6–8) | 9 (8–9) | 8 (8–8) |
| Non-tropical oils | 20 | 51 (51–52) | 50 (48–53) | 53 (52–54) | 51 (49–52) | 48 (45–51) | 46 (45–47) |
| Sugars | 10 | 77 (76–79) | 78 (77–79) | 73 (73–74) | 74 (73–76) | 79 (78–81) | 79 (77–80) |
Data are corrected for food loss and waste, calculated according to the Food and Agriculture Organization (FAO) (16) and represent the means and ranges () of three-year periods.
Table 2.
Average per capita supply of Energy (Kcal/per capita/day) and Macronutrient Supply (g/per capita/day) by time.
Table 2.
Average per capita supply of Energy (Kcal/per capita/day) and Macronutrient Supply (g/per capita/day) by time.
| 2000–2002 | 2003–2005 | 2006–2008 | 2009–2011 | 2012–2014 | 2015–2017 | |
|---|---|---|---|---|---|---|
| Total Calories | 2583 (2574–2590) | 2538 (2518–2550) | 2558 (2553–2564) | 2550 (2547–2554) | 2528 (2470–2558) | 2490 (2482–2504) |
| Animal Food Sources | 800 (791–811) | 775 (766–786) | 783 (777–789) | 769 (762–781) | 764 (742–786) | 732 (717–743) |
| Vegetable Food Sources | 1782 (1780–1784) | 1763 (1732–1784) | 1775 (1764–1782) | 1781 (1773–1785) | 1764 (1729–1792) | 1757 (1746–1765) |
| Total Proteins | 79 (79–79) | 78 (78–78) | 77 (77–77) | 78 (77–78) | 76 (76–76) | 76 (75–76) |
| Animal Food Sources | 47 (47–47) | 46 (45–46) | 46 (46–46) | 46 (46–47) | 45 (45–46) | 45 (44–45) |
| Vegetable Food Sources | 32 (32–32) | 32 (32–32) | 31 (31–32) | 31 (31–32) | 31 (30–31) | 31 (31–31) |
| Total Fat | 124 (123–125) | 121 (119–122) | 126 (126–126) | 125 (123–127) | 123 (117–127) | 118 (117–120) |
| Animal Food Sources | 62 (62–63) | 60 (59–61) | 61 (61–61) | 60 (59–60) | 59 (56–62) | 56 (54–56) |
| Vegetable Food Sources | 62 (62–62) | 61 (58–63) | 65 (64–65) | 66 (64–68) | 64 (61–66) | 62 (61–63) |
| Total Carbohydrates | 307 (307–307) | 303 (300–307) | 298 (297–299) | 297 (293–302) | 298 (295–301) | 300 (299–301) |
| Starch | 188 (187–188) | 183 (181–186) | 183 (182–183) | 183 (178–186) | 183 (180–187) | 184 (184–185) |
| Sugars | 119 (119–119) | 121 (119–123) | 115 (113–117) | 114 (112–118) | 114 (109–119) | 116 (115–117) |
Data represent the means and ranges () of three-year periods.
Table 3.
Amounts of foods available for consumption (average and ranges) in Italy at the last available observation (years 2015–2017) compared to the targets and ranges proposed by the EAT–Lancet Commission.
Table 3.
Amounts of foods available for consumption (average and ranges) in Italy at the last available observation (years 2015–2017) compared to the targets and ranges proposed by the EAT–Lancet Commission.
| Foods available for Consumption- Years 2015–2017 (g/per capita/day) | EAT-Lancet Targets (g/per capita/day) | Changes Needed to Meet the Targets | Changes Needed to Meet Target Ranges | |
|---|---|---|---|---|
| Fruit | 181 (171–195) | 200 (100–300) | ⇑ | ⇔ |
| Vegetables | 205 (202–208) | 300 (200–600) | ⇑ | ⇔ |
| Legumes | 12 (12–12) | 50 (0–100) | ⇑⇑ | ⇔ * |
| Nuts | 18 (16–19) | 50 (0–75) | ⇑⇑ | ⇔ * |
| Potatoes | 50 (49–50) | 50 (0–100) | ⇔ | ⇔ |
| Cereals | 288 (287–288) | 232 (according to energy needs) | ⇔ | ⇔ |
| Beef meat | 36 (34–37) | 7 (0–14) | ⇓⇓ | ⇓⇓ |
| Pork meat | 88 (84–96) | 7 (0–14) | ⇓⇓ | ⇓⇓ |
| Poultry | 41 (41–41) | 29 (0–58) | ⇓ | ⇔ |
| Fish | 57 (56–57) | 28 (0–100) | ⇓ | ⇔ |
| Eggs | 28 (28–29) | 13 (0–25) | ⇓ | ⇓ |
| Milk and dairies | 571 (556–595) | 250 (0–500) | ⇓⇓ | ⇓ |
| Animal Fat | 14 (14–14) | 5 (0–5) | ⇓⇓ | ⇓⇓ |
| Tropical Oils | 8 (8–8) | 7 (0–7) | ⇓ | ⇓ |
| Non-tropical Oils | 46 (45–47) | 40 (20–80) | ⇓ | ⇔ |
| Sugars | 79 (77–80) | 31 (0–31) | ⇓⇓ | ⇓⇓ |
* The consumption of these foods is interchangeable; their recommended total daily consumption should be at least 50 g. ⇑ = to increase, ⇓ = to reduce, ⇔ = no variation
Table 4.
Annual greenhouse gas (GHG) emissions related to the amounts of foods available for consumption in Italy at the last available observation (years 2015–2017) as compared to that induced if food consumption would adhere to the targets of the Eat–Lancet Commission.
Table 4.
Annual greenhouse gas (GHG) emissions related to the amounts of foods available for consumption in Italy at the last available observation (years 2015–2017) as compared to that induced if food consumption would adhere to the targets of the Eat–Lancet Commission.
| GHG (Kg CO2 eq/capita/year) | ||||
|---|---|---|---|---|
| Italy (Years 2015–17) | EAT-Lancet Targets | Difference | ||
| Fruit | 28 | 31 | +3 | +77 |
| Vegetables | 111 | 162 | +51 | |
| Legumes | 5 | 23 | +18 | |
| Nuts | 3 | 8 | +5 | |
| Potatoes | 2 | 2 | 0 | |
| Cereals | 141 | 114 | −27 | −802 |
| Beef meat | 302 | 59 | −243 | |
| Pork meat | 224 | 18 | −206 | |
| Poultry | 79 | 56 | −23 | |
| Fish | 136 | 66 | −70 | |
| Eggs | 40 | 19 | −21 | |
| Milk and dairies | 312 | 137 | −175 | |
| Animal fat | 30 | 11 | −19 | |
| Tropical oils | 5 | 3 | −2 | |
| Non-tropical oils | 26 | 23 | −3 | |
| Sugars | 21 | 8 | −13 | |
| Total | 1465 | 740 | −725 | |
Publisher’s Note: MDPI stays neutral with regard to jurisdictional claims in published maps and institutional affiliations. |
© 2021 by the authors. Licensee MDPI, Basel, Switzerland. This article is an open access article distributed under the terms and conditions of the Creative Commons Attribution (CC BY) license (http://creativecommons.org/licenses/by/4.0/).
Share and Cite
MDPI and ACS Style
Vitale, M.; Giosuè, A.; Vaccaro, O.; Riccardi, G. Recent Trends in Dietary Habits of the Italian Population: Potential Impact on Health and the Environment. Nutrients 2021, 13, 476. https://doi.org/10.3390/nu13020476
AMA Style
Vitale M, Giosuè A, Vaccaro O, Riccardi G. Recent Trends in Dietary Habits of the Italian Population: Potential Impact on Health and the Environment. Nutrients. 2021; 13(2):476. https://doi.org/10.3390/nu13020476
Chicago/Turabian StyleVitale, Marilena, Annalisa Giosuè, Olga Vaccaro, and Gabriele Riccardi. 2021. "Recent Trends in Dietary Habits of the Italian Population: Potential Impact on Health and the Environment" Nutrients 13, no. 2: 476. https://doi.org/10.3390/nu13020476
Note that from the first issue of 2016, this journal uses article numbers instead of page numbers. See further details here.