Fluid Balance, Sweat Na+ Losses, and Carbohydrate Intake of Elite Male Soccer Players in Response to Low and High Training Intensities in Cool and Hot Environments


Abstract
1. Introduction
2. Materials and Methods
2.1. Study Participants
2.2. Experimental Design
2.3. Assessment of Fluid Balance
2.4. Assessment of Sweat [Na+]
2.5. Statistical Analysis
3. Results
4. Discussion
4.1. Limitations, Strengths, and Future Research
4.2. Practical Applications
5. Conclusions
Author Contributions
Funding
Institutional Review Board Statement
Informed Consent Statement
Data Availability Statement
Acknowledgments
Conflicts of Interest
References
- Ekblom, B. Applied physiology of soccer. Sports Med. 1986, 3, 50–60. [Google Scholar] [CrossRef] [PubMed]
- Saltin, B. Metabolic fundamentals in exercise. Med. Sci. Sports Excerc. 1973, 5, 137–146. [Google Scholar] [CrossRef]
- Armstrong, L.E.; Maresh, C.M.; Gabaree, C.V.; Hoffman, J.R.; Kavouras, S.A.; Kenefick, R.W.; Castellani, J.W.; Ahlquist, L.E. Thermal and circulatory responses during exercise: Effects of hypohydration, dehydration, and water intake. J. Appl. Physiol. 1997, 82, 2028–2035. [Google Scholar] [CrossRef] [PubMed]
- Bangsbo, J. Energy demands in competitive soccer. J. Sports Sci. 1994, 12, S5–S12. [Google Scholar] [CrossRef]
- Bendiksen, M.; Bischoff, R.; Randers, M.B.; Mohr, M.; Rollo, I.; Suetta, C.; Bangsbo, J.; Krustrup, P. The Copenhagen Soccer Test: Physiological response and fatigue development. Med. Sci. Sports Excerc. 2012, 44, 1595–1603. [Google Scholar] [CrossRef]
- Mohr, M.; Krustrup, P. Heat stress impairs repeated jump ability after competitive elite soccer games. J. Strength Cond. Res. 2013, 27, 683–689. [Google Scholar] [CrossRef]
- McGregor, S.J.; Nicholas, W.C.; Lakomy, H.W.; Williams, C. The influence of intermittent high-intensity shuttle running and fluid ingestion on the performance of a football skill. J. Sports Sci. 1999, 17, 895–903. [Google Scholar] [CrossRef]
- Owen, J.A.; Kehoe, S.J.; Oliver, S.J. Influence of fluid intake on soccer performance in a temperate environment. J. Sports Sci. 2013, 31, 1–10. [Google Scholar] [CrossRef]
- Da Silva, R.P.; Mundel, T.; Natali, A.J.; Filho, M.G.B.; Alfenas, R.C.; Lima, J.R.; Belfort, F.G.; Lopes, P.R.; Marins, J.C. Pre-game hydration status, sweat loss, and fluid intake in elite Brazilian young male soccer players during competition. J. Sports Sci. 2012, 30, 37–42. [Google Scholar] [CrossRef]
- Maughan, R.J.; Shirreffs, S.M.; Merson, S.J.; Horswill, C.A. Fluid and electrolyte balance in elite male football (soccer) players training in a cool environment. J. Sports Sci. 2005, 23, 73–79. [Google Scholar] [CrossRef]
- Shirreffs, S.M.; Aragon-Vargas, L.F.; Chamorro, M.; Maughan, R.J.; Serratosa, L.; Zachwieja, J.J. The sweating response of elite professional soccer players to training in the heat. Int. J. Sports Med. 2005, 26, 90–95. [Google Scholar] [CrossRef] [PubMed]
- Duffield, R.; McCall, A.; Coutts, A.J.; Peiffer, J.J. Hydration, sweat and thermoregulatory responses to professional football training in the heat. J. Sports Sci. 2012, 30, 957–965. [Google Scholar] [CrossRef] [PubMed]
- Gleeson, M. Temperature regulation during exercise. Int. J. Sports Med. 1998, 19 (Suppl. 2), S96–S99. [Google Scholar] [CrossRef] [PubMed]
- Williams, C.; Rollo, I. Carbohydrate Nutrition and Team Sport Performance. Sports Med. 2015, 45 (Suppl. 1), S13–S22. [Google Scholar] [CrossRef] [PubMed]
- Costa, R.J.S.; Miall, A.; Khoo, A.; Rauch, C.; Snipe, R.; Camoes-Costa, V.; Gibson, P. Gut-training: The impact of two weeks repetitive gut-challenge during exercise on gastrointestinal status, glucose availability, fuel kinetics, and running performance. Appl. Physiol. Nutr. Metab. 2017, 42, 547–557. [Google Scholar] [CrossRef]
- Anderson, L.; Orme, P.; Naughton, R.J.; Close, G.L.; Milsom, J.; Rydings, D.; O’Boyle, A.; di Michele, R.; Louis, J.; Hambley, C.; et al. Energy Intake and Expenditure of Professional Soccer Players of the English Premier League: Evidence of Carbohydrate Periodization. Int. J. Sport Nutr. Exerc. Metab. 2017, 27, 228–238. [Google Scholar] [CrossRef]
- Shirreffs, S.M.; Taylor, A.J.; Leiper, J.B.; Maughan, R.J. Post-exercise rehydration in man: Effects of volume consumed and drink sodium content. Med. Sci. Sports Excerc. 1996, 28, 1260–1271. [Google Scholar] [CrossRef]
- Bush, M.; Barnes, C.; Archer, D.T.; Hogg, B.; Bradley, P.S. Evolution of match performance parameters for various playing positions in the English Premier League. Hum. Mov. Sci. 2015, 39, 1–11. [Google Scholar] [CrossRef]
- Baker, L.B.; Ungaro, C.T.; Barnes, K.A.; Nuccio, R.P.; Reimel, A.J.; Stofan, J.R. Validity and reliability of a field technique for sweat Na+ and K+ analysis during exercise in a hot-humid environment. Physiol. Rep. 2014, 2, e12007. [Google Scholar] [CrossRef]
- Bataller-Cervero, A.V.; Gutierrez, H.; DeRenteria, J.; Piedrafita, E.; Marcen, N.; Valero-Campo, C.; Lapuente, M.; Berzosa, C. Validity and Reliability of a 10 Hz GPS for Assessing Variable and Mean Running Speed. J. Hum. Kinet. 2019, 67, 17–24. [Google Scholar] [CrossRef]
- Borg, G. Ratings of perceived exertion and heart rates during short-term cycle exercise and their use in a new cycling strength test. Int. J. Sports Med. 1982, 3, 153–158. [Google Scholar] [CrossRef] [PubMed]
- Armstrong, L.E.; Casa, D.J.; Millard-Stafford, M.; Moran, D.S.; Pyne, S.W.; Roberts, W.O. American College of Sports Medicine position stand. Exertional heat illness during training and competition. Med. Sci. Sports Excerc. 2007, 39, 556–572. [Google Scholar] [CrossRef] [PubMed]
- Thomas, D.T.; Erdman, K.A.; Burke, L.M. American College of Sports Medicine Joint Position Statement. Nutrition and Athletic Performance. Med. Sci. Sports Excerc. 2016, 48, 543–568. [Google Scholar]
- Barnes, K.A.; Anderson, M.L.; Stofan, J.R.; Dalrymple, K.J.; Reimel, A.J.; Roberts, T.J.; Randell, R.K.; Ungaro, C.T.; Baker, L.B. Normative data for sweating rate, sweat sodium concentration, and sweat sodium loss in athletes: An update and analysis by sport. J. Sports Sci. 2019, 37, 2356–2366. [Google Scholar] [CrossRef] [PubMed]
- Maughan, R.J.; Watson, P.; Evans, G.H.; Broad, N.; Shirreffs, S.M. Water balance and salt losses in competitive football. IJSNEM 2007, 17, 583–594. [Google Scholar] [CrossRef]
- Baker, L.B.; Stofan, J.R.; Hamilton, A.A.; Horswill, C.A. Comparison of regional patch collection vs. whole body washdown for measuring sweat sodium and potassium loss during exercise. J. Appl. Physiol. 2009, 107, 887–895. [Google Scholar] [CrossRef]
- Baker, L.B.; Ungaro, C.T.; Sopena, B.C.; Nuccio, R.P.; Reimel, A.J.; Carter, J.M.; Stofan, J.R.; Barnes, K.A. Body map of regional vs. whole body sweating rate and sweat electrolyte concentrations in men and women during moderate exercise-heat stress. J. Appl. Physiol. 2018, 124, 1304–1318. [Google Scholar] [CrossRef]
- Maughan, R.J.; Shirreffs, S.M. Nutrition for soccer players. Curr. Sports Med. Rep. 2007, 6, 279–280. [Google Scholar]
- Dawson, B.; Pyke, F.S.; Morton, A.R. Improvements in heat tolerance induced by interval running training in the heat and in sweat clothing in cool conditions. J. Sports Sci. 1989, 7, 189–203. [Google Scholar] [CrossRef]
- McDermott, B.P.; Anderson, S.A.; Armstrong, L.E.; Casa, D.J.; Cheuvront, S.N.; Cooper, L.; Kenney, W.L.; O’Connor, F.G.; Roberts, W.O. National Athletic Trainers’ Association Position Statement: Fluid Replacement for the Physically Active. J. Athl. Train. 2017, 52, 877–895. [Google Scholar] [CrossRef]
- Aragón-Vargas, L.F.; Moncada-Jiménez, J.; Hernández-Elizondo, J.; Barrenechea, A.C.; Monge-Alvarado, A. Evaluation of pre-game hydration status, heat stress, and fluid balance during professional soccer competition in the heat. Eur. J. Sports Sci. 2009, 9, 269–276. [Google Scholar] [CrossRef]
- Fleming, J.; James, L.J. Repeated familiarisation with hypohydration attenuates the performance decrement caused by hypohydration during treadmill running. Appl. Physiol. Nutr. Metab. 2014, 39, 124–129. [Google Scholar] [CrossRef] [PubMed]
- Cheuvront, S.N.; Ely, B.R.; Kenefick, R.W.; Sawka, M.N. Biological variation and diagnostic accuracy of dehydration assessment markers. Am. J. Clin. Nutr. 2010, 92, 565–573. [Google Scholar] [CrossRef] [PubMed]
- Armstrong, L.E.; Ganio, M.S.; Klau, J.F.; Johnson, E.C.; Casa, D.J.; Maresh, C.M. Novel hydration assessment techniques employing thirst and a water intake challenge in healthy men. Appl. Physiol. Nutr. Metab. 2014, 39, 138–144. [Google Scholar] [CrossRef] [PubMed]
- Impey, S.G.; Hammond, K.M.; Shepherd, S.O.; Sharples, A.P.; Stewart, C.; Limb, M.; Smith, K.; Philp, A.; Jeromson, S.; Hamilton, D.L.; et al. Fuel for the work required: A practical approach to amalgamating train-low paradigms for endurance athletes. Physiol. Rep. 2016, 4, e12803. [Google Scholar] [CrossRef]
- Bartlett, J.D.; Louhelainen, J.; Iqbal, Z.; Cochran, A.J.; Gibala, M.J.; Gregson, W.; Close, G.L.; Drust, B.; Morton, J.P. Reduced carbohydrate availability enhances exercise-induced p53 signaling in human skeletal muscle: Implications for mitochondrial biogenesis. Am. J. Physiol. Regul. Integr. Comp. 2013, 304, R450–R458. [Google Scholar] [CrossRef]
- Rodriguez-Giustiniani, P.; Rollo, I.; Witard, O.C.; Galloway, S.D.R. Ingesting a 12% Carbohydrate-Electrolyte Beverage Before Each Half of a Soccer-Match Simulation Facilitates Retention of Passing Performance and Improves High-Intensity Running Capacity in Academy Players. Int. J. Sport Nutr. Exerc. Metab. 2018, 29, 397–405. [Google Scholar] [CrossRef]
- Hargreaves, M.; Angus, D.; Howlett, K.; Conus, N.M.; Febbraio, M. Effect of heat stress on glucose kinetics during exercise. J. Appl. Physiol. 1996, 81, 1594–1597. [Google Scholar] [CrossRef]
- Newell, M.L.; Wallis, G.A.; Hunter, A.M.; Tipton, K.D.; Galloway, S.D.R. Metabolic Responses to Carbohydrate Ingestion during Exercise: Associations between Carbohydrate Dose and Endurance Performance. Nutrients 2018, 10, 37. [Google Scholar] [CrossRef]
- Buono, M.J.; Ball, K.D.; Kolkhorst, F.W. Sodium ion concentration vs. sweat rate relationship in humans. J. Appl. Physiol. 2007, 103, 990–994. [Google Scholar] [CrossRef]
- Baker, L.B.; Barnes, K.A.; Anderson, M.L.; Passe, D.H.; Stofan, J.R. Normative data for regional sweat sodium concentration and whole-body sweating rate in athletes. J. Sports Sci. 2016, 34, 358–368. [Google Scholar] [CrossRef] [PubMed]
- Baker, L.B.; Pde Chavez, J.D.; Ungaro, C.T.; Sopena, B.C.; Nuccio, R.P.; Reimel, A.J.; Barnes, K.A. Exercise intensity effects on total sweat electrolyte losses and regional vs. whole-body sweat [Na(+)], [Cl(-)], and [K(+)]. EJAP 2019, 119, 361–375. [Google Scholar] [CrossRef] [PubMed]
- Baker, L.B. Sweating Rate and Sweat Sodium Concentration in Athletes: A Review of Methodology and Intra/Interindividual Variability. Sports Med. 2017, 47 (Suppl. S1), 111–128. [Google Scholar] [CrossRef] [PubMed]
- Castro-Sepulveda, M.; Cancino, J.; Fernandez-Verdejo, R.; Perez-Luco, C.; Jannas-Vela, S.; Ramirez-Campillo, R.; del Coso, J.; Zbinden-Foncea, H. Basal Serum Cortisol and Testosterone/Cortisol Ratio Are Related to Rate of Na+ Lost During Exercise in Elite Soccer Players. IJSNEM 2019, 29, 658–663. [Google Scholar] [CrossRef] [PubMed]
- McCubbin, A.J.; Lopez, M.B.; Cox, G.R.; Odgers, J.N.C.; Costa, R.J.S. Impact of 3-day high and low dietary sodium intake on sodium status in response to exertional-heat stress: A double-blind randomized control trial. EJAP 2019, 119, 2105–2118. [Google Scholar] [CrossRef]


| Parameter | Intensity | |
|---|---|---|
| Low | High | |
| Rating of Perceived Exertion | 2–4 | 6–8 |
| Total distance (m) | 2509–2593 | 4889–4949 |
| m·min−1 | 40–46 | 82–86 |
| High Speed Running (m) | 33–35 | 191–232 |
| Number of Sprints | 2–3 | 10–12 |
| Condition | ||||||
|---|---|---|---|---|---|---|
| Cool | Hot | |||||
| Intensity | Low | High | Low | High | F | p |
| Urine Specific Gravity | 1.024 ± 0.005 | 1.023 ± 0.004 | 1.023 ± 0.006 | 1.025 ± 0.005 | (3,52) = 0.35 | 0.786 |
| (1.016–1.032) | (1.014–1.028) | (1.011–1.033) | (1.017–1.034) | |||
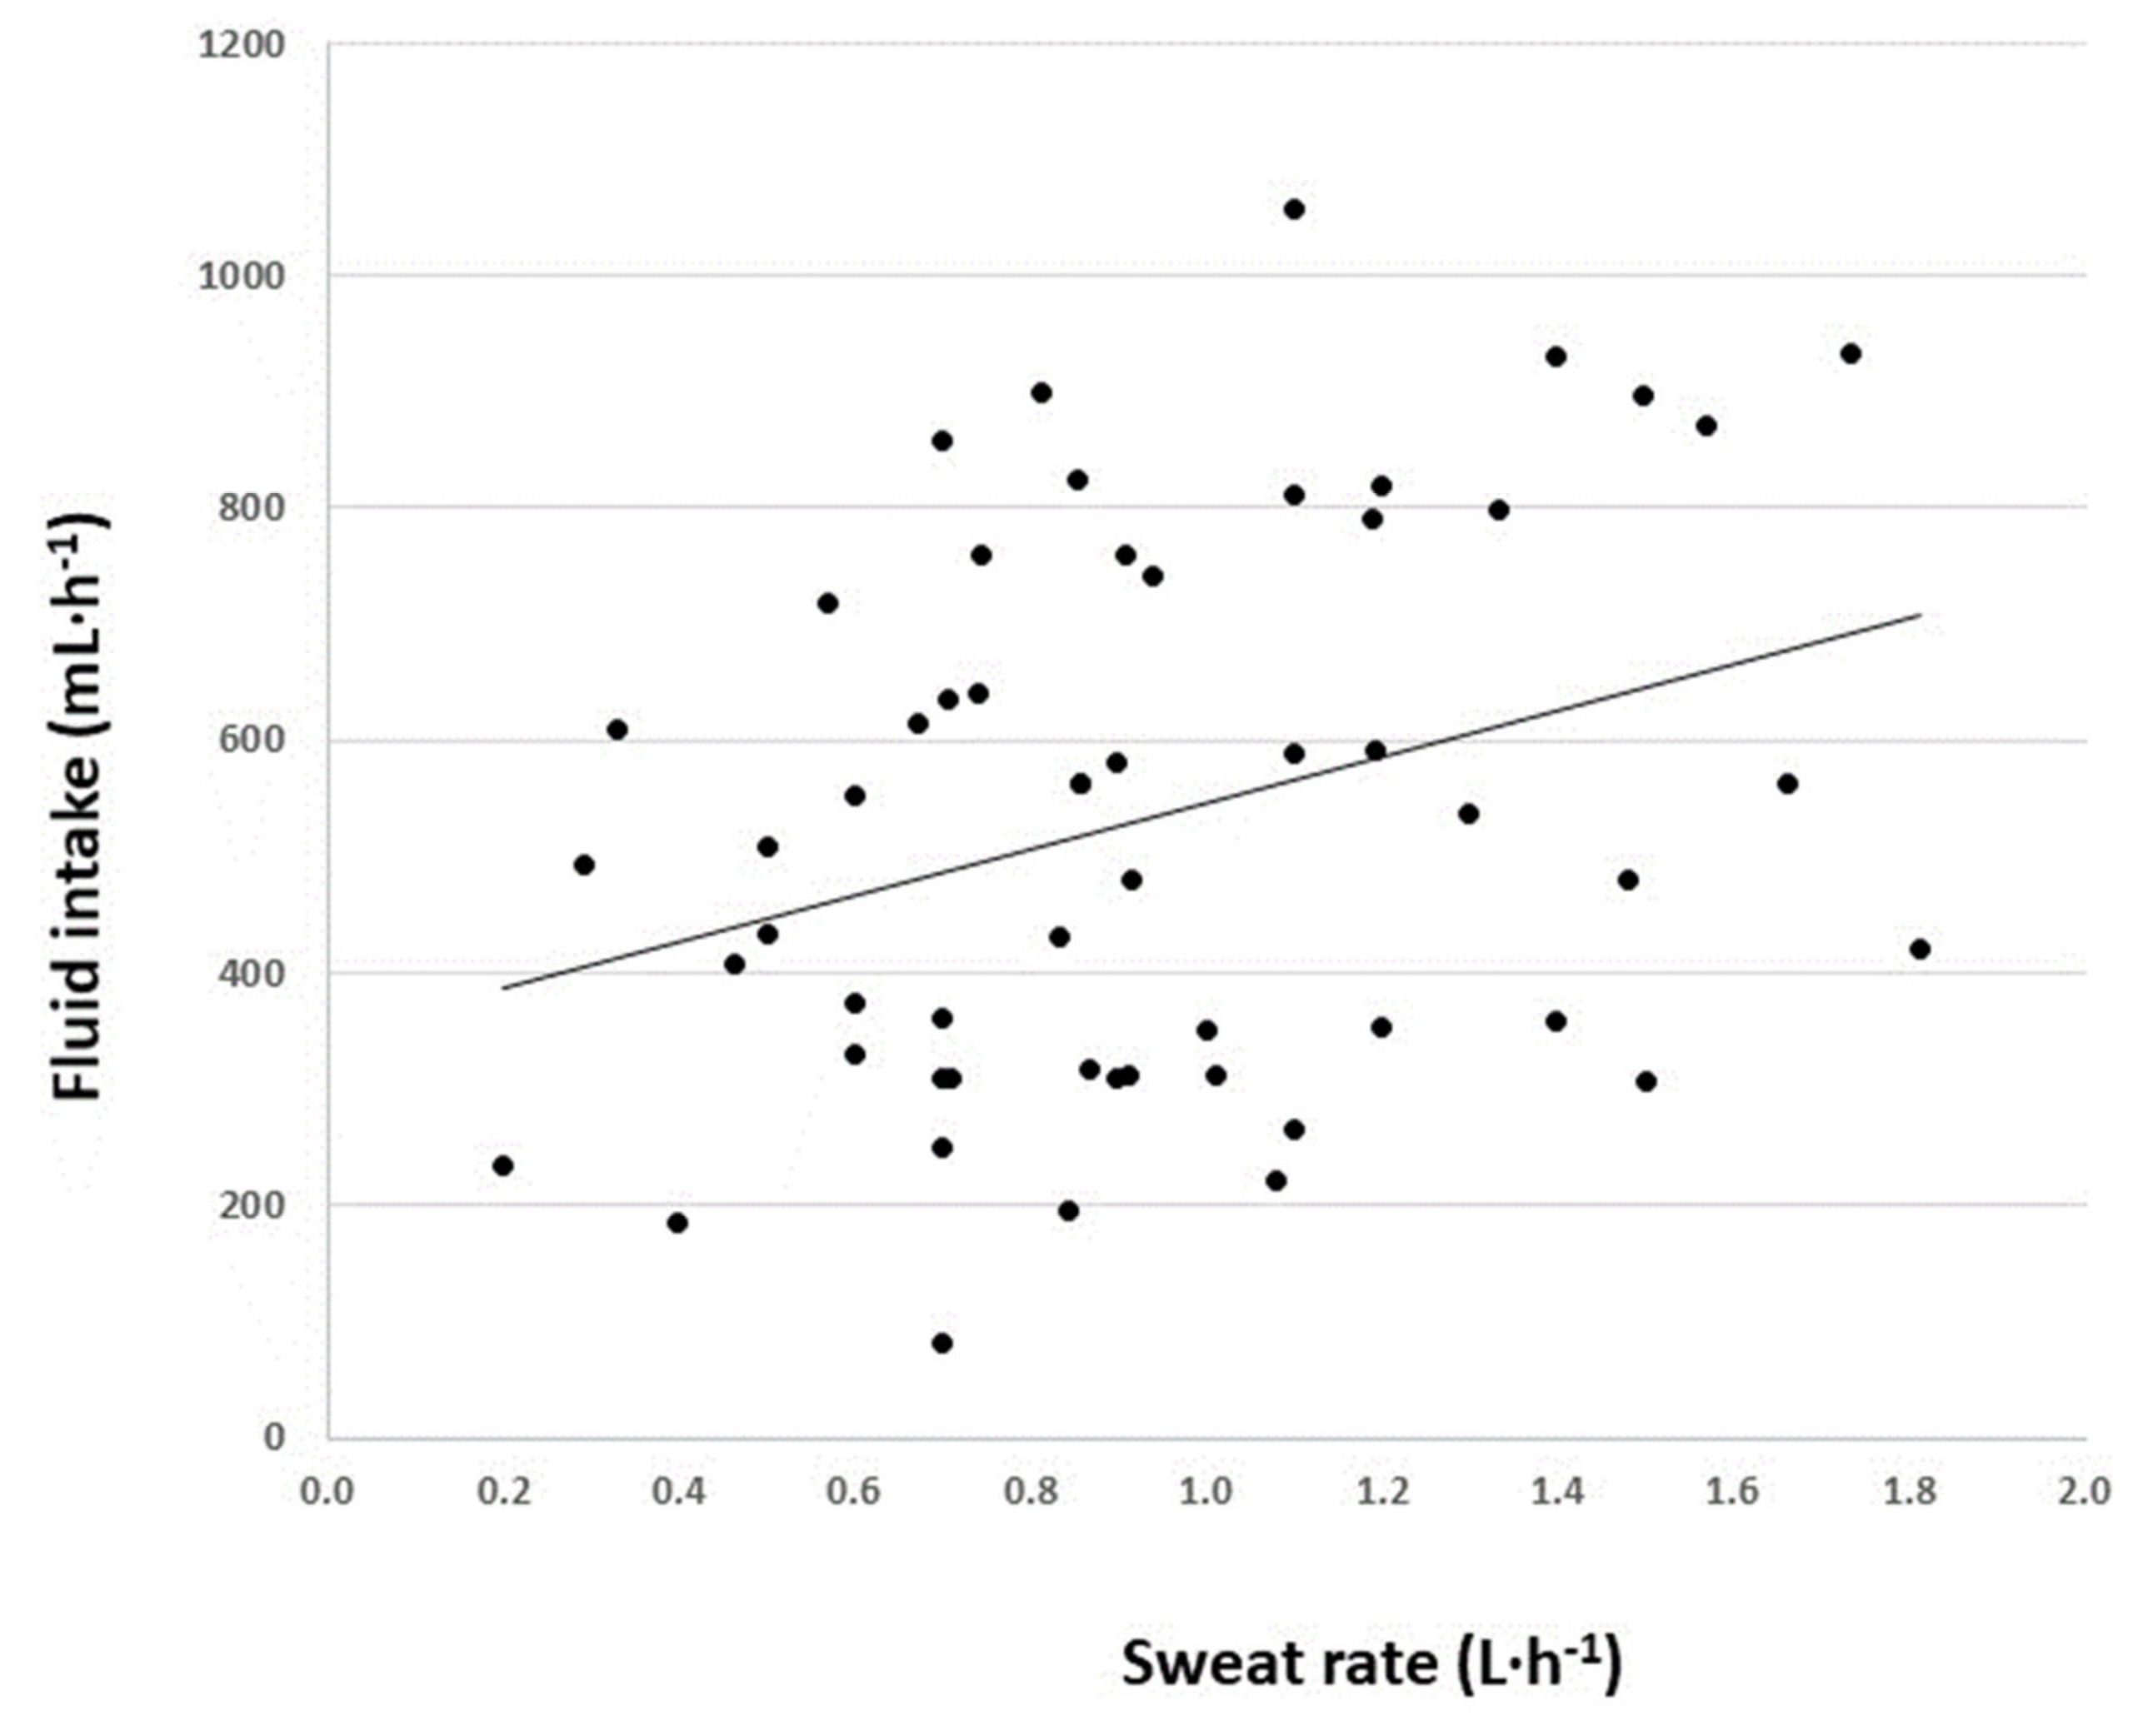
| Sweat rate (L·h−1) | 0.55 ± 0.20 | 0.98 ± 0.21 a | 0.81 ± 0.17 a | 1.43 ± 0.23 abc | (3,52) = 46.37 | 0.001 |
| (0.20–0.85) | (0.67–1.50) | (0.50–1.20) | (1.10–1.81) | |||
| Fluid intake (mL·h−1) | 394 ±160 | 505 ± 265 | 572 ± 214 | 663 ± 229 a | (3,52) = 3.68 | 0.018 |
| (184–719) | (220–1058) | (308–898) | (266–933) | |||
| Carbohydrate intake (g·h−1) | 12 ± 9 | 11 ± 11 | 15 ± 12 | 15 ± 14 | (3,52) = 0.57 | 0.637 |
| (0–37) | (0–32) | (0–36) | (0–50) | |||
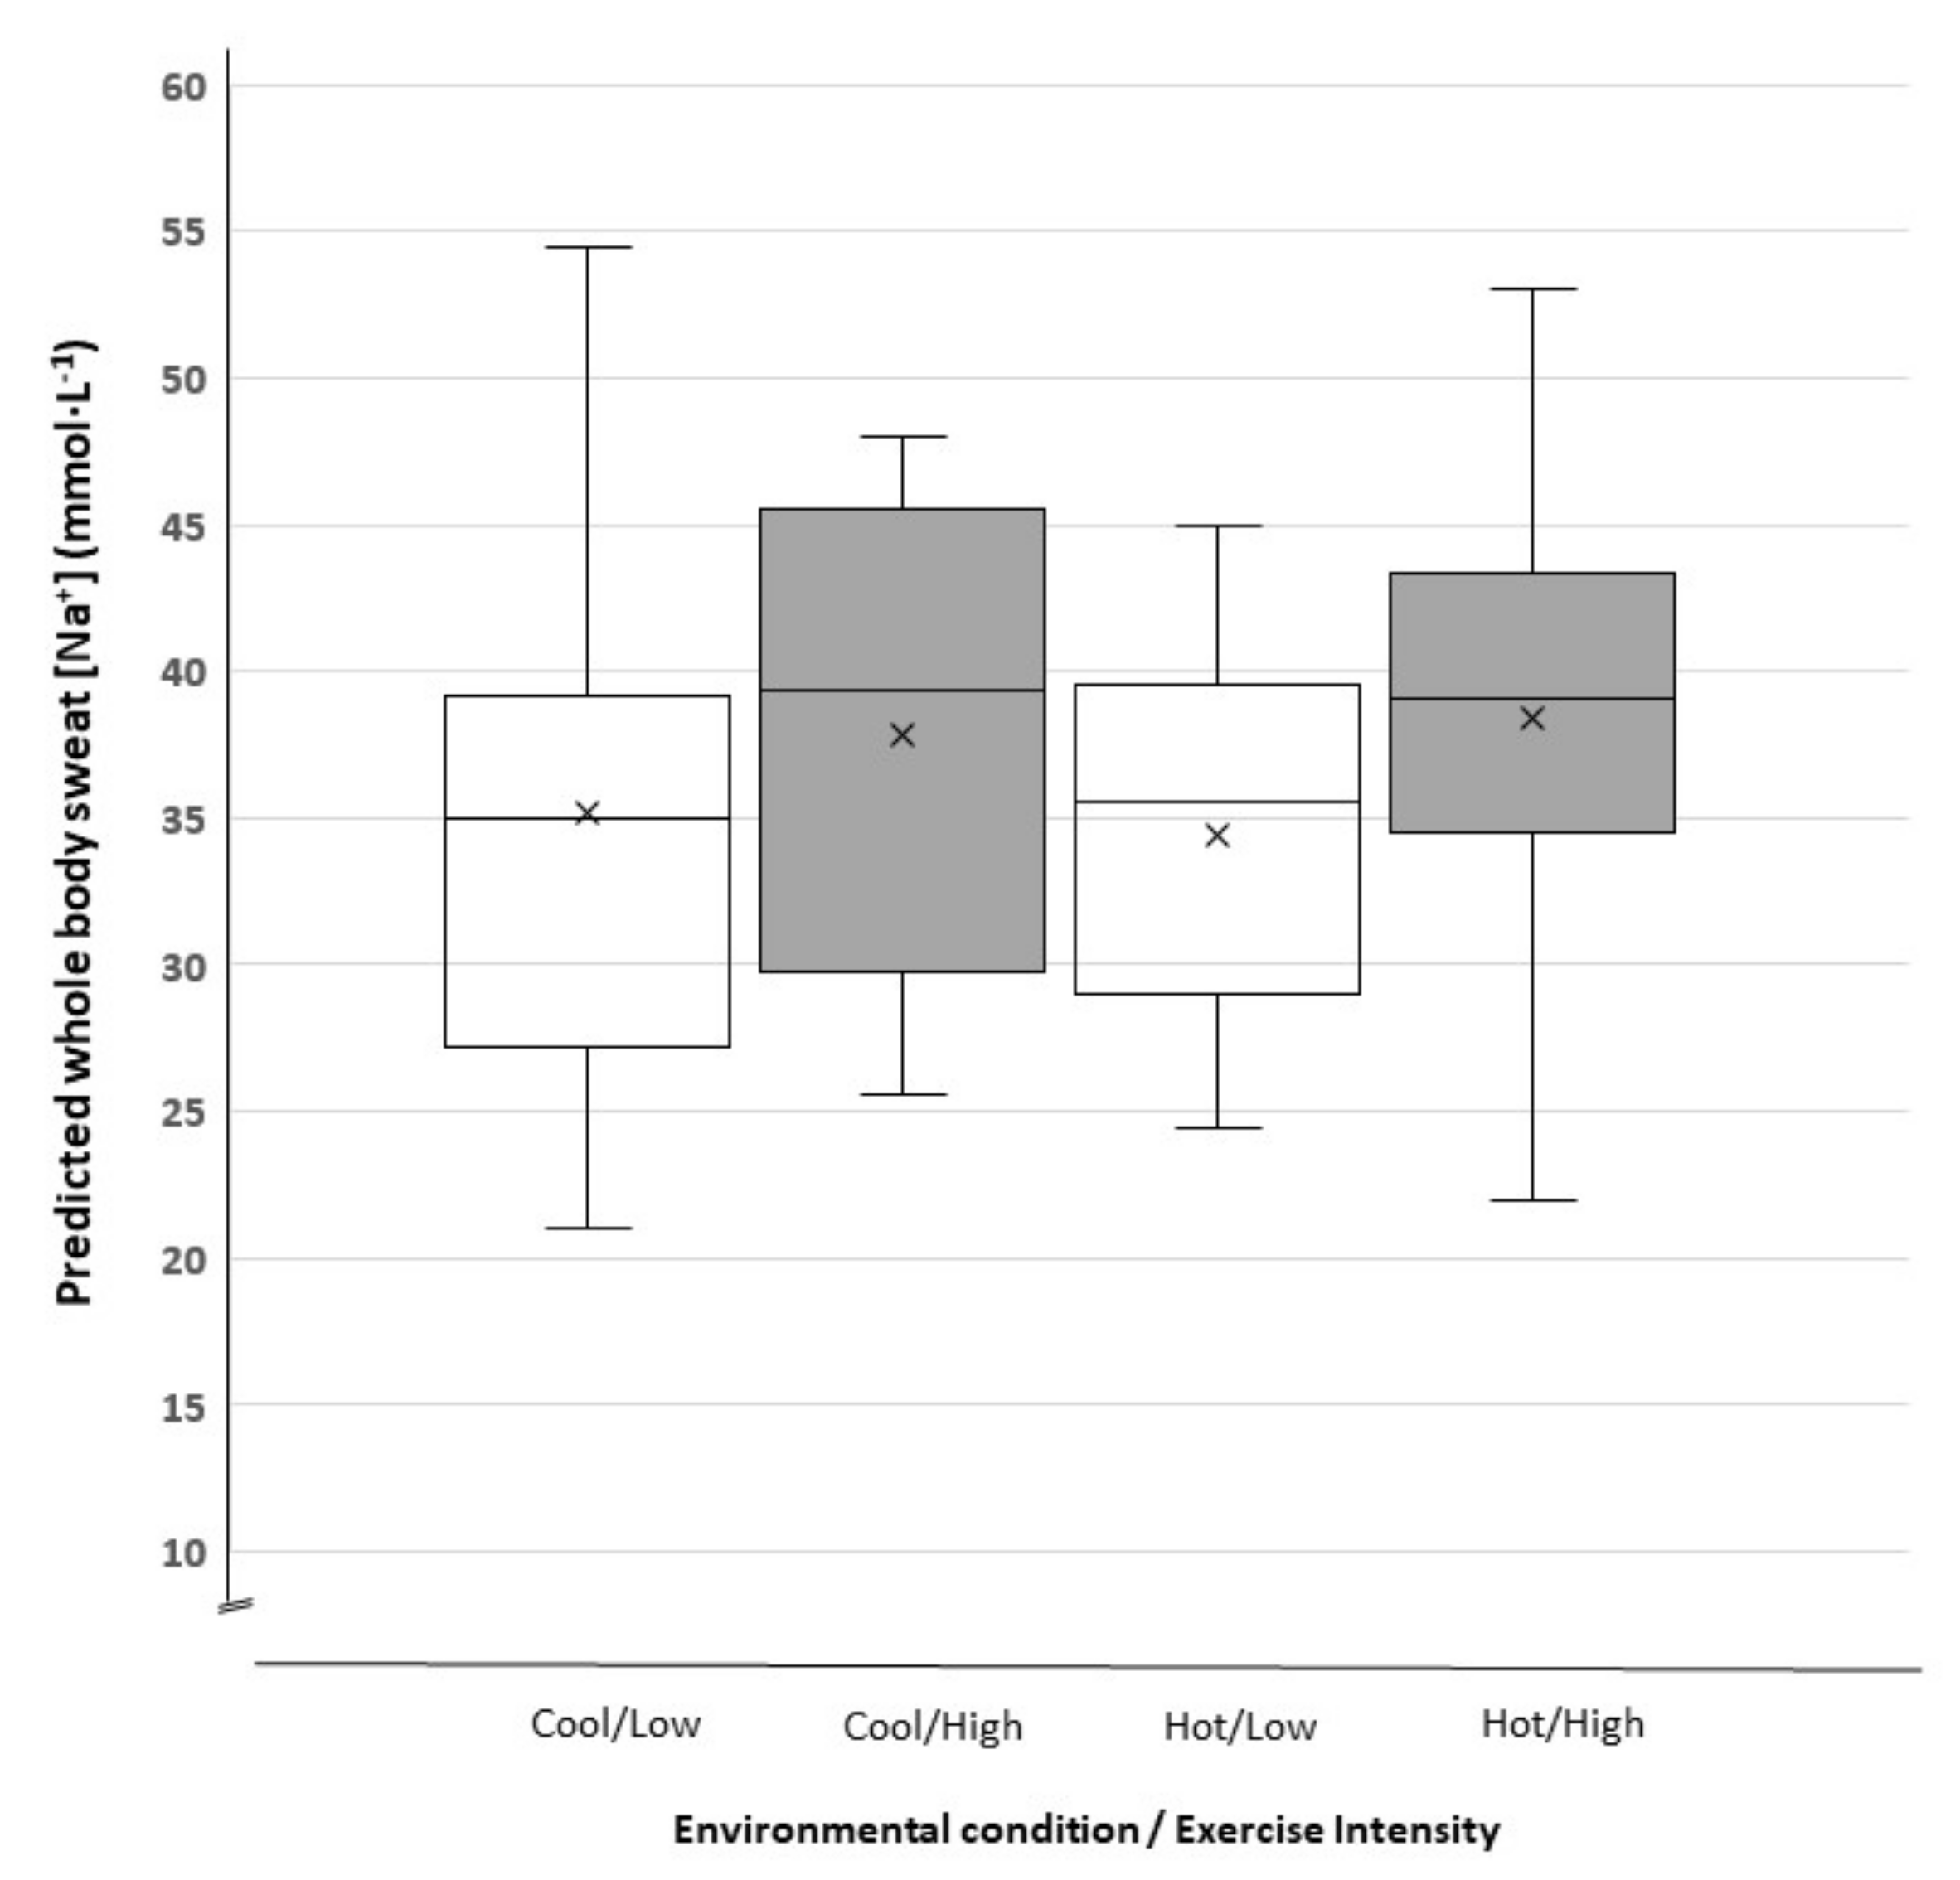
| Sweat [Na+] (mmol·L−1) | 35 ± 9 | 38 ± 8 | 34 ± 7 | 38 ± 8 | (3,52) = 0.85 | 0.475 |
| (21–54) | (26–48) | (24–45) | (22–53) | |||
| Sweat Na+ loss (mmol·h−1) | 19 ± 9 | 38 ± 13 a | 28 ± 9 a | 54 ± 15 abc | (3,52) = 22.98 | 0.001 |
| (7–36) | (19–68) | (13–52) | (33–81) | |||
| NaCl loss (g·h−1) | 1.1 ± 0.5 | 2.2 ± 0.8 a | 1.6 ± 0.5 a | 3.2 ± 0.9 abc | (3,52) = 22.98 | 0.001 |
| (0.4–2.1) | (1.1–3.9) | (0.8–3.0) | (1.9–4.8) | |||
Publisher’s Note: MDPI stays neutral with regard to jurisdictional claims in published maps and institutional affiliations. |
© 2021 by the authors. Licensee MDPI, Basel, Switzerland. This article is an open access article distributed under the terms and conditions of the Creative Commons Attribution (CC BY) license (http://creativecommons.org/licenses/by/4.0/).
Share and Cite
Rollo, I.; Randell, R.K.; Baker, L.; Leyes, J.Y.; Medina Leal, D.; Lizarraga, A.; Mesalles, J.; Jeukendrup, A.E.; James, L.J.; Carter, J.M. Fluid Balance, Sweat Na+ Losses, and Carbohydrate Intake of Elite Male Soccer Players in Response to Low and High Training Intensities in Cool and Hot Environments. Nutrients 2021, 13, 401. https://doi.org/10.3390/nu13020401
Rollo I, Randell RK, Baker L, Leyes JY, Medina Leal D, Lizarraga A, Mesalles J, Jeukendrup AE, James LJ, Carter JM. Fluid Balance, Sweat Na+ Losses, and Carbohydrate Intake of Elite Male Soccer Players in Response to Low and High Training Intensities in Cool and Hot Environments. Nutrients. 2021; 13(2):401. https://doi.org/10.3390/nu13020401
Chicago/Turabian StyleRollo, Ian, Rebecca K. Randell, Lindsay Baker, Javier Yanguas Leyes, Daniel Medina Leal, Antonia Lizarraga, Jordi Mesalles, Asker E. Jeukendrup, Lewis J. James, and James M. Carter. 2021. "Fluid Balance, Sweat Na+ Losses, and Carbohydrate Intake of Elite Male Soccer Players in Response to Low and High Training Intensities in Cool and Hot Environments" Nutrients 13, no. 2: 401. https://doi.org/10.3390/nu13020401
APA StyleRollo, I., Randell, R. K., Baker, L., Leyes, J. Y., Medina Leal, D., Lizarraga, A., Mesalles, J., Jeukendrup, A. E., James, L. J., & Carter, J. M. (2021). Fluid Balance, Sweat Na+ Losses, and Carbohydrate Intake of Elite Male Soccer Players in Response to Low and High Training Intensities in Cool and Hot Environments. Nutrients, 13(2), 401. https://doi.org/10.3390/nu13020401