Abstract
We investigated associations of habitual dietary intake with the taxonomic composition and diversity of the human gut microbiota in 222 Koreans aged 18–58 years in a cross-sectional study. Gut microbiota data were obtained by 16S rRNA gene sequencing on DNA extracted from fecal samples. The habitual diet for the previous year was assessed by a food frequency questionnaire. After multivariable adjustment, intake of several food groups including vegetables, fermented legumes, legumes, dairy products, processed meat, and non-alcoholic beverages were associated with major phyla of the gut microbiota. A dietary pattern related to higher α-diversity (HiαDP) derived by reduced rank regression was characterized by higher intakes of fermented legumes, vegetables, seaweeds, and nuts/seeds and lower intakes of non-alcoholic beverages. The HiαDP was positively associated with several genera of Firmicutes such as Lactobacillus, Ruminococcus, and Eubacterium (all p < 0.05). Among enterotypes identified by principal coordinate analysis based on the β-diversity, the Ruminococcus enterotype had higher HiαDP scores and was strongly positively associated with intakes of vegetables, seaweeds, and nuts/seeds, compared to the two other enterotypes. We conclude that a plant- and fermented food-based diet was positively associated with some genera of Firmicutes (e.g., Lactobacillus, Ruminococcus, and Eubacterium) reflecting better gut microbial health.
1. Introduction
The human gut microbiota is a complex community consisting of 1013–1014 microorganisms, dominated by bacteria, which inhabit the human gastrointestinal tract [1]. The volume of the collective microbial genome is over 100 times larger than the human genome [1,2]. In a symbiotic relationship with the host, the gut microbiota contributes to numerous physiological processes, such as modulating the intestinal gut barrier [3], regulating energy metabolism [4,5], protection against pathogens [6], and regulating the immune system [7].
Host dietary intake is one of the main factors that can modulate the taxonomic composition (classified groups of closely related microbiota) and diversity (distribution of microbiota within or between communities) of the gut microbiota, which could, in turn, promote either beneficial or detrimental consequences on host health through alterations of the physiological functions of the gut microbiota [8,9,10]. Diets rich in animal-based foods such as “Western-style diet” can increase the levels of bile-tolerant bacteria including Bacteroidetes (e.g., Bacteroides and Alistipes), Proteobacteria (Bilophila) and decrease levels of fiber-degrading bacteria such as Firmicutes (e.g., Eubacterium and Ruminococccus) [11,12]. In contrast, plant-based diets such as the “Mediterranean diet” can promote fiber-degrading bacteria, mainly including genera of the Firmicutes phylum, together with increased overall diversity of the gut microbiota [13,14,15].
The majority of studies that have investigated associations between diet and the gut microbiota to date have focused on “Western-style” or Mediterranean diets and have been conducted mainly in European and American populations [15]. In contrast, little is known about the associations between dietary habits and the gut microbiota in the Korean population [16]. Traditional Korean diets are characterized by higher intakes of fermented vegetables, e.g., kimchi, and legumes, e.g., fermented soybean [17,18]. Fermented foods are known to contain large amounts of microorganisms, and their strains are phylogenetically similar to probiotic strains, which could affect the composition and diversity of the gut microbiota, thus affecting human health [19,20].
Recent data from the International Human Microbiome Consortium (IHMC) and the European Metagenomics of the Human Intestinal Tract (MetaHIT) consortium have indicated that the human gut microbiota could be classified into distinct “enterotypes” [8]. Each of the three identified enterotypes was distinguished by different microbial composition at the genus level, with prominent variation in Bacteroides, Prevotella, and Ruminococcus. So far, only two studies have examined associations between these enterotypes and habitual diets in American [21] and in Korean [16] adults.
In a collaborative study between the National Institute of Agricultural Sciences of Korea and the International Agency for Research on Cancer (NAS—IARC), we investigated associations of long-term intake of both foods and nutrients with the taxonomic composition and diversity of the gut microbiota in Korean adults aged 18–60 years. We also aimed to identify dietary patterns associated with gut microbial within-sample (α-) diversity and to explore whether different enterotypes based on gut microbial between-sample (β-) diversity were associated with long-term dietary intake.
2. Materials and Methods
2.1. Study Design and Subjects
Within the NAS-IARC cross-sectional study, participants were residents aged 18–60 years in the local vicinity (within 20 km) of the NAS, the Republic of Korea, between March and October 2018. We excluded volunteers who, prior to recruitment (1) were underweight (body mass index (BMI) < 18.5 kg/m2) or obese (BMI ≥ 30 kg/m2), (2) reported any chronic disease such as inflammatory bowel disease, hypertension, diabetes, hyperlipidemia, or cancer, (3) had taken medication including antibiotics within the past 2 weeks, (4) had taken hormone replacement therapy or used oral contraceptives within the past 2 weeks, or (5) were pregnant or breastfed within the past 6 months. Volunteers who had taken any dietary supplements within the past 3 months were not excluded, but this information was collected using lifestyle questionnaires. The study participants were initially invited to an information meeting, approximately one week prior to the start of the study, where anthropometric data including height and weight were measured by trained research assistants, and exclusion criteria were ascertained. Those eligible for the study were provided with a lifestyle questionnaire (physical activity, alcohol intake, smoking, and socioeconomic status) and a food frequency questionnaire (FFQ) with instructions, and were asked to fill in and return on the study day. During the study day, on-site fecal samples were collected and FFQ and lifestyle data of participants were reviewed by trained research assistants following standardized protocols. Of a total of 229 eligible participants, seven participants failed to collect fecal samples, leading to a sample size of 222 healthy Korean adults (49% males) for this study. We confirmed that all subjects had not taken antibiotics within the past 3 months prior to recruitment.
All procedures and protocols of the study were approved by the Public Institutional Review Boards of the Ministry of Health and Welfare, Korea (Approval no: P01-201801-11-003), and were registered at the WHO International Clinical Trials Registry Platform (ICTRP) (http://apps.who.int/trialsearch/; Registration No.: KCT0002831). All study participants provided written informed consent.
2.2. Dietary Data Collection
Long-term dietary intake data from participants were collected with a semi-quantitative FFQ, which was developed and validated for the Korean diet by the Korea National Institute of Health (KNIH) [22]. The FFQ included 106 food/dish items, including nine Korean staple dishes (rice and noodles), 25 soups and stews, 54 side dishes, nine non-alcoholic beverages, and nine fruits. Subjects were asked to report the consumption frequency and average portion size of each item during the previous year. During the visit of the participants, trained research assistants reviewed the questionnaires with participants for completeness. The 106 food/dish items were classified into 25 food groups—potatoes, vegetables, fermented vegetables, seaweeds, legumes, fermented legumes, fruit/fruit juice, nuts/seeds, dairy, refined grains, multi/whole grains, other cereal products, meats, processed meats, fish/seashells, eggs, vegetable oils, other fats, sugar/confectionery, cakes/sweets, coffee, tea, non-alcoholic beverages, pizza/burgers, and salty snacks based on their recipe. In particular, vegetable and legume groups were divided into two sub-groups, non-fermented and fermented, to take fermentation into account, which could affect gut microbial composition and diversity. This classification of the food groups is shown in Supplemental Table S1. Intakes of macronutrients including protein, fat, carbohydrates (CHO), and dietary fiber were also estimated based on the FFQ data. Protein and fat intake were classified as either plant-based or animal-based separately. Additionally, saturated fatty acids (SFA), monounsaturated fatty acids (MUFA), and polyunsaturated fatty acids (PUFA) were estimated separately. The intakes of food groups and macronutrients were calculated as gram per day (g/day) based on the consumption frequency and average portion size according to a food composition database established for the FFQ [22]. Alcohol intake of the previous year was collected with a lifestyle questionnaire and converted into g/day.
2.3. Fecal Sample Collection
The fecal specimens were collected on-site on the study day at the NAS. We provided a collection tube (SARSTEDT AG & Co., Nümbrecht, Germany) for the fecal sample to each participant. Following the collection, the samples were immediately delivered to the laboratory for processing. Each fecal specimen was mixed manually using a spatula, and approximately 1–2 g of feces for each participant was aliquoted, representing a full scoop of feces, into stool nucleic acid collection tubes (Norgen Biotek Co., Thorold, ON, Canada). Samples were then frozen and stored at 4 °C until further processing (average time between sample collection and storage: approx. 12 min).
2.4. 16S rRNA Gene Sequencing and Taxonomic Assignment
All procedures, from extracting bacterial DNA from the collected fecal samples to generating the gut microbial composition and diversity data, were performed by a biotechnology company (Macrogen Inc., Seoul, Korea) in Seoul, the Republic of Korea. On a weekly basis, the fecal samples collected for one week were transferred to Macrogen Inc., and bacterial DNA from each sample was extracted using PowerSoil® DNA Isolation Kit (Cat. No. 12888, MO BIO) and stored at −80 °C until all samples were collected for further analysis. DNA quantity and quality were measured by PicoGreen and Nanodrop (ThermoFisher Sci. Inc. Waltham, MA, USA). The 16S rRNA amplicons covering variable regions V3-V4 were generated using the primers (forward: 5′-TCGTCGGCAGCGTCAGA TGTGTATAAGAGACAGCCTACGGGNGGCWGCAG-3′ and reverse: 5′-GTCTCGTGG GCTCGGAGATGTGTATAAGAGACAGGACTACHVGGGTATCTAATCC-3′). The final products were normalized and pooled using PicoGreen, the size of libraries was verified using TapeStation DNA screen-tape D1000 (Agilent Tech., Santa Clara, CA, USA), and the amplicons were sequenced using the MiSeq™ platform (Illumina, San Diego, CA, USA). In order to achieve a high quality of data on Illumina sequencing platforms, the pre-processing of the sequencing data was conducted as follows: (1) adapters were trimmed using the SeqPurge [23], (2) the length of short reads was adjusted by overlapping and merging paired-end reads using FLASH (1.2.11) [24], (3) sequencing errors were removed by identifying and removing low-quality reads, ambiguous reads, and chimeric reads using CD-HIT-OTU [25], and (4) using the QIIME 1.9.0 pipeline [26], the sequences were clustered into operational taxonomic units (OTUs) from phylum to species levels with 97% identity using CD-HIT-OTU. The 16S rRNA gene sequencing data supporting the conclusion of this study are available in NCI Sequence Read Archive (SRA) with study accession number: PRJNA644479.
In total, 5.7 million sequence reads from 222 subjects were obtained with an average of 25,852 reads per subject. For standardization, the sequence reads of each subject were rarefied to the minimum of sequence reads (5887 reads) within total subjects [27], and then were clustered into OTUs, and subsequently assigned taxonomy at different levels. The gut microbial taxonomic composition and diversity data for statistical analyses included individual-level information on (1) relative abundance (proportion (%) of OTU) at different bacterial taxonomic levels from phylum to genus levels; (2) within-sample (α-) diversity to understand the number (richness) and/or distribution (evenness) of species within a single sample by estimating three different α-diversity indices [28]—(i) Chao1 index, an abundance-based index of species richness [29,30], (ii) Shannon index, an index of both species richness and evenness [31], and (iii) Faith’s phylogenetic diversity (Faith PD), an index of phylogenetic standardized species richness [32,33]; and (3) between-sample (β-) diversity to understand differences of gut microbial composition in one subject compared to another by measuring three different β-diversity distance matrixes [28]—(i) Bray-Curtis, a distance matrix considering the relative abundances of species [34] and (ii) weighted and (iii) unweighted UniFrac, phylogenetic distance matrixes considering the presence/absence of species with and without weighing the relative abundances [35], respectively.
2.5. Statistical Analysis
Dietary intake data were log-transformed to render the distributions symmetrical and to approximate normality and were adjusted for total energy intake using the residual method. The taxonomic composition data were centered log-ratio (clr) transformed after imputing zeros in the dataset based on a Bayesian-multiplicative replacement [36]. The α-diversity indices were also log-transformed. The differences of relative abundance (% OTU) of the four major phyla and the Firmicutes-to-Bacteroidetes (F/B) ratio, which are the two major phyla in human gut microbiota and are known to be modulated by diet [9,11], by basic characteristics and lifestyle factors (sex; age group: <40 years vs. ≥40 years; BMI group: <23 kg/m2 vs. ≥23 kg/m2; dietary supplement intake within 3 months prior to the enrolment: yes vs. no; regular physical activity: yes vs. no; smoking status: ever vs. never, education: < university graduation vs. ≥ university graduation; household income: <4000 USD/month vs. ≥4000 USD/month) were examined by Wilcoxon-Mann-Whitney tests. Associations of within-sample (α-) diversity and between-sample (β-) diversity of the gut microbiota with characteristics of the study populations were examined by general linear models (GLMs) and permutational multivariate analysis of variance (PERMANOVA), respectively.
In order to examine the gut microbial composition in relation to dietary intake, partial Spearman’s correlation coefficients of the clr transformed relative abundance of the four major phyla, and the clr transformed F/B ratio of human gut microbiota with intakes of food groups and macronutrients were estimated and correlation values displayed using heatmaps. Adjustment for sex, age, BMI, dietary supplement intake, physical activity, smoking status, and sample batch was performed.
Partial Spearman’s correlation coefficients of the within-sample (α-) diversity indices with the intakes of food groups and macronutrients were estimated after adjustment for sex, age, BMI, dietary supplement intake, physical activity, smoking status, and sample batch. To identify dietary patterns associated with high α-diversity (HiαDPs), reduced rank regression (RRR) models were used to derive linear combinations of 25 food groups (predictor variables) maximizing the explained variability of gut microbiota within-sample diversity (each α-diversity index (Chao1, Shannon, and Faith PD) as a response variable in each RRR model) [37]. We then examined partial Spearman’s correlation coefficients between the α-diversity dietary pattern (HiαDP score) and the clr transformed relative abundance of major phyla, including F/B ratio and genera within the major phyla of the human gut microbiota, with sex, age, BMI, dietary supplement intake, physical activity, smoking status, and sample batch as covariates and with multiple comparison corrections using false discovery rate (FDR). In addition, partial Spearman’s correlations between main contributing food groups (factor loading > 0.3) of the identified HiαDPs and the clr transformed relative abundance of genera within the two major phyla were examined. Adjustments were made for sex, age, BMI, dietary supplement intake, physical activity, smoking status, and sample batch, and multiple comparison corrections were made using FDR.
Enterotypes of gut microbiota in healthy Korean adults were explored by a modified method to determine enterotype discovery in the previous study [8] with a combination of principal coordinate analysis (PCoA) based on between-sample (β-) diversity indices (unweighted and weighted UniFrac and Bray-Curtis), and then k-means cluster analysis based on the PCoA scores of the first two principal coordinates (PCos). The optimal number of clusters was determined by visual inspection of clusters derived by three different methods—Elbow [38], Silhouette [39], and Gap statistic [40] methods (Supplemental Figure S1) and by a priori knowledge [8]. The differences in general characteristics and lifestyle factors by enterotypes were examined by GLMs for continuous variables and chi-square test for categorical variables, and the differences in dietary intake, the HiαDP score and intakes of food groups and macronutrients, by enterotypes were examined by GLMs with sex, age, BMI, dietary supplement intake, physical activity, smoking status, and sample batch as covariates.
All analyses were performed using the R statistical software (version 3.6.1, R Development Core Team, 2019) for zero-imputation based on a Bayesian-multiplicative replacement, clr transformation, PCoA and k-means cluster analyses (using cmultRepl, clr, cmdscale, kmeans, and fviz_nbcluster functions) and generating heatmaps and boxplots, and SAS (version. 9.4, The SAS Institute, Cary, NC, USA) for the rest of the analyses.
3. Results
A total of 222 Korean adults (49% males) aged 18~58 years were included in this study. The main characteristics of the study population are shown in Table 1. The mean BMI of the study population was 22.9 kg/m2 (5–95 percentiles: 19.1–28.5 kg/m2), and was slightly higher in males than in females.

Table 1.
General characteristics of Korean adults of the National Institute of Agricultural Sciences of Korea and the International Agency for Research on Cancer (NAS-IARC) cross-sectional study (n = 222 participants).
The dominant phyla in the study population were Bacteroidetes, Firmicutes, Proteobacteria, and Actinobacteria, of which medians of the relative abundance (% OTUs) were 54.2%, 37.6%, 3.8%, and 0.4%, respectively, and encompassed a total of 96.0% of the overall microbiota (Supplemental Table S2). The relative abundance of these four major phyla and the F/B ratio by general characteristics and lifestyle factors of the study population are shown in Supplemental Table S2. The F/B ratio was significantly higher in females than males, with a higher abundance of Firmicutes (39.8% vs. 32.8%, p-value = 0.009) and in never-smokers compared to ever-smokers, with a lower abundance of Bacteroidetes (53.2% vs. 57.4%, p-value = 0.017). Sex, age, and dietary supplement intake were all significantly associated with the abundance of Proteobacteria. Sex, age, BMI, physical activity, and smoking status were also significantly associated with within-sample (α-) and/or between-sample (β-) diversity of the gut microbiota, even though there were differences in the associations depending on indices (Supplemental Table S3).
3.1. Association of Dietary Intake with Gut Microbial Composition
Heatmaps on partial Spearman correlations of the clr transformed relative abundance of four major phyla and the clr transformed F/B ratio of the gut microbiota with intakes of 25 food groups and macronutrients are shown in Figure 1. At the food group level (Figure 1A), intakes of vegetables (r = 0.19), fermented legumes (r = 0.16), vegetable oils (r = 0.15), potatoes (r = 0.14), and nuts/seeds (r = 0.14) were positively correlated with the F/B ratio, even though these were not significantly correlated with the relative abundance of Firmicutes. In contrast, intakes of non-alcoholic beverages including mainly carbonated and sweet beverages (r = 0.17) and other cereal products such as noodles (r = 0.12) were inversely correlated with the F/B ratio, but only intake of noodle products was inversely correlated with the relative abundance of Firmicutes (r = 0.16). Intake of processed meats was positively correlated with the relative abundance of Bacteroidetes (r = 0.15). Intakes of legumes (r = 0.14) and dairy products (r = 0.13) were correlated with the higher relative abundance of Actinobacteria. At the nutrient level (Figure 1B), intake of PUFA was positively correlated with the relative abundance of Firmicutes and the F/B ratio (both r = 0.19). Also, intakes of dietary fiber (r = 0.17) and plant protein (r = 0.15) were positively correlated with the F/B ratio. Intake of plant fat (r = 0.13) was positively correlated with the relative abundance of Actinobacteria.
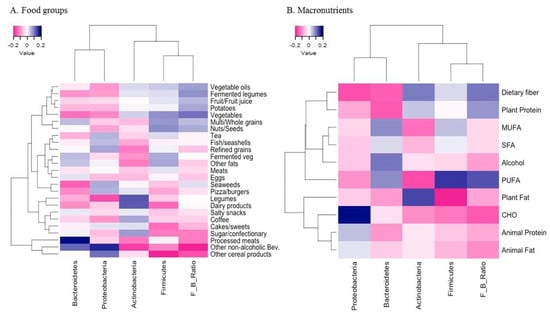
Figure 1.
Heatmaps of partial Spearman correlations between the relative abundance of four major phyla and the Firmicutes-to-Bacteroidetes (F/B) ratio of the gut microbiota and the intakes of food groups (A) and macronutrients (B) in Korean adults of the NAS-IARC cross-sectional study (n = 222 participants). Partial Spearman correlation analysis adjusted for sex, age, BMI, dietary supplement intake, physical activity, smoking status, and sample batch; Intakes of food groups and macronutrients were log-transformed and adjusted for total energy intake using the residual method; the relative abundance of four major phyla and the F/B ratio of the gut microbiota were centered log-ratio transformed.
3.2. Association of Dietary Intake with the within-Sample Diversity of Gut Microbiota
The correlations of intakes of food groups and macronutrients with different α-diversity indices are shown in Supplemental Table S4. Intakes of fermented legumes (r = 0.20), vegetables (r = 0.20), potatoes (r = 0.20), and seaweeds (r = 0.15) among food groups, and dietary fiber (r = 0.19) among nutrients, were all positively correlated with the Shannon index, but not with other α-diversity indices. Based on the Shannon index, we then identified a dietary pattern that best explained α-diversity of the gut microbiota (Figure 2 and Supplemental Tables S5 and S6). This high α-diversity dietary pattern (HiαDP) was characterized by greater intakes of fermented legumes, potatoes, vegetables, seaweeds, nuts/seeds, and tea and lower intakes of non-alcoholic beverages (e.g., carbonated and sweet beverages). The HiαDP was inversely correlated with Bacteroidetes (r = 0.17, p < 0.001), but positively correlated with the F/B ratio (r = 0.24, p < 0.001). At the genus level, the HiαDP was inversely correlated with Coenonia (r = 0.27), Prevotella (r = 0.22), and Tannerella (r = 0.22) within the Bacteroidetes phylum, but positively correlated with Lactobacillus (r = 0.23), Ruminococcus (r = 0.21), and Eubacterium (r = 0.20) and other 41 genera within the Firmicutes phylum. The statistical significance was retained after the FDR corrections (Table 2). In particular, among the main contributing food groups (of which factor loading >3) to the HiαDP, higher intake of fermented legumes was positively correlated with Eubacterium (r = 0.21, p-valueadj = 0.037) (Supplemental Table S7). The dietary patterns identified based on two other α-diversity indices (Chao1 and Faith PD) were also related to the higher intakes of fermented legumes, nuts/seeds, and tea, but not associated with the taxonomic composition of the gut microbiota (Supplemental Table S5).
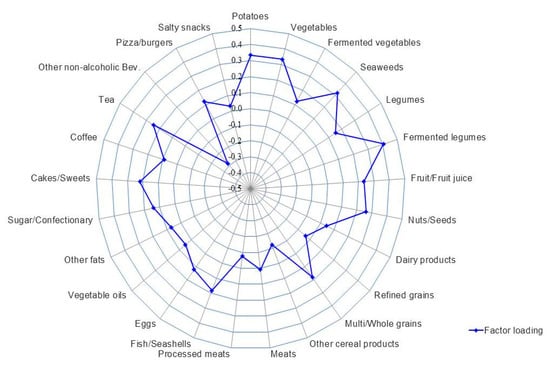
Figure 2.
The high α-diversity dietary pattern (HiαDP) in Korean adults of the NAS-IARC cross-sectional study (n = 222 participants). The factor loading of each food group of the HiαDP in the Korean adults was estimated in a Reduced Rank Regression (RRR) model with the intake of 25 food groups as predictor variables and the Shannon index (α-diversity index) as a response variable; the Shannon index was log-transformed and the intakes of food groups were log-transformed and adjusted for total energy intake using the residual method.
Table 2.
Spearman correlations 1 between the high α-diversity dietary pattern (HiαDP) 2 and relative abundance (% operational taxonomic units (OTU)) of gut microbiota at the phylum and genus levels in Korean adults of the NAS-IARC cross-sectional study (n = 222 participants).
3.3. Enterotypes of Gut Microbiota and Their Association with Dietary Intake
Enterotypes of the gut microbiota among Korean adults based on weighted UniFrac and Bray-Curtis are shown in Figure 3. Three different enterotypes were identified (Figure 3A,B). Each of these enterotypes was characterized by one of the following dominant genera; Bacteroides, Prevotella, and Ruminococcus (Figure 3C,D). The Ruminococcus enterotype showed significantly higher scores of the HiαDP and was more strongly associated with intakes of vegetables, seaweeds, and nuts/seeds at the food group level and dietary fiber at the nutrient level compared to the two other enterotypes, regardless of which distance matrix was used (Table 3). There were no significant differences with respect to sex, age, BMI, or smoking status (Supplemental Table S8). We also identified two enterotypes based on unweighted UniFrac and each enterotype was dominant by Bacteroides and Prevotella (Supplemental Figure S2). None of the enterotypes was associated with intakes of food groups and macronutrients (data not shown).
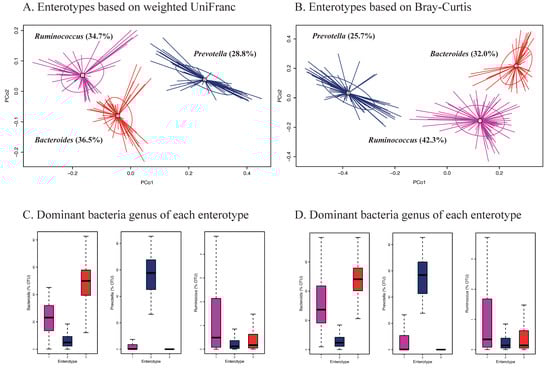
Figure 3.
Enterotypes of gut microbiota in Korean adults of the NAS-IARC cross-sectional study (n = 222 participants). Three enterotypes were identified by Principal Coordinates Analysis (PCoA) and k-means clustering based on (A) weighted UniFrac and (B) Bray-Curtis distance matrix (β-diversity) of gut microbiota in the Korean adults; dominant bacteria genus of each enterotype—Bacteroides, Prevotella, and Ruminococcus based on (C) weighted UniFrac and (D) Bray-Curtis distance matrix; panels A and B show scores of PCo1 (Principal Coordinate) and PCo2 on the axes and each study participant’s ID is represented in the panels (legibility of ID numbers not required).
Table 3.
Difference 1 in the high α-diversity dietary pattern (HiαDP) and intakes of food groups and nutrients among three enterotypes of Korean adults of the NAS-IARC cross-sectional study (n = 222 participants).
4. Discussion
In the NAS-IARC cross-sectional study among Korean adults, we found that a traditional Korean dietary pattern characterized by higher intakes of plant-based and fermented foods and lower intakes of noodle products and carbonated and sugar-sweetened beverages were favorably associated with gut microbial composition and diversity. Specifically, this HiαDP was positively associated with some genera within the Firmicutes phylum, such as Lactobacillus, Ruminococcus, and Eubacterium. Further, we identified three distinct enterotypes, which were characterized by differences in the HiαDP and habitual intakes of specific foods and nutrients.
Our findings on dietary pattern characterized by higher intake of plant-based foods are in line with previous studies reporting that the gut microbial diversity of populations consuming plant-based diets in rural areas in Africa and South America was greater compared to western populations [12,41,42]. Plant-based diets are rich in dietary fiber, which is the main source of microbiota-accessible carbohydrates (MACs), a major energy source for the gut microbiota [43]. An animal model study showed that low MACs diets led to an irreversible depletion of gut microbiota diversity [44]. MACs can be metabolized by “fiber-degrading bacteria” such as Roseburia, Lactobacillus, Eubacterium, Ruminococcus, and Bifidobacterium, mostly belonging to the Firmicutes and Actinobacteria phyla [11,45]. Human intervention studies also found that intakes of MACs-rich foods such as whole-grain foods enhanced the presence of some bacteria of the Firmicutes phylum [46,47]. Consistent with these previous studies, we found that the plant-based dietary pattern in Korean adults was positively associated with some genera within the Firmicutes phylum including Lactobacillus, Ruminococcus, and Eubacterium, known as “fiber-degrading bacteria”. These fiber-degrading bacteria produce short-chain fatty acids including butyrate in the human intestine [48], which are inversely associated with obesity, diabetes, and colorectal cancer [49,50].
Another important finding in the current study was the association of fermented foods such as fermented legumes and seaweeds with taxonomic composition and diversity of the gut microbiota, which has been rarely investigated in previous studies. Fermented foods such as fermented vegetables (e.g., Kimchi), and fermented legume products, mainly based on soybean, (e.g., Cheonggukjang, Doenjang, and Ganjang) are typical dishes of traditional Korean diets [17]. These fermented foods contain living microorganisms including probiotic bacteria (e.g., Lactobacillus, Bifidobacterium, or Streptococcus) and bioactive compounds generated during the fermentation process which could affect the microbial composition and diversity in the human gut [19]. Seaweeds are also typical ingredients of traditional Korean dishes, including laver (Gim in Korea), sea mustard (Miyeok in Korean), and kelp (Dasima in Korean), and a source of bioactive compounds including polysaccharides, dietary fiber, polyphenols, and PUFAs [51]. Especially, seaweed polysaccharides (e.g., alginate, laminarin, and fucoidan) could regulate gut microbiota, stimulating SCFA-producing bacteria such as Lactobacillus, Streptococcus, and Bifidobacteria, which might have potential health benefits against metabolic diseases and certain cancers [52,53,54,55]. However, to date, there is very limited evidence on the impact of habitual intake of fermented foods and seaweeds on the gut microbiota. To the best of our knowledge, this is the first observational study investigating associations between fermented legumes and seaweeds as part of habitual diets and gut microbial composition and diversity. Besides, in our study population, the group of fermented legumes, mainly fermented soybean pastes, was one of the major components of the HiαDP, which was positively associated with the Firmicutes phylum and its genus Lactobacillus, Ruminococcus, and Eubacterium, while this association was not found in the non-fermented legume intake. Therefore, this difference may come from the fermentation process. In previous studies on microbial communities in Korean fermented soybean pastes [56,57], the dominant microbes were found to be Bacillus and other lactic acid bacteria, which mostly belong to the Firmicutes phylum. An intervention study [58] which examined the effect of a typical Korean diet including fermented foods, like Kimchi, and American-style diets on the gut microbiota in 61 overweight/obese Korean adults, also showed that the F/B ratio and some genera within the Firmicutes phylum including Weissella increased after consumption of the typical Korean diet, explained as the effect of the fermented food intake. However, in our study no significant association was found between higher intakes of fermented vegetables including Kimchi and the gut microbiota. This indicated that fermented vegetables like Kimchi, which is one of the most frequently (almost every day and with every meal) and widely consumed foods in the population, could not be a discriminant dietary factor in gut microbial diversity and composition among the Korean population.
In addition, we explored gut microbial enterotypes in Korean adults applying a modified multivariate cluster analysis [8]. The retained enterotypes and their dominant genera, Bacteroides, Prevotella, and Ruminococcus, respectively, were similar to the previous study [8]. Another study in American adults [21] suggested that gut microbial enterotypes were strongly associated with long-term diets compared to short-term diets, showing that the Bacteroides enterotype was strongly associated with a high intake of protein and animal fat and the Prevotella enterotype with a high intake of carbohydrate. Our study also showed that the enterotypes were strongly associated with habitual diet, but there was no significant difference in the intakes of protein, animal fat, and carbohydrate across enterotypes. In our study, there were significant differences in the intake of plant-based foods high in dietary fiber like vegetables, seaweeds, and nuts/seeds across enterotypes. In particular, subjects of the Ruminococcus enterotype were more adherent to the HiαDP, which was characterized by higher intakes of vegetables, seaweeds, nut/seeds, and dietary fiber compared to the two other enterotypes.
A major strength of our study was that it provides a first comprehensive overview of the Korean diet associated with the composition and diversity of the human gut microbiota, considering not only individual intakes of food groups and nutrients but also specific dietary patterns. The dietary pattern analysis accounted for synergistic and correlated effects of food groups [59] on the host diet-gut microbiota. In this study, the within- and between-sample diversity of the gut microbiota was estimated using different diversity indices. Based on our results, the Shannon index, i.e., the α-diversity index estimating both species richness and evenness [31], and the weighted Unifrac and Bray-Curtis distance matrix, i.e., the β-diversity indices considering the relative abundances of species [34,35], seem to reflect the effect of diet on gut microbiota better than other indices. However, a future methodological study is needed. The relatively large sample size is another strength compared to previous microbiome studies (mostly less than 100).
The findings of this study should be interpreted in the light of the following limitations. The concept of enterotypes is controversial. A recent opinion paper [60] stated that analytical factors such as types of beta-diversity distance matrices or criteria such as the optimal number of clusters could affect the enterotype stratification, which may hamper reproducibility. In our study, therefore, we used three different distance matrices and three different optimal number criteria, and we obtained consistent enterotypes within our study population based on two different distance matrices (weighted UniFrac and Bray-Curtis). We believe that our study with a relatively large sample size (n = 222) can provide additional insights to improve the enterotype concept. The 16s rRNA sequencing may be associated with measurement error including limited resolution and lower sensitivity compared to metagenomic sequencing data, even though it enables the capture of broad snapshots to understand the gut microbial community in the human gut [61]. While we adjusted for confounding by factors known to affect the gut microbiota such as sex, age, BMI, intake of dietary supplements including probiotics, physical activity, and smoking status, we were unable to account for the mode of birth delivery and other unmeasured potential confounders due to lack of data [62]. Last, since this was a cross-sectional study with convenience sampling from a southern part of Korea, we cannot determine a causal relationship, and generalization of the study findings should be made cautiously.
5. Conclusions
We conclude that a habitual Korean diet characterized by higher intakes of fermented legumes, vegetables, potatoes, seaweeds, nuts/seeds, and tea, and lower intakes of noodle products and carbonated and sugar-sweetened beverages, was associated with a higher α-diversity and several of the genera within Firmicutes including Lactobacillus, Ruminococcus, and Eubacterium. Of three identified distinct β-diversity enterotypes, labelled according to their dominant genera, the Ruminococcus enterotype was associated with higher intakes of vegetables, seaweeds, legumes, nuts/seeds, and dietary fiber compared to the Prevotella or Bacteroides enterotypes. Further studies are needed to confirm our findings and investigate potential health effects of observed diet-gut microbiota associations.
Supplementary Materials
The following are available online at https://www.mdpi.com/2072-6643/13/2/366/s1, Table S1: Food group classification; Table S2: Difference of relative abundance (% OTU) of four major phyla and Firmicutes-to-Bacteroidetes (F/B) ratio by general characteristic and lifestyle factors of Korean adults of the NAS-IARC cross-sectional study (n = 222 participants); Table S3: Associations of within-subject (α-) and between-subject (β-) diversity of the gut microbiota with general characteristics and lifestyle factors of Korean adults of the NAS-IARC cross-sectional study (n = 222 participants); Table S4: Spearman correlations between the within-subject (α-) diversity of the gut microbiota and dietary intake of foods and nutrients in Korean adults of the NAS-IARC cross-sectional study (n = 222 participants); Table S5: Factor loadings of each food group for high α-diversity dietary patterns (HiαDPs) based on three α-diversity indices in Korean adults of the NAS-IARC cross-sectional study (n = 222 participants); Table S6: Spearman correlations between the high α-diversity dietary pattern (HiαDP) and the relative abundance of Firmicutes and its genera in Korean adults of the NAS-IARC cross-sectional study (n = 222 participants); Table S7: Spearman correlations between intakes of main contributing food groups of the high α-diversity dietary pattern (HiαDP) and the relative abundance of genera within the Bacteroidetes and Firmicutes in Korean adults of the NAS-IARC cross-sectional study (n = 222 participants); Table S8: General characteristics and lifestyle factors by enterotypes in Korean adults of the NAS-IARC cross-sectional study (n = 222 participants); Figure S1: Plots to select optimal numbers of clusters with Elbow, Silhouette, and Gap statistic methods on k-means clustering for identifying enterotypes based on unweighted and weighted UniFrac, and Bray-Curtis distance matrices; Figure S2: Enterotypes of gut microbiota in Korean adults of the NAS-IARC cross sectional study (n = 222 participants) based on unweighted UniFrac.
Author Contributions
The project funding was obtained by H.N., H.-H.J., J.-S.C., M.J.G. and A.S. The study protocol was developed by H.N., H.-H.J., J.-S.C., M.J.G., A.S., and H.F. The field study was conducted by H.-H.J., S.-Y.C., and H.-J.K., J.K. provided essential materials including dietary assessment tools and database. H.N., H.-H.J., G.K., and S.Z. prepared preprocessed data including microbiome data for statistical analysis. All statistical analysis was performed by H.N. and supervised by P.F. and H.F. The first draft of the manuscript was written by H.N. All authors have read and agreed to the published version of the manuscript.
Funding
This work was supported by a research program for Agricultural Science & Technology Development (Project No. PJ01308801) from Rural Development Administration (RDA).
Institutional Review Board Statement
The study was conducted according to the guidelines of the Declaration of Helsinki, and approved by the Ministry of Health and Welfare, Korea (Approval No.: P01-201801-11-003; Date of approval: 26 January 2018).
Informed Consent Statement
Informed consent was obtained from all subjects involved in the study.
Data Availability Statement
The 16S rRNA gene sequencing data supporting the conclusion of this study are available in NCI Sequence Read Archive (SRA) with study accession number, BioProject ID: PRJNA644479.
Acknowledgments
The authors appreciate all participants in the NAS-IARC cross-sectional study.
Conflicts of Interest
The authors declare no conflict of interest. The funders had no role in the design of the study; in the collection, analyses, or interpretation of data; in the writing of the manuscript, or in the decision to publish the results.
Disclaimer
Where authors are identified as personnel of the International Agency for Research on Cancer/World Health Organization, the authors alone are responsible for the views expressed in this article and they do not necessarily represent the decisions, policy or views of the International Agency for Research on Cancer/World Health Organization.
References
- Gill, S.R.; Pop, M.; DeBoy, R.T.; Eckburg, P.B.; Turnbaugh, P.J.; Samuel, B.S.; Gordon, J.I.; Relman, D.A.; Fraser-Liggett, C.M.; Nelson, K.E. Metagenomic Analysis of the Human Distal Gut Microbiome. Science 2006, 312, 1355–1359. [Google Scholar] [CrossRef] [PubMed]
- Thursby, E.; Juge, N. Introduction to the Human Gut Microbiota. Biochem. J. 2017, 474, 1823–1836. [Google Scholar] [CrossRef] [PubMed]
- Natividad, J.M.M.; Verdu, E.F. Modulation of Intestinal Barrier by Intestinal Microbiota: Pathological and Therapeutic Implications. Pharmacol. Res. 2013, 69, 42–51. [Google Scholar] [CrossRef] [PubMed]
- den Besten, G.; van Eunen, K.; Groen, A.K.; Venema, K.; Reijngoud, D.-J.; Bakker, B.M. The Role of Short-Chain Fatty Acids in the Interplay between Diet, Gut Microbiota, and Host Energy Metabolism. J. Lipid Res. 2013, 54, 2325–2340. [Google Scholar] [CrossRef]
- Kasubuchi, M.; Hasegawa, S.; Hiramatsu, T.; Ichimura, A.; Kimura, I. Dietary Gut Microbial Metabolites, Short-Chain Fatty Acids, and Host Metabolic Regulation. Nutrients 2015, 7, 2839–2849. [Google Scholar] [CrossRef]
- Bäumler, A.J.; Sperandio, V. Interactions between the Microbiota and Pathogenic Bacteria in the Gut. Nature 2016, 535, 85–93. [Google Scholar] [CrossRef]
- Belkaid, Y.; Hand, T. Role of the Microbiota in Immunity and Inflammation. Cell 2014, 157, 121–141. [Google Scholar] [CrossRef]
- Arumugam, M.; Raes, J.; Pelletier, E.; Le Paslier, D.; Yamada, T.; Mende, D.R.; Fernandes, G.R.; Tap, J.; Bruls, T.; Batto, J.-M.; et al. Enterotypes of the Human Gut Microbiome. Nature 2011, 473, 174–180. [Google Scholar] [CrossRef]
- Singh, R.K.; Chang, H.-W.; Yan, D.; Lee, K.M.; Ucmak, D.; Wong, K.; Abrouk, M.; Farahnik, B.; Nakamura, M.; Zhu, T.H.; et al. Influence of Diet on the Gut Microbiome and Implications for Human Health. J. Transl. Med. 2017, 15, 73. [Google Scholar] [CrossRef]
- Zmora, N.; Suez, J.; Elinav, E. You Are What You Eat: Diet, Health and the Gut Microbiota. Nat. Rev. Gastroenterol. Hepatol. 2019, 16, 35–56. [Google Scholar] [CrossRef]
- David, L.A.; Maurice, C.F.; Carmody, R.N.; Gootenberg, D.B.; Button, J.E.; Wolfe, B.E.; Ling, A.V.; Devlin, A.S.; Varma, Y.; Fischbach, M.A.; et al. Diet Rapidly and Reproducibly Alters the Human Gut Microbiome. Nature 2014, 505, 559–563. [Google Scholar] [CrossRef] [PubMed]
- Filippo, C.D.; Cavalieri, D.; Paola, M.D.; Ramazzotti, M.; Poullet, J.B.; Massart, S.; Collini, S.; Pieraccini, G.; Lionetti, P. Impact of Diet in Shaping Gut Microbiota Revealed by a Comparative Study in Children from Europe and Rural Africa. Proc. Natl. Acad. Sci. USA 2010, 107, 14691–14696. [Google Scholar] [CrossRef] [PubMed]
- De Filippis, F.; Pellegrini, N.; Vannini, L.; Jeffery, I.B.; La Storia, A.; Laghi, L.; Serrazanetti, D.I.; Di Cagno, R.; Ferrocino, I.; Lazzi, C.; et al. High-Level Adherence to a Mediterranean Diet Beneficially Impacts the Gut Microbiota and Associated Metabolome. Gut 2016, 65, 1812–1821. [Google Scholar] [CrossRef] [PubMed]
- Świątecka, D.; Dominika, Ś.; Narbad, A.; Arjan, N.; Ridgway, K.P.; Karyn, R.P.; Kostyra, H.; Henryk, K. The Study on the Impact of Glycated Pea Proteins on Human Intestinal Bacteria. Int. J. Food Microbiol. 2011, 145, 267–272. [Google Scholar] [PubMed]
- Telle-Hansen, V.H.; Holven, K.B.; Ulven, S.M. Impact of a Healthy Dietary Pattern on Gut Microbiota and Systemic Inflammation in Humans. Nutrients 2018, 10, 1783. [Google Scholar] [CrossRef] [PubMed]
- Lim, M.Y.; Rho, M.; Song, Y.-M.; Lee, K.; Sung, J.; Ko, G. Stability of Gut Enterotypes in Korean Monozygotic Twins and Their Association with Biomarkers and Diet. Sci. Rep. 2014, 4, 7348. [Google Scholar] [CrossRef]
- Patra, J.K.; Das, G.; Paramithiotis, S.; Shin, H.-S. Kimchi and Other Widely Consumed Traditional Fermented Foods of Korea: A Review. Front. Microbiol. 2016, 7, 1493. [Google Scholar] [CrossRef]
- Woo, H.D.; Shin, A.; Kim, J. Dietary Patterns of Korean Adults and the Prevalence of Metabolic Syndrome: A Cross-Sectional Study. PLoS ONE 2014, 9, e111593. [Google Scholar] [CrossRef]
- Bell, V.; Ferrão, J.; Pimentel, L.; Pintado, M.; Fernandes, T. One Health, Fermented Foods, and Gut Microbiota. Foods 2018, 7, 195. [Google Scholar] [CrossRef]
- Dimidi, E.; Cox, S.R.; Rossi, M.; Whelan, K. Fermented Foods: Definitions and Characteristics, Impact on the Gut Microbiota and Effects on Gastrointestinal Health and Disease. Nutrients 2019, 11, 1806. [Google Scholar] [CrossRef]
- Wu, G.D.; Chen, J.; Hoffmann, C.; Bittinger, K.; Chen, Y.-Y.; Keilbaugh, S.A.; Bewtra, M.; Knights, D.; Walters, W.A.; Knight, R.; et al. Linking Long-Term Dietary Patterns with Gut Microbial Enterotypes. Science 2011, 334, 105–108. [Google Scholar] [CrossRef] [PubMed]
- Ahn, Y.; Kwon, E.; Shim, J.E.; Park, M.K.; Joo, Y.; Kimm, K.; Park, C.; Kim, D.H. Validation and Reproducibility of Food Frequency Questionnaire for Korean Genome Epidemiologic Study. Eur. J. Clin. Nutr. 2007, 61, 1435–1441. [Google Scholar] [CrossRef] [PubMed]
- Sturm, M.; Schroeder, C.; Bauer, P. SeqPurge: Highly-Sensitive Adapter Trimming for Paired-End NGS Data. BMC Bioinform. 2016, 17, 208. [Google Scholar] [CrossRef]
- Magoč, T.; Salzberg, S.L. FLASH: Fast Length Adjustment of Short Reads to Improve Genome Assemblies. Bioinformatics 2011, 27, 2957–2963. [Google Scholar] [CrossRef] [PubMed]
- Li, W.; Fu, L.; Niu, B.; Wu, S.; Wooley, J. Ultrafast Clustering Algorithms for Metagenomic Sequence Analysis. Brief. Bioinform. 2012, 13, 656–668. [Google Scholar] [CrossRef]
- Caporaso, J.G.; Kuczynski, J.; Stombaugh, J.; Bittinger, K.; Bushman, F.D.; Costello, E.K.; Fierer, N.; Peña, A.G.; Goodrich, J.K.; Gordon, J.I.; et al. QIIME Allows Analysis of High-Throughput Community Sequencing Data. Nat. Methods 2010, 7, 335–336. [Google Scholar]
- Weiss, S.; Xu, Z.Z.; Peddada, S.; Amir, A.; Bittinger, K.; Gonzalez, A.; Lozupone, C.; Zaneveld, J.R.; Vázquez-Baeza, Y.; Birmingham, A.; et al. Normalization and Microbial Differential Abundance Strategies Depend upon Data Characteristics. Microbiome 2017, 5, 27. [Google Scholar] [CrossRef]
- Morgan, X.C.; Huttenhower, C. Chapter 12: Human Microbiome Analysis. PLoS Comput. Biol. 2012, 8, e1002808. [Google Scholar] [CrossRef]
- Chao, A. Nonparametric Estimation of the Number of Classes in a Population. Scand. J. Stat. 1984, 11, 265–270. [Google Scholar]
- Kim, B.-R.; Shin, J.; Guevarra, R.; Lee, J.H.; Kim, D.W.; Seol, K.-H.; Lee, J.-H.; Kim, H.B.; Isaacson, R. Deciphering Diversity Indices for a Better Understanding of Microbial Communities. J. Microbiol. Biotechnol. 2017, 27, 2089–2093. [Google Scholar] [CrossRef]
- Shannon, C.E. The Mathematical Theory of Communication. 1963. MD Comput. Comput. Med. Pract. 1997, 14, 306–317. [Google Scholar]
- Faith, D.P. Conservation Evaluation and Phylogenetic Diversity. Biol. Conserv. 1992, 61, 1–10. [Google Scholar] [CrossRef]
- Chao, A.; Chiu, C.-H.; Jost, L. Phylogenetic Diversity Measures and Their Decomposition: A Framework Based on Hill Numbers. In Biodiversity Conservation and Phylogenetic Systematics: Preserving Our Evolutionary Heritage in an Extinction Crisis; Pellens, R., Grandcolas, P., Eds.; Topics in Biodiversity and Conservation; Springer International Publishing: Cham, Switzerland, 2016; pp. 141–172. [Google Scholar]
- Bray, J.R.; Curtis, J.T. An Ordination of the Upland Forest Communities of Southern Wisconsin. Ecol. Monogr. 1957, 27, 325–349. [Google Scholar] [CrossRef]
- Lozupone, C.; Knight, R. UniFrac: A New Phylogenetic Method for Comparing Microbial Communities. Appl. Environ. Microbiol. 2005, 71, 8228–8235. [Google Scholar] [CrossRef] [PubMed]
- Quinn, T.P.; Erb, I.; Gloor, G.; Notredame, C.; Richardson, M.F.; Crowley, T.M. A Field Guide for the Compositional Analysis of Any-Omics Data. GigaScience 2019, 8, 1–14. [Google Scholar] [CrossRef] [PubMed]
- Izenman, A.J. Reduced-Rank Regression for the Multivariate Linear Model. J. Multivar. Anal. 1975, 5, 248–264. [Google Scholar] [CrossRef]
- Syakur, M.A.; Khotimah, B.K.; Rochman, E.M.S.; Satoto, B.D. Integration K-Means Clustering Method and Elbow Method for Identification of The Best Customer Profile Cluster. IOP Conf. Ser. Mater. Sci. Eng. 2018, 336, 012017. [Google Scholar] [CrossRef]
- Rousseeuw, P.J. Silhouettes: A Graphical Aid to the Interpretation and Validation of Cluster Analysis. J. Comput. Appl. Math. 1987, 20, 53–65. [Google Scholar] [CrossRef]
- Tibshirani, R.; Walther, G.; Hastie, T. Estimating the Number of Clusters in a Data Set via the Gap Statistic. J. R. Stat. Soc. Ser. B 2001, 63, 411–423. [Google Scholar] [CrossRef]
- Martínez, I.; Stegen, J.C.; Maldonado-Gómez, M.X.; Eren, A.M.; Siba, P.M.; Greenhill, A.R.; Walter, J. The Gut Microbiota of Rural Papua New Guineans: Composition, Diversity Patterns, and Ecological Processes. Cell Rep. 2015, 11, 527–538. [Google Scholar] [CrossRef]
- Yatsunenko, T.; Rey, F.E.; Manary, M.J.; Trehan, I.; Dominguez-Bello, M.G.; Contreras, M.; Magris, M.; Hidalgo, G.; Baldassano, R.N.; Anokhin, A.P.; et al. Human Gut Microbiome Viewed across Age and Geography. Nature 2012, 486, 222–227. [Google Scholar] [CrossRef] [PubMed]
- Sonnenburg, E.D.; Sonnenburg, J.L. Starving Our Microbial Self: The Deleterious Consequences of a Diet Deficient in Microbiota-Accessible Carbohydrates. Cell Metab. 2014, 20, 779–786. [Google Scholar] [CrossRef] [PubMed]
- Sonnenburg, E.D.; Smits, S.A.; Tikhonov, M.; Higginbottom, S.K.; Wingreen, N.S.; Sonnenburg, J.L. Diet-Induced Extinctions in the Gut Microbiota Compound over Generations. Nature 2016, 529, 212–215. [Google Scholar] [CrossRef] [PubMed]
- Ganesan, K.; Chung, S.K.; Vanamala, J.; Xu, B. Causal Relationship between Diet-Induced Gut Microbiota Changes and Diabetes: A Novel Strategy to Transplant Faecalibacterium Prausnitzii in Preventing Diabetes. Int. J. Mol. Sci. 2018, 19, 3720. [Google Scholar] [CrossRef] [PubMed]
- Carvalho-Wells, A.L.; Helmolz, K.; Nodet, C.; Molzer, C.; Leonard, C.; McKevith, B.; Thielecke, F.; Jackson, K.G.; Tuohy, K.M. Determination of the in Vivo Prebiotic Potential of a Maize-Based Whole Grain Breakfast Cereal: A Human Feeding Study. Br. J. Nutr. 2010, 104, 1353–1356. [Google Scholar] [CrossRef]
- Walter, J.; Martínez, I.; Rose, D.J. Holobiont Nutrition: Considering the Role of the Gastrointestinal Microbiota in the Health Benefits of Whole Grains. Gut Microbes 2013, 4, 340–346. [Google Scholar] [CrossRef]
- Schwiertz, A.; Taras, D.; Schäfer, K.; Beijer, S.; Bos, N.A.; Donus, C.; Hardt, P.D. Microbiota and SCFA in Lean and Overweight Healthy Subjects. Obesity 2010, 18, 190–195. [Google Scholar] [CrossRef]
- Karlsson, F.; Tremaroli, V.; Nielsen, J.; Bäckhed, F. Assessing the Human Gut Microbiota in Metabolic Diseases. Diabetes 2013, 62, 3341–3349. [Google Scholar] [CrossRef]
- Qin, J.; Li, Y.; Cai, Z.; Li, S.; Zhu, J.; Zhang, F.; Liang, S.; Zhang, W.; Guan, Y.; Shen, D.; et al. A Metagenome-Wide Association Study of Gut Microbiota in Type 2 Diabetes. Nature 2012, 490, 55–60. [Google Scholar] [CrossRef]
- Brown, E.M.; Allsopp, P.J.; Magee, P.J.; Gill, C.I.; Nitecki, S.; Strain, C.R.; McSorley, E.M. Seaweed and Human Health. Nutr. Rev. 2014, 72, 205–216. [Google Scholar] [CrossRef]
- You, L.; Gong, Y.; Li, L.; Hu, X.; Brennan, C.; Kulikouskaya, V. Beneficial Effects of Three Brown Seaweed Polysaccharides on Gut Microbiota and Their Structural Characteristics: An Overview. Int. J. Food Sci. Technol. 2020, 55, 1199–1206. [Google Scholar] [CrossRef]
- Charoensiddhi, S.; Conlon, M.A.; Vuaran, M.S.; Franco, C.M.M.; Zhang, W. Impact of Extraction Processes on Prebiotic Potential of the Brown Seaweed Ecklonia Radiata by in Vitro Human Gut Bacteria Fermentation. J. Funct. Foods 2016, 24, 221–230. [Google Scholar] [CrossRef]
- Liu, M.; Ma, L.; Chen, Q.; Zhang, P.; Chen, C.; Jia, L.; Li, H. Fucoidan Alleviates Dyslipidemia and Modulates Gut Microbiota in High-Fat Diet-Induced Mice. J. Funct. Foods 2018, 48, 220–227. [Google Scholar] [CrossRef]
- Ramnani, P.; Chitarrari, R.; Tuohy, K.; Grant, J.; Hotchkiss, S.; Philp, K.; Campbell, R.; Gill, C.; Rowland, I. In Vitro Fermentation and Prebiotic Potential of Novel Low Molecular Weight Polysaccharides Derived from Agar and Alginate Seaweeds. Anaerobe 2012, 18, 1–6. [Google Scholar] [CrossRef] [PubMed]
- Kim, T.-W.; Lee, J.-H.; Kim, S.-E.; Park, M.-H.; Chang, H.C.; Kim, H.-Y. Analysis of Microbial Communities in Doenjang, a Korean Fermented Soybean Paste, Using Nested PCR-Denaturing Gradient Gel Electrophoresis. Int. J. Food Microbiol. 2009, 131, 265–271. [Google Scholar] [CrossRef]
- Nam, Y.-D.; Lee, S.-Y.; Lim, S.-I. Microbial Community Analysis of Korean Soybean Pastes by Next-Generation Sequencing. Int. J. Food Microbiol. 2012, 155, 36–42. [Google Scholar] [CrossRef]
- Shin, J.-H.; Jung, S.; Kim, S.-A.; Kang, M.-S.; Kim, M.-S.; Joung, H.; Hwang, G.-S.; Shin, D.-M. Differential Effects of Typical Korean Versus American-Style Diets on Gut Microbial Composition and Metabolic Profile in Healthy Overweight Koreans: A Randomized Crossover Trial. Nutrients 2019, 11, 2450. [Google Scholar] [CrossRef]
- Hu, F.B. Dietary Pattern Analysis: A New Direction in Nutritional Epidemiology. Curr. Opin. Lipidol. 2002, 13, 3–9. [Google Scholar] [CrossRef]
- Cheng, M.; Ning, K. Stereotypes About Enterotype: The Old and New Ideas. Genomics Proteomics Bioinformatics 2019, 17, 4–12. [Google Scholar] [CrossRef]
- Poretsky, R.; Rodriguez-R, L.M.; Luo, C.; Tsementzi, D.; Konstantinidis, K.T. Strengths and Limitations of 16S RRNA Gene Amplicon Sequencing in Revealing Temporal Microbial Community Dynamics. PLoS ONE 2014, 9, e93827. [Google Scholar] [CrossRef]
- Scepanovic, P.; Hodel, F.; Mondot, S.; Partula, V.; Byrd, A.; Hammer, C.; Alanio, C.; Bergstedt, J.; Patin, E.; Touvier, M.; et al. A Comprehensive Assessment of Demographic, Environmental, and Host Genetic Associations with Gut Microbiome Diversity in Healthy Individuals. Microbiome 2019, 7, 130. [Google Scholar] [CrossRef] [PubMed]


Publisher’s Note: MDPI stays neutral with regard to jurisdictional claims in published maps and institutional affiliations. |
© 2021 by the authors. Licensee MDPI, Basel, Switzerland. This article is an open access article distributed under the terms and conditions of the Creative Commons Attribution (CC BY) license (http://creativecommons.org/licenses/by/4.0/).