
Synbiotics Easing Renal Failure by Improving Gut Microbiology II (SYNERGY II): A Feasibility Randomized Controlled Trial

 ,
,  , , , and
Abstract
:1. Introduction
2. Materials and Methods
2.1. Participants
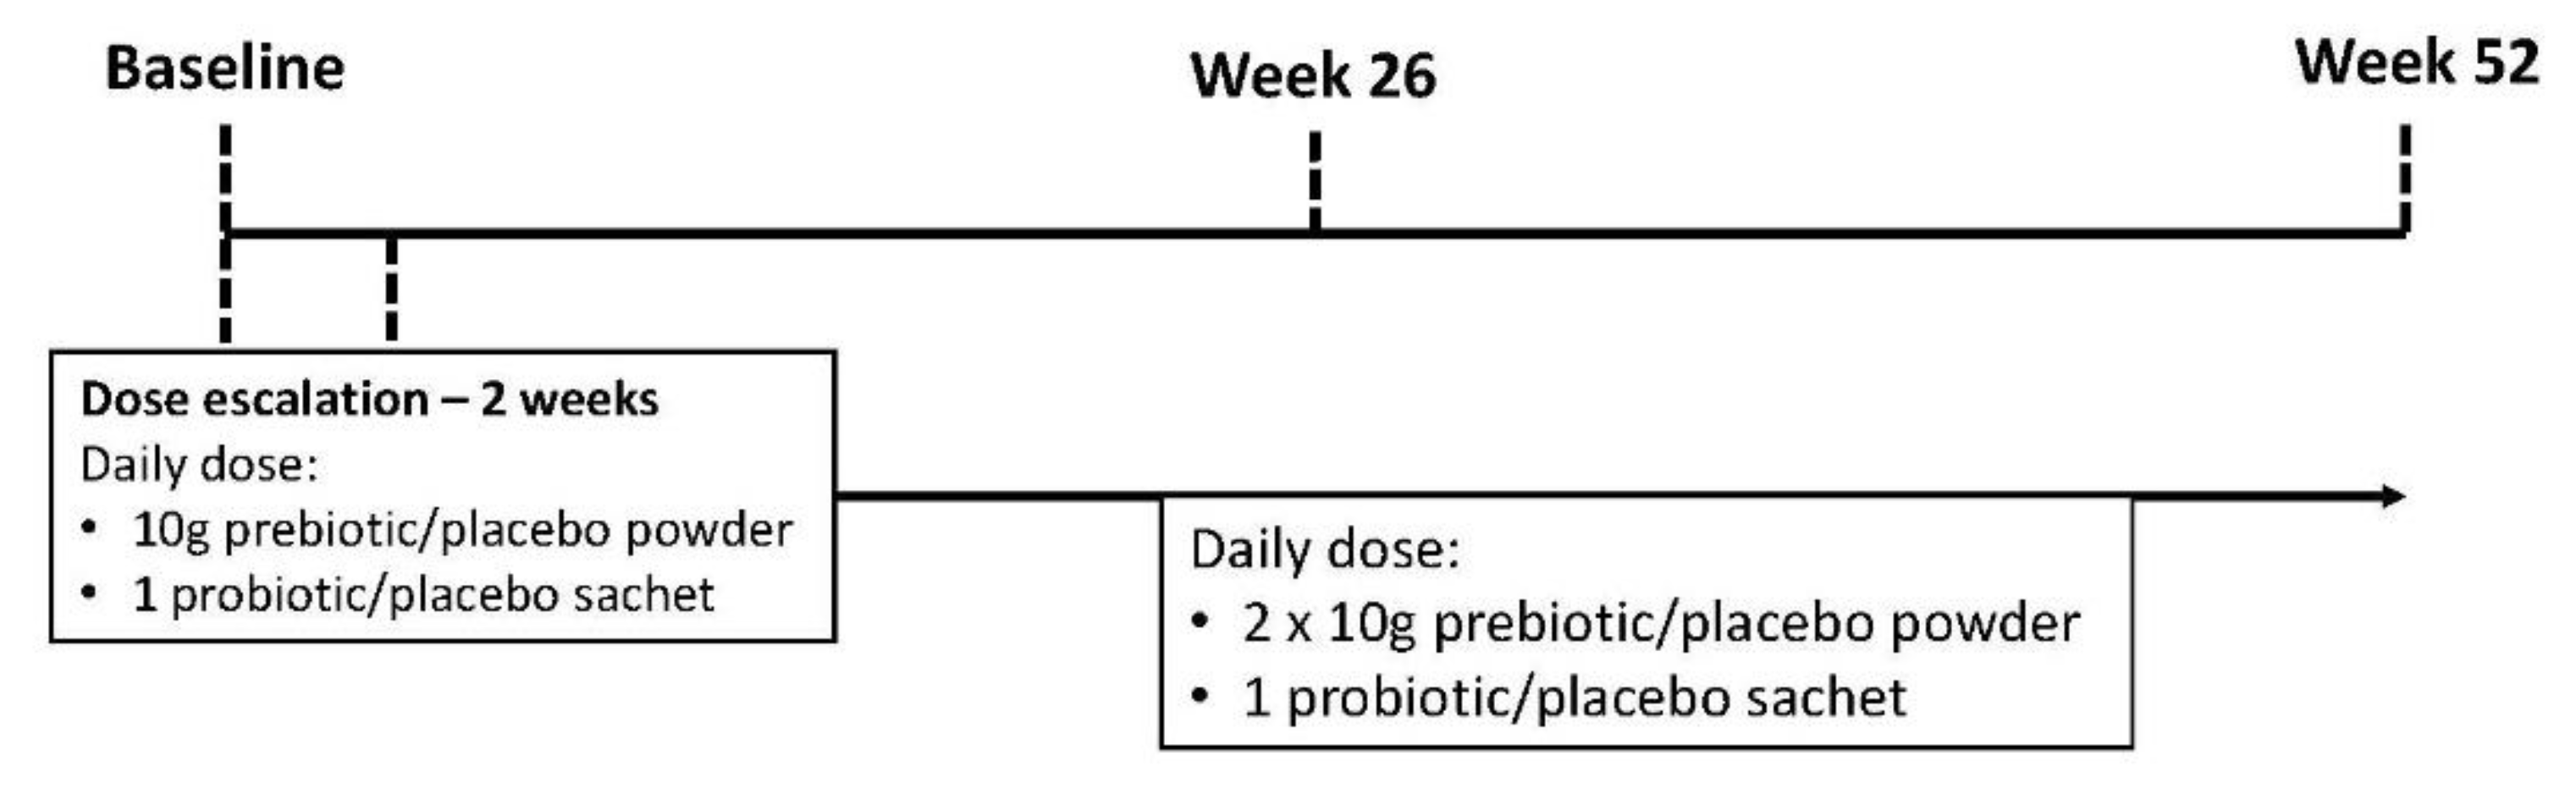
2.2. Study Design
2.3. Intervention
2.4. Outcome Measures
Primary Outcome
2.5. Secondary Outcomes
2.6. Exploratory Outcomes
2.7. Sample Size
2.8. Statistical Analysis
3. Results
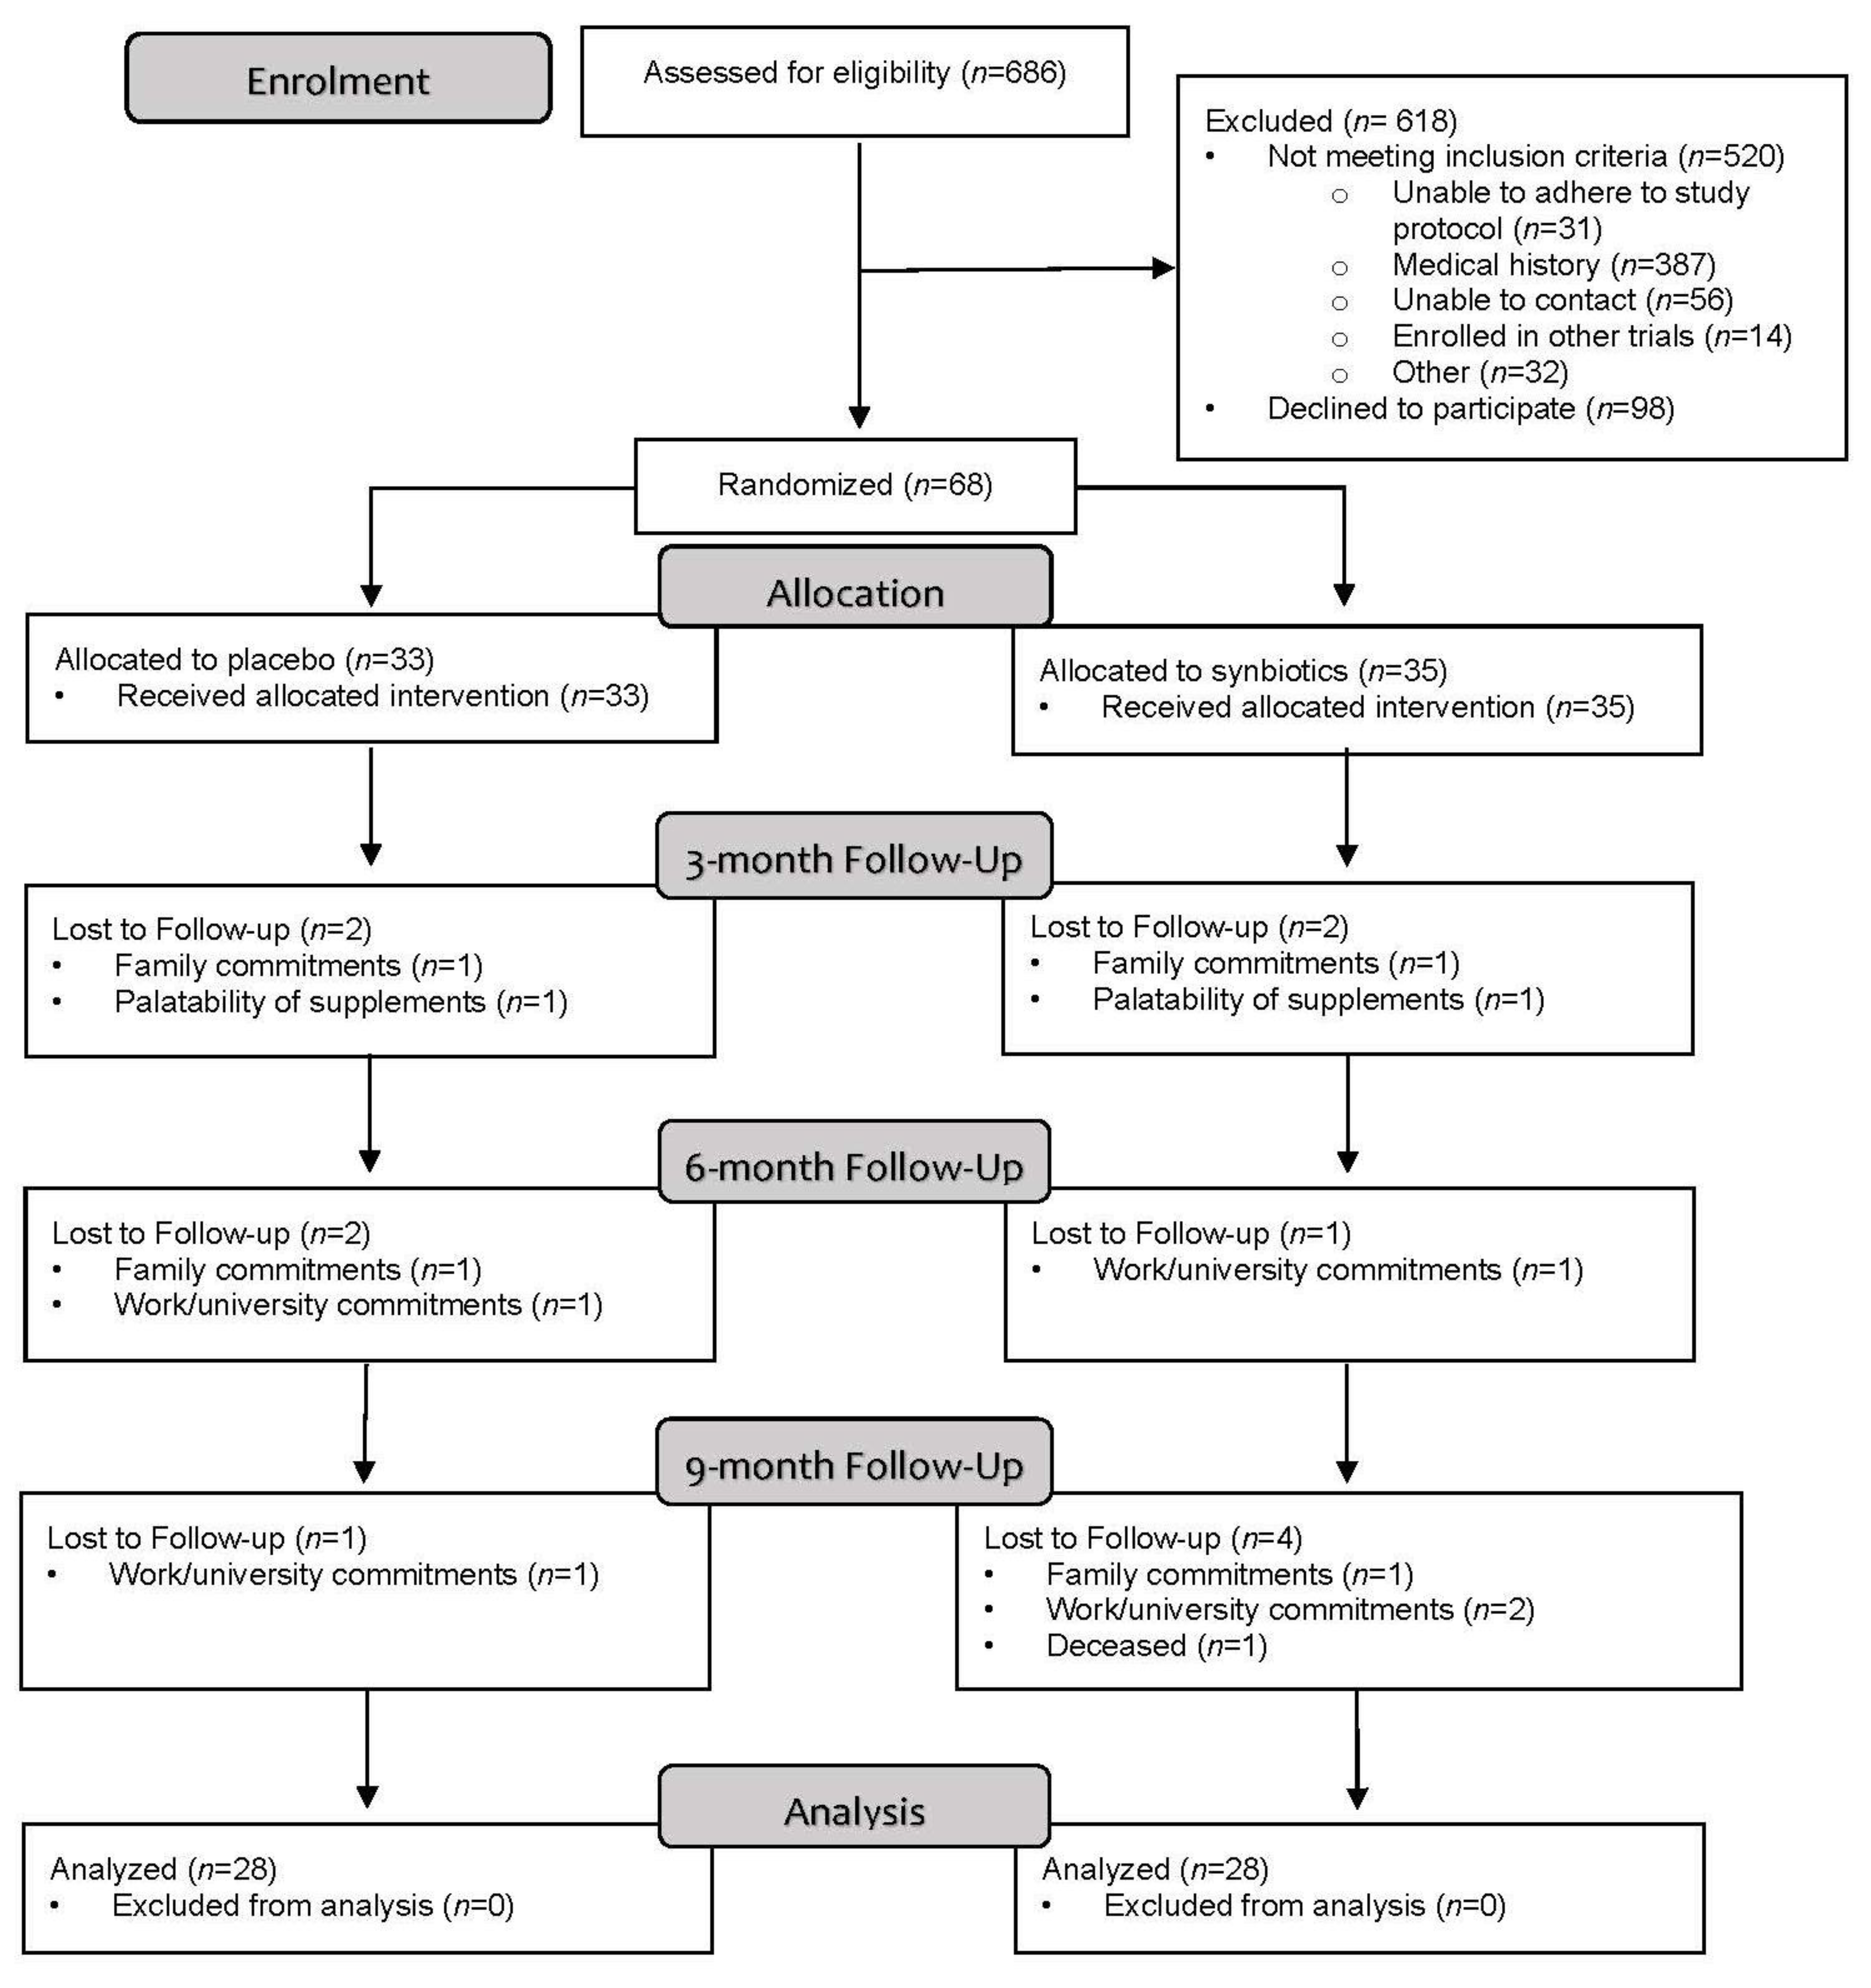
3.1. Feasibility
3.1.1. Recruitment
3.1.2. Retention
3.2. Acceptability
3.3. Secondary Outcomes
3.4. Exploratory Outcomes
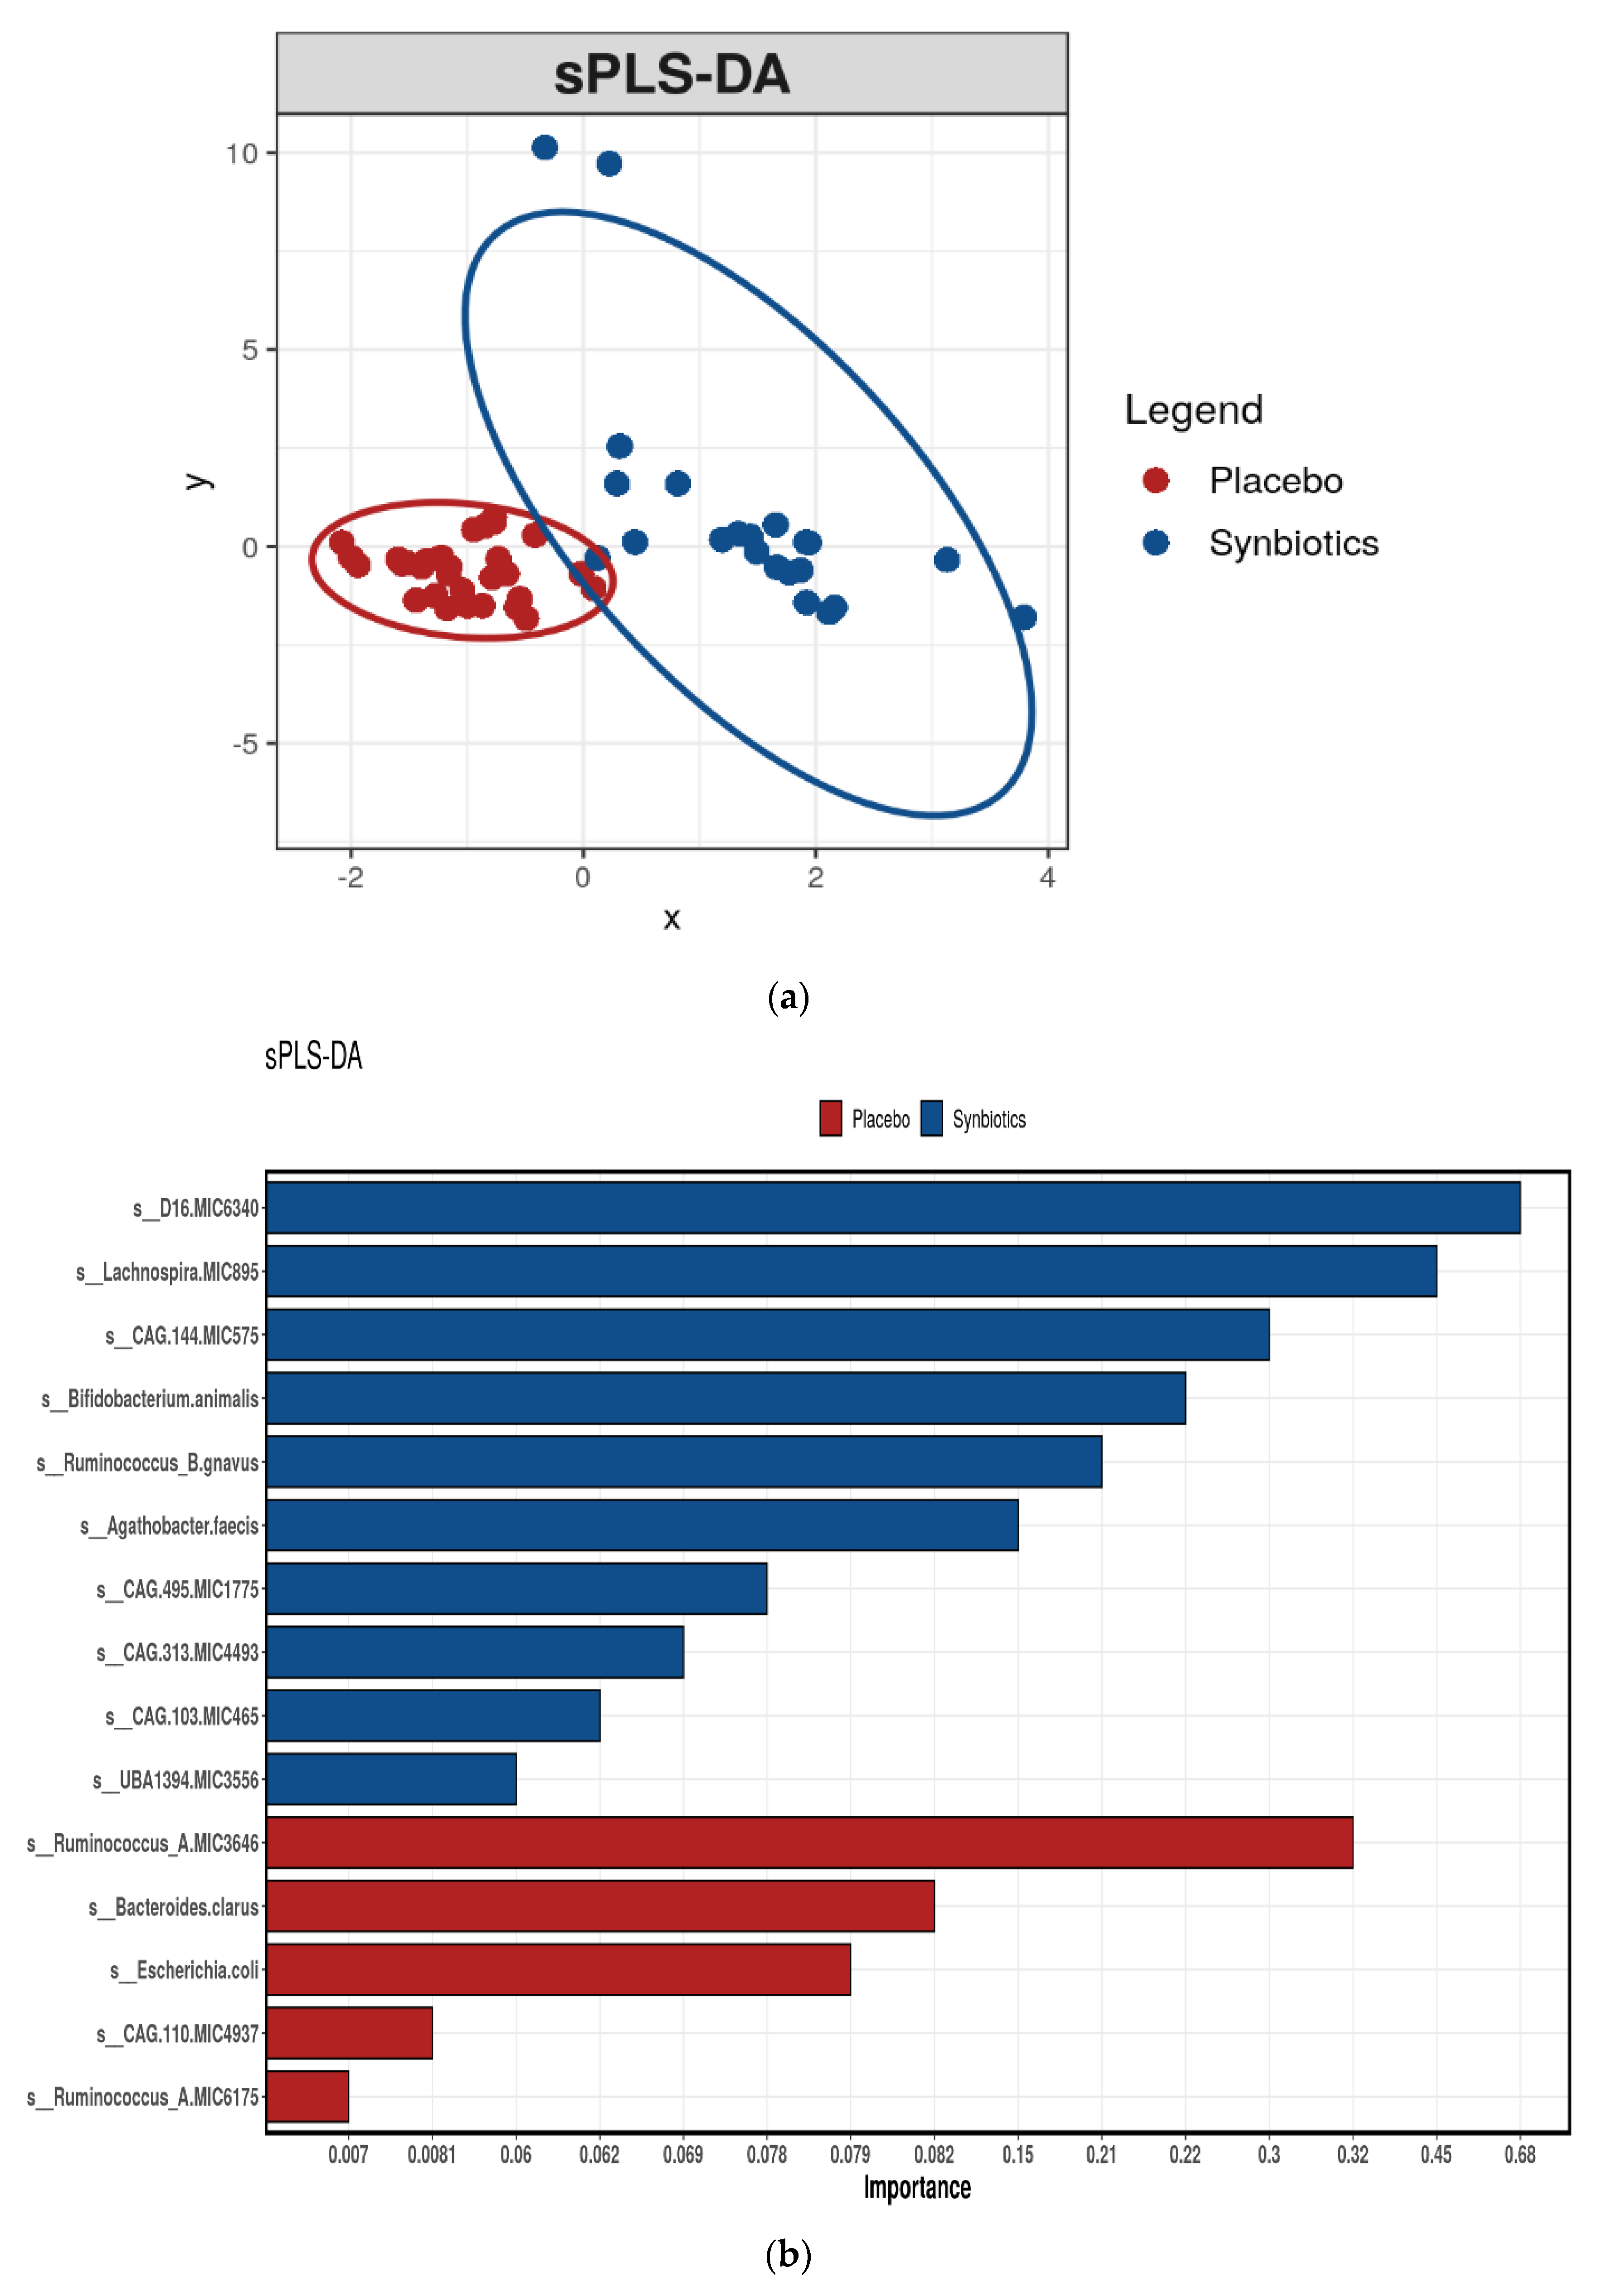
3.5. Gastrointestinal (Stool) Microbiota
Functional Assessment of the Gastrointestinal Microbiome
4. Discussion
Supplementary Materials
Author Contributions
Funding
Institutional Review Board Statement
Informed Consent Statement
Data Availability Statement
Acknowledgments
Conflicts of Interest
Appendix A. Materials and Methods
Appendix A.1. Evaluation Cardiovascular Structure and Function
Appendix A.2. Biochemical Measurement
Appendix A.3. Uremic Toxins
Appendix A.4. Stool Microbiota Analysis
References
- Weiner, D.E. Chronic Kidney Disease as a Risk Factor for Cardiovascular Disease and All-Cause Mortality: A Pooled Analysis of Community-Based Studies. J. Am. Soc. Nephrol. 2004, 15, 1307–1315. [Google Scholar] [CrossRef]
- Stenvinkel, P.; Carrero, J.J.; Axelsson, J.; Lindholm, B.; Heimburger, O.; Massy, Z. Emerging biomarkers for evaluating cardiovascular risk in the chronic kidney disease patient: How do new pieces fit into the uremic puzzle? Clin. J. Am. Soc. Nephrol. 2008, 3, 505–521. [Google Scholar] [CrossRef] [Green Version]
- Moradi, H.; Sica, D.A.; Kalantar-Zadeh, K. Cardiovascular burden associated with uremic toxins in patients with chronic kidney disease. Am. J. Nephrol. 2013, 38, 136–148. [Google Scholar] [CrossRef] [Green Version]
- Liabeuf, S.; Barreto, D.V.; Barreto, F.C.; Meert, N.; Glorieux, G.; Schepers, E.; Temmar, M.; Choukroun, G.; Vanholder, R.; Massy, Z.A.; et al. Free p-cresyl sulphate is a predictor of mortality in patients at different stages of chronic kidney disease. Nephrol. Dial. Transpl. 2010, 25, 1183–1191. [Google Scholar] [CrossRef] [Green Version]
- Lin, C.J.; Liu, H.L.; Pan, C.F.; Chuang, C.K.; Jayakumar, T.; Wang, T.J.; Chen, H.H.; Wu, C.J. Indoxyl sulfate predicts cardiovascular disease and renal function deterioration in advanced chronic kidney disease. Arch. Med. Res. 2012, 43, 451–456. [Google Scholar] [CrossRef]
- Snelson, M.; Biruete, A.; McFarlane, C.; Campbell, K. A Renal Clinician’s Guide to the Gut Microbiota. J. Ren. Nutr. 2020, 30, 384–395. [Google Scholar] [CrossRef]
- Meijers, B.K.; Evenepoel, P. The gut-kidney axis: Indoxyl sulfate, p-cresyl sulfate and CKD progression. Nephrol. Dial Transpl. 2011, 26, 759–761. [Google Scholar] [CrossRef]
- Rossi, M.; Johnson, D.W.; Morrison, M.; Pascoe, E.M.; Coombes, J.S.; Forbes, J.M.; Szeto, C.C.; McWhinney, B.C.; Ungerer, J.P.; Campbell, K.L. Synbiotics Easing Renal Failure by Improving Gut Microbiology(SYNERGY): A Randomized Trial. Clin. J. Am. Soc. Nephrol. 2016, 11, 223–231. [Google Scholar] [CrossRef] [PubMed]
- McFarlane, C.; Ramos, C.I.; Johnson, D.W.; Campbell, K.L. Prebiotic, Probiotic, and Synbiotic Supplementation in Chronic Kidney Disease: A Systematic Review and Meta-analysis. J. Ren. Nutr. 2019, 29, 209–220. [Google Scholar] [CrossRef] [Green Version]
- MacLaughlin, H.L.; Sarafidis, P.A.; Greenwood, S.A.; Campbell, K.L.; Hall, W.L.; Macdougall, I.C. Compliance With a Structured Weight Loss Program Is Associated With Reduced Systolic Blood Pressure in Obese Patients With Chronic Kidney Disease. Am. J. Hypertens. 2012, 25, 1024–1029. [Google Scholar] [CrossRef] [Green Version]
- Cedillo-Couvert, E.A.; Ricardo, A.C.; Chen, J.; Cohan, J.; Fischer, M.J.; Krousel-Wood, M.; Kusek, J.W.; Lederer, S.; Lustigova, E.; Ojo, A.; et al. Self-reported Medication Adherence and CKD Progression. Kidney Int. Rep. 2018, 3, 645–651. [Google Scholar] [CrossRef] [PubMed] [Green Version]
- Ash, S.; Campbell, K.; MacLaughlin, H.; McCoy, E.; Chan, M.; Anderson, K.; Corke, K.; Dumont, R.; Lloyd, L.; Meade, A.; et al. Evidence based practice guidelines for the nutritional management of chronic kidney disease. Nutr. Diet 2006, 63, S35–S45. [Google Scholar] [CrossRef] [Green Version]
- Chan, M.J.D. Modification of Lifestyle and Nutrition Interventions for Management of Early Chronic Kidney Disease. Available online: http://www.cari.org.au/CKD/CKD%20early/ (accessed on 14 August 2020).
- Fuentes-Zaragoza, E.; Sánchez-Zapata, E.; Sendra, E.; Sayas, E.; Navarro, C.; Fernández-López, J.; Pérez-Alvarez, J.A. Resistant starch as prebiotic: A review. Starch–Stärke 2011, 63, 406–415. [Google Scholar] [CrossRef]
- Gibson, G.R.W.X. Regulatory effects of bifidobacteria on the growth of other colonic bacteria. J. Appl. Bacteriol. 1994, 77, 412–420. [Google Scholar] [CrossRef] [PubMed]
- Evenepoel, P.; Meijers, B.K.; Bammens, B.R.; Verbeke, K. Uremic toxins originating from colonic microbial metabolism. Kidney Int. Suppl. 2009, 76, S12–S19. [Google Scholar] [CrossRef] [PubMed] [Green Version]
- Svedlund, J.; Sjödin, I.; Dotevall, G. GSRS—A clinical rating scale for gastrointestinal symptoms in patients with irritable bowel syndrome and peptic ulcer disease. Dig. Dis. Sci. 1988, 33, 129–134. [Google Scholar] [CrossRef]
- O’Donnell, L.J.V.J.; Heaton, K.W. Detection of pseudodiarrhoea by simple clinical assessment of intestinal transit rate. BMJ 1990, 300, 439–440. [Google Scholar] [CrossRef] [Green Version]
- Hawthorne, G.; Richardson, J.; Osborne, R. The Assessment of Quality of Life (AQoL) instrument: A psychometric measure of Health-Related Quality of Life. Qual. Life Res. 1999, 8, 209–224. [Google Scholar] [CrossRef]
- Mcfarlane, C.; Krishnasamy, R.; Stanton, T.; Savill, E.; Snelson, M.; Mihala, G.; Morrison, M.; Johnson, D.W.; Campbell, K.L. Diet Quality and Protein-Bound Uraemic Toxins: Investigation of Novel Risk Factors and the Role of Microbiome in Chronic Kidney Disease. J. Ren. Nutr. 2021, in press. [Google Scholar] [CrossRef] [PubMed]
- Buttigieg, P.L.; Ramette, A. A guide to statistical analysis in microbial ecology: A community-focused, living review of multivariate data analyses. FEMS Microbiol. Ecol. 2014, 90, 543–550. [Google Scholar] [CrossRef] [Green Version]
- Le Cao, K.A.; Martin, P.G.; Robert-Granie, C.; Besse, P. Sparse canonical methods for biological data integration: Application to a cross-platform study. BMC Bioinform. 2009, 10, 34. [Google Scholar] [CrossRef] [PubMed]
- Dehghani, H.H.F.; Mozaffari-Khosravi, H.; Nouri-Majelan, N.; Dehghani, A. Synbiotic Supplementations for Azotemia in Patients With Chronic Kidney Disease: A Randomized Controlled Trial. Iran J. Kidney Dis. 2016, 10, 351–357. [Google Scholar]
- Kooshki, A.; Tofighiyan, T.; Miri, M. A synbiotic supplement for inflammation and oxidative stress and lipid abnormalities in hemodialysis patients. Hemodial Int. 2019, 23, 254–260. [Google Scholar] [CrossRef] [PubMed]
- Soleimani, A.; Motamedzadeh, A.; Zarrati Mojarrad, M.; Bahmani, F.; Amirani, E.; Ostadmohammadi, V.; Tajabadi-Ebrahimi, M.; Asemi, Z. The Effects of Synbiotic Supplementation on Metabolic Status in Diabetic Patients Undergoing Hemodialysis: A Randomized, Double-Blinded, Placebo-Controlled Trial. Probiotics Antimicrob. Proteins 2019, 11, 1248–1256. [Google Scholar] [CrossRef]
- Viramontes-Horner, D.; Marquez-Sandoval, F.; Martin-del-Campo, F.; Vizmanos-Lamotte, B.; Sandoval-Rodriguez, A.; Armendariz-Borunda, J.; Garcia-Bejarano, H.; Renoirte-Lopez, K.; Garcia-Garcia, G. Effect of a symbiotic gel (Lactobacillus acidophilus + Bifidobacterium lactis + inulin) on presence and severity of gastrointestinal symptoms in hemodialysis patients. J. Ren. Nutr. 2015, 25, 284–291. [Google Scholar] [CrossRef] [PubMed]
- March, D.S.; Jones, A.W.; Bishop, N.C.; Burton, J.O. The Efficacy of Prebiotic, Probiotic, and Synbiotic Supplementation in Modulating Gut-Derived Circulatory Particles Associated With Cardiovascular Disease in Individuals Receiving Dialysis: A Systematic Review and Meta-analysis of Randomized Controlled Trials. J. Ren. Nutr. 2020, 30, 347–359. [Google Scholar] [PubMed]
- Firouzi, S.; Haghighatdoost, F. The effects of prebiotic, probiotic, and synbiotic supplementation on blood parameters of renal function: A systematic review and meta-analysis of clinical trials. Nutrition 2018, 51–52, 104–113. [Google Scholar] [CrossRef] [PubMed]
- O’Callaghan, A.; van Sinderen, D. Bifidobacteria and Their Role as Members of the Human Gut Microbiota. Front. Microbiol. 2016, 7, 925. [Google Scholar] [CrossRef] [Green Version]
- Liu, X.; Mao, B.; Gu, J.; Wu, J.; Cui, S.; Wang, G.; Zhao, J.; Zhang, H.; Chen, W. Blautia-a new functional genus with potential probiotic properties? Gut Microbes 2021, 13, 1–21. [Google Scholar] [CrossRef]
- Vital, M.; Howe, A.C.; Tiedje, J.M. Revealing the bacterial butyrate synthesis pathways by analyzing (meta)genomic data. mBio 2014, 5, e00889. [Google Scholar] [CrossRef] [PubMed] [Green Version]
- den Besten, G.; van Eunen, K.; Groen, A.K.; Venema, K.; Reijngoud, D.J.; Bakker, B.M. The role of short-chain fatty acids in the interplay between diet, gut microbiota, and host energy metabolism. J. Lipid Res. 2013, 54, 2325–2340. [Google Scholar] [CrossRef] [Green Version]
- Ramezani, A.; Massy, Z.A.; Meijers, B.; Evenepoel, P.; Vanholder, R.; Raj, D.S. Role of the Gut Microbiome in Uremia: A Potential Therapeutic Target. Am. J. Kidney Dis. 2016, 67, 483–498. [Google Scholar] [CrossRef] [PubMed] [Green Version]
- Cruz-Mora, J.; Martinez-Hernandez, N.E.; Martin del Campo-Lopez, F.; Viramontes-Horner, D.; Vizmanos-Lamotte, B.; Munoz-Valle, J.F.; Garcia-Garcia, G.; Parra-Rojas, I.; Castro-Alarcon, N. Effects of a symbiotic on gut microbiota in Mexican patients with end-stage renal disease. J. Ren. Nutr. 2014, 24, 330–335. [Google Scholar] [CrossRef]
- Guida, B.; Germano, R.; Trio, R.; Russo, D.; Memoli, B.; Grumetto, L.; Barbato, F.; Cataldi, M. Effect of short-term synbiotic treatment on plasma p-cresol levels in patients with chronic renal failure: A randomized clinical trial. Nutr. Metab. Cardiovasc. Dis. 2014, 24, 1043–1049. [Google Scholar] [CrossRef] [PubMed]
- Lang, R.M.; Badano, L.P.; Mor-Avi, V.; Afilalo, J.; Armstrong, A.; Ernande, L.; Flachskampf, F.A.; Foster, E.; Goldstein, S.A.; Kuznetsova, T.; et al. Recommendations for cardiac chamber quantification by echocardiography in adults: An update from the American Society of Echocardiography and the European Association of Cardiovascular Imaging. J. Am. Soc. Echocardiogr. 2015, 28, 1–39 e14. [Google Scholar] [CrossRef] [PubMed] [Green Version]
- Kidney Disease: Improving Global Outcomes (KDIGO) CKD Work Group. KDIGO 2012 Clinical Practice Guideline for the Evaluation and Management of Chronic Kidney Disease. Kidney Int. Suppl. 2013, 3, 1–150. [Google Scholar]
- Pretorius, C.J.; McWhinney, B.C.; Sipinkoski, B.; Johnson, L.A.; Rossi, M.; Campbell, K.L.; Ungerer, J.P. Reference ranges and biological variation of free and total serum indoxyl- and p-cresyl sulphate measured with a rapid UPLC fluorescence detection method. Clin. Chim. Acta 2013, 419, 122–126. [Google Scholar] [CrossRef] [PubMed]
- Parks, D.H.; Rigato, F.; Krause, L.; Hugenholtz, P.; Tyson, G.W.; Wood, D.L. Evaluation of the Microba Community Profiler (MCP) for Taxonomic Profiling of Metagenomic Datasets from the Human Gut Microbiome. Available online: http://insight.microba.com (accessed on 14 August 2020).


| Placebo (n = 33) | Synbiotics (n = 35) | Total (n = 68) | |
|---|---|---|---|
| Sex (male) | 22 (67%) | 23 (66%) | 45 (66%) |
| Age (years) | 69 (56–73) | 72 (66–76) | 70 (58–75) |
| Weight (kg) | 95.4 (78.6–119) | 87.2 (7.7–95.2) | 87.9 (74.0–102) |
| BMI (n = 67) | 30.3 (11.3) | 28.0 (8.9) | 29.2 (25.2–36.3) |
| Cause of chronic kidney disease: | |||
| diabetes | 5 (15%) | 10 (29%) | 15 (22%) |
| hypertension/vascular | 9 (27%) | 5 (14%) | 14 (21%) |
| glomerulonephritis | 5 (15%) | 8 (23%) | 13 (19%) |
| other | 14 (42%) | 12 (34%) | 26 (38%) |
| Comorbidities (treated): | |||
| hypertension | 27 (82%) | 25 (71%) | 52 (76%) |
| diabetes | 14 (42%) | 16 (46%) | 30 (44%) |
| hyperlipidemia | 11 (33%) | 8 (23%) | 19 (28%) |
| cardiovascular disease | 10 (30%) | 16 (46%) | 26 (28%) |
| Medications: | |||
| ACE inhibitor | 14 (42%) | 14 (40%) | 28 (41%) |
| angiotensin II receptor blocker | 15 (45%) | 14 (40%) | 29 (43%) |
| diuretic medication | 13(39%) | 15 (43%) | 28 (41%) |
| Number of antihypertensive medications | 2.4 ± 1.3 | 2.4 ± 1.7 | 2.4 ± 1.5 |
| Antibiotics | 1 (3%) | 2 (6%) | 3 (4%) |
| Echocardiographic characteristics | |||
| Global longitudinal strain (%) (n = 66) | −18.0 ± 2.7 | −17.2 ± 3.4 | −17.6 ± 3.1 |
| Left ventricular mass index (g/m2) (n = 67) | 82.9 (72.5–96.0) | 84.6 (64.0–105) | 83.1 (65.0–99.0) |
| Ejection fraction (%) (n = 66) | 61.0 (56.0–65.0) | 63.0 (58.0–68.0) | 61.5 (57.0–66.0) |
| eGFR (mL/min/1.73 m2) | 36.0 (29.0–44.0) | 31.5 (26.0–37.0) | 34.0 (27.0–41.0) |
| CKD stage 3 (n = 41) | 42.7 (36.0–47.0) | 38.5 (34.0–43.0) | 40.7 (35.0–44.0) |
| CKD stage 4 (n = 27) | 24.4 (19.0–29.0) | 23.6 (20.0–27.0) | 23.9 (19.5–28.5) |
| Creatinine (µmol/L) | 163 (131–191) | 168 (135–217) | 168 (133–198) |
| Cholesterol (mmol/L) | 4.20 (3.60–5.20) | 4.30 (3.70–4.80) | 4.30 (3.60–5.00) |
| HDL cholesterol (mmol/L) | 1.10 (0.90–1.20) | 1.10 (0.90–1.30) | 1.10 (0.90–1.30) |
| LDL cholesterol (mmol/L) | 2.40 (2.00–2.95) | 2.35 (1.85–2.75) | 2.40 (1.90–2.80) |
| Triglycerides (mmol/L) | 1.80 (1.50–2.40) | 1.70 (1.05–2.35) | 1.80 (1.10–2.40) |
| Uremic toxins (n = 65) | |||
| Total indoxyl sulfate (µmol/L) | 16.0 (9.0–26.0) | 16.5 (9.0–26.0) | 16.0 (9.0–26.0) |
| Total p-cresyl sulfate (µmol/L) | 76.0 (30.0–153) | 83.0 (37.5–115) | 82.0 (31.0–129) |
| Free indoxyl sulfate (µmol/L) | 0.80 (0.50–1.10) | 0.65 (0.50–1.15) | 0.80 (0.50–1.10) |
| Free p-cresyl sulfate (µmol/L) | 2.80 (0.80–4.70) | 2.25 (0.85–4.30) | 2.30 (0.80–4.70) |
| Blood pressure | |||
| Systolic BP (mmHg) | 137 ± 21 | 141 ± 24 | 139 ± 23 |
| Diastolic BP (mmHg) | 79 ± 9 | 77 ± 8 | 78 ± 8 |
| Dietary intake (n = 66) | |||
| Energy (kJ/day) | 7868 ± 1894 | 7281 ± 2125 | 7566 ± 2023 |
| Energy (kJ/kg) | 81 ± 26 | 90± 31 | 85 ± 29 |
| Protein (g/day) | 97 ± 27 | 85 ± 27 | 90 ± 28 |
| Protein (g/kg) | 1.0 ± 0.3 | 1.1 ± 0.5 | 1.0 ± 0.4 |
| Fiber (g/day) | 22 ± 7 | 21 ± 8 | 22 ± 8 |
| Protein/fiber ratio | 4.6 ± 1.5 | 4.4 ± 1.7 | 4.5 ± 1.6 |
| GSRS score | |||
| Mean score | 1.5 ± 0.5 | 1.5 ± 0.5 | 1.5 ± 0.5 |
| Score > 3 | 0 (0%) | 1 (3%) | 1 (1%) |
| Reflux | 1.3 ± 0.5 | 1.4 ± 0.9 | 1.3 ± 0.7 |
| Abdominal pain | 1.4 ± 0.5 | 1.6 ± 0.8 | 1.5 ± 0.7 |
| Indigestion | 1.6 ± 0.6 | 1.6 ± 0.6 | 1.6 ± 0.6 |
| Constipation | 1.7 ± 1.2 | 1.4 ± 0.8 | 1.6 ± 1.0 |
| Diarrhea | 1.2 ± 0.4 | 1.3 ± 0.6 | 1.3 ± 0.5 |
| Bristol stool score (1 to 7) | 3.6 ± 1.3 | 3.7 ± 1.2 | 3.6 ± 1.2 |
| No. of bowel motions in previous 24 h | 1.3 ± 0.6 | 1.4 ± 0.7 | 1.3 ± 0.6 |
| Patient-reported health score (AQoL-4D) | 15.0 (13.0–17.0) | 16.0 (13.0–18.0) | 16.0 (13.0–17.5) |
| Placebo (n = 28) | Change (95% CI) Placebo | Synbiotics (n = 28) | Change (95% CI) Synbiotics | p-Value a | |
|---|---|---|---|---|---|
| Dietary intake | |||||
| Energy (kJ/day) | 8476 ± 2443 | 415 (−457–1287) | 7316 ± 2086 | −51.7 (−852–749) | 0.21 |
| Protein (g/day) | 106 ± 37 | 9.11 (−4.98–23.2) | 90 ± 31 | 2.64 (−10.7–16.0) | 0.18 |
| Fiber (g/day) | 25 ± 8 | 1.14 (−1.59–3.88) | 21 ± 8 | −0.86 (−4.58–2.87) | 0.06 |
| Protein/fiber ratio | 4.4 ± 1.5 | 0.08 (−0.51–0.68) | 4.7 ± 1.7 | 0.27 (−0.60–1.15) | 0.64 |
| GSRS score | |||||
| Mean score | 1.4 ± 0.4 | −0.13 (−0.32–0.07) | 1.4 ± 0.6 | 0.01 (−0.15–0.17) | 0.93 |
| Score > 3 | 0 (0%) | 1 (4%) | |||
| Reflux | 1.3 ± 0.4 | −0.09 (−0.31–0.13) | 1.4 ± 0.8 | 0.11 (−0.24–0.45) | 0.96 |
| Abdominal | 1.3 ± 0.4 | −0.17 (−0.40–0.07) | 1.2 ± 0.4 | −0.23 (−0.45–0.00) | 0.56 |
| Indigestion | 1.6 ± 0.5 | −0.08 (−0.32–0.16) | 1.7 ± 0.9 | 0.08 (−0.16–0.32) | 0.58 |
| Constipation | 1.5 ± 0.8 | −0.27 (−0.67–0.12) | 1.4 ± 1.0 | 0.06 (−0.26–0.37) | 0.75 |
| Diarrhea | 1.2 ± 0.4 | −0.04 (−0.22–0.15) | 1.3 ± 0.5 | 0.02 (−0.20–0.24) | 0.50 |
| Bristol stool score (1 to 7) | 3.6 ± 1.4 | 0.04 (−0.57–0.64) | 4.1 ± 1.2 | 0.50 (−0.03–1.03) | 0.13 |
| Number of bowel motions in previous 24 h | 1.6 ± 0.9 | 0.29 (−0.05–0.62) | 1.8 ± 1.0 | 0.46 (0.08–0.85) | 0.70 |
| Patient-reported health score (AQoL-4D) | 16.0 (13.0–18.0) | 0.25 (−0.65–1.15) | 15.0 (13.0–18.5) | 0.54 (−0.63–1.70) | 0.83 |
| Placebo (n = 28) | Synbiotics (n = 28) | |
|---|---|---|
| Total SAE (n = 18) | 7 (39%) | 11 (61%) |
| Initial hospitalization | 7 (39%) | 10 (56%) |
| Infection, unrelated | 2 (11%) | 3 (17%) |
| Cardiovascular event, unrelated | 4 (22%) | 2 (11%) |
| Fall, unrelated | 1 (6%) | 1 (6%) |
| Surgery, unrelated | 4 (22%) | |
| Death, unrelated | 1 (6%) |
| Placebo (n = 28) | Change (95% CI) Placebo | Synbiotics (n = 28) | Change (95% CI) Synbiotics | p-Value a | |
|---|---|---|---|---|---|
| Echocardiographic characteristics | |||||
| Global longitudinal strain (%) (n = 52) | −17.2 ± 3.5 | 0.40 (−0.96–1.77) | −17.6 ± 3.2 | 0.01 (−1.28–1.31) | 0.98 |
| Left ventricular mass index (g/m2) (n = 55) | 72.6 (63.2–88.0) | −5.00 (−11.9–1.93) | 81.0 (69.0–94.4) | −6.40 (−15.9–3.11) | 0.29 |
| Ejection fraction (%) (n = 54) | 58.0 (53.5–63.0) | −2.86 (−5.82–0.11) | 60.5 (57.0–64.0) | −1.23 (−4.61–2.08) | 0.25 |
| Uremic toxins (n = 55) | |||||
| Total indoxyl sulfate (µmol/L) | 13.0 (8.0–18.5) | −3.07 (−9.14–2.99) | 12.0 (6.7–28.0) | 1.50 (−3.25–6.26) | 0.96 |
| Total p-cresyl sulfate (µmol/L) | 64.5 (24.0–135.0) | −17.2 (−49.8–15.3) | 69.0 (30.0–179.0) | 28.8 (−6.32–64.0) | 0.15 |
| Free indoxyl sulfate (µmol/L) | 0.8 (0.4–1.2) | −0.09 (−0.34–0.17) | 0.8 (0.5–1.2) | 0.10 (−0.14–0.34) | 0.25 |
| Free p-cresyl sulfate (µmol/L) | 2.6 (0.9–5.1) | −0.17 (−1.18–0.84) | 2.7 (1.4–5.8) | 0.98 (0.17–1.79) | 0.08 |
| Blood pressure | |||||
| Systolic BP (mmHg) | 142 ± 17 | 4.11 (−3.21–11.4) | 142 ± 19 | 1.79 (−6.95–10.5) | 0.89 |
| Diastolic BP (mmHg) | 81 ± 9 | 2.39 (−0.81–5.59) | 77 ± 8 | 1.18 (−2.36–4.72) | 0.16 |
| eGFR (mL/min/1.73 m2) | 38.5 (29.5–49.0) | 2.61 (−0.41–5.63) | 29.0 (20.0–36.0) | −3.14 (−6.23–−0.06) | <0.01 |
| Creatinine (µmol/L) | 149 (126–182) | −9.79 (−21.7–2.09) | 177 (156–249) | 20.8 (2.97–38.5) | <0.01 |
| Cholesterol (mmol/L) | 4.6 (3.6–5.0) | −0.07 (−0.37–0.23) | 4.1 (3.4–5.0) | −0.07 (−0.34–0.20) | 0.59 |
| HDL cholesterol (mmol/L) (n = 55) | 1.1 (0.9–1.2) | −0.02 (−0.07–0.04) | 1.1 (0.9–1.5) | 0.05 (−0.23–0.32) | 0.57 |
| LDL cholesterol (mmol/L) (n = 55) | 2.4 (1.7–2.7) | −0.26 (−0.51–−0.01) | 2.0 (1.7–2.7) | −0.09 (−0.25–0.08) | 0.84 |
| Triglycerides (mmol/L) | 1.9 (1.4–2.6) | 0.18 (−0.11–0.47) | 1.3 (0.9–2.1) | −0.03 (−0.31–0.25) | 0.14 |
Publisher’s Note: MDPI stays neutral with regard to jurisdictional claims in published maps and institutional affiliations. |
© 2021 by the authors. Licensee MDPI, Basel, Switzerland. This article is an open access article distributed under the terms and conditions of the Creative Commons Attribution (CC BY) license (https://creativecommons.org/licenses/by/4.0/).
Share and Cite
McFarlane, C.; Krishnasamy, R.; Stanton, T.; Savill, E.; Snelson, M.; Mihala, G.; Kelly, J.T.; Morrison, M.; Johnson, D.W.; Campbell, K.L. Synbiotics Easing Renal Failure by Improving Gut Microbiology II (SYNERGY II): A Feasibility Randomized Controlled Trial. Nutrients 2021, 13, 4481. https://doi.org/10.3390/nu13124481
McFarlane C, Krishnasamy R, Stanton T, Savill E, Snelson M, Mihala G, Kelly JT, Morrison M, Johnson DW, Campbell KL. Synbiotics Easing Renal Failure by Improving Gut Microbiology II (SYNERGY II): A Feasibility Randomized Controlled Trial. Nutrients. 2021; 13(12):4481. https://doi.org/10.3390/nu13124481
Chicago/Turabian StyleMcFarlane, Catherine, Rathika Krishnasamy, Tony Stanton, Emma Savill, Matthew Snelson, Gabor Mihala, Jaimon T. Kelly, Mark Morrison, David W. Johnson, and Katrina L. Campbell. 2021. "Synbiotics Easing Renal Failure by Improving Gut Microbiology II (SYNERGY II): A Feasibility Randomized Controlled Trial" Nutrients 13, no. 12: 4481. https://doi.org/10.3390/nu13124481
APA StyleMcFarlane, C., Krishnasamy, R., Stanton, T., Savill, E., Snelson, M., Mihala, G., Kelly, J. T., Morrison, M., Johnson, D. W., & Campbell, K. L. (2021). Synbiotics Easing Renal Failure by Improving Gut Microbiology II (SYNERGY II): A Feasibility Randomized Controlled Trial. Nutrients, 13(12), 4481. https://doi.org/10.3390/nu13124481